Abstract
Immune exclusion predicts poor patient outcomes in multiple malignancies, including triple-negative breast cancer (TNBC)1. The extracellular matrix (ECM) contributes to immune exclusion2. However, strategies to reduce ECM abundance are largely ineffective or generate undesired outcomes3,4. Here we show that discoidin domain receptor 1 (DDR1), a collagen receptor with tyrosine kinase activity5, instigates immune exclusion by promoting collagen fibre alignment. Ablation of Ddr1 in tumours promotes the intratumoral penetration of T cells and obliterates tumour growth in mouse models of TNBC. Supporting this finding, in human TNBC the expression of DDR1 negatively correlates with the intratumoral abundance of anti-tumour T cells. The DDR1 extracellular domain (DDR1-ECD), but not its intracellular kinase domain, is required for immune exclusion. Membrane-untethered DDR1-ECD is sufficient to rescue the growth of Ddr1-knockout tumours in immunocompetent hosts. Mechanistically, the binding of DDR1-ECD to collagen enforces aligned collagen fibres and obstructs immune infiltration. ECD-neutralizing antibodies disrupt collagen fibre alignment, mitigate immune exclusion and inhibit tumour growth in immunocompetent hosts. Together, our findings identify a mechanism for immune exclusion and suggest an immunotherapeutic target for increasing immune accessibility through reconfiguration of the tumour ECM.
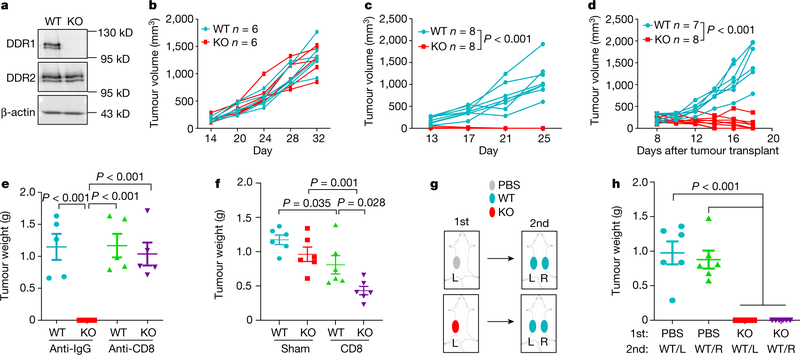
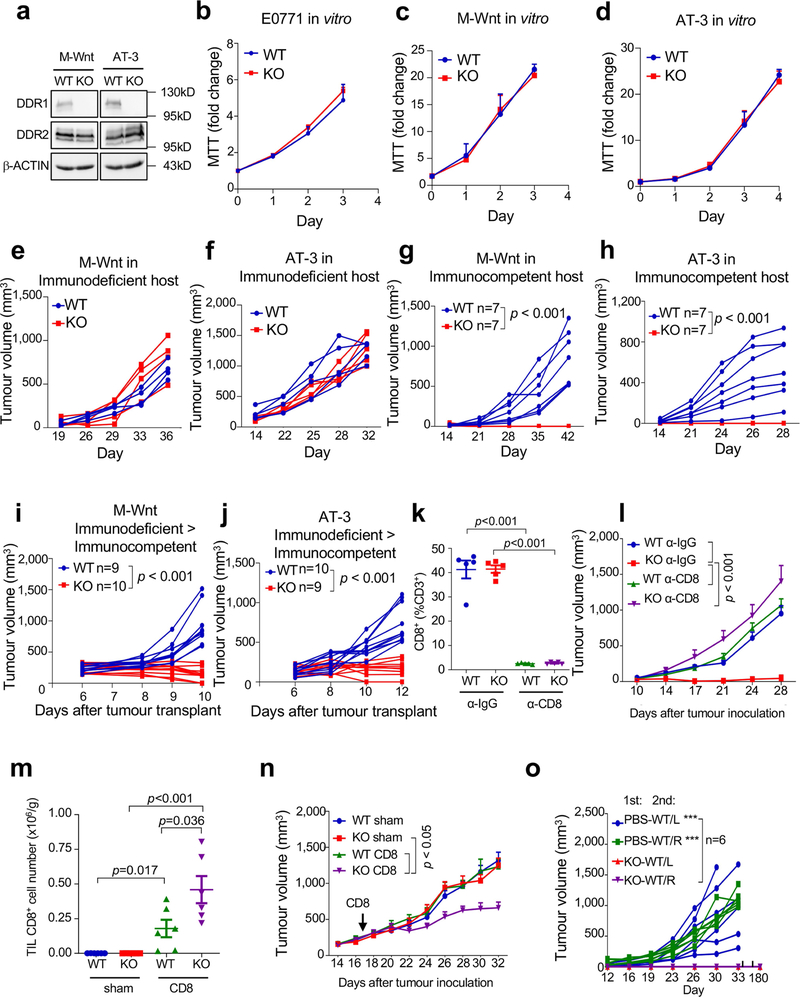
How tumours exclude immune infiltrates to avoid immune destruction is an important yet poorly understood question. Increased expression of DDR1 correlates with cancer progression including breast cancer6. DDR1 promotes tumour progression and metastases through incompletely understood mechanisms7,8. We deleted Ddr1 in three mouse models of TNBC (E0771, M-Wnt and AT-3), without affecting the related collagen receptor DDR2 (Fig. 1a, Extended Data Fig. 1a, Supplementary Figs. 1, 2). Knockout (KO) of Ddr1 did not impair cell proliferation in vitro (Extended Data Fig. 1b–d) or tumour growth in immunodeficient hosts (Fig. 1b, Extended Data Fig. 1e, f). By contrast, Ddr1-KO tumours did not grow in immunocompetent hosts (Fig. 1c, Extended Data Fig. 1g, h) or after re-transplantation from immunodeficient to immunocompetent mice (Fig. 1d, Extended Data Fig. 1i, j). After depletion of CD8+ cells (Extended Data Fig. 1k), Ddr1-KO tumours grew as robustly as control wild-type (Ddr1-WT, integrated with a non-targeting CRISPR–Cas9 vector) tumours (Fig. 1e, Extended Data Fig. 1l). Transfer of CD8+ T cells into tumour-bearing immunodeficient mice generated more abundant tumour-infiltrating lymphocytes (TILs) in Ddr1-KO tumours compared to wild-type counterparts (Extended Data Fig. 1m). Furthermore, mice with transferred CD8+ T cells had significantly smaller Ddr1-KO tumours than Ddr1-WT tumours (Fig. 1f, Extended Data Fig. 1n). Ddr1-WT tumour cells injected into immunocompetent mice that were previously challenged with Ddr1-KO tumour cells, in the same or contralateral mammary gland, did not grow over six months of observation (Fig. 1g, h, Extended Data Fig. 1o), suggesting that Ddr1-KO tumour cells can vaccinate hosts against Ddr1-WT tumours. Collectively, these results suggest that DDR1 deters host anti-tumour immunity.
Fig. 1 |. DDR1 promotes mammary tumour growth in immunocompetent hosts.
a, DDR1, DDR2 and β-actin immunoblots in E0771 cells. Images are representatives of at least three independent experiments. b, E0771 tumour growth in Rag1−/− immunodeficient hosts (n = 6 tumours per group). c, E0771 tumour growth in immunocompetent C57BL/6 mice (n = 8 tumours per group). d, E0771 tumours (WT, n = 7 tumours; KO, n = 8 tumours) transplanted from Rag1−/− to C57BL/6 mice. e, E0771 tumour weight in C57BL/6 hosts with prior treatment with anti-IgG or anti-CD8 antibody (n = 5 tumours per group). f, Tumour weight after CD8+ T cell or sham (medium) transfer to Rag1−/− (n = 6 tumours per group) mice challenged with E0771 tumours. g, Diagram for tumour rechallenge. First challenge with PBS or E0771 Ddr1-KO cells on one side of inguinal mammary gland (1st), and second challenge after 30 days with E0771 Ddr1-WT tumour cells on both sides of mammary gland (2nd). L, left; R, right. h, Tumour weight from rechallenged mice (n = 6 tumours per group). Values represent mean ± s.e.m. P values and n numbers as indicated; two-tailed Student’s t-test for all tests except for tumour volumes (two-way ANOVA).
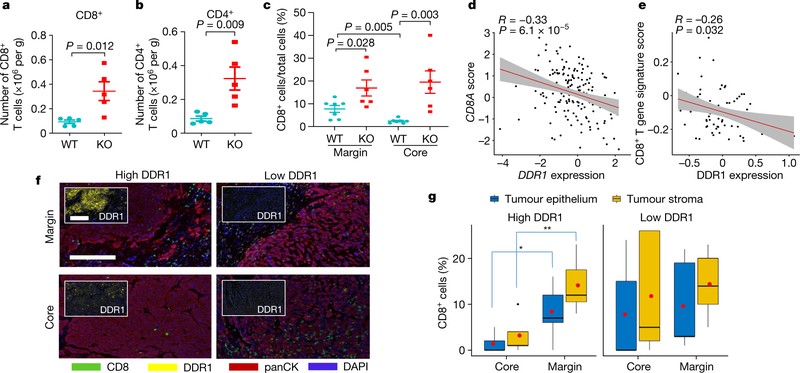
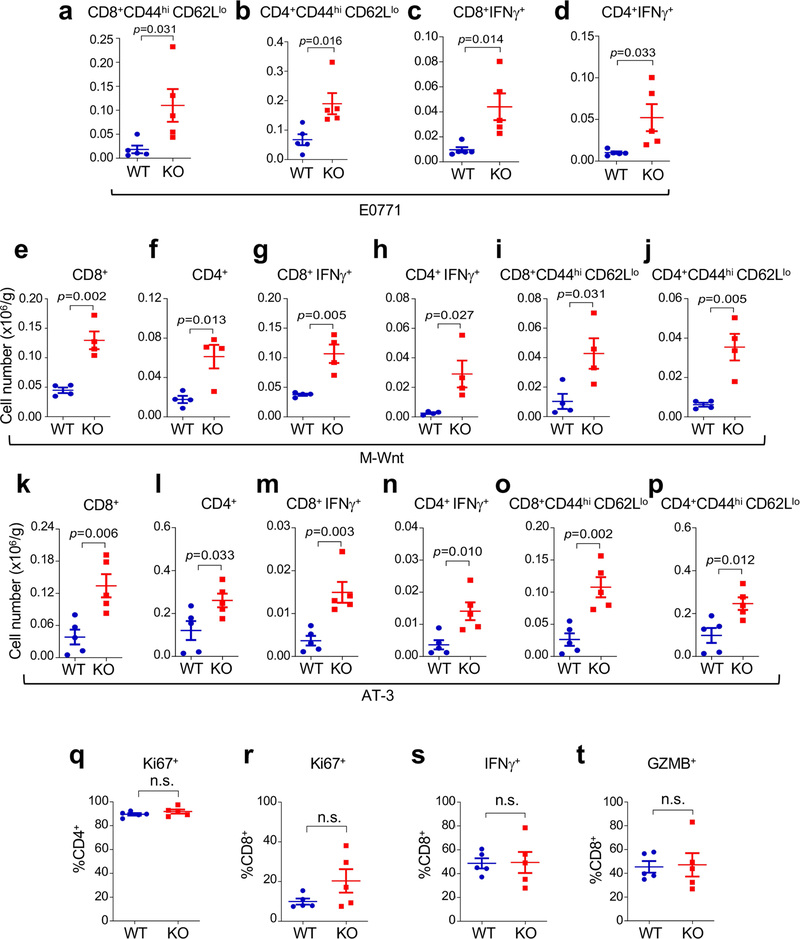
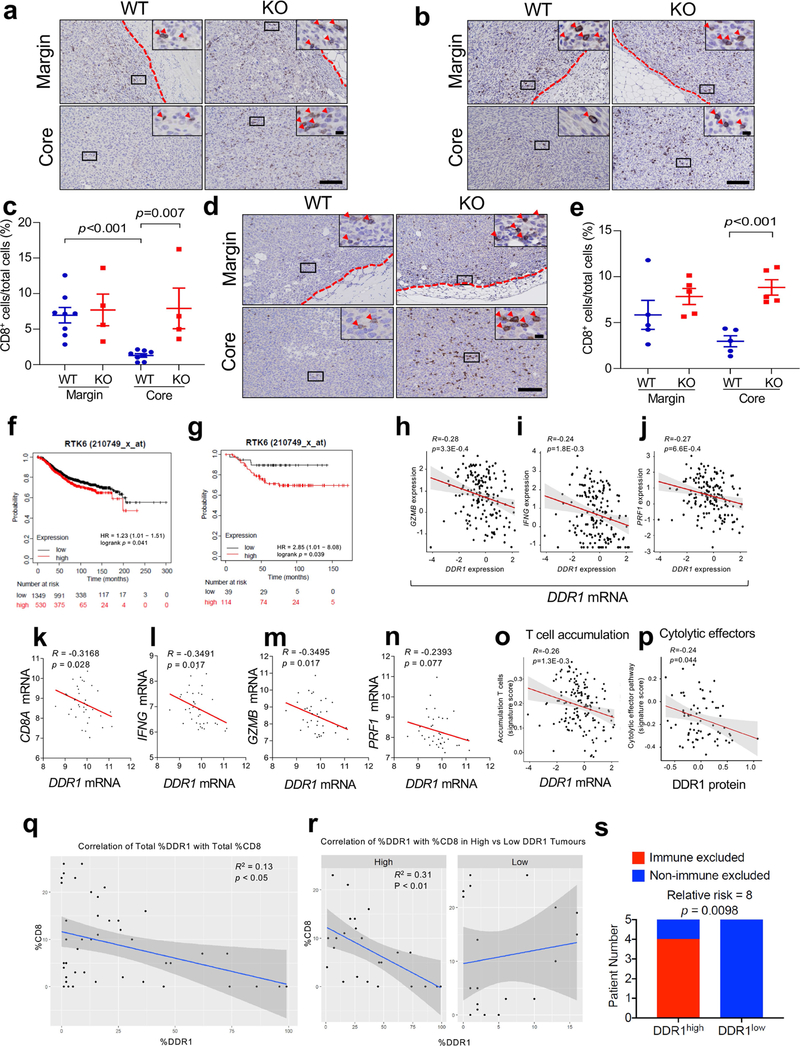
After re-transplantation from immunodeficient hosts but before Ddr1-KO tumour regression in immunocompetent hosts, tumour-infiltrating total CD8+ and CD4+ T cells (normalized for tumour weight), and interferon-γ (IFNγ)-producing and activated (CD44hiCD62Llo) CD8+ and CD4+ T cells, were more abundant in Ddr1-KO than in wild-type control tumours (Fig. 2a, b, Extended Data Fig. 2a–p, Supplementary Fig. 3). However, when normalized to corresponding total T cell numbers, Ddr1-KO and Ddr1-WT tumours exhibited no significant difference in the prevalence of CD4+ or CD8+ T cells positive for Ki67, IFNγ or granzyme B (Extended Data Fig. 2q–t), suggesting that DDR1 impedes T cell infiltration rather than influencing their proliferation or cytotoxic functions. CD8+ T cells were largely restricted to the control Ddr1-WT tumour margin, consistent with a similar observation in parental E0771 tumours9, but Ddr1-KO tumours exhibited an increased abundance of CD8+ T cells in the tumour core (Fig. 2c, Extended Data Fig. 3a–e), further supporting the role of DDR1 in restricting T cell accessibility.
Fig. 2 |. DDR1 inhibits the infiltration of anti-tumour immune cells.
a, b, Abundance of CD8+ (a) and CD4+ (b) T cells normalized by E0771 tumour weight per gram (WT, n = 5 tumours; KO, n = 5 tumours). c, Quantification of CD8+ T cells by IHC in E0771 tumour margin and core (WT, n = 7 tumours; KO, n = 6 tumours). The y axis is the percentage of CD8+ cells over total cells in a given field. d, Scatter plots showing the negative gene expression (z-score) correlation between DDR1 mRNA levels and CD8A. Spearman’s correlation coefficients and P values are shown. e, Scatter plots showing the negative expression correlation between the expression of DDR1 protein and CD8+ T gene signature scores in CPTAC BRCA (see ‘Bioinformatics analysis’ in Methods). f, Multiplex immunofluorescent staining of DDR1, CD8 and tumour-specific panCK using DDR1high (n = 7) and DDR1low (n = 5) TNBC tumour samples. Scale bar, 200 μm. g, Quantification of CD8+ cells in tumour core and margin of DDR1high and DDR1low samples from f. CD8+ cell populations were divided into those contained within tumour epithelium and stromal compartments. The CD8+ cell percentage was CD8+ cell number over total cell number in a given field per slide. The bounds of the box represent the 25th and 75th percentiles of the interquartile range. The black line in the box interior represents the median of the data. The red dot represents the mean of the data. The whiskers represent the minimum and maximum values of the data and the black dot outside the box and whiskers represents an outlier. *P < 0.05, **P < 0.01. Values represent mean ± s.e.m.; two-tailed Student’s t-test.
High levels of DDR1 mRNA are associated with shorter overall survival in all patients with breast cancer and in patients with TNBC (Extended Data Fig. 3f, g). Levels of DDR1 mRNA and DDR1 protein negatively correlate with genes that define anti-tumour immunity, a gene expression signature for intratumoral T cell accumulation10, CD8+ T cell signature scores, and the cytolytic effector pathway11 (Fig. 2d, e, Extended Data Fig. 3h–p). Using treatment-naive TNBC samples, we found that the abundance of DDR1-positive tumour cells negatively correlated with intratumoral CD8+ T cells (Extended Data Fig. 3q), which was significant only among DDR1high tumours, and not among DDR1low tumours (Extended Data Fig. 3r). TILs inside the tumour boundary can be classified into those that directly contact the tumour epithelium and those that are separated from the tumour epithelium by intervening stroma. DDR1high tumours had a lower abundance of CD8+ T cells in the tumour core versus the tumour margin, regardless of their localization in tumour epithelium versus stroma (Fig. 2f, g). By contrast, DDR1low tumours did not show any appreciable difference in the abundance of CD8+ T cells between tumour core and tumour margin (Fig. 2f, g). When this cohort was stratified by relative CD8+ T cell density in core and margin, all tumours with the immune-excluded phenotype were DDR1high, whereas the majority of non-immune-excluded tumours were DDR1low (Extended Data Fig. 3s). Together, these clinical data support our preclinical finding that DDR1 excludes anti-tumour immune cells.
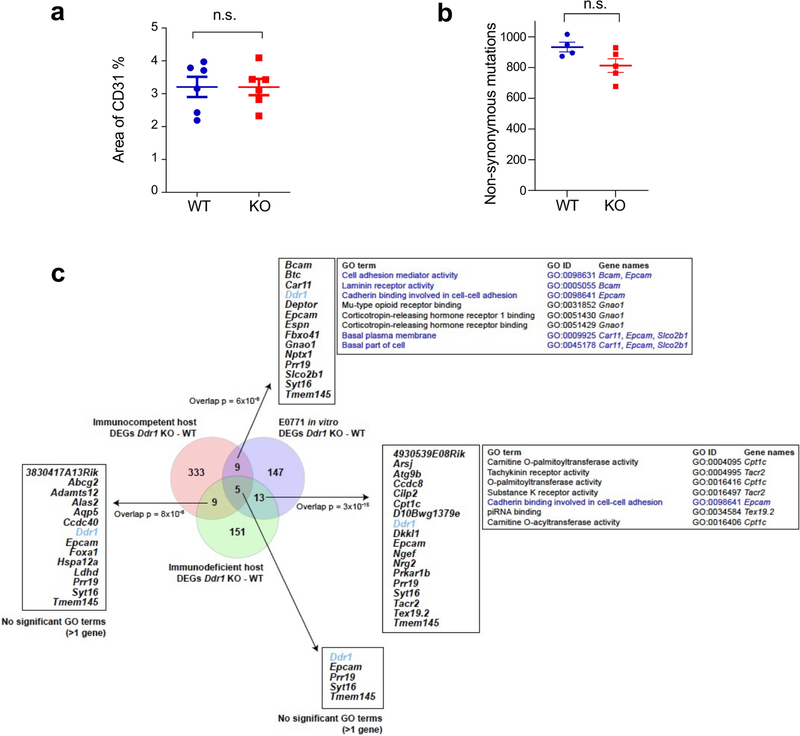
Immune infiltration includes extravasation through blood vessels, tumour-induced chemotaxis and traversing through the ECM. No significant immune-vascular changes were found between Ddr1-WT and Ddr1-KO tumours (Extended Data Fig. 4a). Transcriptomic profiling of Ddr1-WT and Ddr1-KO tumours before divergent growth in immunocompetent hosts (day 4) did not show significant associations with gene sets corresponding to chemokines, antigen processing and presentation, or co-stimulation (Supplementary Fig. 4a–c), nor was there any indication that depletion of DDR1 had an effect on tumour neoantigen content (Extended Data Fig. 4b). We also compared the transcriptomes of Ddr1-WT and Ddr1-KO tumours in immunocompetent versus immunodeficient hosts and in-vitro-cultured tumour cells. Joint data normalization and principal component analysis (PCA) clearly segregated the three settings (Supplementary Fig. 5a) by Ddr1-KO or Ddr1-WT status, except for two segregated Ddr1-KO tumours in immunocompetent hosts and one in vitro (Supplementary Fig. 5b). The most frequent gene ontology (GO) term linked to variability among immunocompetent and immunodeficient settings, and less so in vitro, was ‘development’ (Supplementary Table 1). Next, examination of differentially expressed genes (DEGs) between Ddr1-WT and Ddr1-KO samples in each setting (Supplementary Fig. 6, Supplementary Table 2) revealed few pairwise overlapping genes, although the overlaps were found to be larger than randomly expected (Extended Data Fig. 4c), consistent with the driving effect of DDR1 depletion. Overlapping genes were not linked to the immune system, but included those in cell–cell adhesion (Extended Data Fig. 4c). Furthermore, DEGs in immunocompetent hosts were more frequently overexpressed versus the other two settings (Supplementary Fig. 7a), and showed significant overrepresentation in terms linked to development and morphogenesis (Supplementary Fig. 7b). These findings led us to assess DDR1-depletion-driven alterations in tumour stromal cell contents. Ddr1-KO tumours in immunocompetent hosts might be enriched in endothelial cells while depleted in mast cells versus Ddr1-WT tumours, as inferred by a single algorithm, but no other changes were indicated by several analyses (Supplementary Table 3). Collectively, the transcriptomic alterations from DDR1 depletion appear reminiscent of its role in mammary ductal morphogenesis12,13, but do not provide obvious mechanistic insight into the DDR1-dependent immune exclusion.
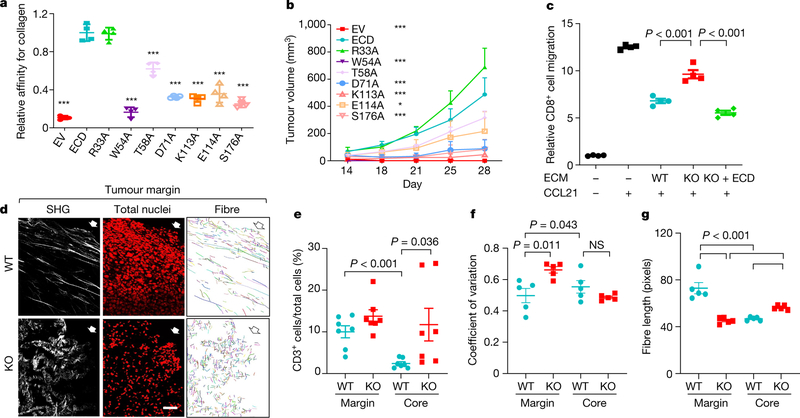
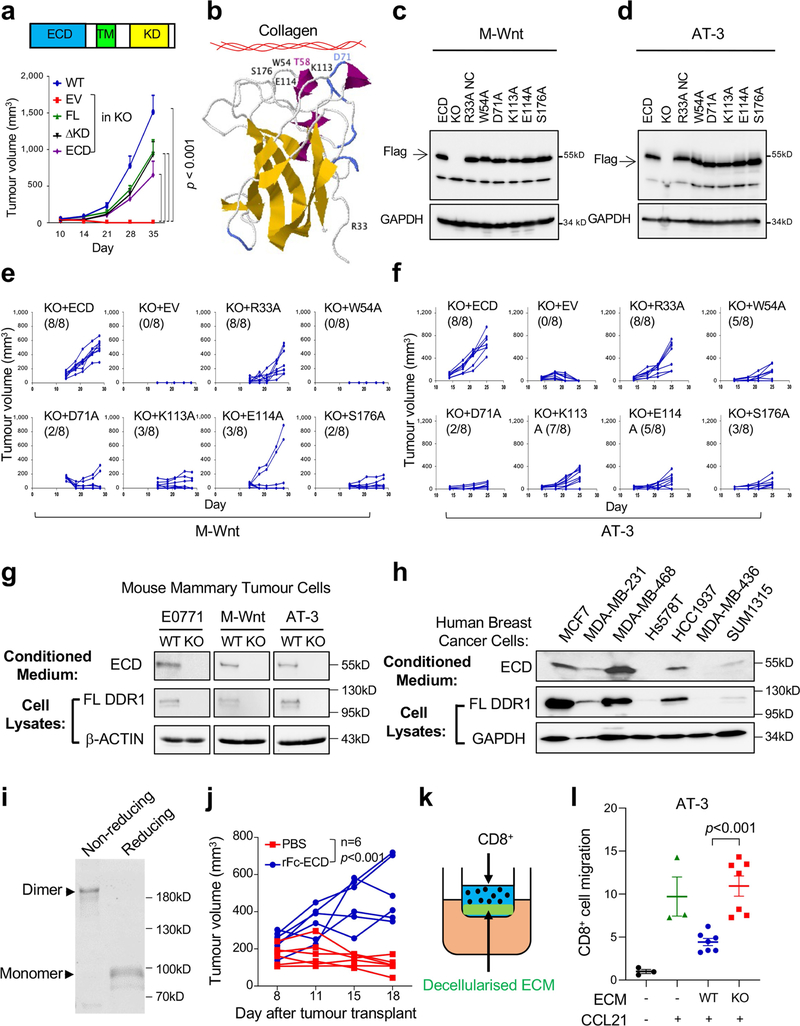
For further mechanistic insight, we performed functional rescue by ectopically expressing DDR1 mutants in Ddr1-KO tumour cells. Full-length DDR1 is present on cell membranes by means of its transmembrane domain (Extended Data Fig. 5a). Collagen binding through DDR1-ECD stimulates the tyrosine kinase activity that is found in its intracellular kinase domain, which then triggers downstream signal transduction events5. Membrane-bound DDR1 also participates in breast cancer metastasis through a kinase-independent mechanism8. We observed that the deficiency in the growth of Ddr1-KO tumours in immunocompetent hosts was similarly rescued by full-length DDR1 and by a mutant version of DDR1 in which the kinase domain was deleted (ΔKD; Extended Data Fig. 5a). Notably, DDR1-ECD, which lacks both the transmembrane and the kinase domain, was sufficient to support Ddr1-KO tumour growth (Extended Data Fig. 5a). On the basis of the human DDR1-ECD crystal structure14, we mutated amino acid residues in mouse DDR1-ECD within or distal to the collagen-binding pocket (Extended Data Fig. 5b). Whereas mutants that retained collagen binding rescued Ddr1-KO tumour growth, those defective in collagen binding exhibited a significantly reduced tumour-promoting ability (Fig. 3a, b, Extended Data Fig. 5c–f, Supplementary Figs. 8, 9). Together, these data show that DDR1 collagen binding—but not its kinase activity—is required for tumour growth in immunocompetent hosts.
Fig. 3 |. DDR1-dependent ECM remodelling inhibits anti-tumour immune infiltration.
a, ELISA of collagen binding of wild-type and mutant DDR1-ECD from E0771 Ddr1-KO cells (n = 4 technical repeats). Three biological repeats. All P values were compared to the wild-type ECD. ***P < 0.001. EV, empty vector. b, Growth of E0771 Ddr1-KO tumour cells with empty vector, ECD WT or point mutants (KO + EV, n = 8 tumours; KO + WT ECD, n = 10 tumours; KO + mutant ECD, n = 6 tumours). All P values were compared to the wild-type ECD group. *P < 0.05, ***P < 0.001. c, Decellularized ECM from E0771 tumour cells inhibits T cell migration. Value of migrated CD8+ T cell number without ECM and CCL12 is set at ‘1’ (n = 4 technical repeats). Three biological repeats. d, E0771 tumours transplanted from Rag1−/− to C57BL/6 hosts were analysed by SHG, To-pro-3 staining for all nuclei, and collagen fibre individualization. Block arrows indicate tumour margins. Scale bar, 50 μm. e, Quantification of CD3+ T cells by IHC (WT, n = 7 tumours; KO, n = 7 tumours). f, g, Tumour fibre alignment (f) and fibre length (g) by the CT-Fire software (n = 5 tumours per group). Values represent mean ± s.e.m. P values as indicated; NS, not significant; two-tailed Student’s t-test for all tests except for tumour volumes (two-way ANOVA).
DDR1-expressing cells shed DDR1-ECD15, but the biological consequence is unclear. DDR1-ECD, especially in its multimeric form, effectively remodels collagen fibre16. We detected ECD in medium conditioned with mouse and human breast cancer cells (Extended Data Fig. 5g, h, Supplementary Figs. 10, 11). Notably, intratumoral injection of dimerized recombinant DDR1-ECD (Fc-ECD) into immunocompetent hosts bearing Ddr1-KO tumours rescued tumour growth (Extended Data Fig. 5i, j, Supplementary Fig. 12). Furthermore, decellularized ECM from Ddr1-WT tumour cells was more potent compared to that from Ddr1-KO tumour cells in deterring T cell migration in vitro (Fig. 3c, Extended Data Fig. 5k, l). Ectopic DDR1-ECD in knockout cells restored the T-cell-impeding effects (Fig. 3c), indicating that cell-free ECM configured by DDR1-ECD is sufficient to obstruct T cell motility.
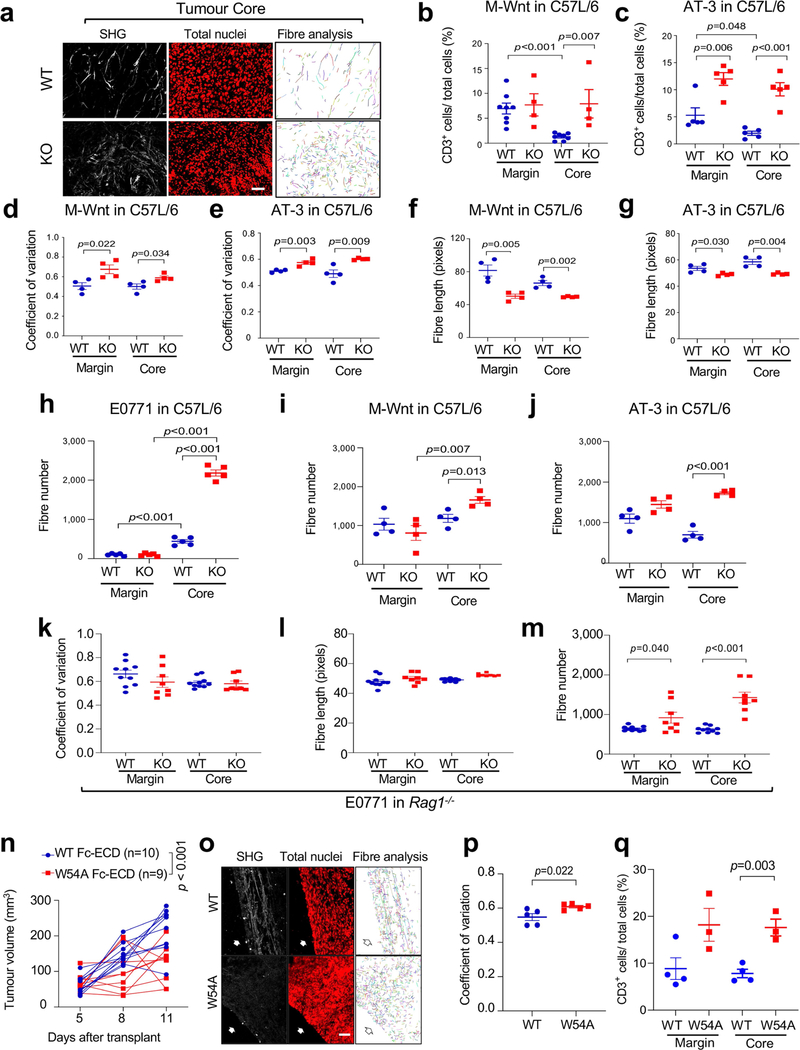
Second harmonic generation (SHG) found that Ddr1-WT tumours were associated with long and aligned collagen fibres at the tumour margin (Fig. 3d, Extended Data Fig. 6a). As expected, CD3+ T cells from the same wild-type tumours were limited to the tumour margin (Fig. 3e, Extended Data Fig. 6b, c). By contrast, immune cells were readily detectable at Ddr1-KO tumour margins and cores (Fig. 3e, Extended Data Fig. 6b, c). As a parameter of fibre alignment, the coefficient of variation of the angle at the tumour margin was larger for Ddr1-KO tumours than for Ddr1-WT controls (Fig. 3f, Extended Data Fig. 6d, e). Collagen fibre length at the Ddr1-KO tumour margin was substantially shorter relative to Ddr1-WT counterparts (Fig. 3g, Extended Data Fig. 6f, g). Notably, fibre numbers were markedly increased in Ddr1-KO tumour cores versus wild-type counterparts (Extended Data Fig. 6h–j), which is likely to reflect a compensatory tumour response as previously reported in Ddr1-KO mouse models12,13,17. Ddr1-WT and Ddr1-KO tumours from immunodeficient hosts did not exhibit collagen fibre alignment or length changes (Extended Data Fig. 6k–m), suggesting tumour–immune cross-talk. Intratumoral injection of recombinant wild-type Fc-ECD, but not a collagen-binding-defective mutant (W54A), enhanced collagen fibre alignment and dampened immune infiltration in Ddr1-KO tumours (Extended Data Fig. 6n–q). Collectively, our data strongly suggest that DDR1-ECD shapes high-order collagen configuration.
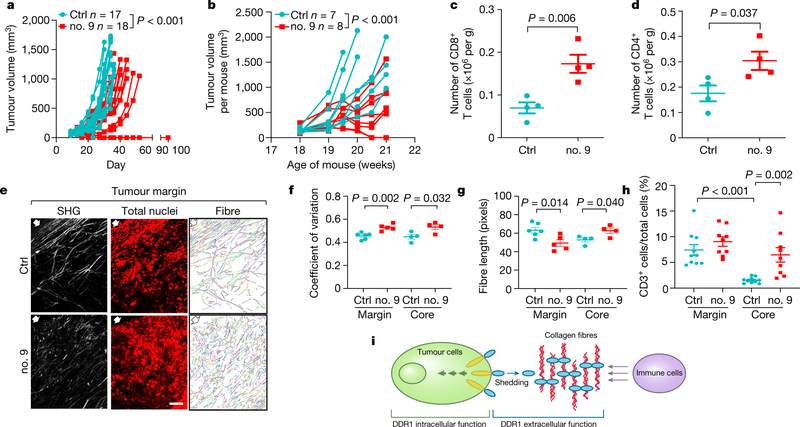
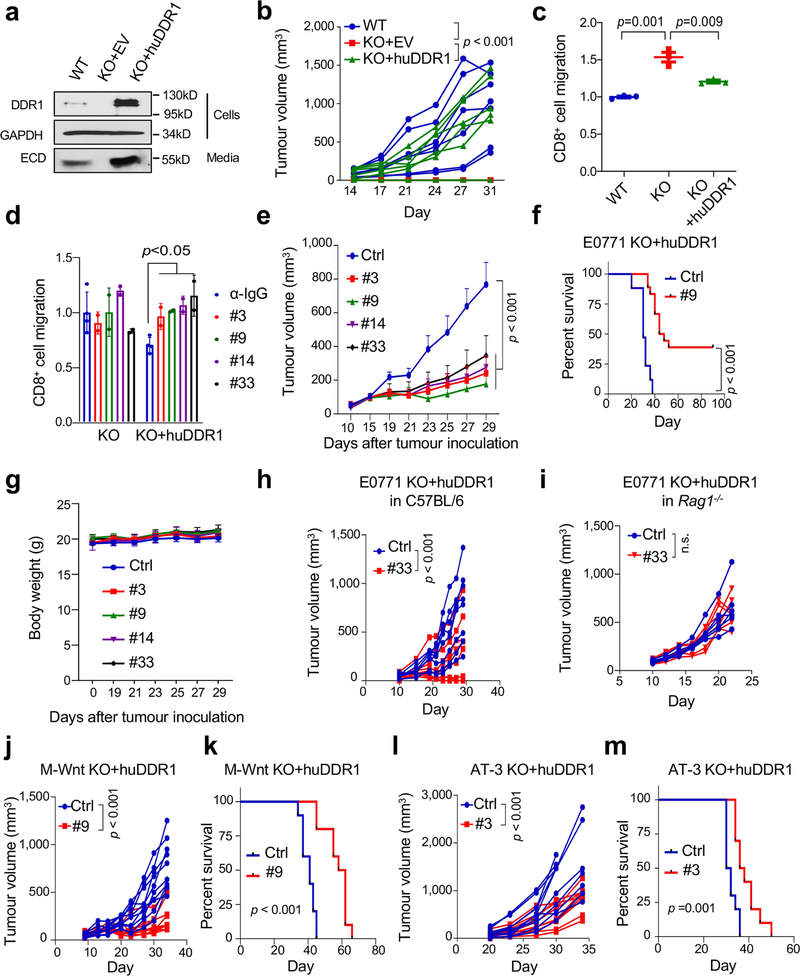
Current small-molecule DDR1 inhibitors target its kinase domain. To neutralize the kinase-independent ECD activity in immune exclusion, we generated monoclonal antibody clones that target the ECD of human DDR1 (huDDR1). To screen neutralizing antibodies, we expressed huDDR1 in Ddr1-KO tumour cells, which rescued tumour growth in immunocompetent hosts and the inhibition of T cell migration in vitro (Extended Data Fig. 7a–c, Supplementary Fig. 13). We then screened anti-DDR1 antibody clones on the basis of their neutralization of T cell migration inhibition (Extended Data Fig. 7d). Intratumoral injection of four neutralizing antibodies (clones 3, 9, 14 and 33) significantly inhibited huDDR1-rescued Ddr1-KO tumour growth (Fig. 4a, Extended Data Fig. 7e) and prolonged host survival versus isotype control (Extended Data Fig. 7f), without affecting host body weight (Extended Data Fig. 7g). Notably, 7 out of 18 anti-DDR1-antibody-treated tumours completely regressed, versus none in isotype-treated controls (Fig. 4a). Administration of antibodies in immunodeficient hosts did not appreciably inhibit tumour growth (Extended Data Fig. 7h, i), suggesting that the antibody primarily neutralizes the immune-excluding function of DDR1. The effects of anti-DDR1 antibody on tumour growth were validated in M-Wnt and AT-3 tumour models (Extended Data Fig.7j–m).
Fig. 4 |. DDR1 as a therapeutic target for tumour immunotherapy.
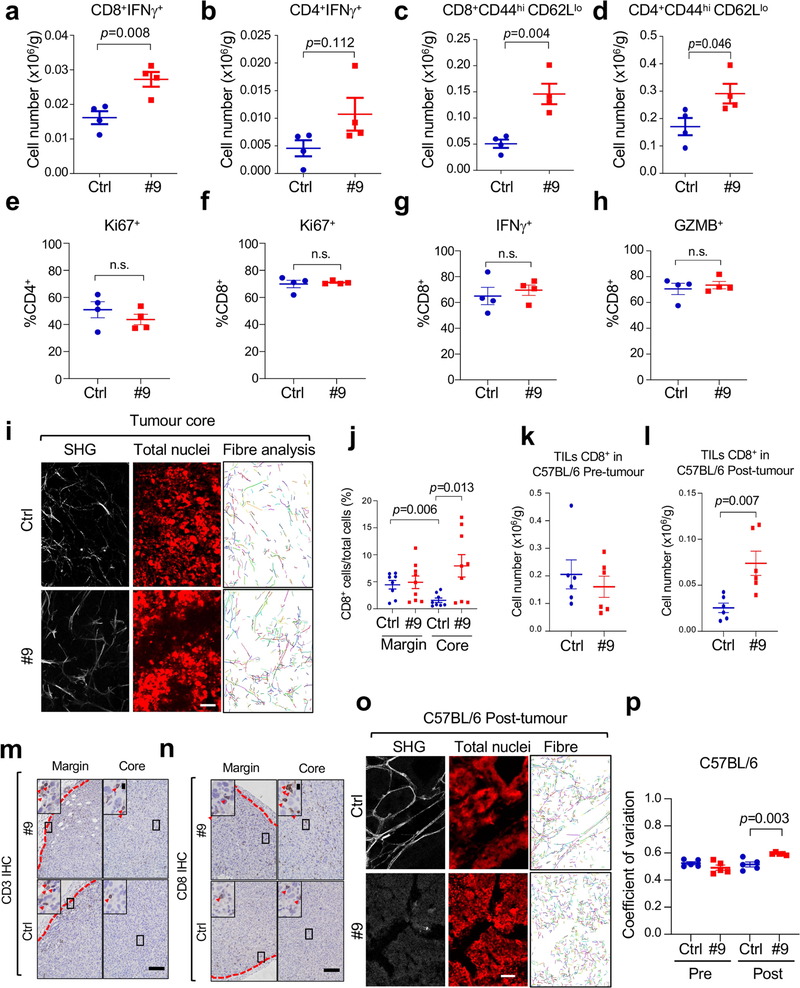
a, Growth of E0771 Ddr1-KO tumour cells with huDDR1 in C57BL/6 hosts treated intratumorally with isotype IgG (control (ctrl); n = 17 tumours) or with anti-DDR1 antibody clone 9 (no. 9; n = 18 tumours). b, MMTV-PyMT spontaneous mammary tumour growth (accumulative tumour volume per mouse, C57BL/6), treated intraperitoneally in a ‘post-tumour’ scheme with control (n = 7 mice) or anti-DDR1 clone 9 antibody (n = 8 mice). c, d, CD8+ (c) and CD4+ (d) TILs from E07771 huDDR1-expressing Ddr1-KO tumours in b, normalized by per-gram tumour (n = 4 tumours per group). e, Antibody-treated E0771 tumours analysed by SHG, To-pro-3 staining, and collagen fibre individualization. Block arrows indicate tumour margins. Scale bar, 50 μm. f, g, Fibre alignment (f) and fibre length (g) (margin ctrl, n = 6 tumours; margin no. 9, n = 5 tumours; core ctrl, n = 4 tumours; core no. 9, n = 4 tumours). h, CD3+ T cells in antibody-treated KO + huDDR1 E0771 tumours (ctrl, n = 10 tumours; no. 9, n = 9 tumours). i, DDR1-ECD (blue oval)-remodelled collagen fibres (red curvy lines) forming an immune-excluding barrier. The intracellular region of DDR1 (yellow ovals) triggers downstream signal transduction. Values represent mean ± s.e.m. P values as indicated; two-tailed Student’s t-test for all tests except for tumour volumes (two-way ANOVA).
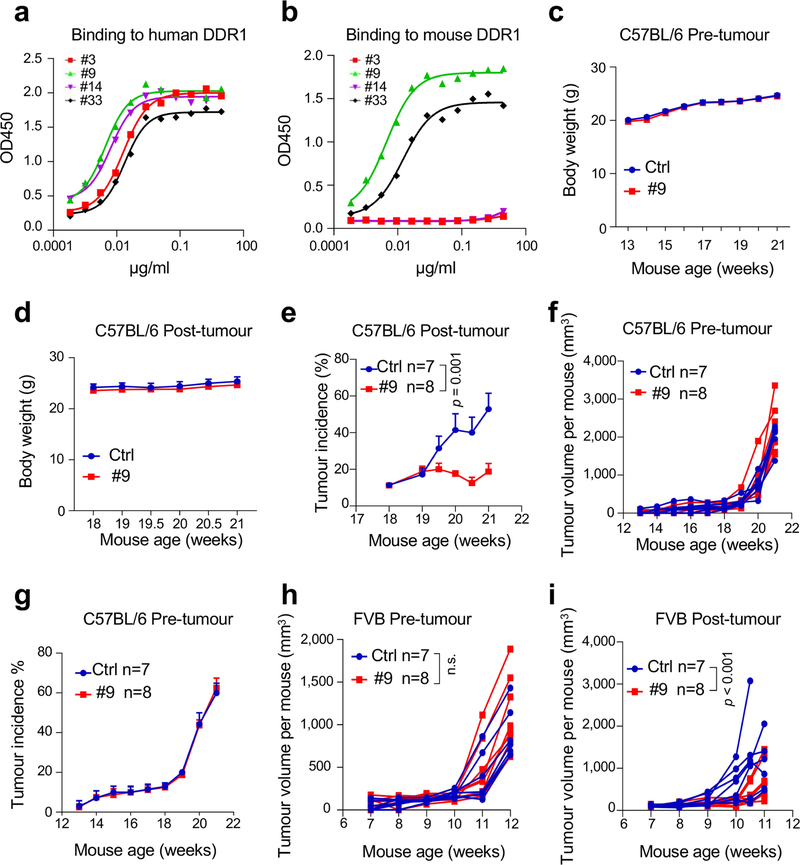
Studies of spontaneous tumour models suggest that the function of DDR1 is stage- and/or context-dependent. For example, whereas knockout of Ddr1 in lung and pancreatic cancer models attenuates tumorigenesis17,18, Ddr1 knockout in MMTV-PyMT mice promotes spontaneous mammary tumours13. To assess the effect of anti-DDR1 antibodies on mammary tumorigenesis at various stages, we intraperitoneally injected anti-DDR1 antibody or isotype control into MMTV-PyMT mice (C57BL/6) for two weeks either (1) before palpable tumours (‘pre-tumour’); or (2) at an average tumour size of 100 mm3 (‘post-tumour’). Antibody clone 9 was used on the basis of its high affinity for mouse and human DDR1-ECD (Extended Data Fig. 8a, b). Antibody treatment did not affect host body weight (Extended Data Fig. 8c, d). However, it significantly reduced tumour size and incidence in post-tumour cohorts (Fig. 4b, Extended Data Fig. 8e), but not in pre-tumour cohorts (Extended Data Fig. 8f, g). Notably, two of eight post-tumour antibody-treated mice showed complete tumour regression (Fig. 4b). Similar observations were made in MMTV-PyMT mice on the FVB background (Extended Data Fig. 8h, i). Together, these experiments provide proof-of-principle for anti-DDR1 antibody as an anti-cancer therapeutic.
Treatment with anti-DDR1 antibody increased total numbers (Fig. 4c, d), IFNγ-producing (Extended Data Fig. 9a, b) and activated (CD44hiCD62Llo) tumour-infiltrating CD8+ and CD4+ T cells (Extended Data Fig. 9c, d), without affecting the prevalence of CD4+ or CD8+ T cells expressing Ki67, IFNγ or granzyme B among all CD3+ T cells (Extended Data Fig. 9e–h). Akin to our findings with Ddr1-KO, antibody treatment effected transcriptomic changes linked to epithelial development but not to immune cell activation (Supplementary Fig. 14). Antibody treatment led to less-aligned, shorter collagen fibres in the tumour margin, and enhanced immune cell infiltration (Fig. 4e–h, Extended Data Fig. 9i–n). The same effects of antibody treatment were observed in the post-tumour—but not in the pre-tumour—cohort of spontaneous mammary tumours (Extended Data Fig. 9o, p), suggesting that DDR1 has a differential role during tumour progression versus tumour initiation.
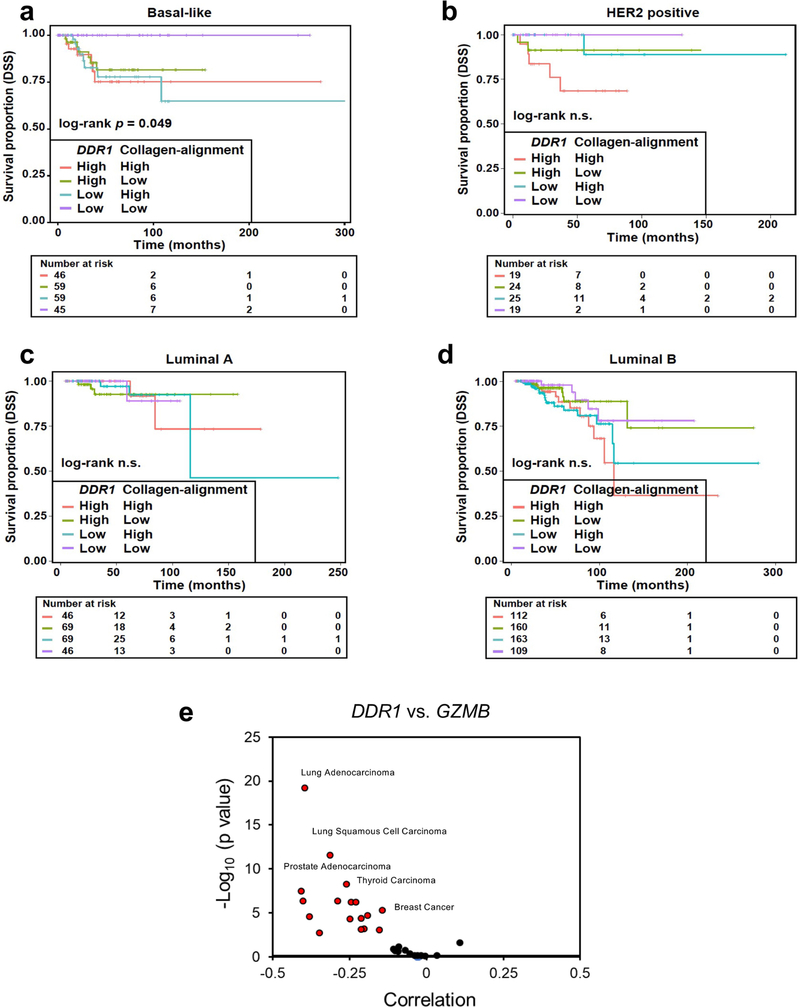
Given the pro- and anti-tumorigenic roles of the ECM, in boosting anti-tumour immunity3,4. In addition to the tumour ECM density, its alignment also plays a key role in controlling immune cell migration19–21. Furthermore, a collagen-alignment signature could be a prognostic factor for the survival of patients with breast cancer22. We show here that DDR1 instigates the alignment of collagen fibres, rather than the abundance of collagen per se, thus enforcing the defences of tumours against immune infiltration. Notably, the combination of low expression of DDR1 and a low collagen-alignment signature in basal-like breast cancer predicts better survival than does either parameter alone (Extended Data Fig. 10a–d). Further work is needed to discern the molecular nature of the high-order structure of collagen that is shaped by DDR1 and other as-yet-unidentified instigators. DDR1-dependent ECM organization could be further aided by immune cells and cancer-associated fibroblasts.
Our study uncovers a role of membrane-untethered DDR1-ECD in instigating a collagen-fibre-based mechanism of tumour defence against anti-tumour immunity (Fig. 4i). The role of DDR1-ECD in sculpting the ECM can be uncoupled from known functions of DDR1 in intracellular signal transduction. Compared to membrane-anchored DDR1, untethered and presumably diffusible DDR1-ECD could instigate a tumour defence distal to tumour cells. Both membrane-bound and untethered DDR1 molecules are likely to contribute to cancer development and progression in a stage- and/or context-dependent manner.
αPD-1 and αPD-L1 immunotherapy in combination with chemotherapy has been clinically approved for TNBC treatment, yet is effective in only a fraction of patients with TNBC. Our study will inform the development of new stand-alone therapeutic agents that target ECM remodelling. Agents that benefit from augmented tumour infiltration could be improved by combinations of anti-DDR1 antibodies and thus merit further investigation. DDR1 mRNA levels are aberrantly increased and negatively correlate with cytotoxic immune markers in multiple cancer types in addition to breast cancer (Extended Data Fig. 10e). We predict that anti-DDR1 antibody could serve as an alternative anti-cancer immunotherapy for a variety of cancer types.
Online content
Any methods, additional references, Nature Research reporting summaries, source data, extended data, supplementary information, acknowledgements, peer review information; details of author contributions and competing interests; and statements of data and code availability are available at https://doi.org/10.1038/s41586-021-04057-2.
Methods
CRISPR knockout and construction of DDR1 expression plasmids
DDR1 was knocked out in mouse mammary tumour cell lines E0771 (CH3 Biosystems, 940001), M-Wnt23 (a gift from S. Hursting) and AT-3 (a gift from S. Abrams) by using DDR1 sgRNA CRISPR/Cas9 All-in-One Lentivector set (abm, 177841140595) following the manufacturer’s instructions. A CRISPR–Cas9 vector with non-targeting sgRNA (abm, K010) was used to establish the corresponding control Ddr1-WT tumour cells. In brief, lentivirus packaging was carried out by co-transfecting HEK293T cells (ATCC) with the DDR1 knockout (KO) vector and two helper vectors (psPAX2 and pMD2.G) via Lipofectamine 2000 (Life Technologies, 11668027). Two days later, lentivirus-containing supernatant was collected and used to infect the target tumour cell lines. Single clones were picked and expanded following antibiotic selection. All tumour cell lines used for animal studies were validated by STR profiling using ATCC cell authentication service (ATCC 137-XVTM). Routine testing for mycoplasma was conducted by MycoAlert Mycoplasma Detection Kits (Lonza, 75870–454). All cell lines tested negative for mycoplasma.
Genomic DNA of all selected KO clones was extracted and sequenced to verify the desired mutations. All three sgRNAs target DDR1-ECD-encoding sequences. sgRNA sequences are as follows: sgRNA1, AAGCAGTGATGGAGATG; sgRNA2, TGTGTTCCCCAAAGAAG; sgRNA3, GACCATGCAGTTATCTG. An irrelevant sgRNA sequence was used as a negative control (ABM, K010). The mouse DDR1 cDNA (NM-172962.1) was used to generate full length DDR1 and DDR1 ECD (1–412 amino acids (aa)), ΔKD(1–609 aa) and collagen-binding ECD mutants. Human DDR1 cDNA (NM-001954) was used to generate huDDR1. All mouse DDR1 sequences were cloned into the vector Plenti CMV GFP Neo (657–2) (Addgene 17447). Human DDR1 was constructed into both Plenti CMV GFP Neo (657–2) (used in AT-3 and M-Wnt KO rescue) and pLenti6.3/V5-DEST-GFP (Blasticidin resistance, Addgene 40125, used in E0771 KO rescue). Mouse DDR1 expression plasmids used in the rescue experiments all contain a silence mutation at the sgRNA-targeting region.
Western blotting
Cell lysates were extracted and analysed by immunoblotting using mouse cell lines listed above and the following human cell lines: MDA-MB-3231, MDA-MB-468, MDA-MB-436 and MCF7 from ATCC; SUM1315 from Asterand Biosciences; HCC1937 from L. Sun; and Hs578T from J. R. Hawse and T. C. Spelsberg. Cell pellets were resuspended in Laemmli Buffer. Protein concentration was evaluated by BCA Protein Assay Kit (Pierce, 23225). Protein lysates were then analysed by SDS–PAGE and transferred to membrane for immunoblotting. Primary antibodies are: anti-DDR1 (dilution: 1:1,000; CST, 5583S), anti-DDR2 (dilution: 1:1,000; Sigma, MABT322), anti-GAPDH (dilution:1:5,000; CST, 2118S), anti-β-actin (dilution: 1:5,000; Bio-Rad, 12004163), and anti-Flag (dilution: 1:5,000; Millipore Sigma, F3165–5MG). Secondary antibodies are: rabbit anti-goat HRP-conjugated IgG (dilution: 1:1,000; R&D systems, HAF017), goat anti-mouse HRP conjugated IgG (dilution: 1:5,000; Invitrogen, 31430) and goat anti-rabbit HRP conjugated IgG (dilution: 1:5,000; Invitrogen, 31460). For analysing proteins in conditioned medium, it was collected and centrifuged at 6,000 rpm, followed by passing through filters with a pore size of 0.45 μm to remove any cell debris. Media were resolved by SDS–PAGE followed by immunoblotting with an anti-DDR1 antibody (dilution: 1:1,000; R&D, AF2396).
Coomassie blue staining
Recombinant Fc-ECD was resolved by SDS–PAGE under either non-reducing or reducing conditions. For the non-reducing condition, Fc-ECD was prepared in NR buffer (4× buffer: 0.25 M Tris-HCl pH 6.8, 8% SDS, 30% glycerol, 0.02% bromophenol blue). For the reducing condition, the reducing agent dithiothreitol was added (0.075 M), followed by boiling for 5 min. After electrophoresis, the gel was fixed in FB buffer (50% methanol, 10% acetic acid, 40% water) for 1 h, stained in SB buffer (0.3% Coomassie blue R-250 in FB buffer) for 4 h, then destained in DS buffer (5% methanol, 7.5% acetic acid, 87.5% water) overnight.
MTT assay
A total of 1,000 tumour cells (in 100 μl) were seeded in 96-well plates and cultured for the indicated time period before analysis. On the day on which cells were collected, 50 μl 3-[4,5-dimethylthiazol-2-yl]-2,5-diphenyltetrazolium bromide (MTT) solution (3 mg ml−1) was added into individual wells and the plates were incubated for 1 h. After removal of the medium, coloured precipitates were dissolved in 100 μl DMSO and absorbance at 570 nm was measured.
Treatments and tumour studies in mice
All animal experiments were approved by the Institutional Animal Care and Use Committee at the George Washington University. Only female mice were used in all experiments. Eight-week-old wild-type C57BL/6 (Jackson Laboratory, 000664), Rag−/− (Jackson Laboratory, 002216) or nude (Jackson Laboratory, 002019) mice were used for tumour studies. Where appropriate, mice were selected at random. For antibody treatment, mice body weight and tumour size were first measured and randomly distributed into each treatment group to ensure similar average tumour size and body weight. Sample size is determined by pilot experiments and resource availability. E0771, M-Wnt and AT-3 cells were injected in the mouse mammary fat pad at a dose of 5 × 10⁵, 2 × 10⁵ and 2 × 10⁵ cells per inoculate, respectively, in a total volume of 100 μl, unless otherwise indicated. Tumour volumes (0.5 × length × width2) were measured with callipers on the indicated days. After tumour collection, tumours were weighed and samples were used for immunophenotyping, immunohistochemistry (IHC) or SHG. Per cent survival was determined by tumour volume larger than 1,500 mm3 or animal death or distress. For tumour transplantation from immunodeficient to immunocompetent hosts, tumour cells were first inoculated in Rag1−/− mice. When the tumour volume reached over 200 mm3 (approximately 20 days after initial E0771 inoculation), approximately 60 mg of tumour pieces were transplanted to wild-type C57BL/6 mice. Tumour samples were collected on day 4 for RNA sequencing (RNA-seq) and day 12 for SHG and IHC. For the tumour rechallenge experiment, wild-type C57BL/6 mice were first inoculated with E0771 Ddr1-KO cells (5 × 10⁵) or PBS alone in one side of the inguinal mammary fat pad. After 30 days, the same mice were inoculated with 5 × 10⁵ E0771 Ddr1-WT tumour cells on both sides of the same mammary fat pad as the initial inoculation. Tumour volumes were measured as described above. For the rescue experiment with recombinant Fc-ECD, the wild-type and W54A Fc-ECD were constructed by fusion of PCR-amplified C-terminus human DDR1-ECD with mouse IgG2b Fc in a mammalian expression vector under control of the CMV promotor. The constructs were expressed in HEK293 cells and purified using protein A resin as we describe for IgG purification below. Ddr1-KO E0771 tumour pieces were transplanted from Rag−/− hosts to C57BL/6 hosts. Vehicle (PBS) or Fc-ECD (100 μg per tumour site) was injected intratumorally, starting on the day of transplantation and continuing daily for 16 days. For DDR1 antibody treatment of transplant tumour models, isotype control IgG and anti-DDR1-ECD antibodies were injected intratumorally into tumours when tumour size reached approximately 100 mm3, at 10 mg per kg every other day for two weeks. Tumour measurements were confirmed by a second individual who was blinded to cell genotype or treatment information. To further enhance rigour and reproducibility, the key findings were verified independently by multiple individuals.
MMTV-PyMT spontaneous mammary tumour mice in FVB (Jackson Laboratory, 002374) and C57BL/6 strain background (Jackson Laboratory, 022974) were purchased at the age of 4 and 8 weeks old, respectively. The median tumour onset time for female MMTV-PyMT FVB and C57BL/6 mice is 6 and 13–17 weeks, respectively. For pre-tumour treatment, MMTV-PyMT FVB and C57BL/6 mice were treated with isotype control IgG and anti-DDR1-ECD clone 9 antibody at 5-weeks-old and 11-weeks-old, respectively. For post-tumour treatment, mice were treated with control IgG and clone 9 antibody when the tumour size reached approximately 100 mm3. For both pre- and post-tumour treatments, antibodies were intraperitoneally (i.p.) delivered at 10 mg per kg every other day for two weeks. Body weight and tumour volume per mouse were measured at the indicated time points.
Decellularization
Tumour cells were seeded in inserts with a pore size of 5 μm (Costar, Corning, 3422) at 2,000 (E0771) or 500 (AT-3) cells per insert and cultured in DMEM + 10% FBS + 1% PS medium for 2 days. Cells were washed with PBS and decellularized in PBS containing 0.5% Triton X-100 and 20 mM NH4OH at 37 °C for 5 min. Decellularized ECM was washed 3 times with PBS, followed by washing 3 times with 1× PBS, and used in the T cell migration experiments immediately.
In vitro CD8+ T cell isolation and migration assay
CD8+ T cells were isolated from splenocytes of C57BL/6 naive mice by EasySep mouse CD8+ negative isolation kit (STEMCELL, 19853) following the manufacturer’s manual. The CD8+ T cell migration assay was performed with 6.5-mm polycarbonate membranes and inserts of 5 μm pore size (Costar, Corning, 3421). A total of 5 × 10⁵ purified CD8+ T cells were added to the upper chamber and allowed to migrate at 37 °C for 2 h in the presence of recombinant CCL21 (100 ng ml−1, R&D systems, 4576C025CF), either with decellularized ECM pre-seeded in the inserts or with tumour-conditioned medium in the bottom chamber. CD8+ T cells that migrated to the bottom chamber were quantified by flow cytometry. For huDDR1 antibody neutralization, antibody was first co-incubated with conditioned medium at 37 °C for 1 h before assessment of the effect on T cell migration.
RNA-seq
RNA-seq was performed on the following samples. (1) In-vitro-cultured E0771 cells (wild type (WT) n = 3, DDR1 KO clones n = 2). (2) E0771 tumours in immunodeficient (Rag1−/−) hosts (WT n = 5, DDR1 KO n = 5). (3) E0771 tumours in immunocompetent hosts (C57BL/6) (WT n = 4, DDR1 KO n = 5). E0771 cells were injected in immunodeficient (Rag1−/−) hosts first and then surgically transplanted to immunocompetent hosts (C57BL/6). Transplanted tumours were collected on day 4 after transplantation. (4) Antibody-treated E0771 tumours. E0771 Ddr1-KO cells with reconstituted human DDR1 were injected into C57BL/6 mice. Treatment with either isotype control IgG or anti-hDDR1-ECD antibody (10 mg kg−1 intratumoral injection. IgG n = 4, anti-hDDR1 n = 4) started when tumour volume reached approximately 100 mm3. Tumours were collected on day 6 after treatment.
In each RNA-seq experiment, total RNA of about 500 ng was used for constructing RNA-seq libraries following the Illumina TruSeq stranded mRNA-seq sample preparation guide. In brief, poly-A-containing mRNA molecules were purified using poly-T oligo-attached magnetic beads. Purified mRNA was fragmented and converted to first-strand cDNA using reverse transcriptase and random primers. This was followed by second-strand cDNA synthesis using DNA polymerase I and RNase H. After adapter ligation, products were purified and enriched by PCR to generate the final RNA-seq libraries. RNA-seq libraries were subjected to quantification and pooled for cBot amplification. Subsequent 50-bp single-read sequencing was conducted with Illumina HiSeq 3000 platform. After the sequencing run, demultiplexing with Bcl2fastq2 was used to generate the fastq file for each tumour sample. Ddr1-WT and Ddr1-KO tumours were used for RNA-seq and around 32 million to 47 million total reads were obtained for each sample.
Bioinformatics analysis
For correlation between DDR1 mRNA and immune marker genes in the cohort of patients with TNBC1, gene expression matrix data were downloaded from GSE88847 and correlation was performed in GraphPad using one-tailed Pearson correlation coefficients analysis. Gene expression (RNA-seq transcript per million mapped reads (TPM)) data of primary breast tumours from The Cancer Genome Atlas (TCGA) project were obtained from cBioportal (https://www.cbioportal.org/study/summary?id=brca_tcga_pan_can_atlas_2018) and a log2(TPM+1) conversion was applied. Measurements of DDR1 protein correspond to those obtained by the Clinical Proteomic Tumor Analysis Consortium (CPTAC; https://cptac-data-portal.georgetown.edu/study-summary/S015). In this study, 28 samples were excluded on the basis of a previously conducted quality control analysis24. The ‘CD8+ T cell’ and ‘cytolytic effector pathway’ gene expression scores as shown in Fig. 2e and Extended Data Fig. 3p were computed using the ConsensusTME method and signatures in TCGA BRCA11. The signatures defining ‘accumulation of T cells’ comprised the genes identified as positive or negative hits in the tumour immune dysfunction and exclusion (TIDE) analysis10. The signature scores were computed using the single-sample gene set expression analysis (ssGSEA) algorithm calculated within the gene set variation analysis (GSVA) software (v.1.36.2)25. The collagen-alignment signature (genes n = 27) was previously described22. Breast cancer subtypes were based on PAM50 classification and TNBC redefined by a previous publication26.
For RNA-seq differential gene expression analysis, TopHat2 (v.2.1.0)27 was used to map sequence reads to Mus musculus transcriptome (GRCm38/mm10). The counts of gene expression were calculated with htseq-count (v.0.11.2), and DESeq2 (v.1.30.1)28 was used to identify DEGs with a cut-off threshold of log2-transformed fold change ≥ 1 and adjusted P value < 0.05. DEGs in each condition were used for GO analysis in biological process29. GO terms were ranked by false discovery date (FDR) from low to high, and the top 10 GO terms were used for graphing. For heat maps, z-scores are calculated for each row (gene), then plotted with ComplexHeatmap (v.2.4.2) using default parameters. The gene list used in heat maps was acquired from the following public database: (1) chemokine-related genes from GO:0042379; (2) antigen-processing and -presentation genes from the KEGG PATHWAY Database; and (3) co-stimulation genes from PMID: 22759274. The RNA-seq data can be found at GEO accession GSE139239.
For calculation of mutational burden, RNA-seq reads that are aligned to rRNA or tRNA sequences were removed. Filtered reads were then aligned with STAR aligner (v.2.4.2a) using a two-pass procedure. Before variant calling, aligned reads in BAM format were sorted, duplicate reads were flagged (MarkDuplicates, Picard v.2.5.0), the base scores were recalibrated (BaseRecalibrator, GATK v.4.1.2.0) and RNA-seq reads were split into exons (SplitNCigarReads, GATK v.4.1.2.0). Variant calling was done with MuTect2 in tumour-only mode. Variants recovered in VCF files were filtered (FilterMutectCalls, GATK v4.1.2.0), then annotated with ANNOVAR (v.2016Feb01) to the RefSeq (release 73).
PCA was computed using the plotPCA function in DESeq2 (v.1.28.1)28, including the top 10% variable genes based on their IQR value. This percentage was defined after excluding genes with no expression detected in any sample of a given setting. The pvclust R package (v.2.2–0)30 was used for unsupervised hierarchical clustering of immunocompetent host samples, with bootstrap resampling of 1,000. Unsupervised hierarchical clustering used average-linkage and Pearson’s correlation distance. GO enrichment analysis in defined gene sets was based on g:Profiler31 with the mouse genome as background and the FDR approach for adjusting P values. The TIMER (v.2.0)32, CIBERSORTx (release May 2021)33 and ConsensusTME (release September 2019)11 algorithms were applied to infer and assess cell type differences among bulk tumour transcriptome profiles (when necessary, Ensembl GRCh38 mouse-human orthologs were identified and included in the analysis).
To generate the Kaplan–Meier curves in Extended Data Fig. 10a–d, the TCGA data were downloaded from the Genomic Data Commons (GDC), National Cancer Institute (NCI). The RNA-seq data corresponded to FPKM-UQ values. The Kaplan–Meier curve and log-rank test, and univariable Cox proportional hazards regression analyses were used to examine associations with patient outcome. The analyses were performed using Bioconductor in R software (v.3.6.3).
Second harmonic generation
Mouse mammary tumour tissue was embedded and preserved in optimal cutting temperature (OCT) compound at −80 °C. Before cutting, samples were brought to −20 °C for at least 2 h and a 20-μm-thick section was cut using a cryostat. Slides were thawed and incubated at 37 °C for 30 min and then transferred to boiling antigen unmasking solution (Vector labs, H-3300) for 10 min. After nuclear staining with To-pro-3 (Fisher, T3605), each tumour section was mounted with fluoromount-G medium (Electron Microscopy Science, 17984–25) onto a microscope coverslip (no. 1.5). All samples were imaged using a Leica TCS SP8 multiphoton confocal microscope and a 20×, HC PL Apo, NA 0.7 oil-immersion objective was used throughout the experiments. The excitation wavelength was tuned to 840 nm34, and a 420 ± 5 nm narrow bandpass emission controlled by a slit was used for detecting the SHG signal of collagen. SHG signal is generated when two photons of incident light interact with the noncentrosymmetric structure of collagen fibres, which leads to the resulting photons being half the wavelength of the incident photons. Collagen measurement was performed using CT-Fire software (v.2.0 beta) (https://loci.wisc.edu/software/ctfire). Tumour margin for SHG analysis is defined as an area on the tumour side with a depth of 60 μm from the tumour–stroma border.
Immunohistochemistry for preclinical tumour models
Mouse mammary tumour tissues were fixed with 10% buffered formalin (Thermo Fisher Scientific, 23–427098) at 4 °C overnight. Fixed tumour samples were paraffin-embedded and cut into 4-μm sections for staining. Samples were deparaffinized in xylene, rehydrated and washed in PBS. Sections were boiled with antigen unmasking solution (Vector labs, H-3300) for 20 min, and then blocked with 10% normal goat serum in PBS at room temperature for 1 h. Anti-CD8α (dilution: 1:25; CST, 98941), anti-CD3e (dilution: 1:100; Invitrogen, MA5–14524) and anti-CD31 (dilution: 1:50, Abcam, ab28364) antibodies were incubated at 4 °C overnight. For detection of primary antibody, the ABC Peroxidase Detection System (Vector labs, PK-6105) was used with DAB (Vector labs, SK-4105) as substrate according to the manufacturer’s instructions. Samples were imaged by a Nikon ECLIPSE Ti2 microscope. Percentages of CD8-and CD3-positive cells were quantified by QuPath software (v.0.2.3) (https://qupath.github.io). Tumour margin for CD3+ and CD8+ quantification was defined as an area on the tumour side with a depth of 400–600 μm from the tumour–stroma border.
CD8+ T cell depletion and adoptive transfer
For CD8+ T cell depletion, C57BL/6 mice were administered i.p. with 200 μg per mouse anti-mouse CD8 (clone 2.43, BioxCell, BE0061) or IgG2b isotype control (clone LTF-2, BioxCell, BE0090) two days before tumour inoculation, and then twice per week. For CD8+ T cell adoptive transfer, purified CD8+ T cells (>90%) were transferred by tail vein injection to Rag1−/− mice bearing E0771 mammary tumour at a concentration of 5 × 10⁶ cells per mouse on day 17 after tumour inoculation.
Enzyme-linked immunosorbent assay
Type I collagen was diluted in PBS to a concentration of 50 μg ml−1 and added to 96-well microtitre plates (50 μl per well). Plates were sealed and incubated at room temperature overnight and subsequently washed three times with wash buffer (R&D, WA126) and then blocked with 200 μl reagent diluent (R&D, DY995) for 1 h. After washing three times with wash buffer, 100 μl of conditioned medium or recombinant ECD (used as standards, Sino Biological, 10730-H08H) was added to the plate and incubated at room temperature for 2 h. Following three times of wash with wash buffer, 100 μl of diluted anti-DDR1 N-terminal antibody (1:500, R&D, AF2396) was added and incubated for 2 h. After reaction with biotin-conjugated secondary antibody for 1 h, streptavidin-HRP (1:2,000, R&D, 893975) was added to each well and incubated in the dark for 20 min; 100 μl substrate solution (R&D, DY999) was then added and incubated for another 20 min. After the addition of 50 μl stop solution (R&D, DY994), plates were analysed in an enzyme-linked immunosorbent assay (ELISA) reader at 450 nm.
For antibody-binding ELISA, Corning 96-well EIA/RIA plates were coated overnight at 4 °C with human or mouse DDR1-ECD recombinant proteins (Sino Biological) and blocked for 2 h at 37 °C with 5% non-fat milk. After washing with PBS 3 times, 100 μl of serial diluted DDR1 antibodies was added and incubated for 1 h at 37 °C. Subsequently, the plates were washed with PBS-T (0.05% Tween 20) followed with PBS, and anti-rabbit F(ab)2 HRP-conjugated IgG (Jackson ImmunoResearch Laboratories) was used for detection of the binding using TMB substrates (Sigma). Binding signals were read at 450 nm using a 96-well plate reader (Molecular Devices).
Flow cytometry
Ddr1-KO tumours were procured on day 12 after re-transplantation of tumours from immunodeficient to immunocompetent mice. Tumour tissue was cut into small pieces and passed through a 70-μm cell strainer to obtain single-cell suspension. Single-cell suspensions were stained by viability dye and blocked by anti-CD16/CD32 before surface antibody staining. Permeabilization was done before nuclear protein or cytokine staining. Cells were fixed by 1% PFA before data acquisition. Immunostaining was done by an established protocol35. Cells were stained for viability using Viability Ghost Dye Violet 510 (13–0870, Tonbo Biosciences) at 1:1,000 dilution in PBS at 4 °C in the dark for 20 min, followed by washing with PBS. Samples were blocked with anti-CD16/32 at 1:100 dilution (clone 2.4G2, Tonbo Biosciences, 70–0161-U100). Antibodies at 1:100 dilution were incubated at 4 °C in the dark for 30 min. The following commercial antibodies were used: anti-CD45-BV 645 (Invitrogen, 64–0451-82), anti-CD3-eflour 660 (eBiosciences, 50–0032-82), anti-CD4-FITC (eBiosciences, 35–0042-U500), anti-CD8-APC-Cy7 (BD, 557654), anti-CD44-BV 786 (Biolegend, 103059), anti-CD62L-Pacific Blue (Biolegend, 104424), anti-IFN-γ-PE/Cy7 (Biolegend, 505826), anti-Gzmb-PE (Invitrogen, 12–8898-82) and anti-Ki67-PE (Biolegend, 652404). For nuclear protein staining, cells were permeabilized by Foxp3/Transcription factor staining kit (eBioscienceTM, 00–5523-00). For cytokine analysis, cells were activated by T-Activator CD3/CD28 dynabeads (Thermo Fisher Scientific, 11453D) at 37 °C overnight, followed by 5 h incubation of leukocyte activation cocktail with BD GolgiPlug (BD Biosciences, 550583). Cells were permeabilized by BD Cytofix/Cytoper kit (BD Biosciences, 554714). Data were acquired on a BD FACSCelesta flow cytometer and analysed by FACSDiva or FlowJo software (v.10.6, BD).
Screening and generation of anti-DDR1 monoclonal antibodies
Human DDR1-ECD protein (Sino Biological, 10730-H08H) was used to immunize rabbits and generate anti-DDR1 monoclonal antibodies using a method previously described36,37. In brief, New Zealand white rabbits were administered by i.p. injection 0.5 mg recombinant human DDR1-ECD protein for priming and a series of 3–4 boosters after the priming immunization in a 3-week interval. Memory B cells were isolated from peripheral blood mononuclear cells (PBMCs) and single B cells were cultured for 10 to 14 days in 96-well cell culture plates for antibody production. Cell culture supernatants were analysed for DDR1 binding using ELISA and positive hits were selected for antibody gene cloning and sequence analysis.
Cells from the positive B cell culture wells were lysed, total RNA was isolated and cDNA was synthesized using a superscript reverse transcriptase II (Invitrogen) according to the manufacturer’s suggestion. DNA sequences of antibody variable regions from both heavy chains and light chains were amplified by PCR using a set of designed primers and cloned into a vector for sequencing variable regions of each antibodies. The cloned antibody variable sequences of both heavy and light chains were constructed into a mammalian expression vector in fusion with the constant region of IgG1 heavy and kappa light chain, respectively, for full-length recombinant antibody expression in human embryonic kidney (HEK) 293 (HEK293F) cells (Life Science Technologies). Monoclonal antibodies were purified from HEK293 cell culture medium using protein A affinity resin to a purity of greater than 95% using a method that we described previously37. The purified antibodies were screened for neutralizing function in cell culture assays and anti-tumour efficacy in mouse tumour models.
Human breast cancer tissue imaging and analysis
Archival FFPE tissue blocks of primary TNBC breast tumours were identified from patients at the MedStar Georgetown University Hospital (MGUH). All patients were research-consented through the Histopathology and Tissue Shared Resource (HTSR), the Survey, Recruitment and Biospecimen Shared Resource (SRBSR), and/or Indivumed groups under the following respective Georgetown University Medical Center IRB Protocols 1992–048, Pr0000007, and 2007–345. Inclusion criteria for the cohort include female patients diagnosed with triple-negative invasive ductal carcinoma (+/− ductal carcinoma in situ) with a primary breast cancer surgical resection at MGUH between 2008 and 2015. Patients without prior systemic therapy were selected with one to three representative tissue blocks each.
IHC was performed in the Georgetown University Medical Center Histopathology and Tissue Shared Resource. Sections of 5 μm thickness were cut for haematoxylin and eosin staining with regions assessed for histopathologically representative areas of viable central tumour and tumour–non-tumour margin. Slides were baked at 60 °C, deparaffinized in xylene, rehydrated, washed in deionized water and incubated with 10% neutral buffered formalin (NBF) for an additional 20 min to increase tissue-slide retention. Epitope retrieval and microwave treatment (MWT) for all antibodies was performed by boiling slides in Antigen Retrieval buffer 6 or 9 (AR6 pH 6, Akoya AR6001KT and AR9 pH 9; Akoya, AR9001KT). Protein blocking was performed using antibody diluent/blocking buffer (Akoya, ARD1001EA) for 10 min at room temperature. Primary antibody–OPAL dye pairings, staining order and incubation conditions for the DDR1, CD8 and panCK antibodies are listed below. The specificity of anti-DDR1 antibody was confirmed by IHC of MDA-MB-231 breast cancer cells, with and without DDR1 shRNA knockdown.
Primary antibody–OPAL dye pairings and incubation conditions: Details of antibodies are as follows (in this order for each antibody: antigen, company, catalogue number, species, dilution, incubation time, incubation temperature, control tissue, OPAL fluorophore, OPAL concentration, antigen retrieval). Antibody 1: DDR1, R&D Systems, AF2396, goat, 1:250, 1 h, room temperature, breast CA, 570, 1:150, AR6. Antibody 2: CD8, Agilent, M7103, mouse, 1:50, 1 h, room temperature, tonsil, 520, 1:180, AR9. Antibody 3: panCK, Agilent, M3515, mouse, 1:80, 1 h, room temperature, breast CA, 690, 1:40, AR9.
MWT was performed to remove the primary and secondary antibodies between rounds of multiplex IHC. Multiplex IHC was finished with MWT and counterstained with spectral DAPI (Akoya FP1490) for 5 min and mounted with ProLong Diamond Antifade (Thermo Fisher Scientific, P36961) using StatLab #1 coverslips (CV102450).
The order of antibody staining and the antibody–OPAL pairing was predetermined using general guidelines and the particular biology of the panel. General guidelines include spectrally separating co-localizing markers and separating spectrally adjacent dyes. Multiplex IHC was optimized by first performing singleplex IHC with the chosen antibody–OPAL dye pair to optimize signal intensity values and proper cellular expression, followed by optimizing the full multiplex assay.
Slides were scanned at 10× magnification using the Vectra 3.0 Automated Quantitative Pathology Imaging System (PerkinElmer/Akoya). Whole slide scans were viewed with Phenochart (Perkin Elmer/Akoya) which also allows for the selection of high-powered images at 20× (resolution of 0.5 μm per pixel) for multispectral image capture. Three to six multispectral image regions of interest (ROIs; 669 μm × 500 μm) were captured in two locations on each slide, one set along the tumour margin and one set in the tumour interior for a total of 116 multispectral images across 12 slides. Five slides were classified as low-DDR1 expressers and seven as high-DDR1 expressers by two independent steps. First, they were manually scored by a pathologist (B.H.) as a blinded reviewer. For visual discrimination, the low-DDR1 expressers correlated with no or minimal IHC staining and the high ones correlated with moderate to high immunostaining. The slides were subsequently evaluated by machine-based, post-hoc inForm analysis to independently confirm the manual scoring. The percentage of DDR1+ cells was calculated in each group (DDR1low and DDR1high). Any tumours having a percentage of DDR1+ cells that deviated from the group’s mean by a z-score of greater than 3.0 were switched to the other group. The mean and standard deviation for the percentage of DDR1+ cells is 5.4 ± 5.4 for the DDR1low group and 37.8 ± 29.7 for the DDR1high group.
Tumour margin was defined as regions spanning 200–300 μm on either side of the margin or ROIs made up of tumour epithelium islands that contained multiple regions of tumour stroma larger than 50 μm across. Tumour core was defined as all areas within the tumour margin. Tumour multispectral images were unmixed using a spectral library built from images of single stained control tissues for each OPAL dye using the inForm Advanced Image Analysis software (inForm 2.4.6; PerkinElmer/Akoya). A selection of 10–15 representative multispectral images spanning all tissue sections was used to train the inForm software (tissue segmentation, cell segmentation, phenotyping and scoring tools). All the settings applied to the training images were saved within an algorithm to allow batch analysis of all the multispectral images for the project. All raw data were consolidated in PhenoptrReports (Akoya). CD8+ cells in the tumour epithelium were defined as CD8+ cells in contact with panCK+ cells, otherwise CD8+ cells were considered to be in the stromal component. Two small tumours from the DDR1high group did not have any ‘tumour core’ area left for quantification after the tumour margin classification. Therefore, 10 and 12 patient samples were used for the core and margin calculations in Fig. 2g, respectively.
Statistics
Two-tailed Student’s t-tests were used to compare mean differences between two groups. Two-way ANOVA and post-hoc multiple comparison were used to compare mean differences between multiple groups. Survival curves were analysed by log-rank (Mantel–Cox) analysis. Pearson correlation analysis and all the other statistics were done in GraphPad Prism unless otherwise specified. P < 0.05 was considered significant. Data are presented as mean ± s.e.m.
Reporting summary
Further information on research design is available in the Nature Research Reporting Summary linked to this paper.
Data availability
DDR1 protein expression correlation scatter plots were drawn with data obtained from the CPTAC (https://cptac-data-portal.georgetown.edu/study-summary/S015) (Fig. 2e, Extended Data Fig. 3p). The correlation between DDR1 mRNA levels and patient survival was performed with data acquired from the Kaplan–Meier Plotter database (https://kmplot.com/analysis/) (Extended Data Fig. 3f, g). Correlations between the mRNA levels of DDR1 and immune markers were performed with data extracted from GSE88847 (Extended Data Fig. 3k–n) and the TCGA project (https://www.cbioportal.org/study/summary?id=brca_tcga_pan_can_atlas_2018) (Fig. 2d, Extended Data Figs. 3h–j, o, 10e). Disease-specific survival Kaplan–Meier curves were drawn with data obtained from the TCGA project (https://gdc.cancer.gov/) (Extended Data Fig 10a–d). All data generated and analysed during this study, except the RNA-seq dataset, are included in this published Article and its supplementary files. The RNA-seq dataset has been deposited to the NCBI Gene Expression Omnibus database and the accession number is GSE139239. Source data are provided with this paper.
Extended Data
Extended Data Fig. 1 |. Differential effects of tumour Ddr1-KO on tumour growth in vitro and in vivo.
(a) Immunoblotting of DDR1, DDR2 and loading control β-ACTIN in M-Wnt and AT-3 Ddr1-WT/KO tumour cells. Images are representatives of three independent experiments. (b–d) In vitro cell proliferation of E0771 (WT: n = 3, KO: n = 5, b), M-Wnt (WT: n = 3, KO: n = 5, c) and AT-3 (WT: n = 6, KO: n = 4, d) tumour cells, n indicate technical repeats. Out of three biological repeats. (e–f) M-Wnt (n = 4 tumours/group, e) and AT-3 (n = 5 tumours/group, f) tumour growth in immunodeficient mice. (g–h) M-Wnt (n = 7 tumours/group, g) and AT-3 (n = 7 tumours/group, h) tumour growth in immunocompetent C57BL/6 mice. (i–j) M-Wnt and AT-3 tumours were grown firstly in Rag1−/− hosts. Approximately 60 mg of tumour pieces were transplanted to C57BL/6 mice. Tumour volume of M-Wnt (WT” n = 9 tumours, KO: n = 10 tumours, i) and AT-3 (WT: n = 10 tumours, KO: n = 9 tumours, j). (k) Percentage of CD8+ in CD3+ T cells in blood, n = 5 mice/group. (l) Tumour volumes in C57BL/6 hosts with prior treatment of anti-IgG or anti-CD8 antibody (n = 5 tumours/group). (m) CD8+ TILs normalized by tumour weight in Rag1−/− mice after adoptive transfer of CD8+ T cells or medium (sham), n = 6 tumours/group. (n) Tumour volumes in Rag1−/− mice after adoptive transfer of CD8+ T cells or medium (sham). n = 6 tumours/group. Arrow indicates transfer of CD8+ T cells on day 17. (o) Tumour weight from rechallenged mice (n = 6 tumours/group). Values represent mean ± SEM. p value and n as indicated, all tests used two-way ANOVA except for CD8+ quantification, which used two-tailed Student’s t-test.
Extended Data Fig. 2 |. Immunophenotyping of Ddr1-WT and Ddr1-KO tumours.
(a–d) TIL number normalized by E0771 Ddr1-WT/KO tumour weight/gram. Cell number of CD44hi CD62Llo CD8+ (a) and CD44hi CD62Llo CD4+ (b) IFNγ+ CD8+ (c) and IFNγ+ CD4+ (d) T cells. WT/KO: n = 5 tumours/group. (e–p) TIL numbers normalized by tumour weight of M-Wnt (n = 4 tumours/group, e-j) and AT-3 tumours (n = 5 tumours/group, k–p). (q–t) Percentages of T cells from E0771 Ddr1-WT and KO tumours (n = 5 tumours/group) positive for Ki67 (CD4+ in q and CD8+ in r), IFNγ (CD8+ in s) or GZMB (CD8+ in t). n.s. not significant. Values represent mean ± SEM. p value as indicated, two-tailed Student’s t-test.
Extended Data Fig. 3 |. Correlation between DDR1 and immune markers in human breast cancer.
(a) Representative images of CD8+ T cell staining at E0771 tumour margin and in the tumour core (bottom panels). (b, c) Representative images (b) and quantification (c) of CD8+ T cell IHC at M-Wnt tumour margin and core (WT: n = 8 tumours, KO: n = 4 tumours). (d, e) Representative images (d) and quantification (e) of CD8+ T cell IHC at AT-3 tumour margin and core (n = 5 tumours/group). Images in (a),(b), and (d) showing tumour margin at top panel (tumour boarder denoted by red dash lines) and tumour core at bottom panel. Box areas at higher magnification are shown in the upper right inlets. Red arrow heads indicate CD8+ cells. The y-axis in (c) and (e) refers to percent of CD8+ cells over total cells in a given field. Scale bar: 100 μm and 10 μm in inlets. Two-tailed Student’s t-test. (f–g) Correlation between DDR1 mRNA levels and overall survival of all patients with breast cancer (f) and patients with TNBC (g) in the Kaplan-Meier Plotter database (https://kmplot.com/analysis/). (h–j) Scatter plots showing the negative gene expression (Z-score) correlation between DDR1 mRNA levels and GZMB (h), IFNG (i), and PRF1 (j) in TCGA TNBC tumours (n = 162). The corresponding Spearman’s correlation coefficients and p values are shown. (k–n) Correlation of DDR1 mRNA levels and anti-tumour immune markers in 37 samples from patients with TNBC (GSE88847). (o) Scatter plot showing the negative gene expression correlation between DDR1 mRNA levels and signature for accumulation of T cells in tumours using TCGA TNBC tumour data. (p) Scatter plots showing the negative expression correlation between DDR1 protein expression and cytolytic effector pathway in CPTAC BRCA. (q) Correlation between percentages of CD8+ immune cells and DDR1+ tumour cells in a TNBC cohort (n = 12). (r) Correlation between percentages of CD8+ immune cells and DDR1+ tumour cells in a DDR1high (n = 7) and DDR1low (n = 5) TNBC samples. (s) Patient numbers of immune-excluded (n = 4) and non-immune-excluded (n = 6) in DDR1high and DDR1low group. Only the 10 patient samples with paired margin and core information were used for the immune exclusion calculation in Extended Data Fig. 3s, two-sided Chi-square test.
Extended Data Fig. 4 |. DDR1 dependent transcriptomic changes.
(a) Quantification of αCD31 IHC of WT and KO tumours transplanted from Rag1−/− to C57BL/6 hosts (n = 6 tumours; n.s., not significant). Data are presented as mean values +/− SEM. Two-tailed Student’s t-test (b) Comparison of non-synonymous tumour mutational burden between Ddr1-WT (n = 4 tumours) and KO tumours (n = 5 tumours, n.s., not significant). Data are presented as mean values +/− SEM. Two-tailed Student’s t-test (c) Venn diagram showing the numbers of DEGs in each Ddr1-KO-WT comparison and the identity overlaps between them. The pairwise overlap significance is indicated. The GO terms overrepresented (FDR-adjusted p < 0.05 relative to mouse genome background) in the overlapping sets are shown; the genes corresponding to each annotation are also indicated.
Extended Data Fig. 5 |. Mutational and biochemical analysis of DDR1-ECD in vitro and in vivo.
(a) Diagram of full-length (FL) DDR1 (top) and tumour curves of either E0771 Ddr1-WT or KO tumour cells carrying various DDR1 expression vectors: empty vector (EV), FL, deletion of the kinase domain (ΔKD), and extracellular domain (ECD) only. All p values were compared to KO + EV group. TM: transmembrane domain. WT: n = 9 tumours, KO+EV: n = 10 tumours, KO+FL: n = 10 tumours, KO+ ΔKD: n = 6 tumours, KO+ECD: n = 5 tumours. (b) Crystal structure of mouse DDR1 collagen-binding domain, generated by Jmol software (http://www.jmol.org/). Amino acid residues targeted in the mutational analysis are shown. (c) Immunoblots of Flag-tagged mouse WT DDR1-ECD and point mutants ectopically expressed in M-Wnt tumour cells, with GAPDH as the loading control. Images are representatives from three independent experiments. (d) Immunoblots of Flag-tagged mouse WT DDR1-ECD and point mutants ectopically expressed in AT-3 tumour cells, with GAPDH as the loading control. Images are representatives from three independent experiments. (e–f) Growth curves of M-Wnt (e) and AT-3 (f) Ddr1-KO tumours with ectopically expressed mouse WT DDR1-ECD or collagen-binding point mutants. The numbers in parenthesis indicate outgrowing tumours (larger than 100 mm3) versus total injected. (g, h) Immunoblots of full-length DDR1 in cells and soluble ECD in conditioned medium from various mouse (g) and triple-negative human breast cancer cell lines plus ER-positive MCF7 (h). Images are representatives from three independent experiments. (i) Coomassie staining of recombinant Fc-ECD under non-reducing and reducing conditions. (j) Rescue of Ddr1-KO E0771 tumour growth in immunocompetent hosts by recombinant Fc-ECD versus PBS vehicle (n = 6 tumours/group). (k) Diagram of the Transwell assay for CD8+ T cell migration. Primary CD8+ T cells were loaded in the upper chamber that had been pre-seeded with decellularized ECM derived from tumour cells. The lower chamber contained medium with or without CCL21. (l) CD8+ T cells in vitro migration activity was abrogated by decellularized ECM from AT-3 tumour cells in a DDR1-dependent manner. Value of migrated CD8+ T cell number without ECM and CCL12 is set at “1” (lanes 1 and 2: n = 3; lanes 3 and 4: n = 7), n refers to technical repeats. Values represent mean ± SEM. p value as indicated, two-tailed Student’s t-test for all tests except for tumour volumes, which were done by two-way ANOVA.
Extended Data Fig. 6 |. SHG microscopy of Ddr1-WT and Ddr1-KO tumours.
(a) E0771 Ddr1-WT/KO tumours transplanted from Rag1−/− to C57BL/6 hosts were analysed by SHG, To-pro-3 staining for all nuclei, and collagen fibre individualization. Scale bar: 50 μm. (b, c) M-Wnt (WT n = 8 tumours, KO n = 4 tumours) and AT-3 (n = 5 tumours/group) Ddr1-WT/KO tumours transplanted from Rag1−/− to C57BL/6 hosts were analysed for infiltrating CD3+ T cells normalized by total cells via IHC. (d–g) M-Wnt and AT-3 Ddr1-WT/KO tumours transplanted from Rag1−/− to C57BL/6 hosts were analysed for collagen fibre alignment (d, e) and fibre length (f, g), n = 4 tumours/group. (h–j) E0771, n = 5 tumours/group (h), M-Wnt, n = 4 tumours/group (i) and AT-3, n = 4/group (j) Ddr1-WT/KO tumours transplanted from Rag1−/− to C57BL/6 hosts were analysed for fibre numbers by the CT-Fire software. (k–m) E0771 Ddr1-WT/KO tumours (WT n = 10 tumours, KO n = 8 tumours) from immunodeficient Rag1−/− hosts were analysed for collagen fibre alignment (k), fibre length (l) and fibre numbers (m) by the CT-Fire software. (n) Growth curves of E0771 Ddr1-KO tumours in immunocompetent hosts that were intratumorally injected with recombinant WT and mutant Fc-ECD (WT: n = 10 tumours, W54A: n = 9 tumours). (o) Representative images of E0771 Ddr1-KO tumours treated with recombinant WT or mutant Fc-ECD in C57BL/6 hosts as analysed by SHG, To-pro-3 staining, and collagen fibre individualization. Scale bar: 50 μm. (p) Quantification of collagen fibre alignment in WT and mutant Fc-ECD treated tumours (n = 5 tumours/group). (q) Enumeration of infiltrating CD3+ T cells normalized by total cells via IHC (WT: n = 4 tumours, KO: n = 3 tumours). Values represent mean ± SEM. p value as indicated, two-tailed Student’s t-test for all tests except for tumour volumes, which were done by two-way ANOVA.
Extended Data Fig. 7 |. Screening for huDDR1-neutralizing antibodies.
(a) Immunoblots of ectopic human (hu) DDR1 and endogenous mouse DDR1 in cell lysates and medium of E0771-derived cells. (b) Tumour growth curve of E0771-derived Ddr1-WT, KO+EV, KO+huDDR1 cells (n = 7 tumours/group).(c) Transwell migration assay for purified CD8+ T cells in the presence of conditioned medium from E0771 cells containing endogenous WT DDR1, Ddr1-KO, or Ddr1-KO and ectopic expression of huDDR1 (n = 3 technical repeats). Value of migrated CD8+ T cell number with parental E0771-conditioned medium is set at “1”. (d) Quantification of CD8+ T cell migration in the presence of DDR1-neutralizing antibodies, using conditioned medium from E0771 Ddr1-KO or KO+huDDR1 cells (IgG: n = 4, #3,#9,#14,#33: n = 2, technical repeats). Control: isotype IgG; anti-DDR1 antibody: #3, #9, #14, and #33. Value of migrated CD8+ T cell number in the far-left column is set at “1”. (e) Tumour curves treated with control IgG, #3, #9, #14, and #33 (n = 8 tumours/group). Antibody administration started when tumour volume reached approximately 100 mm3. All p values were compared to the control IgG group and p value as indicated. (f) Tumours host survival curves of E0771 Ddr1-KO tumour cells with ectopically expressed human (hu) DDR1 in C57BL/6 hosts treated intratumorally with isotype IgG (Ctrl, n = 17, tumours) or anti-DDR1 antibody #9 (n = 18, tumours). (g) Host body weight treated with control IgG, #3, #9, #14, and #33 (Ctrl n = 4 mice, #3, #9, #14, and #33 n = 4 mice/group). Antibody administration started when tumour volume reached approximately 100 mm3. Data are presented as mean values +/− SEM. (h, i) E0771 KO+huDDR1 tumours in C57BL/6 (n = 8 tumours/group, h) and Rag1−/− hosts (n = 6 tumours/group, i) treated with either isotype IgG or anti-DDR1 #33 antibody. (j, k) Tumour volume (j) and survival curve (k) of M-Wnt KO+huDDR1 tumours in C57BL/6 mice treated with isotype IgG and anti-DDR1 antibody #9 (n = 10, tumours/group). (l, m) Tumour growth (l) and survival percentage (m) of AT-3 KO+huDDR1 tumours in C57BL/6 mice treated with isotype IgG and anti-DDR1 antibody #3 (n = 10, tumours/group). Values represent mean ± SEM. p value as indicated. Tumour volumes were examined by two-way ANOVA; survival analysis was examined by log-rank (Mantel–Cox) test, and migration assay were examined by two-tailed Student’s t-test.
Extended Data Fig. 8 |. DDR1 antibody treatment inhibits spontaneous mammary tumour growth.
(a-b) Binding affinity of all four anti-ECD antibody clones for human (a) and mouse (b) DDR1. (c–d) Spontaneous MMTV-PyMT body weight of C57BL/6 hosts treated with control or #9 in the pre-tumour (from 11 weeks old, control: n = 7 mice, #9: n = 8 mice, c) and post-tumour groups (control n = 7 mice, #9 n = 8 mice, d). Data are presented as mean values +/− SEM. (e) Tumour incidence (percentage of tumour-bearing mammary glands per mouse, in MMTV-PyMT spontaneous mammary tumour model of C57BL/6 genetic background, treated in a “post-tumour” scheme with Ctrl (n = 7 mice) or anti-DDR1 #9 antibody (n = 8 mice). Data are presented as mean values + SEM. (f, g) Spontaneous MMTV-PyMT tumour growth in C57BL/6 hosts (accumulative tumour volume per mouse, f) and incidence percentage (per mouse, g) with pre-tumour treatment (control: n = 7 mice, #9: n = 8 mice). Data are presented as mean values +/− SEM. (h, i) Spontaneous MMTV-PyMT tumour growth (accumulative tumour volume per mouse) in FVB hosts treated with control or #9 before tumour growth (from 5 to 7 weeks old, h) and post-tumour groups (i). control: n = 7 mice, #9: n = 8 mice, n.s. not significant. Two-way ANOVA were used for all tests.
Extended Data Fig. 9 |. DDR1 antibody boosts the infiltration of anti-tumour immune cells.
(a–d) Indicated TIL numbers normalized by tumour weight in E0771 KO+huDDR1 tumours from C57BL/6 mice treated with control and anti-DDR1 antibody #9 (n = 4 tumours/group). (e–h) Percentage of Ki67-positive cells in CD4+, CD8+ T cells and percentage of IFNγ- or GZMB-positive cells in CD8+ T cells from the same antibody-treated mice as in (a–d) (n = 4 tumours/group). n.s. not significant. (i) Representative images of transplanted mammary tumours treated with Ctrl or anti-DDR1 #9 antibody, analysed by SHG, To-pro-3 staining, and collagen fibre individualization. Scale bar: 50 μm. (j) Quantification of CD8+ T cells in tumour margin and core in control and anti-DDR1 antibody-treated E0771 KO+huDDR1 tumours (Ctrl: n = 8 tumours, #9: n = 9 tumours). (k, l) TILs from spontaneous mammary tumours (C57B/6) treated with Ctrl or anti-DDR1 #9 antibody under the pre-tumour (k) and post-tumour (l) conditions. n = 6 tumours/group. (m, n) Representative IHC images of CD3+ and CD8+ T cells in tumour margin and core in control and anti-DDR1 antibody-treated E0771 KO+huDDR1 tumours. Tumour boarder denoted by red dash lines. Box areas at higher magnification are shown in the inlets. Red arrow heads indicate CD8+ cells. Scale bar: 100 μm and 10 μm in inlet. (o) Representative images of tumours from the post-tumour treatment group, analysed by SHG, To-pro-3 staining, and collagen fibre individualization. Scale bar: 50 μm. (p) Quantification of tumour fibre alignment in pre- and post-tumour treatment in C57BL/6 hosts (n = 5 tumours/group). Values represent mean ± SEM. p value as indicated, two-tailed Student’s t-test.
Extended Data Fig. 10 |. DDR1-related clinical correlation in cancers.
(a–d) Kaplan–Meier curves showing disease specific survival (DSS) rates for TCGA patients with breast cancer divided by major tumour subtypes: basal-like (a), HER2 positive (b), luminal A (c), and luminal B (d). Each subtype is further divided in four patient groups according to the tumour expression levels of the DDR1 gene and collagen-alignment signature. The gene/signature classification in high and low expression was based on their corresponding average expression values. The log-rank test p value and the number of individuals at risk at different follow-up times are shown in each tumour subtype analysis. (e) Correlation between human DDR1 and GZMB mRNA expression in various cancer types.
Supplementary Material
Acknowledgements
We thank S. Hursting for M-Wnt cells, S. Abrams for AT-3 cells, L. Sun for HCC1937 cells, and John R Hawse and Thomas C. Spelsberg for Hs578T cells. We also thank L. Lin for technical assistance in plasmid construction, L. Audoly for discussion, G. T. Salazar for editing the manuscript and X. Zhang for technical assistance with oestrogen receptor and progesterone receptor (ER and PR) immunohistochemistry. The work was supported by grants to R.L. and T.J.C. from the National Institutes of Health (NIH) (CA206529); to R.L. from NIH (CA246707) and the Walter G. Ross Foundation; to T.J.C. from NIH (CA205965) and the Owens Foundation and the Skinner Endowment; to Y.H. from NIH (CA212674); the Congressionally Directed Medical Research Program (W81XWH-17-1-0008); to V.X.J from NIH (GM114142); and to Z.A. from the Cancer Prevention and Research Institute of Texas (RP150551 and RP190561) and the Welch Foundation (AU-0042-20030616). The Genome Sequencing Facility at the UT Health San Antonio is supported by NIH-NCI P30 CA054174 (Mays Cancer Center at UT Health San Antonio), NIH Shared Instrument grant 1S10OD021805-01 (S10 grant), and CPRIT Core Facility Award (RP160732). Georgetown University Medical Center Shared Resources are supported in part by P30 CA051008 (Lombardi Comprehensive Cancer Center Support Grant; Principal Investigator L. Weiner). The ICO-IDIBELL research was supported by the Generalitat de Catalunya (SGR 2017-449; PFI-Salut SLT017-20-000076; and CERCA program) and the Carlos III Institute of Health (ISCIII), funded by FEDER funds (‘A way to build Europe’), grants PI18/01029 and PI21/01306.
Footnotes
Competing interests X.S., H.D., N.Z., Z.A. and R.L. are co-inventors of a pending patent application (62/949,300) filed by the University of Texas Health Science Center at Houston on the anti-DDR1 antibodies described in this manuscript. The University of Texas System and The George Washington University have licensed the patent to Parthenon Therapeutics for drug development. R.L. receives stock option and financial compensation for his role as a member on the Scientific Advisory Board of Parthenon Therapeutics.
Supplementary information The online version contains supplementary material available at https://doi.org/10.1038/s41586-021-04057-2.
Peer review information Nature thanks Joan Brugge, Shannon Turley and the other, anonymous, reviewers for their contribution to the peer review of this work.
Reprints and permissions information is available at http://www.nature.com/reprints.
References
- 1.Gruosso T et al. Spatially distinct tumor immune microenvironments stratify triple-negative breast cancers. J. Clin. Invest. 129, 1785–1800 (2019). [DOI] [PMC free article] [PubMed] [Google Scholar]
- 2.Cox TR The matrix in cancer. Nat. Rev. Cancer 21, 217–238 (2021). [DOI] [PubMed] [Google Scholar]
- 3.Bejarano L, Jordao MJC & Joyce JA Therapeutic targeting of the tumor microenvironment. Cancer Discov. 11, 933–959 (2021). [DOI] [PubMed] [Google Scholar]
- 4.Chen Y et al. Type I collagen deletion in αSMA+ myofibroblasts augments immune suppression and accelerates progression of pancreatic cancer. Cancer Cell 39, 548–565 (2021). [DOI] [PMC free article] [PubMed] [Google Scholar]
- 5.Leitinger B Discoidin domain receptor functions in physiological and pathological conditions. Int. Rev. Cell Mol. Biol. 310, 39–87 (2014). [DOI] [PMC free article] [PubMed] [Google Scholar]
- 6.Valiathan RR, Marco M, Leitinger B, Kleer CG & Fridman R Discoidin domain receptor tyrosine kinases: new players in cancer progression. Cancer Metastasis Rev. 31, 295–321 (2012). [DOI] [PMC free article] [PubMed] [Google Scholar]
- 7.Hidalgo-Carcedo C et al. Collective cell migration requires suppression of actomyosin at cell-cell contacts mediated by DDR1 and the cell polarity regulators Par3 and Par6. Nat. Cell Biol. 13, 49–58 (2011). [DOI] [PMC free article] [PubMed] [Google Scholar]
- 8.Gao H et al. Multi-organ site metastatic reactivation mediated by non-canonical discoidin domain receptor 1 signaling. Cell 166, 47–62 (2016). [DOI] [PMC free article] [PubMed] [Google Scholar]
- 9.Edwards DN et al. Selective glutamine metabolism inhibition in tumor cells improves anti-tumor T lymphocyte activity in triple-negative breast cancer. J Clin. Invest. 131, e140100 (2021). [DOI] [PMC free article] [PubMed] [Google Scholar]
- 10.Jiang P et al. Signatures of T cell dysfunction and exclusion predict cancer immunotherapy response. Nat. Med. 24, 1550–1558 (2018). [DOI] [PMC free article] [PubMed] [Google Scholar]
- 11.Jimenez-Sanchez A, Cast O & Miller ML Comprehensive benchmarking and integration of tumor microenvironment cell estimation methods. Cancer Res. 79, 6238–6246 (2019). [DOI] [PubMed] [Google Scholar]
- 12.Vogel WF, Aszodi A, Alves F & Pawson T Discoidin domain receptor 1 tyrosine kinase has an essential role in mammary gland development. Mol. Cell. Biol. 21, 2906–2917 (2001). [DOI] [PMC free article] [PubMed] [Google Scholar]
- 13.Takai K et al. Discoidin domain receptor 1 (DDR1) ablation promotes tissue fibrosis and hypoxia to induce aggressive basal-like breast cancers. Genes Dev. 32, 244–257 (2018). [DOI] [PMC free article] [PubMed] [Google Scholar]
- 14.Carafoli F et al. Structure of the discoidin domain receptor 1 extracellular region bound to an inhibitory Fab fragment reveals features important for signaling. Structure 20, 688–697 (2012). [DOI] [PMC free article] [PubMed] [Google Scholar]
- 15.Vogel WF Ligand-induced shedding of discoidin domain receptor 1. FEBS Lett. 514, 175–180 (2002). [DOI] [PubMed] [Google Scholar]
- 16.Agarwal G, Mihai C & Iscru DF Interaction of discoidin domain receptor 1 with collagen type 1. J. Mol. Biol. 367, 443–455 (2007). [DOI] [PubMed] [Google Scholar]
- 17.Ruggeri JM et al. Discoidin domain receptor 1 (DDR1) is necessary for tissue homeostasis in pancreatic injury and pathogenesis of pancreatic ductal adenocarcinoma. Am. J. Pathol. 190, 1735–1751 (2020). [DOI] [PMC free article] [PubMed] [Google Scholar]
- 18.Ambrogio C et al. Combined inhibition of DDR1 and Notch signaling is a therapeutic strategy for KRAS-driven lung adenocarcinoma. Nat. Med. 22, 270–277 (2016). [DOI] [PubMed] [Google Scholar]
- 19.Salmon H et al. Matrix architecture defines the preferential localization and migration of T cells into the stroma of human lung tumors. J. Cell. Invest. 122, 899–910 (2021). [DOI] [PMC free article] [PubMed] [Google Scholar]
- 20.Kaur A et al. Remodeling of the collagen matrix in aging skin promotes melanoma metastasis and affects immune cell motility. Cancer Discov. 9, 64–81 (2019). [DOI] [PMC free article] [PubMed] [Google Scholar]
- 21.Ray A & Provenzano PP Aligned forces: Origins and mechanisms of cancer dissemination guided by extracellular matrix architecture. Curr. Opin. Cell Biol. 72, 63–71 (2021). [DOI] [PMC free article] [PubMed] [Google Scholar]
- 22.Tomko LA et al. Targeted matrisome analysis identifies thrombospondin-2 and tenascin-C in aligned collagen stroma from invasive breast carcinoma. Sci. Rep. 8, 12941 (2018). [DOI] [PMC free article] [PubMed] [Google Scholar]
- 23.Dunlap SM et al. Dietary energy balance modulates epithelial-to-mesenchymal transition and tumor progression in murine claudin-low and basal-like mammary tumor models. Cancer Prev. Res. 5, 930–942 (2012). [DOI] [PMC free article] [PubMed] [Google Scholar]
- 24.Mertins P et al. Proteogenomics connects somatic mutations to signalling in breast cancer. Nature 534, 55–62 (2016). [DOI] [PMC free article] [PubMed] [Google Scholar]
- 25.Hanzelmann S, Castelo R & Guinney J GSVA: gene set variation analysis for microarray and RNA-seq data. BMC Bioinformatics 14, 7 (2013). [DOI] [PMC free article] [PubMed] [Google Scholar]
- 26.Fougner C, Bergholtz H, Norum JH & Sorlie T Re-definition of claudin-low as a breast cancer phenotype. Nat. Commun. 11, 1787 (2020). [DOI] [PMC free article] [PubMed] [Google Scholar]
- 27.Kim D et al. TopHat2: accurate alignment of transcriptomes in the presence of insertions, deletions and gene fusions. Genome Biol. 14, R36 (2013). [DOI] [PMC free article] [PubMed] [Google Scholar]
- 28.Love MI, Huber W & Anders S Moderated estimation of fold change and dispersion for RNA-seq data with DESeq2. Genome Biol. 15, 550 (2014). [DOI] [PMC free article] [PubMed] [Google Scholar]
- 29.Ashburner M et al. Gene ontology: tool for the unification of biology. Nat. Genet. 25, 25–29 (2000). [DOI] [PMC free article] [PubMed] [Google Scholar]
- 30.Suzuki R & Shimodaira H Pvclust: an R package for assessing the uncertainty in hierarchical clustering. Bioinformatics 22, 1540–1542 (2006). [DOI] [PubMed] [Google Scholar]
- 31.Raudvere U et al. g:Profiler: a web server for functional enrichment analysis and conversions of gene lists. Nucleic Acids Res. 47, W191–W198 (2019). [DOI] [PMC free article] [PubMed] [Google Scholar]
- 32.Li T et al. TIMER2.0 for analysis of tumor-infiltrating immune cells. Nucleic Acids Res. 48, W509–W514 (2020). [DOI] [PMC free article] [PubMed] [Google Scholar]
- 33.Newman AM et al. Determining cell type abundance and expression from bulk tissues with digital cytometry. Nat. Biotechnol. 37, 773–782 (2019). [DOI] [PMC free article] [PubMed] [Google Scholar]
- 34.Erikson A, Ortegren J, Hompland T, de Lange Davies C & Lindgren M Quantification of the second-order nonlinear susceptibility of collagen I using a laser scanning microscope. J. Biomed. Opt. 12, 044002 (2007). [DOI] [PubMed] [Google Scholar]
- 35.Wu B et al. PPARγ inhibition boosts efficacy of immune checkpoint immunotherapy against murine melanoma in a sexually dimorphic manner. Int. J. Biol. Sci. 16, 1526–1535 (2020). [DOI] [PMC free article] [PubMed] [Google Scholar]
- 36.Meng W et al. Efficient generation of monoclonal antibodies from single rhesus macaque antibody secreting cells. MAbs 7, 707–718 (2015). [DOI] [PMC free article] [PubMed] [Google Scholar]
- 37.Gui X et al. Disrupting LILRB4/APOE interaction by an efficacious humanized antibody reverses T-cell suppression and blocks AML development. Cancer Immunol. Res. 7, 1244–1257 (2019). [DOI] [PMC free article] [PubMed] [Google Scholar]
Associated Data
This section collects any data citations, data availability statements, or supplementary materials included in this article.
Supplementary Materials
Data Availability Statement
DDR1 protein expression correlation scatter plots were drawn with data obtained from the CPTAC (https://cptac-data-portal.georgetown.edu/study-summary/S015) (Fig. 2e, Extended Data Fig. 3p). The correlation between DDR1 mRNA levels and patient survival was performed with data acquired from the Kaplan–Meier Plotter database (https://kmplot.com/analysis/) (Extended Data Fig. 3f, g). Correlations between the mRNA levels of DDR1 and immune markers were performed with data extracted from GSE88847 (Extended Data Fig. 3k–n) and the TCGA project (https://www.cbioportal.org/study/summary?id=brca_tcga_pan_can_atlas_2018) (Fig. 2d, Extended Data Figs. 3h–j, o, 10e). Disease-specific survival Kaplan–Meier curves were drawn with data obtained from the TCGA project (https://gdc.cancer.gov/) (Extended Data Fig 10a–d). All data generated and analysed during this study, except the RNA-seq dataset, are included in this published Article and its supplementary files. The RNA-seq dataset has been deposited to the NCBI Gene Expression Omnibus database and the accession number is GSE139239. Source data are provided with this paper.


