Abstract
Background
β-Zone parapapillary atrophy (β-PPA) is a common sign in patients with open-angle glaucoma (OAG). Some studies have suggested that β-PPA can aid in the diagnosis of OAG. We performed a systematic review and meta-analysis of the prevalence and diagnostic ability of β-PPA in OAG.
Methods
We performed a literature search in PubMed, Web of Science, Embase and Google Scholar from inception to 1st November, 2021. Both hospital-based and population-based studies that reported details of β-PPA in OAG were included.
Results
We screened 1404 articles from these databases and ultimately included 24 articles in our meta-analysis. The prevalence of β-PPA in OAG was 0.73 (95% CI 0.67 to 0.78). The results of subgroup analysis by country revealed prevalence rates of 0.83 (95% CI 0.78 to 0.88) in Japan, 0.85 (95% CI 0.64 to 0.97) in Korea, 0.64 (95% CI 0.55 to 0.73) in the USA, 0.61 (95% CI 0.58 to 0.63) in Germany and 0.57 (95% CI 0.39 to 0.74) in China. Fundus photography, Heidelberg retina tomography (HRT), Heidelberg retina angiography (HRA) + indocyanine green angiography (ICGA), Spectral domain optical coherence tomography (SD-OCT)and Swept source optical coherence tomography(SS-OCT) values were 0.65 (95% CI 0.58 to 0.71), 0.70 (95% CI 0.50 to 0.86), 0.78 (95% CI 0.61 to 0.91), 0.77 (95% CI 0.65 to 0.88) and 0.99(95% CI 0.87 to 1.00) respectively. The sensitivity and specificity of β-PPA as a diagnostic marker were 0.78 (95% CI 0.68 to 0.85) and 0.63 (95% CI 0.51 to 0.73), respectively.
Conclusions
β-PPA is a potential diagnostic marker for OAG. However, a more detailed understanding of β-PPA characteristics is needed to improve the ability to predict OAG.
Supplementary Information
The online version contains supplementary material available at 10.1186/s12886-022-02282-5.
Keywords: OAG, β-zone parapapillary atrophy, Meta-analysis
Background
As we all know, glaucoma is a kind of irreversible blinding eye disease. The key to the treatment of glaucoma lies in early diagnosis, Now we diagnose it by the thickness of RNFL, vertical cup and disc ratio and Blood flow density in optic papilla. Of course, visual field examination is the most important. To be radical, it is too late when you are clinically diagnosed with glaucoma by the typical visual field defect. Therefore, it is of great significance to find a marker for early or auxiliary diagnosis of glaucoma. Parapapillary atrophy (PPA), which is also called halo glaucomatosus, was first discovered in patients with advanced glaucoma, and the relationship between parapapillary atrophy and glaucoma has long been recognised [1]. Jonas et al. [2] subdivided PPA into α-zone and β-zone PPA according to the results of fundus photography. The α-zone PPA is a region with irregular hypopigmentation or hyperpigmentation of the retinal pigment epithelium (RPE) and is located in the periphery of the PPA. The β-zone PPA is a region in which the RPE has disappeared and the choriocapillaris has atrophied [3]. In fundus photography, the β-zone PPA is characterised by visible sclera and large choroidal vessels located between the optic disc and the α-zone. Many studies have suggested that β-PPA could be a potential diagnostic marker for OAG [1–3]. With the development of techniques for obtaining fundus images, more detailed characteristics of β-PPA have been identified by fundus photography, confocal scanning laser ophthalmoscopy (such as Heidelberg retina tomography, HRT) and optical coherence tomography (OCT).
Recent research has shown that β-zone PPA can be used to diagnose OAG, with an area under the receiver operating characteristic (AUROC) curve value (95%) of 0.75 [4]. Here, we performed a systematic review and meta-analysis of the prevalence of β-PPA and its diagnostic ability in OAG. The purpose of this study is to investigate and objectively state the incidence of β-PPA in glaucoma and verify its diagnostic efficacy for further research.
Methods
Search strategy
We searched PubMed, Web of Science, Embase and Google Scholar for observational studies that reported the prevalence of β-PPA with and without a control group between inception and 1st November, 2021. See “Additional file 1” for specific search strategy.
Our search terms were ‘((glaucoma, open-angle) OR (open-angle Glaucoma) OR (POAG) OR (OAG) OR (normal tension glaucoma) OR (NTG)) AND ((parapapillary chorioretinal atrophy) OR (parapapillary atrophy) OR (peripapillary chorioretinal atrophy) OR (peripapillary atrophy) OR (halo glaucomatosus))’.
Eligibility criteria
The inclusion criteria were as follows: OAG patients who had been diagnosed comprehensively by perimetry, gonioscopy and intraocular pressure (IOP); β-PPA analysed on fundus photography images; the prevalence of β-zone PPA in OAG eyes could be determined or calculated from the article; and only cross-sectional studies were included. Studies were excluded according to the following criteria: studies that did not distinguish the α-zone and β-zone; those reporting only the area data of the β-zone without numbers or prevalence; studies in monkeys or that were not performed in vivo; studies that concentrated on the optic disc and not the whole parapapillary zone; and those for which the full text was not available.
Data extraction
Two reviewers (DMZ and MDC) independently screened all titles and abstracts of articles and selected those that met the eligibility criteria. We read the full text of selected articles. Then, we chose articles based on the selection criteria for our systematic review and meta-analysis. If we had different opinions on including or excluding the study, a final decision was made by the lead author, Prof. Duan.
Prevalence of β-PPA
We extracted the number of OAGs with and without β-zone PPA and calculated the prevalence from all studies. We recorded the country, age, sex and diagnostic type.
Diagnostic ability of β-PPA
We selected articles from 24 studies with healthy individuals as controls or that were population-based. Then, a 2 × 2 table, i.e. true positives (TP), false positives (FP), true negatives (TN) and false negatives (FN), was generated from the selected studies. Diagnostic analysis according to TP, FP, FN and TN was also performed using Review Manager V5.3.
Quantitative analysis
Data analysis was performed using R (version 3.5.0, R Foundation for Statistical Computing, Vienna, Austria) and Excel (Microsoft Redmond, WA, USA). Review Manager V5.3 was used for quality evaluation and diagnostic meta-analysis of β-PPA. Heterogeneity analysis and subgroup analysis of proportions were assessed using the meta package (4.9–2) in R. The proportions were logit transformed to fit the normal distribution. The meta-analysis model was chosen based on the I2. We performed subgroup analysis according to country and device.
Results
Selected studies
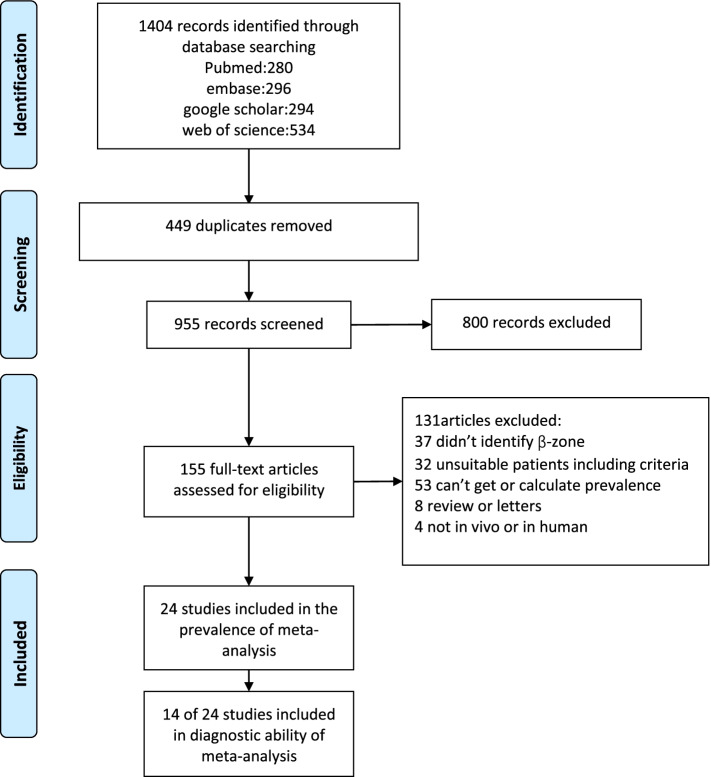
Twenty-one studies were included in the proportion analysis [3, 5–24] and 14 studies were included in the diagnostic meta-analysis. We initially obtained 1404 articles from PubMed, Embase, Web of Science and Google Scholar. After the screening stage, 155 articles were passed into the eligibility stage (449 duplications were excluded and 800 articles were identified by reading the title and abstract). After reading the full text of these 155 articles, 24 articles were included in our meta-analysis. Figure 1 shows the detailed process and results of inclusion.
Fig. 1.
Flow diagram of study inclusion in the meta-analysis
Risk of bias
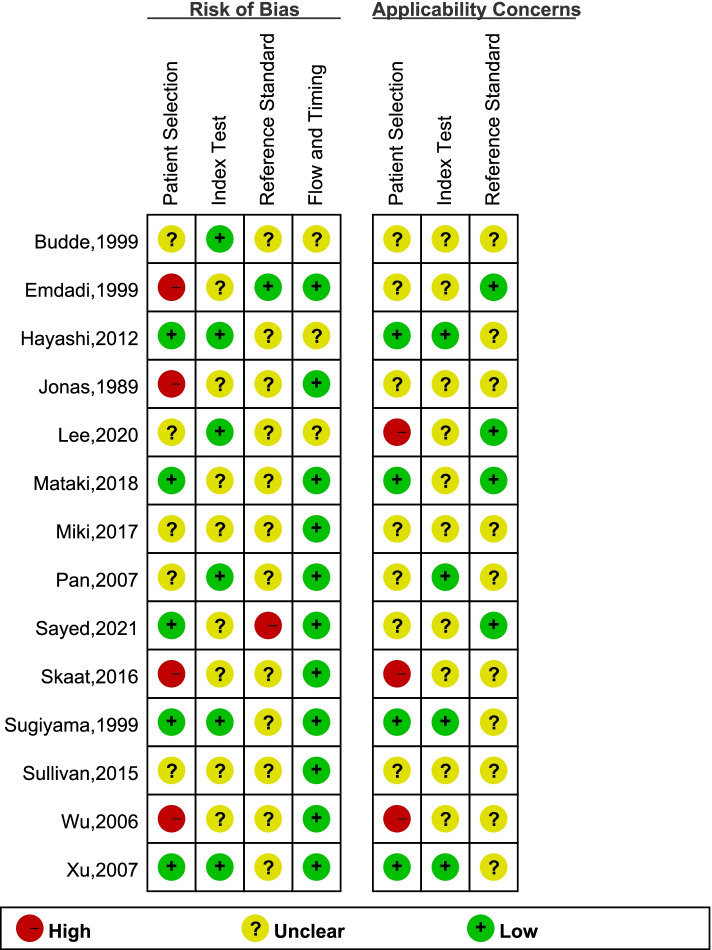
Quality evaluation of 24 studies was applied based on the Newcastle–Ottawa Scale for Cross Sectional Studies criteria (Supplement Table 1). The 14 of 24 studies were also assessed using the QUADAS-2 scale (Fig. 2). Here, I2 > 50% was commonly noted in the heterogeneity evaluation of prevalence and diagnostic ability. Thus, we choose the random effects model. Publication bias was analysed and is presented as a funnel diagram. Linear regression tests of funnel plot asymmetry used a random effects model: t = 0.88034, df = 22, p = 0.3882. (Supplementary Fig. 1).
Fig. 2.
Twenty-one studies were subject to quality evaluation based on specific criteria
Study characteristics
Table 1 presents the age, sex, country and refraction values of the patients included in these studies. We listed or calculated the prevalence from the included studies. Of all 24 studies, including 4,536 samples, three studies were performed in Germany, three in Korea, four in China, five in Japan and six in the USA. The mean age of the patients was 49–70 years. Most [11] studies used fundus photography to obtain images, five used Heidelberg retinal tomography (HRT), three used optic coherence tomography (OCT) and one used both Heidelberg retinal angiography and indocyanine green angiography (ICGA). Three articles described population-based studies and the others reported hospital-based studies. All studies were cross-sectional or retrospective in design.
Table 1.
Characteristics of included studies
| Study | Country | Prevalence | Quantity (eyes) | Diagnostic criteria | Age range (years) | Image | Refraction (D) | Study design |
|---|---|---|---|---|---|---|---|---|
| Jonas et al. [2, 24] | Germany | 59.6% | 582 | Chronic OAG | 62.9 ± 13.3 | disc camera | 0.2 ± 2.6 | Hospital-based |
| Park et al. [23] | Japan | 84.3% | 102 | NTG | 57.8 ± 13.4 | HRT | − 0.3 ± 2.3 | Hospital-based |
| Tezel et al. [22] | USA | 67.2% | 529 | POAG + NTG | 68.4 ± 12.6 | disc camera | Range, 3 to 3 | Hospital-based |
| Budde and Jonas [21] | Germany | 62.3% | 501 | POAG | 62.7 ± 14.7 | disc camera | − 0.4 ± 2.4 | Hospital-based |
| Emdadi et al. [20] | USA | 44.8% | 29 | POAG | 62.3 ± 13.5 | HRT | Range, 3 to 3 | Hospital-based |
| Kono et al. [19] | USA | 48.9% | 47 | POAG | 63.4 ± 13.9 | HRT | Range, 3 to 3 | Hospital-based |
| Sugiyama et al. [18] | Japan | 79.2% | 207 | OAG | 48.1 ± 9.4 | Fundus photography | NA | Population-based |
| Park et al. [17] | Korea | 97.0% | 33 | NTG | 48.0 ± 9.1 | HRT | < − 6 | Hospital-based |
| Budde and Jonas [16] | Germany | 58.9% | 168 | Chronic OAG | 55.8 ± 11.4 | Fundus photography | − 1.2 ± 2.7 | Hospital-based |
| Duan et al. [15] | China | 39.8% | 128 | POAG | 49.0 ± 15.6 | Fundus photography | − 1.1 ± 2.4 | Hospital-based |
| Wu et al. [13] | China | 77.8% | 27 | POAG | 63. 0 ± 13. 1 | HRA and ICGA | − 0.9 ± 2.4 | Hospital _based |
| Pan et al. [14] | China | 43.5% | 85 | POAG + NTG | 60.7 ± 11.0 | Fundus photography | − 0.3 ± 1.0 | Hospital _based |
| Xu et al. [12] | China | 68.8% | 93 | Glaucoma | 63.7 ± 10.1 | Fundus photography | − 0.5 ± 2.4 | Population-based |
| Teng et al. [11] | USA | 59.5% | 245 | OAG | 70.0 ± 12.3 | HRT | − 1.0 ± 2.4 | Hospital-based |
| Lee et al. [10] | Korea | 71.3% | 202 | POAG + NTG | 63.4 ± 11.3 | Fundus photography | − 0.3 ± 2.1 | Hospital-based |
| Hayashi et al. [9] | Japan | 84.0% | 100 | POAG | 55.6 ± 11.0 | SD-OCT | − 2.2 ± 2.2 | Hospital-based |
| Kim et al. [8] | Korea | 79.0% | 195 | POAG | 51.4 ± 13.9 | SD(EDI)-OCT | − 2.7 ± 3.8 | Hospital-based |
| Sullivan-Mee et al. [7] | USA | 76.2% | 63 | POAG | 67.2 ± 8.2 | SD-OCT | AL:24.41 mm | Hospital-based |
| Skaat et al. [6] | USA | 77.2% | 801 | Glaucoma | 61.4 ± 12.8 | Fundus photography | − 0.5 ± 1.9 | Hospital-based |
| Miki et al. [3] | Japan | 94.0% | 50 | OAG | 59.8 ± 9.5 | SS-OCT | − 2.4 ± 2.3 | Hospital-based |
| Mataki et al. [5] | Japan | 77.4% | 84 | POAG | 63.9 ± 12.4 | Fundus photography | − 0.9 ± 2.7 | Population-based |
| Lee et al.[33] | Korea | 100.0% | 88 | OAG |
53.9 ± 13.4 |
SS-OCT | − 0.66 ± 2.16 | Hospital-based |
| Lee et al.[34] | Korea | 50.6% | 77 | Glaucoma |
56.1 ± 12.7 |
SD-OCT | AL: 24.7 ± 1.6 mm | Hospital-based |
| Sayed et al.[35] | Egypt | 90.0% (82%) | 100 | POAG |
51.0 ± 8.8 |
SD-OCT (Fundus photography) | NA | Hospital-based |
Abbreviations: EDI-OCT enhanced depth imaging OCT, HRA Heidelberg Retinal angiography, HRT Heidelberg retina tomography, ICGA indocyanine green angiography, NTG normal tension glaucoma, OAG open-angle glaucoma, OCT optic coherent tomography, POAG primary open-angle glaucoma, SD-OCT spectral-domain OCT, SS-OCT swept-source OCT
Prevalence
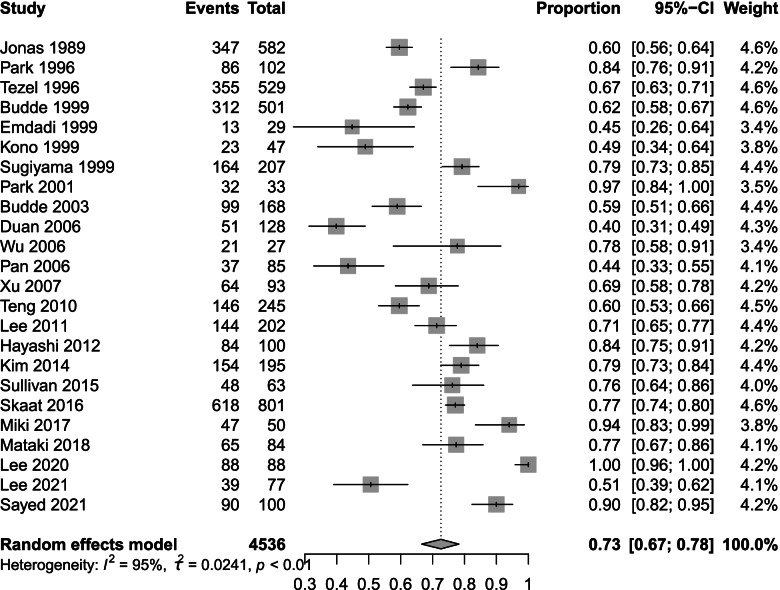
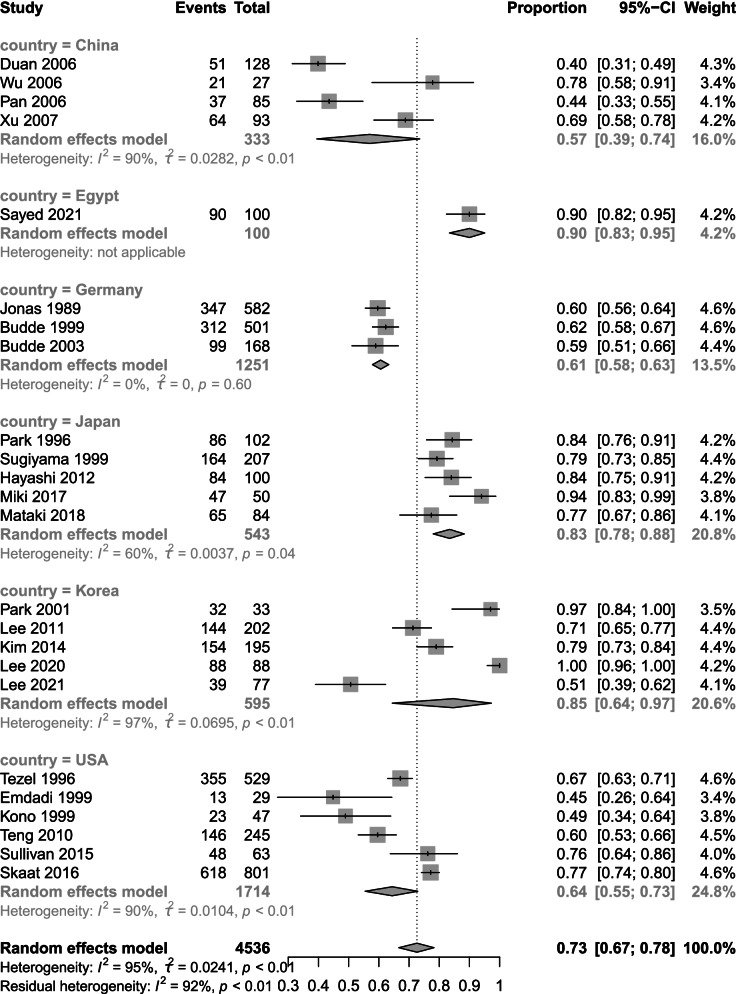
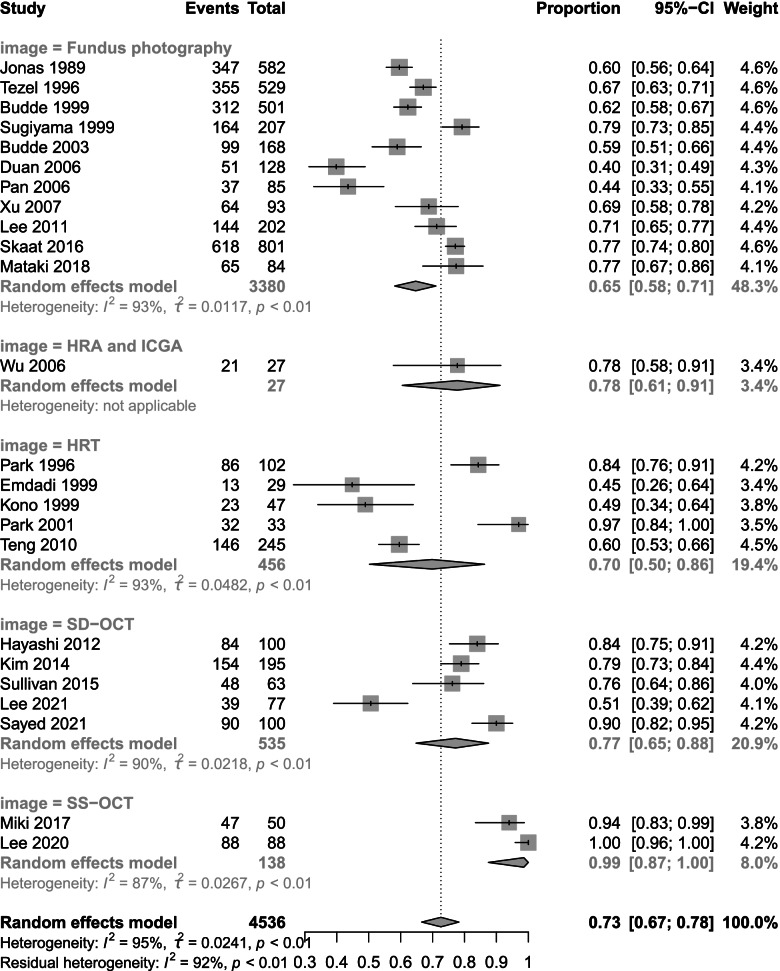
We analysed the prevalence data and chose logit transformation to obtain a normal distribution. The I2 value was 95%, τ2 = 0.0241 and p < 0.001. Based on the I2 values, we chose a random effects model. The prevalence of β-PPA in OAG was 73% (95% CI 67 to 78) (Fig. 3). The results of subgroup analysis by country and device are shown below. Subgroup analysis by country showed prevalence rates of 57% (95% CI 39 to 74) in China, 61% (95% CI 58 to 63) in Germany, 83% (95% CI 78 to 88) in Japan, 85% (95% CI 64 to 97) in Korea and 64% (95% CI 55 to 73) in the USA (Fig. 4). Subgroup analysis by device revealed differences in prevalence rate among fundus photography, HRT, HRA + ICGA and OCT. Fundus photography showed the lowest prevalence of 65% (95% CI 58 to 71) followed by HRT at 70% (95% CI 50 to 86) SD-OCT 77% (95% CI 65 to 88) and HRA + ICGA at 78% (95% CI 61 to 91). SS-OCT had the highest prevalence at 99% (95% CI 87 to 100) (Fig. 5).
Fig. 3.
Total prevalence in 24 studies. The total prevalence of 4,536 included eyes was 73% (95% CI 67 to 78) based on a random effects model
Fig. 4.
Subgroup analysis based on country. The prevalence rates were 57% (95% CI 39 to 74) in China, 61% (95% CI 58 to 63) in Germany, 83% (95% CI 78 to 88) in Japan, 85% (95% CI 64 to 97) in Korea and 64% (95% CI 55 to 73) in the USA
Fig. 5.
Subgroup analysis based on the imaging method. Fundus photography exhibited the lowest prevalence of 65% (95% CI 58 to 71) followed by HRT at 70% (95% CI 50 to 86), SD-OCT at 77% (95% CI 65 to 88) and HRA + ICGA at 78% (95% CI 61 to 91). SS-OCT had the highest prevalence at 99% (95% CI 87 to100)
Diagnostic ability
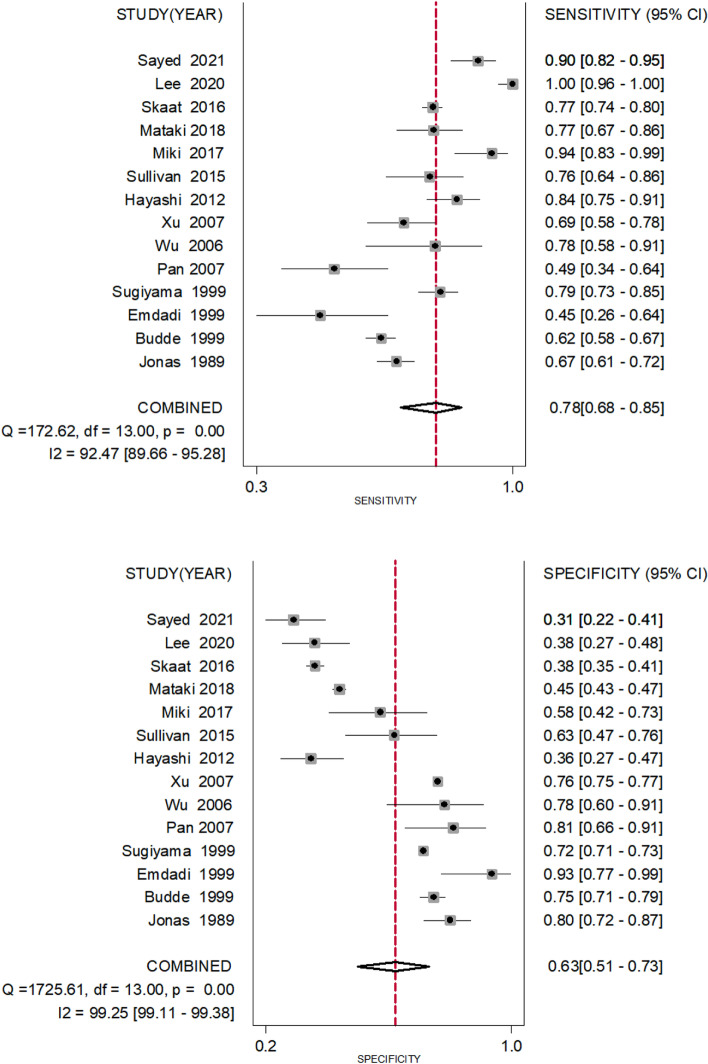
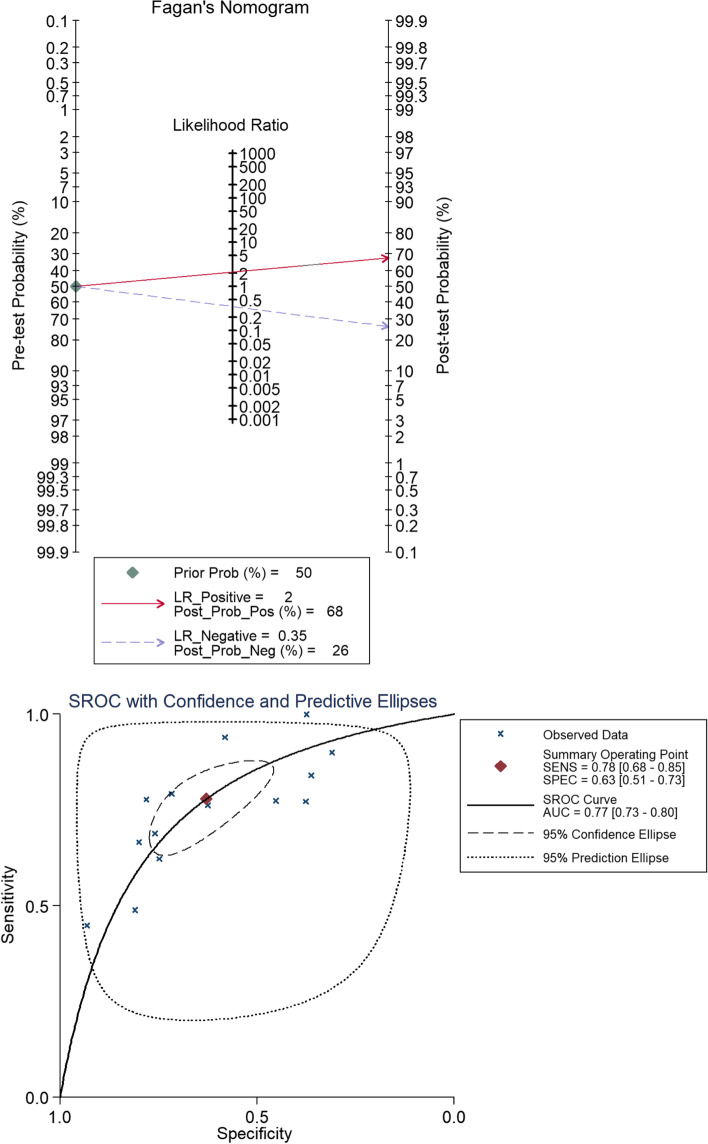
We compiled 2 × 2 tables according to 14 studies of 24 included articles a shown in Table 2. Fig. 6 shows the sensitivity and specificity of β-PPA as a single diagnostic marker for glaucoma, which had sensitivity of 0.78 (95% CI 0.68 to 0.85) and specificity of 0.63 (95% CI 0.51 to 0.73) (Fig. 6). The diagnostic index was 141%. We generated a Fagan figure and symmetric receiver operator characteristic (SROC) curve. According to the Fagan figure, 50% of patients were diagnosed with glaucoma. The possibility increased to 68% in patients with β-PPA, and decreased to 26% in those without β-PPA. The area under the SROC (AUROC)curve was 0.77 (Fig. 7).
Table 2.
Characteristics of studies assessing diagnostic ability of β-PPA
| Study | Numbers of POAG | Numbers of healthy controls | Index test | TP | FP | FN | TN |
|---|---|---|---|---|---|---|---|
| Jonas et al. [2, 24] | 312 | 125 | Clinical diagnosis | 208 | 25 | 104 | 100 |
| Budde and Jonas [21] | 501 | 481 | Clinical diagnosis | 312 | 121 | 189 | 360 |
| Emdadi et al. [20] | 29 | 29 | Clinical diagnosis | 13 | 2 | 16 | 27 |
| Sugiyama [18] | 207 | 11,727 | Glaucomatous optic neuropathy | 164 | 3319 | 43 | 8408 |
| Pan et al. [14] | 45 | 42 | Clinical diagnosis | 22 | 8 | 23 | 34 |
| Wu et al. [13] | 27 | 32 | Clinical diagnosis | 21 | 7 | 6 | 25 |
| Xu et al. [12] | 93 | 3910 | Clinical diagnosis | 64 | 938 | 29 | 2972 |
| Hayashi et al. [9] | 100 | 100 | Clinical diagnosis | 84 | 63 | 16 | 36 |
| Sullivan-Mee et al. [7] | 63 | 48 | Clinical diagnosis | 48 | 18 | 15 | 30 |
| Miki et al. [3] | 50 | 43 | Clinical diagnosis | 47 | 18 | 3 | 25 |
| Mataki et al. [5] | 84 | 2129 | Clinical diagnosis | 65 | 1165 | 19 | 964 |
| Skaat et al. [6] | 801 | 1149 | Glaucomatous optic neuropathy | 618 | 716 | 183 | 433 |
| Lee et al.[33] | 88 | 88 | Clinical diagnosis | 88 | 55 | 0 | 33 |
|
Sayed et al.[35] (SD-OCT) |
100 | 100 | Clinical diagnosis | 90 | 69 | 10 | 31 |
Clinical diagnosis means that ‘POAG’ & ‘healthy controls’ were diagnosed not only by morphology of the optic disc but also by other clinical symptoms, including visual field, IOP and thickness of optic nerve fibre layer. Glaucomatous optic neuropathy means that the researchers only studied the morphology of glaucomatous optic discs
Abbreviations: FN false negative, FP false positive, TN true negative, TP true positive
Sensitivity indicates that the TP rate is equivalent to TP/(TP + FN). Specificity indicates that the TN rate is equivalent to TN/(TN + FP)
Fig. 6.
The sensitivity and specificity of β-PPA as a single diagnostic biomarker. The sensitivity to distinguish true positive for glaucoma was 0.78 (95% CI 0.68 to 0.85); the specificity to distinguish true negative for glaucoma was 0.63 (95% CI 0.51 to 0.73)
Fig. 7.
Fagan’s nomogram and SROC. The post-test probability positive percentage and post-test probability negative percentage were 68% and 26%, respectively, while the prior probability percentage was 50%. The area under the SROC(AUROC) curve was 0.77
Discussion
As glaucoma leads to irreversible blindness, there is a great deal of interest in means to improve the diagnostic ability of OAG. The primary OAG preferred practice pattern guidelines [25] state that parapapillary atrophy is one of the physical features indicating glaucomatous optic neuropathy. The development of parapapillary choroidal atrophy in early glaucoma may precede the onset of visual field defects [26]. According to the definition of β-PPA, logically speaking, Its diagnostic criteria for glaucoma have anatomical and physiological basis. There are no RPE cells in β-PPA. However RPE plays an irreplaceable protective role in retina 0.1.RPE cells absorb light, reduce oxidative damage of other cells. 2.RPE cells maintain strong transport function and local acid–base and ion balance. 3.In addition, it can also provide a variety of neurotrophic substances, such as bFGF, HGF, etc. All in all,whether RPE cell damage is the initial factor or not, ganglion cells in this region without RPE are more vulnerable finally.
This is the first systematic review of the prevalence of β-PPA in OAG eyes. Our meta-analysis of 24 studies indicated that the prevalence of β-PPA in glaucoma patients is very high up to 70%). Subgroup analysis by country revealed different prevalence rates in different countries, with Korea and Japan showing the highest prevalence. This may be related to the high incidence of high myopia in East Asian populations. With elongation of the ocular axis, the uvea of the eyeball becomes thinner, thus increasing the appearance of β-zone PPA. The USA and Germany showed similar prevalence rates of approximately 64%. Skaat reported that Africans with glaucoma exhibited an increased prevalence of β-zone PPA compared with Europeans [6], suggesting that there may be structural differences within the optic nerve complex associated with ethnicity. In contrast, China had the lowest prevalence. It is difficult to explain the observed differences based on race. Further studies in Chinese populations are needed for further analysis. Continued development of fundus imaging technology will allow easier and more accurate confirmation of β-zone PPA. Studies using OCT had the highest prevalence followed by HRA, HRT and fundus photography. This order can be understood easily as fundus photography produces only a two-dimensional image, while OCT provides not only en face images but also B-scans from which more precise and comprehensive parapapillary information can be obtained.
OAG showed passable diagnostic ability for β-zone PPA. However, for clinical use the diagnostic efficiency of this diagnostic tool must be improved. Our meta-analysis indicated several limitations regarding its efficiency. First, it will be necessary to solve the problem of the threshold effect. In this review and most studies, the threshold was ‘0’, indicating that we judged the presence or absence of the β-zone. Advanced OCT can easily distinguish the end point of the RPE, and we can precisely measure the area of the β-zone. It seems better to set a reasonably low limit value. As observed, the threshold values should be different for different races because of the ethnic differences in parapapillary structures. On the other hand, some surveys suggested that the first stage in the process of β-zone PPA progression is the loss of RPE cells, followed by the loss of photoreceptors and, finally, by closure of the chorion. In addition, Dai et al. [27] proposed a more detailed method to divide the β-zone into subregions. These groups referred to these areas as the β-zone and γ-zone, which are bounded by the end point of Bruch’s membrane (BM); some groups also refer to them as βBM + and βBM − , respectively. The β-zone/βBM + was also shown to be associated with glaucoma, while the γ-zone/ βBM − was associated with myopia [3, 28, 29]. The subclassic β-zone is a promising novel tool for diagnosis of glaucoma with high myopia compared to the retinal nerve fibre layer (RNFL) and cup/disc (C/D) ratio. Therefore, another approach to increase the efficiency involves the use of the new subregion method. Refractory/axial length and age may be confounding factors [3, 30–32]; older people or those with longer axial lengths are more likely to have β-zones or larger regions. The threshold should be corrected in these patients based on Big Data analytics. Our analysis also showed that regardless of the observation method used in research after 2010, the sensitivity was greatly improved, while the specificity decreased. This may be due to the improvement of identification of the β-zone by clinicians. Thus, the β-zone has great potential as a negative indicator (high sensitivity and low specificity), i.e. glaucoma can be excluded based on the lack of a β-zone. For example, in the clinic, we often encounter patients with a physiological large optic cup (usually teenagers). When it is not easy to make a judgement based on the shape of the optic disc, if the β-zone is negative, glaucoma can be excluded in these cases. However, only three of the 12 studies included in the meta-analysis were population-based studies (i.e. Sugiyama [18], Xu [12] and Mataki [5]), meaning that our analysis made use of publications describing populations that were enriched for the presence of glaucoma. This would have led to overestimation of the sensitivity of this diagnostic tool. In conclusion, β-PPA is a potential diagnostic marker for OAG. However, a more detailed understanding of the characteristics of β-PPA is needed to improve the ability to identify and predict OAG. The prevalence of β-PPA differs between countries, with a higher incidence in Korea and Japan than in the USA and Germany. The prevalence of β-PPA was also shown to differ according to the method used to obtain images, with the best method being OCT, especially swept-source OTC (SS-OCT). Despite the general ability of β-PPA to diagnose glaucoma, setting an eligible threshold using a more advanced partition method and appropriate correction for race, age and axial length represents a novel and effective approach.
Conclusions
β-PPA is an important potential index for the diagnosis and prognosis of OAG. However, We need more data to define β-PPA precisely through the use of new fundus image acquisition method. More detailed understanding of β-PPA characteristics is needed to improve the ability to predict OAG.
Supplementary Information
Acknowledgements
Not applicable
Abbreviations
- β-PPA
β-Zone parapapillary atrophy
- OAG
Open-angle glaucoma
- NTG
Normal tension glaucoma
- POAG
Primary open-angle glaucoma
- HRT
Heidelberg retina tomography
- HRA
Heidelberg retina angiography
- ICGA
Indocyanine green angiography
- OCT
Optical coherence tomography
- SD-OCT
Spectral-domain OCT
- EDI-OCT
Enhanced depth imaging OCT
- SS-OCT
Swept-source OCT
Authors’ contributions
DMZ and XCD designed the study. DMZ and MDC searched and collected the data. DMZ and XCD assessed the quality of included studies. DMZ and MDC analysed the data. DMZ drafted the manuscript. XCD reviewed and revised the manuscript. All authors have read and agreed to the final manuscript.
Funding
Supported in part by the National Natural Science Foundation of China (Grant No. 81970801 to XD). The funding body played no role in the design of the study and collection, analysis, and interpretation of data and in writing the manuscript.
Availability of data and materials
Not applicable
Declarations
Ethics approval and consent to participate
Not applicable
Consent for publication
Not applicable
Competing interests
The authors declare they have no competing interests.
Footnotes
Publisher's Note
Springer Nature remains neutral with regard to jurisdictional claims in published maps and institutional affiliations.
References
- 1.Jonas JB. Clinical implications of peripapillary atrophy in glaucoma. Curr Opin Ophthalmol. 2005;16(2):84–88. doi: 10.1097/01.icu.0000156135.20570.30. [DOI] [PubMed] [Google Scholar]
- 2.Jonas JB, Nguyen XN, Naumann GO. Parapapillary retinal vessel diameter in normal and glaucoma eyes. I. Morphometric data. Investig Ophthalmol Vis Sci. 1989;30(7):1599–1603. [PubMed] [Google Scholar]
- 3.Miki A, Ikuno Y, Weinreb RN, Yokoyama J, Asai T, Usui S, Nishida K. Measurements of the parapapillary atrophy zones in en face optical coherence tomography images. PLoS One. 2017;12(4):e0175347. doi: 10.1371/journal.pone.0175347. [DOI] [PMC free article] [PubMed] [Google Scholar]
- 4.Manalastas PIC, Belghith A, Weinreb RN, Jonas JB, Suh MH, Yarmohammadi A, Medeiros FA, Girkin CA, Liebmann JM, Zangwill LM. Automated Beta Zone Parapapillary Area Measurement to Differentiate Between Healthy and Glaucoma Eyes. Am J Ophthalmol. 2018;191:140–148. doi: 10.1016/j.ajo.2018.04.021. [DOI] [PMC free article] [PubMed] [Google Scholar]
- 5.Mataki N, Tomidokoro A, Araie M, Iwase A. Beta-peripapillary atrophy of the optic disc and its determinants in Japanese eyes: a population-based study. Acta Ophthalmol. 2018;96(6):e701–706. doi: 10.1111/aos.13702. [DOI] [PubMed] [Google Scholar]
- 6.Skaat A, De Moraes CG, Bowd C, Sample PA, Girkin CA, Medeiros FA, Ritch R, Weinreb RN, Zangwill LM, Liebmann JM. African descent and glaucoma evaluation study (ADAGES): racial differences in optic disc hemorrhage and beta-zone parapapillary atrophy. Ophthalmology. 2016;123(7):1476–1483. doi: 10.1016/j.ophtha.2016.03.025. [DOI] [PMC free article] [PubMed] [Google Scholar]
- 7.Sullivan-Mee M, Patel NB, Pensyl D, Qualls C. Relationship between juxtapapillary choroidal volume and beta-zone parapapillary atrophy in eyes with and without primary open-angle glaucoma. Am J Ophthalmol. 2015;160(4):637–647.e631. doi: 10.1016/j.ajo.2015.06.024. [DOI] [PMC free article] [PubMed] [Google Scholar]
- 8.Kim YW, Lee EJ, Kim TW, Kim M, Kim H. Microstructure of β-zone parapapillary atrophy and rate of retinal nerve fiber layer thinning in primary open-angle glaucoma. Ophthalmology. 2014;121(7):1341–1349. doi: 10.1016/j.ophtha.2014.01.008. [DOI] [PubMed] [Google Scholar]
- 9.Hayashi K, Tomidokoro A, Lee KYC, Konno S, Saito H, Mayama C, Aihara M, Iwase A, Araie M. Spectral-domain optical coherence tomography of β-zone peripapillary atrophy: influence of myopia and glaucoma. Investig Ophthalmol Vis Sci. 2012;53(3):1499–1505. doi: 10.1167/iovs.11-8572. [DOI] [PubMed] [Google Scholar]
- 10.Lee EJ, Kim TW, Weinreb RN, Park KH, Kim SH, Kim DM. β-Zone parapapillary atrophy and the rate of retinal nerve fiber layer thinning in glaucoma. Investig Ophthalmol Vis Sci. 2011;52(7):4422–4427. doi: 10.1167/iovs.10-6818. [DOI] [PubMed] [Google Scholar]
- 11.Teng CC, De Moraes CG, Prata TS, Tello C, Ritch R, Liebmann JM. Beta-Zone parapapillary atrophy and the velocity of glaucoma progression. Ophthalmology. 2010;117(5):909–915. doi: 10.1016/j.ophtha.2009.10.016. [DOI] [PubMed] [Google Scholar]
- 12.Xu L, Wang Y, Yang H, Jonas JB. Differences in parapapillary atrophy between glaucomatous and normal eyes: the Beijing eye study. Am J Ophthalmol. 2007;144(4):541–546. doi: 10.1016/j.ajo.2007.05.038. [DOI] [PubMed] [Google Scholar]
- 13.Wu LL, Chen W, Chen ZQ, Yin JF, Zhou H, Liu J, Su ZA. Indocyanine green and fluorescein angiography study of glaucomatous peripapillary atrophy. Chin J Ophthalmol. 2006;42(11):967–971. [PubMed] [Google Scholar]
- 14.Pan YZ, Ren ZQ, Li M, Qiao RH. Peripapillary atrophies in primary open-angle glaucoma and glaucoma-like normal disks. Chin J Ophthalmol. 2006;42(12):1078–1083. [PubMed] [Google Scholar]
- 15.Duan X, Wang M, Jiang Y, Jiang B, Shi J, Tang C, Jiang Y. The relationship between peripapillary choroidal atrophy and visual field defects in open angle glaucoma. Yan Ke Xue Bao. 2006;22(2):71–75. [PubMed] [Google Scholar]
- 16.Budde WM, Jonas JB. Influence of cilioretinal arteries on neuroretinal rim and parapapillary atrophy in glaucoma. Investig Ophthalmol Vis Sci. 2003;44(1):170–174. doi: 10.1167/iovs.02-0651. [DOI] [PubMed] [Google Scholar]
- 17.Park KH, Park SJ, Lee YJ, Kim JY, Caprioli J. Ability of peripapillary atrophy parameters to differentiate normal-tension glaucoma from glaucomalike disk. J Glaucoma. 2001;10(2):95–101. doi: 10.1097/00061198-200104000-00005. [DOI] [PubMed] [Google Scholar]
- 18.Sugiyama K, Tomita G, Kawase K, Onda E, Shinohara H, Hayakawa T, Kitazawa Y. Disc hemorrhage and peripapillary atrophy in apparently healthy subjects. Acta Ophthalmol Scand. 1999;77(2):139–142. doi: 10.1034/j.1600-0420.1999.770204.x. [DOI] [PubMed] [Google Scholar]
- 19.Kono Y, Zangwill L, Sample PA, Jonas JB, Emdadi A, Gupta N, Weinreb RN. Relationship between parapapillary atrophy and visual field abnormality in primary open-angle glaucoma. Am J Ophthalmol. 1999;127(6):674–680. doi: 10.1016/S0002-9394(99)00045-8. [DOI] [PubMed] [Google Scholar]
- 20.Emdadi A, Kono Y, Sample PA, Maskaleris G, Weinreb RN. Parapapillary atrophy in patients with focal visual field loss. Am J Ophthalmol. 1999;128(5):595–600. doi: 10.1016/S0002-9394(99)00189-0. [DOI] [PubMed] [Google Scholar]
- 21.Budde WM, Jonas JB. Morphology of the optic disc in glaucoma. II. Secondary chronic open- angle glaucomas. Klin Monatsbl Augenheilkd. 1999;215(4):221–227. doi: 10.1055/s-2008-1034703. [DOI] [PubMed] [Google Scholar]
- 22.Tezel G, Kass MA, Kolker AE, Wax MB. Comparative optic disc analysis in normal pressure glaucoma, primary open-angle glaucoma, and ocular hypertension. Ophthalmology. 1996;103(12):2105–2113. doi: 10.1016/S0161-6420(96)30382-5. [DOI] [PubMed] [Google Scholar]
- 23.Park KH, Tomita G, Liou SY, Kitazawa Y. Correlation between peripapillary atrophy and optic nerve damage in normal-tension glaucoma. Ophthalmology. 1996;103(11):1899–1906. doi: 10.1016/S0161-6420(96)30409-0. [DOI] [PubMed] [Google Scholar]
- 24.Jonas JB, Nguyen XN, Gusek GC, Naumann GOH. Parapapillary chorioretinal atrophy in normal and glaucoma eyes I. Morphometric data. Investig Ophthalmol Vis Sci. 1989;30(5):908–918. [PubMed] [Google Scholar]
- 25.Prum BE, Rosenberg LF, Gedde SJ, Mansberger SL, Stein JD, Moroi SE, Herndon LW, Lim MC, Williams RD. Primary Open-Angle Glaucoma Preferred Practice Pattern(®) Guidelines. Ophthalmology. 2016;123(1):P41–111. doi: 10.1016/j.ophtha.2015.10.053. [DOI] [PubMed] [Google Scholar]
- 26.Teng CC, De Moraes CG, Prata TS, Liebmann CA, Tello C, Ritch R, Liebmann JM. The region of largest β-zone parapapillary atrophy area predicts the location of most rapid visual field progression. Ophthalmology. 2011;118(12):2409–2413. doi: 10.1016/j.ophtha.2011.06.014. [DOI] [PubMed] [Google Scholar]
- 27.Dai Y, Jonas JB, Huang H, Wang M, Sun X. Microstructure of parapapillary atrophy: beta zone and gamma zone. Investig Ophthalmol Vis Sci. 2013;54(3):2013–2018. doi: 10.1167/iovs.12-11255. [DOI] [PubMed] [Google Scholar]
- 28.Kim M, Kim TW, Weinreb RN, Lee EJ. Differentiation of parapapillary atrophy using spectral-domain optical coherence tomography. Ophthalmology. 2013;120(9):1790–1797. doi: 10.1016/j.ophtha.2013.02.011. [DOI] [PubMed] [Google Scholar]
- 29.Jonas JB, Wang YX, Zhang Q, Fan YY, Xu L, Wei WB, Jonas RA. Parapapillary gamma zone and axial elongation-associated optic disc rotation: the Beijing eye study. Investig Ophthalmol Vis Sci. 2016;57(2):396–402. doi: 10.1167/iovs.15-18263. [DOI] [PubMed] [Google Scholar]
- 30.Vianna JR, Malik R, Danthurebandara VM, Sharpe GP, Belliveau AC, Shuba LM, Chauhan BC, Nicolela MT. Beta and gamma peripapillary atrophy in myopic eyes with and without glaucoma. Investig Ophthalmol Vis Sci. 2016;57(7):3103–3111. doi: 10.1167/iovs.16-19646. [DOI] [PubMed] [Google Scholar]
- 31.Suzuki Y, Iwase A, Araie M, Yamamoto T, Abe H, Shirato S, Kuwayama Y, Mishima H, Shimizu H, Tomita G, et al. Risk factors for open-angle glaucoma in a Japanese population: the Tajimi Study. Ophthalmology. 2006;113(9):1613–1617. doi: 10.1016/j.ophtha.2006.03.059. [DOI] [PubMed] [Google Scholar]
- 32.Gordon MO, Beiser JA, Brandt JD, Heuer DK, Higginbotham EJ, Johnson CA, Keltner JL, Miller JP, Parrish RK, Wilson MR, et al. The ocular hypertension treatment study: baseline factors that predict the onset of primary open-angle glaucoma. Arch Ophthalmol. 2002;120(6):714–720. doi: 10.1001/archopht.120.6.714. [DOI] [PubMed] [Google Scholar]
- 33.Lee EJ, Kim J-A, Kim T-W, Kim H, Yang HK, Hwang J-M. Glaucoma-like Parapapillary Choroidal Microvasculature Dropout in Patients with Compressive Optic. Ophthalmology. 2020;127(12):1652–1662. doi: 10.1016/j.ophtha.2020.06.001. [DOI] [PubMed] [Google Scholar]
- 34.Lee J, Park CK, Jung KI. Characteristics of progressive temporal visual field defects in patients with myopia. Sci Rep. 2021;11(1):1–12. doi: 10.1038/s41598-020-79139-8. [DOI] [PMC free article] [PubMed] [Google Scholar]
- 35.Sayed SY, Raafat KA, Ahmed RA, Allam RSHM. Evaluation of peripapillary atrophy in early open-angle glaucoma using autofluorescence combined with optical coherence tomography. Int Ophthalmol. 2021;41(7):2405–2415. doi: 10.1007/s10792-021-01795-0. [DOI] [PubMed] [Google Scholar]
Associated Data
This section collects any data citations, data availability statements, or supplementary materials included in this article.
Supplementary Materials
Data Availability Statement
Not applicable


