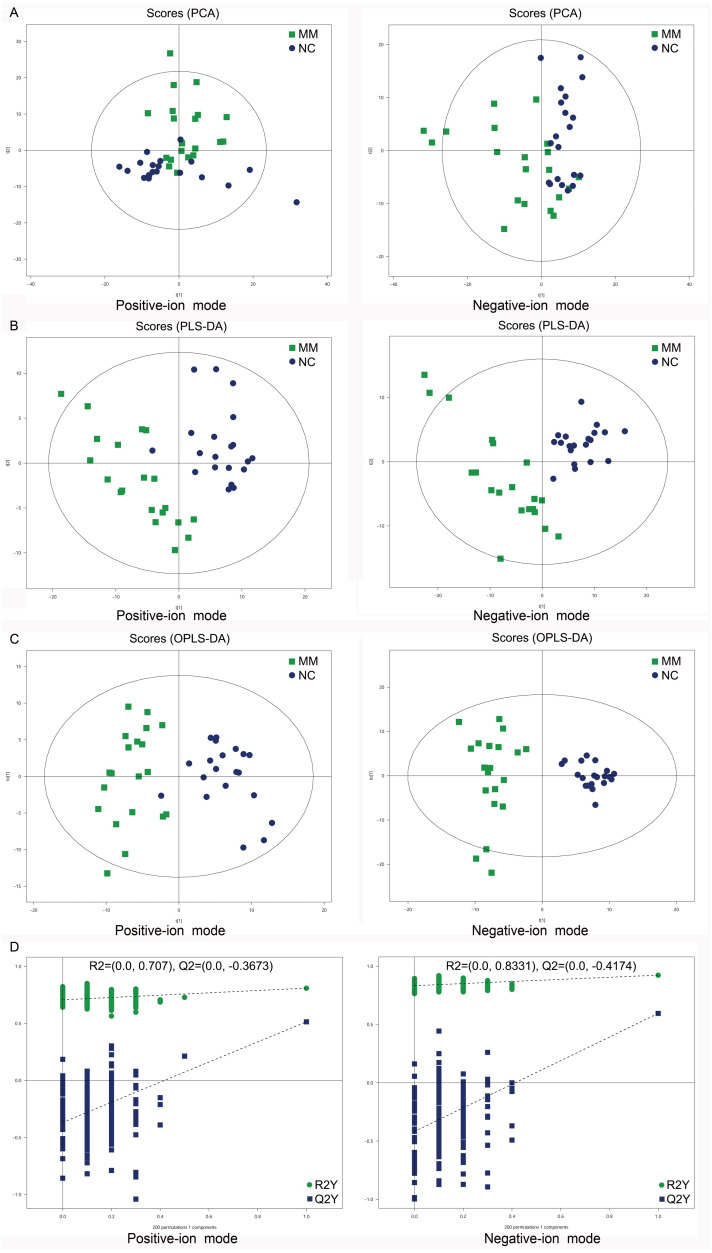
Figure 2. Score plots of supervised PCA, PLS-DA, and OPLS-DA analysis based on the combination of UHPLC-Q-TOF/MS data from MM patients and NC.
(A) PCA score plots between MM patients and normal controls (NC) in both positive-ion and negative-ion modes. (B) PLS-DA score plots between MM patients and normal controls (NC) in both modes. (C) OPLS-DA score plots between MM patients and normal controls (NC) in both modes. (D) Permutation tests consisting of 200 permutations demonstrated that the OPLS-DA model was not overfitted in either mode.

