Abstract
Introduction
Vertebral instability (VI) in osteoporotic vertebral fractures (OVFs) varies from mild to severe. The relationship between the VI of OVFs and independent factors, such as bone mineral density (BMD) and lumbar muscle volume, is unclear. This study aimed to investigate whether BMD and the cross-sectional area (CSA) of lumbar muscles are related to VI in OVFs.
Methods
On the basis of the thoracolumbar lateral radiographs of 95 acute OVFs in postmenopausal women (mean age 80.6 years; range: 64-103 years), supine and standing vertebral collapse rates (CRsp and CRst, respectively) were determined. Subsequently, VI was defined as follows: VI=CRst−CRsp. Using axial T2-weighted magnetic resonance imaging (MRI), CSA of the psoas major, erector spinae, and multifidus muscles at the L3/4 intervertebral disc level were measured. The BMD of the lumbar spine and proximal femur (total hip) was measured for all participants using dual-energy X-ray absorptiometry. The patients were classified into group 1 (VI <20%) and group 2 (VI ≥20%).
Results
We observed a negative correlation between VI and CSA of the erector spinae muscle (r=−0.3962, P<0.0001). No significant correlations were observed between VI and BMD. The CSA of the erector spinae muscle in group 2 was significantly lower than that in group 1 (P=0.0002). No significant difference in the BMD or the CSA of the psoas major or multifidus muscles was observed between the two groups. A multivariable analysis of factors of VI was performed. Both age (odds ratio [OR], 1.099; 95% confidence interval [CI], 1.015-1.189; P=0.020) and the CSA of the erector spinae (OR, 0.996; 95% CI, 0.993-0.999; P=0.020) were significant predictors of high VI.
Conclusions
Although the severity of OVFs was related to the CSA of the erector spinae muscle, it was not associated with BMD.
Keywords: osteoporotic vertebral fractures, cross-sectional area, lumbar paraspinal muscles, vertebral instability, standing and supine radiographs
Introduction
Osteoporotic vertebral fractures (OVFs) are fragility fractures associated with osteoporosis. Osteoporosis commonly affects postmenopausal women because estrogen deficiency after menopause induces rapid bone loss, and OVFs are a major cause of morbidity and reduce activities of daily living among the elderly1). Previous studies indicated that sarcopenia was significantly associated with osteoporosis and was a risk factor for OVFs2-4).
Sarcopenia is considered one of the main features of the aging process. It is characterized by a reduction in muscle mass and strength5). Observational studies have shown that sarcopenia and a decreased cross-sectional area (CSA) of the paraspinal muscle are risk factors for OVFs2). Weakened psoas major muscles have been found to lessen hip flexion velocity, cause gait disturbances, and be closely related to falling when walking6). Similarly, studies have reported a relationship between the quality of paraspinal muscles, such as the erector spinae and multifidus, and the maintenance of a stable standing position7). Additionally, muscular imbalance may deteriorate the sagittal curvature of the vertebrae and limit the range of motion3).
Vertebral instability (VI) in OVFs varies from mild to severe. Changes in vertebral height from standing to supine radiographs after the initial injury frequently reveal the instability of the fracture.
Muscular strength is proportional to the CSA of the muscle, and the CSA measurement is typically used to evaluate lumbar muscular strength8). Although many studies have reported that weaknesses of lumbar muscles are related to OVFs9,10), there is uncertainty on the association between the CSA of lumbar muscles and VI.
In this study, we aimed to assess the relationship between the VI of OVFs in postmenopausal women, bone mineral density (BMD), and the CSA of lumbar muscles in an acute setting using quantitative volumetric measurements.
Materials and Methods
Informed consent was obtained from all participants prior to the start of the study. The study was approved by our Institutional Review Board and was conducted according to the principles of the Declaration of Helsinki.
In total, 95 acute OVFs at the thoracolumbar junction (Th10-L2) in postmenopausal women (mean age: 80.6 years, range 64-103 years) were included in this study. Fractures were considered acute if the interval between the onset of symptoms and the admission was <2 weeks, the standing and supine thoracolumbar lateral radiographs showed vertebral collapse, and magnetic resonance imaging (MRI) showed an abnormal signal change in the vertebral body. Trauma more severe than a simple fall from a standing position on level ground, secondary osteoporosis, postoperative status, pathological fractures, infection, lumbar scoliosis (Cobb angle >20), and diffuse idiopathic skeletal hyperostosis were excluded.
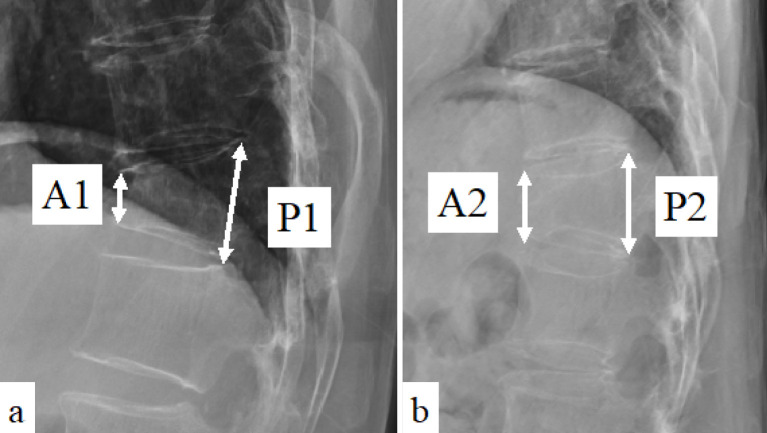
Patient demographics included age, body mass index (BMI), and fracture level. (When more than one fracture was present, the one that was more collapsed was used.) Standing and supine radiographs were obtained on admission. The heights of the anterior and posterior walls of the fractured vertebrae were measured on the lateral standing radiograph (A1 and P1, respectively) and the supine radiograph (A2 and P2, respectively) (Fig. 1). The standing and supine vertebral collapse rates (%) (CRst and CRsp, respectively) were defined as follows:
Figure 1.
Lateral radiographs of thoracolumbar spine.
Anterior and posterior vertebral body height of standing (A1 and P1, respectively) and supine (A2 and P2, respectively) lateral radiographs.
CRst=(1−A1/P1)×100 and CRsp=(1−A2/P2)×100, respectively. VI (%) was defined as the difference in vertebral collapse rates between the standing and supine collapse rates: VI=CRst−CRsp11,12).
All MRI scans were performed using 3.0-T scanners (Magnetom Skyra, Siemens Healthineers, Erlangen, Germany). Using axial T2-weighted MRI images at the L3/4 intervertebral disc level, the bilateral psoas major, erector spinae, and multifidus muscles were measured, and the mean values were adopted for each muscle. Moreover, the total CSA of all these muscles was recorded13,14). For each image, the region of interest was drawn using the hospital picture archiving and communication system (I-PACS, NEOVISTA I-PACS, ver. 1.09 R04; KONICA MINOLTA, Japan) to outline the bilateral muscles separately (Fig. 2). The fat infiltration of the para-spinal muscle was measured semi-quantitatively with three visual scale grades15). The scale defined the mild, moderate, and severe grades as a fat portion <10%, between 10% and 50%, and >50%, respectively.
Figure 2.
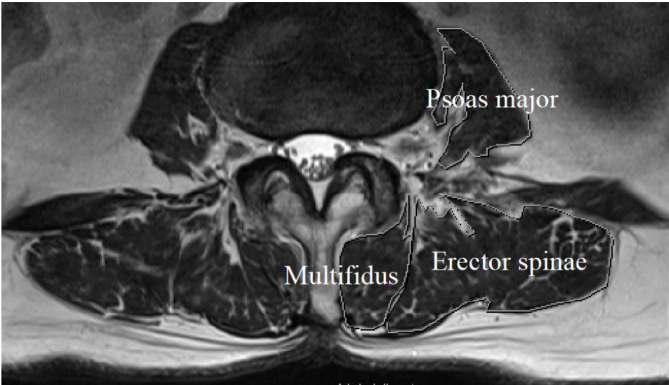
A magnetic resonance image (MRI).
A MRI axial image shows the cross-sectional area of the muscles at the L3/4 disc level. Cross sections of the psoas major, erector spinae, and multifidus muscles are drawn.
A dual-energy X-ray absorptiometry scan (Lunar Prodigy; GE Healthcare, Chicago, IL, USA) was performed to measure the BMD of the lumbar region of the spine (L1-L4) and the proximal femur (total hip). Instead, of vertebral BMD, proximal femur BMD was used for data analysis because vertebral fractures and osteophytes are known to lead to falsely high BMD values.
According to our previous report12), we classified patients into a VI of 20%, which was calculated as the threshold value for resistance to conservative treatment. We classified patients into two groups according to the calculated VI: group 1 (VI <20%) and group 2 (VI ≥20%). We compared the BMD and CSA of each muscle between the groups (Table 1).
Table 1.
Patient Demographic Data.
| Variable | Number of patients
(n=95) |
Group 1
(n=67) |
Group 2
(n=28) |
P value |
|---|---|---|---|---|
| Age (yr) | 80.6 (64–103) | 78.9 (64–96) | 84.8 (70–103) | 0.0009 |
| BMI (kg/m2) | 22.0 (16.0–31.2) | 22.1 (12.0–32.2) | 21.7 (15.6–29.8) | 0.6190 |
| Level (n) | ||||
| T10 | 4 | 3 | 1 | |
| T11 | 8 | 5 | 3 | |
| T12 | 36 | 26 | 10 | 0.3339 |
| L1 | 36 | 28 | 8 | |
| L2 | 11 | 5 | 6 |
Data are expressed as mean±standard deviation.
BMI, body mass index
Because the samples were not normally distributed and the data are presented as the median and range, nonparametric tests were used for further analyses. The Mann-Whitney U test was used to compare the unpaired groups. The Spearman correlation coefficient was calculated to assess the relationship between variables. To determine the risk factors for high VI (VI ≥20%), multivariable regression analysis was performed. Differences were considered to be statistically significant at P<0.05, and all statistical analyses were performed using the Prism8 statistical package (GraphPad Software, USA) and SPSS Statistics ver. 26.0 (IBM Co., USA).
Results
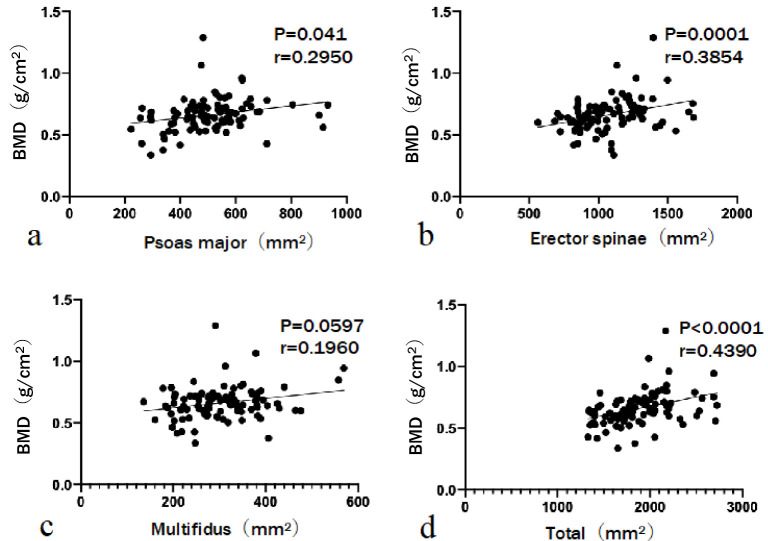
The relationship between the CSA of lumbar muscles and BMD in the OVFs is shown in Fig. 3. Although BMD was positively correlated with the CSA of the psoas major (r=0.2950, P=0.041), erector spinae (r=0.3854, P=0.0001), and total muscle (r=0.4390, P<0.0001), it was not significantly correlated with the CSA of the multifidus muscle (r=0.1960, P=0.0597).
Figure 3.
The relationship between bone mineral density (BMD) and the cross-sectional area (CSA) of lumbar muscles.
BMD is positively correlated with the CSA of the psoas major, erector spinae, and total muscle.
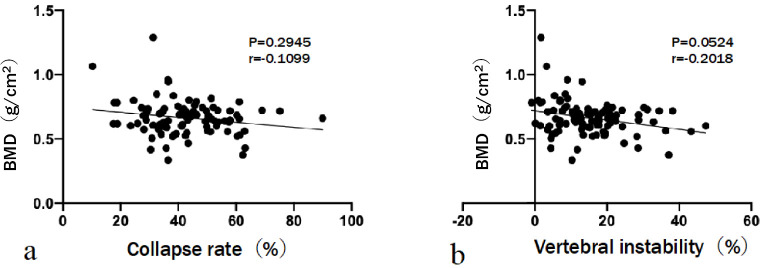
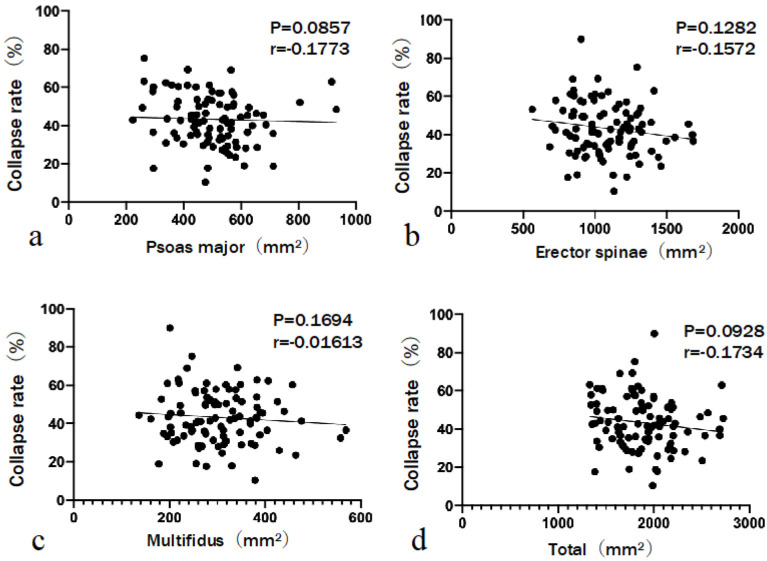
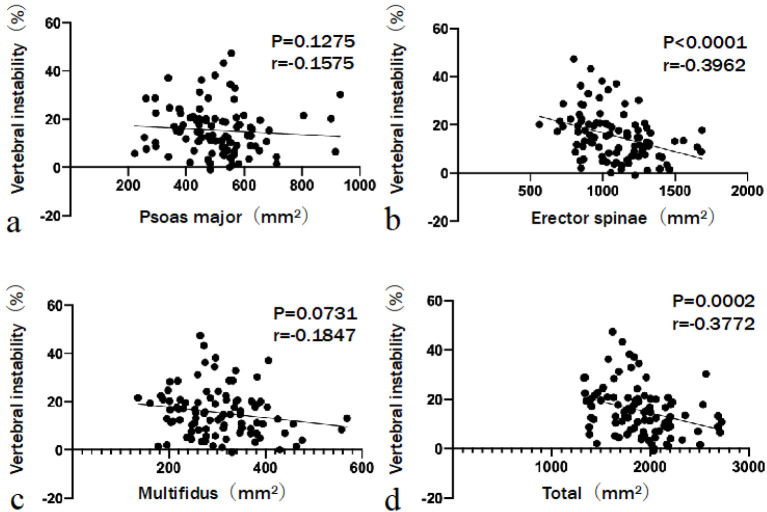
The relationship between BMD and CRst was not significant (r=−0.1099, P=0.2945). Similarly, the relationship between BMD and VI was not significant (r=−0.2018, P=0.0524) (Fig. 4). CRst was not significantly correlated with the CSA of the psoas major (r=−0.1773, P=0.0857), erector spinae (r=−0.1572, P=0.1282), multifidus (r=−0.01613, P=0.1694), and total muscle (r=−0.1734, P=0.0928) (Fig. 5). A negative correlation was observed between VI and the CSA of the erector spinae (r=−0.3962, P<0.0001) and total muscle (r=−0.3772, P=0.0002). The CSAs of the psoas major and multifidus muscles did not significantly correlate with VI (r=−0.1575, P=0.1275 and r=−0.1847, P=0.0731, respectively) (Fig. 6). No statistically significant difference in BMD (P=0.7102) or CSA of the psoas major (P=0.1804) or multifidus (P=0.2505) muscles was observed between the groups. However, group 2 had a significantly smaller mean CSA of the erector spinae (P=0.0002) and total muscle (P=0.0009) than group 1. Three grades were evaluated on the basis of the fat infiltration of the paraspinal muscle. The number of patients with mild grade was 23 (34.3%) in group 1 and 4 (14.2%) in group 2. Patients with moderate and severe grades were 31 (46.3%) and 13 (19.4%) in group 1 and 13 (46.4%) and 11 (39.3%) in group 2, respectively. Additionally, patients in group 2 tended to have a higher grade of fat infiltration than those in group 1 (P=0.020) (Table 2). Multivariable analysis was performed. The dependent variable was the severity of VI (either VI ≥20% or VI <20%). Covariates were age, BMI, CSA of psoas major, CSA of erector spinae, and fat infiltration. Both age (odds ratio [OR], 1.099; 95% confidence interval [CI], 1.015-1.189; P=0.020) and the CSA of the erector spinae (OR, 0.996; 95% CI, 0.993-0.999; P=0.020) were significant predictors of high VI (Table 3).
Figure 4.
The relationship between bone mineral density (BMD) and radiographic parameters.
The relationship between BMD and collapse rate or vertebral instability is not significant.
Figure 5.
The relationship between standing collapse rate and the cross-sectional area (CSA) of lumbar muscles.
The standing collapse rate is not significantly correlated with the CSA of the psoas major, erector spinae, multifidus, and total muscle.
Figure 6.
The relationship between vertebral instability and the cross-sectional area (CSA) of lumbar muscles.
The CSA of the erector spinae and total muscle is negatively correlated with vertebral instability.
Table 2.
BMD and CSA Differences between Groups 1 and 2.
| Number of patients
(n=95) |
Group 1
(n=67) |
Group 2
(n=28) |
P value | |
|---|---|---|---|---|
| BMD (g/cm2) | 0.662±0.13 | 0.663±0.11 | 0.631±0.11 | 0.2226 |
| Psoas major (mm2) | 506.67±133.74 | 511.44±86.03 | 495.27±55.08 | 0.1804 |
| Erector spinae (mm2) | 1080.20±229.99 | 1135.7±142.58 | 947.42±211.58 | 0.0002 |
| Multifidus (mm2) | 304.49±82.45 | 313.21±35.33 | 283.61±146.93 | 0.2505 |
| Total (mm2) | 1891.36±338.04 | 1960.34±337.06 | 1726.29±277.86 | 0.0009 |
| Fat infiltration | ||||
| Mild | 27 | 23 | 4 | |
| Moderate | 44 | 31 | 13 | |
| Severe | 24 | 13 | 11 | 0.020 |
Data are expressed as mean±standard deviation.
BMD, bone mineral density; CSA, cross-sectional area
Table 3.
Multiple Logistic Regression Analysis of Factors Associated with the Severity of Vertebral Instability.
| Variable | B | Odds ratio | 95%CI | P value |
|---|---|---|---|---|
| Age (yr) | 0.094 | 1.099 | 1.015–1.189 | 0.020 |
| BMD (g/cm2) | −0.973 | 0.378 | 0.001–128.920 | 0.744 |
| Psoas major (mm2) | 0.002 | 1.002 | 0.998–1.006 | 0.400 |
| Erector spinae (mm2) | −0.004 | 0.996 | 0.994–0.999 | 0.020 |
| Fat infiltration | 0.160 | 1.173 | 0.556–2.476 | 0.675 |
BMD, bone mineral density, CI, confidence interval
Discussion
The CSA of the erector spinae was negatively correlated with increased VI in OVFs. This result provides the first quantitative evidence that a smaller erector spinae muscle may contribute to VI of OVFs in postmenopausal women. We observed a close relationship between BMD and the CSAs of the psoas major and erector spinae muscles. The relationship between BMD and the collapse rate or VI was not significant. The mean CSA of the erector spinae muscle was significantly lower in group 2 than in group 1, suggesting that this muscle is typically smaller in patients with severe VI of OVFs. The age and fat infiltration differed significantly between groups 1 and 2. Multiple logistic regression analysis revealed that both age and erector spinae affect the severity of OVFs.
Both muscle and bone are important in maintaining skeletal structure and strength. Muscle mass contributes to bone mineral mass16). Sarcopenia has been reported to be an independent risk factor for a low BMD of the femoral neck and lumbar spine17). With increasing age, the weakening of muscle contractions results in a decrease in bone marrow longitudinal stress18). Reduced loading, mechanical stimulation, and relative immobility can cause decreased bone formation. Clinical studies have shown that loss of muscle mass occurs concurrently with osteoporosis19).
Previous studies have reported that the risk factors of a delayed union in OVFs are the thoracolumbar junction location, diffuse low- and high-signal changes on T2 weighted MRI20), and the presence of a posterior wall fracture with displacement21). Other studies have reported that VI is involved in conservative resistance in OVFs11,12). We believe that cases with severe VI are refractory to conservative treatment, associated with clinical findings, and reflect severity.
Lumbar extensor muscles influence the compression fracture of vertebrae as a stabilizer22,23), and an association between OVFs and paraspinal muscle atrophy and fat infiltration was reported2). In our study, the atrophy of the erector spinae muscle was correlated with VI. A reduction in the size of the erector spinae muscle may decrease the protective factor of the spine from trauma, leading to VI. Muscle atrophy and fat infiltration progress with aging and, thus, sarcopenia. In this study, besides aging, multivariate analysis showed that the atrophy of the erector spinae muscle was significantly associated with VI. This confirms that the erector spinae plays a role in protecting the vertebrae.
To our knowledge, this is the first study investigating the relationship between BMD, CSA of lumbar muscles, and VI in OVFs. We observed a negative correlation between the CSA of the erector spinae muscle and VI of OVFs. Moreover, it was observed that the CSA of the erector spinae muscle decreased significantly when the VI was ≥20%. These results indicate that smaller erector spinae muscles may contribute to the poor stabilizing ability of the spine, resulting in greater vulnerability to OVFs, ultimately playing a role in the severity and prognosis of OVFs.
The present study has several limitations. First, this study is cross-sectional and not longitudinal. Second, we included only Japanese women with low BMDs. Similarly, this study is retrospective in nature because of the sampling problems that are inherent to this mode of investigation. Third, this study used only the MRI at the L3/4 intervertebral disc level; therefore, it is necessary to measure those at other levels in future studies and conduct related investigations. Fourth, we did not conduct a quantitative evaluation of fat infiltration; thus, additional research will be required in the future. Finally, this study did not consider confounding factors affecting OVFs, such as osteoporosis treatment. In the future, it will be necessary to consider patient matching to remove the influence of confounding factors.
Further studies are needed to demonstrate a correlation between lumbar muscle volume and VI both in terms of physio-pathological and clinical aspects. Increasing the awareness of these conditions will improve the therapeutic approach that counteracts the onset of disabling complications.
Conclusions
The study results suggest that there is a correlation between decreased BMD and CSA of erector spinae and psoas major muscles in postmenopausal women with OVFs. The CSA of the erector spinae muscle is negatively correlated with VI.
Conflicts of Interest: The authors declare that there are no relevant conflicts of interest.
Sources of Funding: none
Author Contributions: Shun Okuwaki wrote and prepared the manuscript, and Toru Funayama and Akira Ikumi participated in the study design and analysis of the data. All authors reviewed and approved the manuscript.
Ethical Approval: Ethical approval was obtained from the Kenpoku Medical Center Takahagi Kyodo Hospital's institutional ethics committee (application no. 8).
Informed Consent: Informed consent was obtained from all participants in this study.
Acknowledgement
The authors thank Ms. Kanako Suzuki, a doctor's assistant, for her assistance with data collection.
References
- 1.Bliuc D, Nguyen ND, Milch VE, et al. Mortality risk associated with low-trauma osteoporotic fracture and subsequent fracture in men and women. JAMA. 2009;301(5):513-21. [DOI] [PubMed] [Google Scholar]
- 2.Kim JY, Chae SU, Kim GD, et al. Changes of paraspinal muscles in postmenopausal osteoporotic spinal compression fractures: magnetic resonance imaging study. J Bone Metab. 2013;20(2):75-81. [DOI] [PMC free article] [PubMed] [Google Scholar]
- 3.Sinaki M, Khosla S, Limburg PJ, et al. Muscle strength in osteoporotic versus normal women. Osteoporos Int. 1993;3(1):8-12. [DOI] [PubMed] [Google Scholar]
- 4.Cunha-Henriques S, Costa-Paiva L, Pinto-Neto AM, et al. Postmenopausal women with osteoporosis and musculo-skeletal status: a comparative cross-sectional study. J Clin Med Res. 2011;3(4):168-76. [DOI] [PMC free article] [PubMed] [Google Scholar]
- 5.American Society of Clinical Nutrition. Epidemiologic and methodologic problems in determining nutritional status of older persons. Proceedings of a conference. Albuquerque, New Mexico, October 19-21, 1988. Am J Clin Nutr. 1989;50(5 Suppl):1121-235. [PubMed] [Google Scholar]
- 6.Takahashi K, Takahashi HE, Nakadaira H, et al. Different changes of quantity due to aging in the psoas major and quadriceps femoris muscles in women. J Musculoskelet Neuronal Interact. 2006;6(2):201-5. [PubMed] [Google Scholar]
- 7.Miyakoshi N, Hongo M, Maekawa S, et al. Factors related to spinal mobility in patients with postmenopausal osteoporosis. Osteoporos Int. 2005;16(12):1871-4. [DOI] [PubMed] [Google Scholar]
- 8.Maughan RJ. Relationship between muscle strength and muscle cross-sectional area. Implications for training. Sports Med. 1984;1(4):263-9. [DOI] [PubMed] [Google Scholar]
- 9.Ikezoe T, Mori N, Nakamura M, et al. Age-related muscle atrophy in the lower extremities and daily physical activity in elderly women. Arch Gerontol Geriatr. 2011;53(2):e153-7. [DOI] [PubMed] [Google Scholar]
- 10.Iolascon G, Giamattei MT, Moretti A, et al. Sarcopenia in women with vertebral fragility fractures. Aging Clin Exp Res. 2013;25(Suppl 1):S129-31. [DOI] [PubMed] [Google Scholar]
- 11.Toyone T, Tanaka T, Wada Y, et al. Changes in vertebral wedging rate between supine and standing position and its association with back pain: a prospective study in patients with osteoporotic vertebral compression fractures. Spine (Phila Pa 1976). 2006;31(25):2963-6. [DOI] [PubMed] [Google Scholar]
- 12.Funayama T, Tsukanishi T, Fujii K, et al. Characteristic imaging findings predicting the risk of conservative treatment resistance in fresh osteoporotic vertebral fractures with poor prognostic features on magnetic resonance imaging. J Orthop Sci. 2021;25(21):41-5. [DOI] [PubMed] [Google Scholar]
- 13.Wang WF, Lin CW, Xie CN, et al. The association between sarcopenia and osteoporotic vertebral compression refractures. Osteoporos Int. 2019;30(12):2459-67. [DOI] [PubMed] [Google Scholar]
- 14.Huang CWC, Tseng IJ, Yang SW, et al. Lumbar muscle volume in postmenopausal women with osteoporotic compression fractures: quantitative measurement using MRI. Eur Radiol. 2019;29(9):4999-5006. [DOI] [PubMed] [Google Scholar]
- 15.Kang CH, Shin MJ, Kim SM, et al. MRI of paraspinal muscles in lumbar degenerative kyphosis patients and control patients with chronic low back pain. Clin Radiol. 2007;62(5):479-86. [DOI] [PubMed] [Google Scholar]
- 16.Riggs BL, Wahner HW, Melton LJ 3rd, et al. Rates of bone loss in the appendicular and axial skeletons of women. Evidence of substantial vertebral bone loss before menopause. J Clin Invest. 1986;77(5):1487-91. [DOI] [PMC free article] [PubMed] [Google Scholar]
- 17.Grimby G, Saltin B. The ageing muscle. Clin Physiol. 1983;3(3):209-18. [DOI] [PubMed] [Google Scholar]
- 18.Wu CH, Yang KC, Chang HH, et al. Sarcopenia is related to increased risk for low bone mineral density. J Clin Densitom. 2013;16(1):98-103. [DOI] [PubMed] [Google Scholar]
- 19.Hida T, Ishiguro N, Shimokata H, et al. High prevalence of sarcopenia and reduced leg muscle mass in Japanese patients immediately after a hip fracture. Geriatr Gerontol Int. 2013;13(2):413-20. [DOI] [PubMed] [Google Scholar]
- 20.Tsujio T, Nakamura H, Terai H, et al. Characteristic radiographic or magnetic resonance images of fresh osteoporotic vertebral fractures predicting potential risk for nonunion. Spine (Phila Pa 1976). 2011;36(15):1229-35. [DOI] [PubMed] [Google Scholar]
- 21.Nakano M, Kawaguchi Y, Kimura T, et al. Transpedicular vertebroplasty after intravertebral cavity formation versus conservative treatment for osteoporotic burst fractures. Spine J. 2014;14(1):39-48. [DOI] [PubMed] [Google Scholar]
- 22.Briggs AM, Greig AM, Wark JD, et al. A review of anatomical and mechanical factors affecting vertebral body integrity. Int J Med Sci. 2004;1(3):170-80. [DOI] [PMC free article] [PubMed] [Google Scholar]
- 23.Ignasiak D, Valenzuela W, Reyes M, et al. The effect of muscle ageing and sarcopenia on spinal segmental loads. Eur Spine J. 2018;27(10):2650-9. [DOI] [PubMed] [Google Scholar]


