Abstract
Purpose
To determine the differences of metabolites and metabolic pathways between patients with proliferative diabetic retinopathy (PDR) and without diabetes (nondiabetic controls) in plasma and vitreous, respectively, and to characterize the relationship between plasma and vitreous metabolic profiles.
Methods
Liquid chromatography/tandem mass spectrometry technology was performed to distinct metabolite profiles of plasma and vitreous. A total of 139 plasma samples from 88 patients with PDR and 51 nondiabetic controls, as well as 74 vitreous samples from 51 patients with PDR and 23 nondiabetic controls, were screened. Pathway analysis was performed using MetaboAnalyst 5.0. Pearson correlation analysis was used to investigate the correlation of metabolites in vitreous and plasma.
Results
After adjusting for age, fasting blood glucose, and urea, in vitreous metabolomes, a total of 76 features distinguished patients with PDR from controls. Fifteen differential metabolites were found in plasma metabolites. Pantothenate and CoA biosynthesis was the common metabolic pathway altered in both plasma and vitreous. Aromatic amino acid metabolism pathways were dysregulated in vitreous of PDR. For four metabolic features, there were positive correlations between vitreous and plasma.
Conclusions
Despite great differences between the metabolic profiles of plasma and vitreous in PDR cases, there are also similarities in the change of metabolites and metabolic pathways. Exploring the relationship of metabolomics between vitreous and plasma may help provide new understanding of the mechanism of PDR.
Keywords: proliferative diabetic retinopathy, metabolomics, pantothenate and CoA, aromatic amino acids, UPLC-MS/MS
Diabetic retinopathy (DR), the most common microvascular complication in patients with diabetes, is one of the main causes of blindness in the working-age population.1 From 2015 to 2018, the global prevalence of DR was up to 27%.2 Approximately 10% of the whole diabetic population, one-third of the patients with DR, will progress to the proliferative diabetic retinopathy (PDR) or diabetic macular edema stage, when the visual function is usually irreversibly impaired.3 Due to the complication of its pathogenesis, currently, there is still a lack of effective intervention for preventing PDR.
Metabolomics, a research method for qualitative and quantitative analysis of small-molecule metabolites,4 is more suitable for the study of multifactorial diseases. Metabolomics has shown great potential in the field of ophthalmology. It has been applied in studies of keratoconus,5 primary open-angle glaucoma,6 anterior uveitis,7 age-related macular degeneration,8 and also DR.
Several plasma metabolomics have been performed in the study of DR. A study measuring circulating amino acids in the plasma of patients with type 2 diabetes suggests that lower levels of tyrosine and alanine are associated with an increased risk of microvascular disease.9 The plasma glutamine/glutamate ratio has become a new metabolic marker of DR.10 In addition, fatty acid metabolism,11 pyrimidine metabolism,12 pentose phosphate metabolism, and vitamin C metabolism are also considered to be associated with DR.13
The blood–eye barrier separates the retina from the vitreous and systemic circulation14 and leads to the difference of metabolites in the vitreous and plasma. Due to the close proximity to the retina, vitreous metabolomics has been thought closer to the metabolic characteristics of retina. Currently, there are a few vitreous metabolomics studies on DR. Several metabolites were found dysregulated in vitreous of patients with PDR, such as lactate, galactitol, proline, sphingolipid, and creatine.15–17
However, PDR is a complication of systemic disease, which has a close relationship with the systemic circulation. It may be necessary to investigate the metabolic profiling of vitreous in combination with blood. We hypothesize metabolites or pathways that change with the same trend in vitreous and blood are more likely to play important roles in the disease. In addition, metabolomics study from both vitreous and plasma allows us to understand the molecular origins of the disease, which helps to further determine new therapeutic strategies, such as topical ocular intervention, nutritional modulation, or systemic administrations for DR. Thus, we think it is meaningful to find the similarities and differences between vitreous and plasma metabolism.
This study applied ultra-performance liquid chromatography/tandem mass spectrometry (UPLC-MS/MS) technology to identify discriminatory metabolic features of plasma and vitreous between patients with PDR and nondiabetic patients, respectively. We also propose to characterize the relationship between plasma and vitreous metabolism, which may help further reveal the pathogenesis of PDR and find new intervention targets.
Methods
Study Ethics Approval
This study followed the principles of the Declaration of Helsinki and was approved by the Institutional Review Board of Shanghai General Hospital (2013KY023). Written informed consent for the surgery and for the collection of clinical information and biological samples was obtained from all patients.
Sample Collection
The clinical information and blood samples of 139 patients from Shanghai General Hospital were collected from 2013 to 2015. Eighty-eight patients with diabetes who had newly diagnosed PDR were enrolled as the PDR group, and 51 nondiabetic patients with idiopathic macular epiretinal membrane (n = 24) or macular hole (n = 27) were enrolled as the control group. All patients were diagnosed by a retinal specialist. A PDR diagnosis was based on the presence of neovascularization of the iris or retina or clinical imaging of vitreous hemorrhage or preretinal hemorrhage. After confirmed overnight fasting, 5 mL whole blood was collected in the morning using K2EDTA tubes. Within 30 minutes, the tubes were centrifuged at 3000 × g for 10 minutes (4°C). The plasma was separated from whole blood and stored in a 5-mL tube, which was cryopreserved at −80°C. Vitreous samples were collected from 74 patients who underwent vitrectomy surgery. Among them, 51 patients with PDR were included in the PDR group, and 23 nondiabetic patients with idiopathic macular epiretinal membrane (n = 11) or macular hole (n = 12) were included in the control group. Vitreous was collected before vitrectomy surgery, and 0.3 mL vitreous was collected and stored in a freezing tube. After being placed in a liquid nitrogen tank, the vitreous samples were sent to the ophthalmic biobank of Shanghai General Hospital and then stored at −80°C.
Sample Preparation
Plasma or vitreous was thawed and dissolved at 4°C. Then, a 50-µL sample was extracted and added into a 200-µL volume of cold chloroform/methanol (v/v = 2:1). The mixtures were vortexed for 30 seconds and then allowed to stand for 5 minutes at room temperature. Then the sample was centrifuged at 13,000 × g for 15 minutes. The upper phase and lower organic phase were separately collected and evaporated at room temperature to dry under vacuum.
Liquid Chromatography/Mass Spectrometry
Metabolites were separated on an Ultimate 3000 UHPLC system (Thermo Fisher Scientific, Waltham, MA, USA). An HSS T3 column (2.1 mm i.d. × 100 mm, 1.8 µm; Waters Co., MA, USA) was used for compound separation at 35°C. The mobile phase A consisted of 0.1% formic acid in water, and mobile phase B contained acetonitrile. The flow rate was 0.3 mL/min with the following linear gradient: 0 minutes, 2% B; 1.5 minutes, 2% B; 12 minutes, 100% B; and 15 minutes, 100% B. The injection volume was 1 µL.
Ion detection was performed using the Q-Exactive MS (Thermo Scientific) with an electrospray source simultaneously operating in fast negative/positive ion switching mode. Metabolomics data collection was in full scan mode. Acquisition settings were as follows: spray voltage, +3.5/−4.0 kV; capillary temperature, 300°C; sheath gas, 40 (arbitrary units); auxiliary gas, 10 (arbitrary units); m/z range, 200 to 2000; data acquisition, profile mode, microscans, 10; automatic gain control (AGC) target, 3e6; maximum injection time, 200 ms; and mass resolution, 70,000 full width at half maximum (FWHM) at m/z 200.
Statistical Analysis
The metabolomics raw data generated by UPLC-MS/MS were processed with the open-source software MZmine v2.32 (MZmine Development Team, USA) to perform targeted features detection, deisotoping, alignment, gap filling, and dereplication. Chi-square test was performed to compare the categoric data between patients with PDR and controls. Mann–Whitney U test was used to compare the level of fasting blood glucose (FBG), creatinine, urea, total cholesterol, and triglyceride. A two-tailed t-test was used for the comparation of other clinical data. Multivariate statistical methods, including principal component analysis (PCA) and orthogonal projection to latent structure-discriminant analysis (OPLS-DA), were performed using SIMCA-P version 14.0 (Umetrics AB, Umea, Sweden). To reduce the overall false discovery rate (FDR), the P value was adjusted for multiple testing. Heatmaps, Spearman rank correlation analysis, and pathway analysis were conducted using MetaboAnalyst5.0 (Xia Lab, McGill University, Montreal, Canada). Missing values of clinical and demographic characteristics were estimated using the expectation maximization method. Multivariate analysis was used for adjusting confounding factors. Statistical analyses were performed using SPSS 18.0 (IBM Corp., Armonk, NY, USA).
Results
Study Population
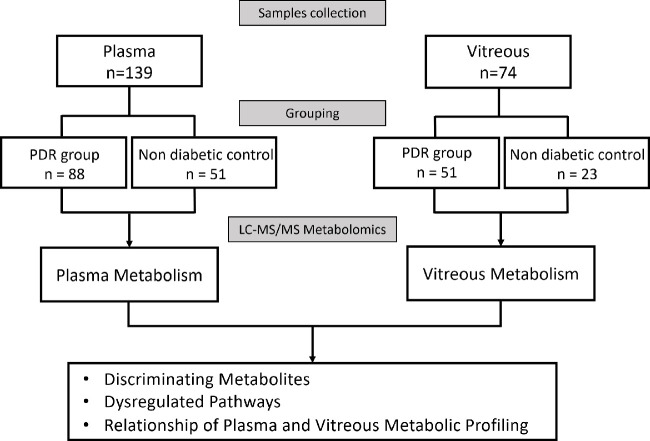
The study flow is shown in Figure 1. Demographic and clinical information of the study population in both the plasma and vitreous samples is presented in Table 1 and Table 2, respectively. For the population in the plasma metabolomics, results showed that the mean ± SD age of the PDR group was significantly lower than that of the control group (55.3 ± 9.7 vs. 67.0 ± 8.1 years, P < 0.001). The FBG and urea levels of PDR group were significantly higher than that of control group, with 6.3 ± 3.5 mmol/L versus 5.0 ± 1.2 mmol/L (P < 0.001) and 6.6 ± 3.0 mmol/L versus 5.3 ± 1.7 mmol/L (P < 0.001), respectively. Patients in the plasma and vitreous metabolic study shared similar characteristics (Table 2). No significant differences in other demographic and clinical data between the two groups were observed.
Figure 1.
Study flow.
Table 1.
Characteristics of Study Population for Plasma Metabolomics
| Characteristic | PDR (n = 88) | Control (n = 51) | P Value |
|---|---|---|---|
| Age* (y) | 55.3 ± 9.7 | 67.0 ± 8.1 | <0.001 |
| Gender† (male/female), n | 44/44 | 20/31 | 0.219 |
| FBG‡ (mmol/L) | 6.3 ± 3.5 | 5.0 ± 1.2 | <0.001 |
| Creatinine‡ (µmol/L) | 69 ± 37 | 64 ± 25 | 0.235 |
| Urea‡ (mmol/L) | 6.6 ± 3.0 | 5.3 ± 1.7 | <0.001 |
| TC* (mmol/L) | 4.68 ± 1.31 | 4.78 ± 0.96 | 0.637 |
| TG‡ (mmol/L) | 1.33 ± 0.78 | 1.40 ± 1.29 | 0.293 |
| HTN† (yes/no), n | 44/44 | 22/29 | 0.435 |
| CAD† (yes/no), n | 3/85 | 1/50 | 1.000 |
| DLD† (yes/no), n | 40/48 | 30/21 | 0.129 |
| Other diabetic complications,† n | 4/84 | 0/51 | 0.296 |
| Treatments, n | |||
| Anti-VEGF† (yes/no) | 26/62 | 0/51 | <0.001 |
| Antidiabetic medications† (yes/no) | 88/0 | 0/51 | <0.001 |
| Antihypertension† (yes/no) | 43/45 | 21/30 | 0.381 |
Both age and TC data are represented as mean ± SD. FBG, creatinine, urea, and TG are represented as median ± interquartile range. CAD, coronary artery disease; DLD, dyslipidemia; HTN, hypertension; TC, total cholesterol; TG, triglyceride.
ndependent samples t-test.
Chi-square test.
Mann–Whitney U test.
Table 2.
Characteristics of Study Population for Vitreous Metabolomics
| Characteristic | PDR (n = 51) | Control (n = 23) | P Value |
|---|---|---|---|
| Age* (year) | 54.9 ± 9.2 | 67.1 ± 8.8 | <0.001 |
| Gender† (male/female), n | 28/23 | 7/16 | 0.051 |
| FBG‡ (mmol/L) | 6.8 ± 4.7 | 5.0 ± 1.7 | 0.001 |
| Creatinine‡ (µmol/L) | 69 ± 37 | 62 ± 20 | 0.222 |
| Urea‡ (mmol/L) | 6.7 ± 3.3 | 5.4 ± 1.2 | <0.001 |
| TC* (mmol/L) | 4.50 ± 1.04 | 4.87 ± 0.96 | 0.270 |
| TG‡ (mmol/L) | 1.26 ± 0.72 | 1.59 ± 1.40 | 0.250 |
| HTN† (yes/no), n | 18/33 | 12/11 | 0.171 |
| CAD† (yes/no), n | 1/50 | 0/23 | 1.000 |
| DLD† (yes/no), n | 14/37 | 10/13 | 0.173 |
| Other diabetic complications,† n | 1/50 | 0/23 | 1.000 |
| Treatments, n | |||
| Anti-VEGF† (yes/no) | 14/37 | 0/23 | 0.004 |
| Anti-diabetic medications† (yes/no) | 51/0 | 0/23 | <0.001 |
| Antihypertension† (yes/no) | 18/33 | 11/12 | 0.381 |
Both age and TC data are represented as mean ± standard deviation. FBG, creatinine, urea, and TG are represented as median ± interquartile range.
Independent samples t-test.
Chi-square test.
Mann–Whitney U test.
Of note, 26 patients in the PDR group received intraocular anti-VEGF treatment within a week before the surgery. And anti-VEGF treatment did not obviously influence the metabolic profiles in either plasma (Supplementary Figs. S1A, S1B) or vitreous (Supplementary Figs. S1C, S1D), as the PCA plot showed there were complete overlaps between the profiling of patients with PDR with and without anti-VEGF treatment.
Plasma Metabolomics
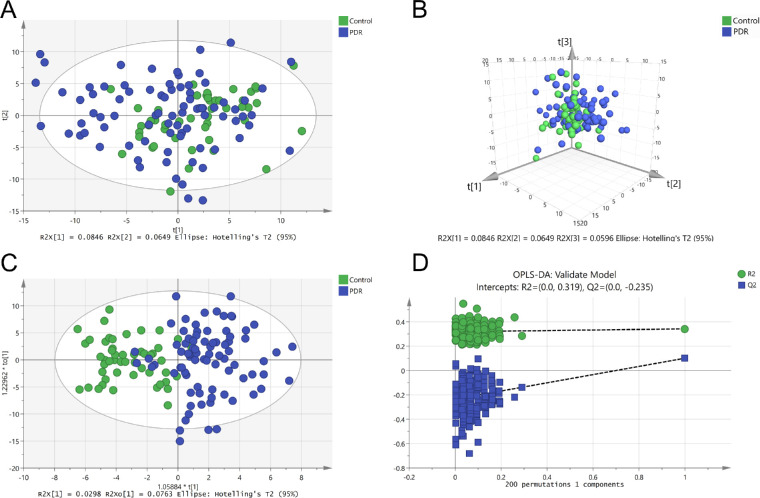
In total, 345 metabolites were detected in the plasma of patients with PDR and nondiabetic patients. PCA was performed on their metabolomic profiles, and seven outliers were excluded. Figures 2A and 2B showed that there was no clear separation in the overall plasma metabolic profiles between the two groups. To gain further insight into the differential metabolites, OPLS-DA score plot was established. Metabolic profiles of patients with PDR differed significantly from controls (Fig. 2C). Two hundred replacement tests showed no indication of overfitting (Fig. 2D).
Figure 2.
Metabolomics profile analysis of plasma samples. (A) Two-dimensional score plot of PCA model with the exclusion of outliers. (B) Three-dimensional score plot of PCA model. (C) Score plot of OPLS-DA model. (D) OPLS-DA model 200 times replacement test results.
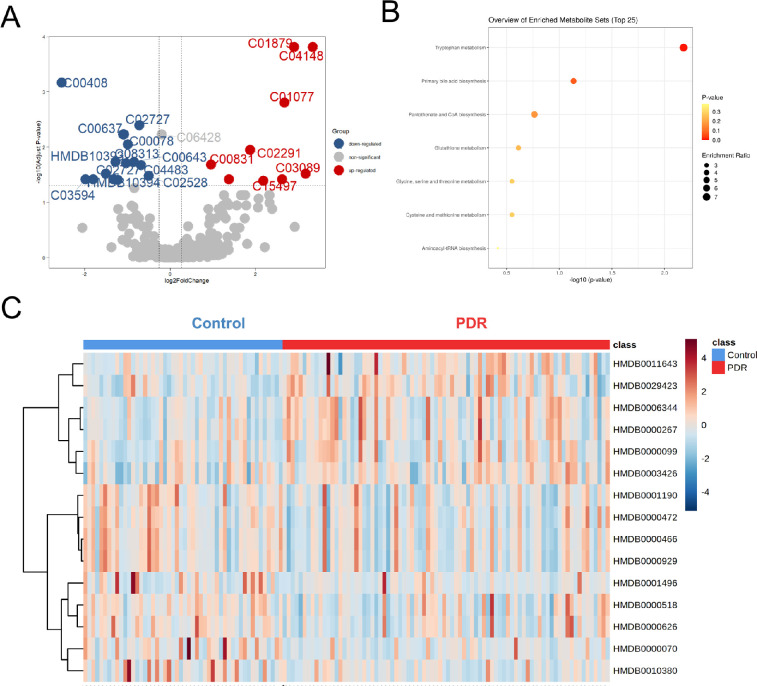
Using an FDR of 0.05, metabolites with Variable Importance in the Projection (VIP) >1 and fold change (FC) values >1.2 and <0.83 were selected (Fig. 3A). After adjusting age, FBG, and urea, 15 metabolites were finally identified as differential metabolites (Supplementary Table S1). To obtain the metabolic pathways associated with PDR, metabolite set enrichment analysis was further performed. A total of seven metabolic pathways were identified (Fig. 3B). Significant enrichments in tryptophan metabolism; primary bile acid biosynthesis; pantothenate and CoA biosynthesis; glutathione metabolism; glycine, serine, and threonine metabolism; cysteine and methionine metabolism; and aminoacyl-tRNA biosynthesis were collectively observed. Figure 3C shows that differential metabolites distinguished patients with PDR from controls.
Figure 3.
Differential metabolites and metabolic pathways from plasma. (A) Volcano plot showing differential metabolites between groups. Upregulated and downregulated metabolites are in red and blue, respectively. Nonsignificant metabolites are represented by gray dots. (B) Metabolite set enrichment analysis showed that seven differential pathways differed between the PDR and control groups. (C) Heatmap showing relative peak areas of dysregulated metabolites in plasma.
Vitreous Metabolomics
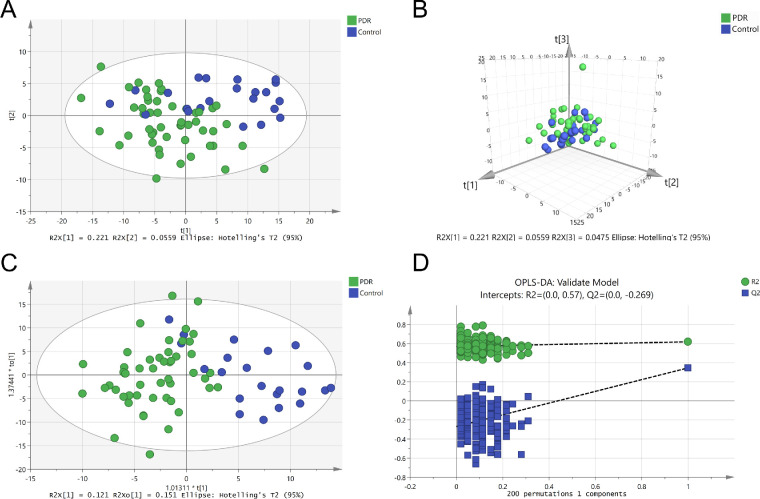
Vitreous were collected from 51 patients with PDR and from 23 nondiabetic patients. A total of 270 metabolites were identified. Different from the results of plasma, the PDR group and nondiabetic group showed a clear separation in both PCA analysis (Figs. 4A, 4B) and the OPLS-DA model without overfitting (Figs. 4C, 4D). Discriminating metabolites with VIP >1 were used to perform further analysis. Using an FDR of 0.05, 77 metabolites with an FC >1.2 and <0.83 were selected (Fig. 5A). After adjusting for age, FGB, and urea, a total of 76 features that differentiated patients with PDR from controls were identified (Supplementary Table S2). Several pathways were enriched in the vitreous of patients with PDR, such as pantothenate and CoA biosynthesis; pyrimidine metabolism; valine, leucine, and isoleucine biosynthesis; and phenylalanine metabolism (Fig. 5B). Heatmap visualization displayed the discrimination of patients with PDR from controls by vitreous discriminatory metabolites (Fig. 5C).
Figure 4.
Metabolomics profile analysis of vitreous samples. (A) Two-dimensional score plot of PCA model. (B) Three-dimensional score plot of PCA model. (C) Score plot of OPLS-DA model. (D) OPLS-DA model 200 times replacement test results.
Figure 5.
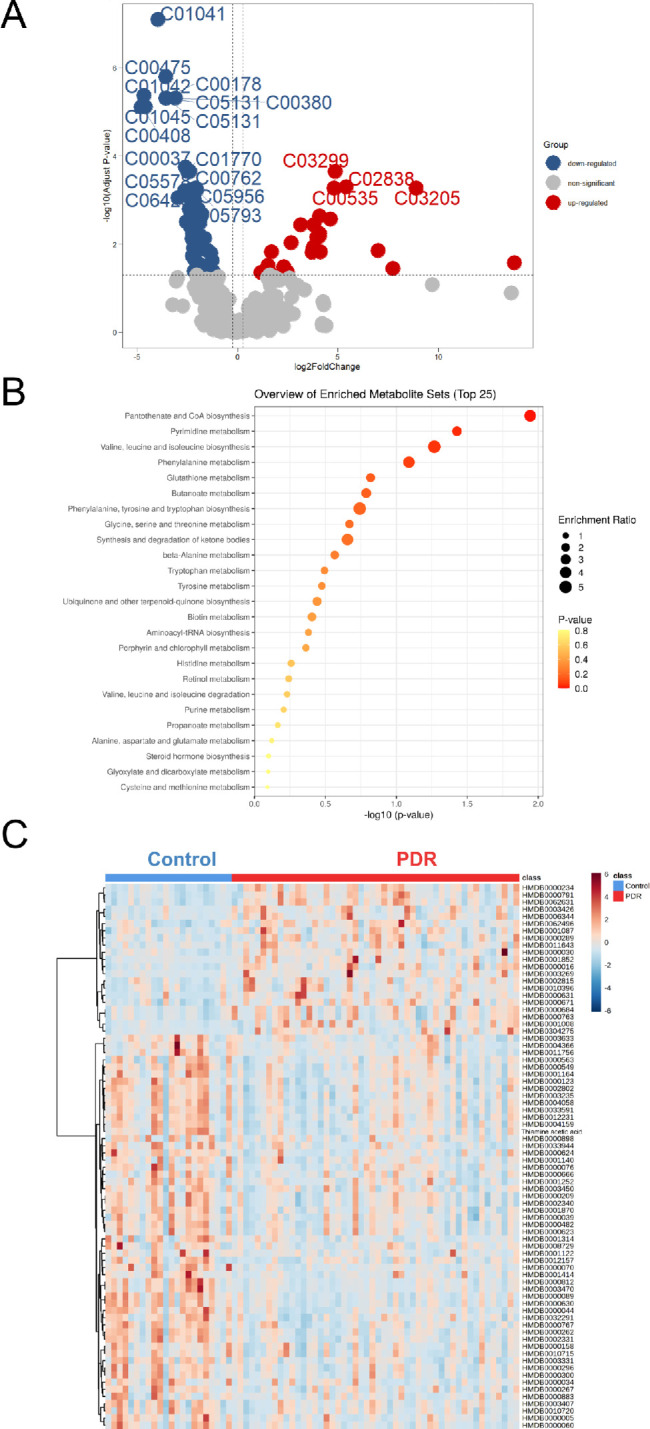
Differential metabolites and metabolic pathways from vitreous. (A) Volcano plot analysis for detecting significantly changed metabolites. Upregulated and downregulated metabolites are in red and blue, respectively. Nonsignificant metabolites are represented by gray dots. (B) Metabolite set enrichment analysis of all discriminating metabolites was performed and top 25 differential pathways were displayed. (C) Heatmap showing relative peak areas of dysregulated metabolites in vitreous.
Relationship Between the Plasma and Vitreous Metabolic Profiles
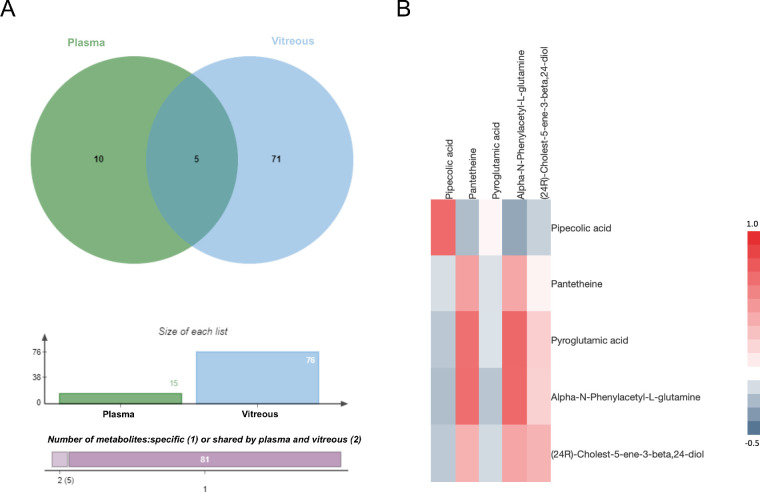
A total of 76 discriminatory metabolites were identified in vitreous and 15 metabolites in plasma, with 5 overlapping metabolites (Fig. 6A). Pearson correlation analysis was performed for the expression of the abovementioned 5 metabolites in 69 individuals, who had both plasma and vitreous metabolomics profiles. Overlapping metabolites with P < 0.05 were considered significantly correlated in the plasma and vitreous. Two metabolites, pipecolic acid and phenylacetyl glutamine, had a correlation coefficient >0.7 (Fig. 6B). Pipecolic acid was significantly decreased in both vitreous and plasma, while phenylacetyl glutamine increased (Table 3). Furthermore, the correlation analysis between biochemical parameters and discriminatory metabolites shared by vitreous and plasma was performed. Of these, blood urea showed strong correlations with several metabolites, and correlation P values are listed in Supplementary Tables S3 and S4.
Figure 6.
Relationship between vitreous metabolites and plasma metabolites. (A) Venn diagram analysis shows there were five overlapping metabolites between plasma and vitreous. (B) Based on the relative abundance of all overlapping metabolites, the heatmap was generated showing the matrix of the Pearson correlation coefficient.
Table 3.
Discriminatory Metabolites Shared by Vitreous and Plasma in Patients With PDR
| Variation Trend | ||||
|---|---|---|---|---|
| No. | Metabolite | ID | Plasma | Vitreous |
| 1 | Pipecolic acid | C00408 | ↓ | ↓ |
| 2 | Pantetheine | C00831 | ↑ | ↑ |
| 3 | Pyroglutamic acid | C01879 | ↑ | ↓ |
| 4 | Alpha-N-phenylacetyl-L-glutamine | C04148 | ↑ | ↑ |
| 5 | (24R)-Cholest-5-ene-3-beta,24-diol | C15497 | ↑ | ↑ |
Untargeted metabolomics was performed in both plasma and vitreous samples, and there were 15 and 76 discriminating metabolites, respectively. Among these discriminating metabolites, five were shared by vitreous and plasma. The variation trends of them in the PDR group are listed.
Discussion
In this study, plasma and vitreous metabolism were both performed using UPLC-MS/MS technology. There were obvious differences in the metabolism profiles between the PDR and nondiabetic participants. After adjusting for age, FBG, and urea, 76 metabolites in vitreous humor and 15 metabolites in plasma were significantly altered in patients with PDR. Pathway enrichment analysis using MetaboAnalyst 5.0 revealed that pantothenate and CoA biosynthesis was altered in both plasma and vitreous samples. In the comparison of metabolic profiles from different samples, a total of four metabolites had positive associations across vitreous and plasma.
In this study, we tried to explore the relationship between the metabolomics from plasma and vitreous in patients with PDR. We conjecture that some small molecules could enter into ocular tissues from the systemic circulation. Given all the enrolled patients with PDR had vitreous hemorrhage, it could be that the vitreous results reflect metabolism from the hemorrhage. However, results showed that in the same population, only a small fraction of vitreous metabolites overlapped with plasma, and metabolites with high Pearson correlation were even less. Based on this evidence, we therefore tend to think there is a linkage between retinal and systemic metabolism.
Phenylacetyl glutamine, one of the metabolites altered in both plasma and vitreous, is the metabolic end product of essential amino acid phenylalanine. An increased expression of phenylacetyl glutamine activates platelets and contributes to cardiovascular events in patients with diabetes.18 Of note, it has long been confirmed that phenylacetyl glutamine is mainly produced in the liver and renal tissue, after phenylalanine is elementarily metabolized in the gut.19 Therefore, we speculated that the elevation of vitreous phenylacetyl glutamine was mainly influenced by blood. These results would seem to suggest that the nutritional composition, the gut microbial community, and even the function of metabolic organs may affect ocular metabolic states through changing systemic metabolism, providing us with novel ideas on the intervention strategy.
Additionally, the pathway of pantothenate and CoA biosynthesis was significantly disturbed in patients with PDR. However, descending and ascending trends were found in plasma and vitreous, respectively. Pantothenate, also known as vitamin B5, is the obligatory precursor for CoA, which is estimated to participate in 4% of all known enzymatic reactions in vivo.20 Changes in pantothenate and CoA regulate the energy metabolism of mitochondria,21 which is closely related to the progression of DR. A supplement of pantothenate showed protective effects on endothelial cells from oxidative stress.22,23 A decreased level of pantothenate and CoA biosynthesis has been reported in the urine of patients with diabetic kidney disease.24 This result was consistent with our observations on plasma metabolism showing decreased pantetheine. A possible explanation is that impaired renal tubular reabsorption of vitamin results in a declined conversion of pantothenate in diabetic individuals,25 whereas the increased level of pantothenate and CoA biosynthesis in vitreous could be a protective mechanism against cell injuries.
In addition, several metabolic pathways of aromatic amino acids were dysregulated in the vitreous. There was a significant decline of tyrosine in this study. Low tyrosine appears to be an independent risk factor of microvascular events in patients with type 2 diabetes,10 and a previous study has confirmed the association between low tyrosine concentrations and diabetic nephropathy.26 Apart from that, dysregulations of phenylalanine and impaired conversion to tyrosine27 may also contribute to the pathogenesis of PDR. It was reported that the deficiency of dopamine, which is derived from hydroxylation products of tyrosine or phenylalanine, promoted early retinal dysfunction in diabetic rats.28 Thus, the metabolism of aromatic amino acids plays an important role in the pathogenesis of PDR. Some important metabolites presented in previous studies, such as arginine, proline, pyruvate, and carnitine,9,15 were not included in our results, which may due to the racial difference.
A limitation of this study is that the sample size varied greatly between the two groups, which may reduce statistical power. Given a small sample size is far worse for statistical inference, we retained all the data in the PDR group. Besides, it would be better to recruit patients with non-proliferative diabetic retinopathy (NPDR), as it helps detect early diagnostic or prognostic biomarkers in the process of DR. Methodologic validation is still required in future studies.
Collectively, we generated a metabolomic analysis between the PDR and control groups in both plasma and vitreous. The pathway of pantothenate and CoA biosynthesis was identified in both vitreous and plasma, and significant alterations in aromatic amino acid metabolism were found in vitreous. Four metabolites showed positive correlations across vitreous and plasma samples, suggesting a linkage between the metabolism of retina and systemic circulation. These findings may help provide a novel perspective for the molecular mechanism of PDR and finding new therapeutic targets.
Supplementary Material
Acknowledgments
Supported by the National Natural Science Foundation of China (81870667) and National Key Research and Development Program of China (2019YFC0840607).
Disclosure: H. Wang, None; S. Li, None; C. Wang, None; Y. Wang, None; J. Fang, None; K. Liu, None
References
- 1. Sivaprasad S, Gupta B, Crosby-Nwaobi R, Evans J.. Prevalence of diabetic retinopathy in various ethnic groups: a worldwide perspective. Surv Ophthalmol. 2012; 57: 347–370. [DOI] [PubMed] [Google Scholar]
- 2. Thomas RL, Halim S, Gurudas S, Sivaprasad S, Owens DR.. IDF Diabetes Atlas: a review of studies utilising retinal photography on the global prevalence of diabetes related retinopathy between 2015 and 2018. Diabetes Res Clin Pract. 2019; 157: 107840. [DOI] [PubMed] [Google Scholar]
- 3. Zheng Y, He M, Congdon N.. The worldwide epidemic of diabetic retinopathy. Indian J Ophthalmol. 2012; 60: 428–431. [DOI] [PMC free article] [PubMed] [Google Scholar]
- 4. Fiehn O. Metabolomics—the link between genotypes and phenotypes. Plant Mol Biol. 2002; 48: 155–171. [PubMed] [Google Scholar]
- 5. Karamichos D, Zieske JD, Sejersen H, Sarker-Nag A, Asara JM, Hjortdal J.. Tear metabolite changes in keratoconus. Exp Eye Res. 2015; 132: 1–8. [DOI] [PMC free article] [PubMed] [Google Scholar]
- 6. Burgess LG, Uppal K, Walker DI, et al.. Metabolome-wide association study of primary open angle glaucoma. Invest Ophthalmol Vis Sci. 2015; 56: 5020–5028. [DOI] [PMC free article] [PubMed] [Google Scholar]
- 7. Guo J, Yan T, Bi H, et al.. Plasma metabonomics study of the patients with acute anterior uveitis based on ultra-performance liquid chromatography-mass spectrometry. Graefes Arch Clin Exp Ophthalmol. 2014; 252: 925–934. [DOI] [PubMed] [Google Scholar]
- 8. Lains I, Duarte D, Barros AS, et al.. Human plasma metabolomics in age-related macular degeneration (AMD) using nuclear magnetic resonance spectroscopy. PLoS One. 2017; 12: e0177749. [DOI] [PMC free article] [PubMed] [Google Scholar]
- 9. Sumarriva K, Uppal K, Ma C, et al.. Arginine and carnitine metabolites are altered in diabetic retinopathy. Invest Ophthalmol Vis Sci. 2019; 60: 3119–3126. [DOI] [PMC free article] [PubMed] [Google Scholar]
- 10. Welsh P, Rankin N, Li Q, et al.. Circulating amino acids and the risk of macrovascular, microvascular and mortality outcomes in individuals with type 2 diabetes: results from the ADVANCE trial. Diabetologia. 2018; 61: 1581–1591. [DOI] [PMC free article] [PubMed] [Google Scholar]
- 11. Li X, Luo X, Lu X, Duan J, Xu G.. Metabolomics study of diabetic retinopathy using gas chromatography-mass spectrometry: a comparison of stages and subtypes diagnosed by Western and Chinese medicine. Mol Biosyst. 2011; 7: 2228–2237. [DOI] [PubMed] [Google Scholar]
- 12. Xia JF, Wang ZH, Liang QL, Wang YM, Li P, Luo GA.. Correlations of six related pyrimidine metabolites and diabetic retinopathy in Chinese type 2 diabetic patients. Clin Chim Acta. 2011; 412: 940–945. [DOI] [PubMed] [Google Scholar]
- 13. Liew G, Lei Z, Tan G, et al.. Metabolomics of diabetic retinopathy. Curr Diab Rep. 2017; 17: 102. [DOI] [PubMed] [Google Scholar]
- 14. Yasukawa T, Ogura Y, Sakurai E, Tabata Y, Kimura H.. Intraocular sustained drug delivery using implantable polymeric devices. Adv Drug Deliv Rev. 2005; 57: 2033–2046. [DOI] [PubMed] [Google Scholar]
- 15. Tomita Y, Cagnone G, Fu Z, et al.. Vitreous metabolomics profiling of proliferative diabetic retinopathy. Diabetologia. 2021; 64: 70–82. [DOI] [PMC free article] [PubMed] [Google Scholar]
- 16. Barba I, Garcia-Ramirez M, Hernandez C, et al.. Metabolic fingerprints of proliferative diabetic retinopathy: an 1H-NMR-based metabonomic approach using vitreous humor. Invest Ophthalmol Vis Sci. 2010; 51: 4416–4421. [DOI] [PubMed] [Google Scholar]
- 17. Wilmott LA, Grambergs RC, Allegood JC, Lyons TJ, Mandal N.. Analysis of sphingolipid composition in human vitreous from control and diabetic individuals. J Diabetes Complications. 2019; 33: 195–201. [DOI] [PMC free article] [PubMed] [Google Scholar]
- 18. Nemet I, Saha PP, Gupta N, et al.. A cardiovascular disease-linked gut microbial metabolite acts via adrenergic receptors. Cell. 2020; 180: 862–877.e822. [DOI] [PMC free article] [PubMed] [Google Scholar]
- 19. Moldave K, Meister A.. Synthesis of phenylacetylglutamine by human tissue. J Biol Chem. 1957; 229: 463–476. [PubMed] [Google Scholar]
- 20. Naquet P, Kerr EW, Vickers SD, Leonardi R.. Regulation of coenzyme A levels by degradation: the 'ins and outs'. Prog Lipid Res. 2020; 78: 101028. [DOI] [PMC free article] [PubMed] [Google Scholar]
- 21. Depeint F, Bruce WR, Shangari N, Mehta R, O'Brien PJ. Mitochondrial function and toxicity: role of B vitamins on the one-carbon transfer pathways. Chem Biol Interact. 2006; 163: 113–132. [DOI] [PubMed] [Google Scholar]
- 22. Demirci B, Demir O, Dost T, Birincioglu M.. Protective effect of vitamin B5 (dexpanthenol) on cardiovascular damage induced by streptozocin in rats. Bratisl Lek Listy. 2014; 115: 190–196. [DOI] [PubMed] [Google Scholar]
- 23. Slyshenkov VS, Rakowska M, Wojtczak L.. Protective effect of pantothenic acid and related compounds against permeabilization of Ehrlich ascites tumour cells by digitonin. Acta Biochim Pol. 1996; 43: 407–410. [PubMed] [Google Scholar]
- 24. Ma T, Liu T, Xie P, et al.. UPLC-MS-based urine nontargeted metabolic profiling identifies dysregulation of pantothenate and CoA biosynthesis pathway in diabetic kidney disease. Life Sci. 2020; 258: 118160. [DOI] [PubMed] [Google Scholar]
- 25. Hatano M, Hodges RE, Evans TC, et al.. Urinary excretion of pantothenic acid by diabetic patients and by alloxan-diabetic rats. Am J Clin Nutr. 1967; 20: 960–967. [DOI] [PubMed] [Google Scholar]
- 26. Pena MJ, Lambers Heerspink HJ, Hellemons ME, et al.. Urine and plasma metabolites predict the development of diabetic nephropathy in individuals with type 2 diabetes mellitus. Diabet Med. 2014; 31: 1138–1147. [DOI] [PubMed] [Google Scholar]
- 27. Kopple JD. Phenylalanine and tyrosine metabolism in chronic kidney failure. J Nutr. 2007; 137: 1586S–1590S; discussion 1597S–1598S. [DOI] [PubMed] [Google Scholar]
- 28. Kim MK, Aung MH, Mees L, et al.. Dopamine deficiency mediates early rod-driven inner retinal dysfunction in diabetic mice. Invest Ophthalmol Vis Sci. 2018; 59: 572–581. [DOI] [PMC free article] [PubMed] [Google Scholar]
Associated Data
This section collects any data citations, data availability statements, or supplementary materials included in this article.


