

Abstract
Meiotic processes are potentially dangerous to genome stability and could be disastrous if activated in proliferative cells. Here we show that two key meiosis-defining proteins, the double strand break-forming topoisomerase Spo11 and the meiotic cohesin Rec8, can dismantle centromeres. This dismantlement is normally observable only in mutant cells lacking the telomere bouquet, which provides a nuclear microdomain conducive to centromere reassembly1; however, overexpression of Spo11 or Rec8 leads to levels of centromere dismantlement that cannot be countered by the bouquet. Specific nucleosome remodeling factors mediate centromere dismantlement by Spo11 and Rec8. Remarkably, ectopic expression of either protein in proliferating cells leads to mitotic kinetochore loss in both fission yeast and human cells. Hence, while centromeric chromatin has been characterized as extraordinarily stable, Spo11 and Rec8 challenge this stability, and may jeopardize kinetochores in the increasing number of cancers known to express meiotic proteins.
Centromeres and telomeres are widely considered to be independently functioning entities, each essential for accurate chromosome inheritance. Telomeres ensure that chromosome ends are neither fused nor extensively degraded, while centromeres orchestrate the accurate distribution of replicated sister chromatids to daughter cells by attaching to spindle microtubules. We uncovered an instance in which centromere identity depends on telomeres: meiotic centromeres and kinetochores (KT) have a tendency to disassemble, but their reassembly is guaranteed by transient proximity to telomeres1. Why centromeres become dismantled during meiosis, and whether this process can occur during proliferative cell divisions, are crucial questions.
The centromere-specific histone H3 variant CenpA underpins assembly and heritability of the multiprotein KT 2,3. Human centromeres usually assemble over arrays of α-satellite repeats, but these are neither strictly necessary nor sufficient for centromere inheritance. Instead, CenpA is the epigenetic mark that directs this inheritance. CenpA chromatin is generally flanked by heterochromatin (HC) harboring methylated histone H3-lys9 (H3K9me) bound to HP1 proteins2,4,5. Canonical S. pombe centromeres comprise a unique central core domain of 7–10 kb that harbors Cnp1CenpA, flanked by pericentric HC domains of 40–120 kb. While pericentromeric HC is necessary for CenpA establishment over naïve centromeric sequences, it is dispensable for centromere inheritance6.
Telomere specification is comparatively straightforward. Chromosome termini comprise simple G-rich telomeric repeats terminating in a 3’ single strand overhang, bound by proteins that fulfill the chromosome end-protection functions needed for genome stability7,8. Like pericentric regions, telomeres are associated with HC5,9.
To achieve homologous recombination (HR) and reductional nuclear division, meiotic prophase and meiosis I (MI) encompass key differences from the analogous mitotic phases10. During meiotic prophase, HR is initiated by the programmed induction of DNA double strand breaks (DSBs) via the meiosis-specific endonuclease Spo1111,12; HR repair of those DSBs requires chromosome movements that result in homolog alignment13. Meiosis also requires changes in centromeric cohesin patterns14,15. While cohesins bind pericentric regions and are largely missing from centromeric cores during proliferative growth, the meiotic Rec8 cohesin complex associates with both regions. Centromeric Rec8 is crucial for monopolar orientation and reductional segregation at MI16.
A striking and conserved feature of meiosis is the bouquet, the clustering of telomeres at the nuclear envelope (NE)17–20. The fission yeast bouquet represents an inversion of mitotic chromosome organization; during mitotic interphase, centromeres cluster at the NE beneath the centrosome (called the spindle pole body, SPB), while telomeres form 2–3 clusters at distal NE regions. In meiotic prophase, telomeres gather beneath the SPB while centromeres disperse; indeed, upon meiotic induction, telomeres cluster gradually before centromeres are released, allowing rare contact between telomeres and centromeres21.
We reported an unforeseen role for the telomere bouquet in promoting meiotic centromere maintenance1, finding that centromeres have a small but significant tendency to lose Cnp1CenpA and KTs during meiotic prophase; this is counterbalanced by transient co-localization of centromeres with the bouquet, which provides a microenvironment that promotes KT reassembly. Hence, at MI and MII, bouquet-defective cells display unattached chromosomes lacking not only KT proteins, but also pericentric HC, indicating a chromatin disruption spanning tens of kilobases. Here we show that the meiosis-defining proteins Spo11 and Rec8 are responsible for this centromere disruption, and that ectopic expression of either in proliferating cells is sufficient to trigger KT loss. These phenomena can be recapitulated in human cells and are likely relevant to cancers that inappropriately express meiotic genes.
Spo11 and Rec8 cause meiotic KT loss
The apparent stability of meiotic centromeres masks a process of occasional centromere dismantlement and reassembly, the latter promoted by localization to the telomere-proximal microdomain1. This meiotic centromere reassembly depends on HC, and therefore on the Clr4 histone H3K9 methyltransferase and Swi6HP1. Thus, the KT loss phenotype of bouquet-defective (e.g. bqt1Δ) cells is phenocopied by clr4+ or swi6HP1+ deletion. We identified genes whose deletion suppresses the KT loss seen in bqt1Δ, clr4Δ or swi6HP1Δ cells. To assess KT loss, we filmed live meiosis in cells harboring endogenously GFP-tagged inner- (Cnp3CenpC) or outer- (Ndc80) KT proteins; chromatin, α-tubulin and the SPB were also monitored (Fig. 1a). The ‘KT loss’ phenotype refers to chromosomes that fail to attach to the spindle at MI or MII and lack KTs; lagging chromosomes with KTs do not fall into this category. While ~2% of wild-type (wt) cells harboring the four tagged proteins show KT loss, bouquet disruption increases KT loss to ~11% (Fig. 1b–c).
Fig. 1. Spo11 and Rec8 cause KT loss.

(a) Representative films of KT loss. KTs (Cnp3CenpC-GFP), chromatin (Pht1H2AZ-mCherry), SPBs (Sid4-mCherry), and microtubules (mCherry-Atb2) are visualized. t = 0 is the first frame in MI. Arrows indicate unsegregated chromosomes lacking KTs. Scale bars = 5μm.
(b-d) Quantitation of KT loss as in (a). (b) spo11Δ or -dbd rescue bqt1Δ KT loss; spo11-cd or rec6Δ do not. (c) rec8Δ and psc3–1T suppress KT loss while rec11Δ does not. (d) Overexpression of spo11 (spo11.OE1 controlled by nmt41 promoter) or rec8 (rec8.OE controlled by adh1 promoter) elevates KT loss rate and overwhelms bouquet-mediated KT reassembly. The effect of overexpressing Spo11 depends on DNA binding but not catalytic activity or Rec8. KT loss upon Rec8 overexpression is suppressed by psc3–1T but not spo11Δ. Total number of films analyzed is indicated above each bar. p values, determined by two-tailed Fisher’s exact tests, are indicated above brackets; the number of experimental repeats for all figures is given in Table S1.
Among a panel of meiosis specific genes (Extended Data Fig. 1a), rec12spo11+ (hereafter referred to as spo11+) and rec8+ emerged as genes whose deletion reverses the KT loss phenotype in bqt1Δ, clr4Δ and swi6HP1Δ settings (Fig. 1b–c, Extended Data Fig. 1); hence, Spo11 and Rec8 cause KT loss. The catalytically dead but stable Spo11-Y98F allele (Spo11-cd)22 failed to suppress KT loss (Fig. 1b, Extended Data Fig. 1b), indicating that KT loss is not a result of DSB formation. In contrast, a point mutation in the Toprim domain that abolishes DNA binding (E179A, Spo11-dbd)23,24 suppresses KT loss (Fig. 1b, Extended Data Fig. 1b). Deletions of the genes encoding Rec10, Rec11, Rec24, Rec25 or the Spo11 partner TopVIB subunit Rec6, all required for Spo11-mediated DSB induction and recombination25,26, have no impact on KT loss (Fig. 1b–c, Extended Data Fig. 1a,c), confirming that DNA-bound Spo11 itself, independently of DSB induction, confers centromere dismantlement.
Like Spo11, the meiotic Rec8 cohesin complex is dangerous to centromeres. Rec8 binding to centromeres and chromosome arms requires Psc3 and Rec11, respectively14. rec11+ deletion fails to suppress KT loss (Fig. 1c, Extended Data Fig. 1c) while a psc3 hypomorph (psc3–1T)27 suppresses KT loss, indicating that centromeric cohesins are specifically responsible.
High Spo11/Rec8 overwhelms KT reassembly
Strong overexpression of Spo11 or Rec8 in a wt setting leads to elevated KT loss rates that are increased further by bqt1+ or swi6HP1+ deletion (Fig. 1d, Extended Data Fig. 2a–c); weaker overexpression confers KT loss only in the absence of the bouquet (Extended Data Fig. 2a). Overexpression of Spo11-cd, but not Spo11-dbd, causes KT loss at rates rivaling those of wt Spo11 (Fig. 1d). psc3–1T suppresses KT loss upon Rec8 overexpression (Fig. 1d), confirming that Psc3-dependent centromeric cohesin specifically triggers KT loss. Hence, the ability of the bouquet to promote KT reassembly is insufficient in the face of strongly elevated Spo11 or Rec8.
Budding yeast Rec8 directs Spo11 binding near centromeres28, suggesting that fission yeast Rec8 promotes KT destruction by promoting Spo11 binding. Perhaps surprisingly, overexpressed Spo11 or Rec8 succeed in elevating KT loss regardless of the respective deletion, rec8Δ or spo11Δ (Fig. 1d). Moreover, an additive effect is seen when Spo11 and Rec8 are co-overexpressed. Therefore, while at wt levels, Spo11 and Rec8 require each other to disrupt KTs in bouquet-defective meiosis, each can disrupt KTs independently when overexpressed.
Chromatin remodelers dismantle KTs
Our observations indicate that Spo11 and Rec8 destabilize or evict CenpA nucleosomes. Moreover, as KT loss also encompasses the loss of H3K9me in pericentric regions1, such nucleosome destabilization propagates over tens of kilobases to surrounding pericentric HC. We asked whether chromatin remodeling complexes participate in KT loss by deleting genes representing each fission yeast chromatin remodeling complex, CHD, Ino80, Swi/Snf, RSC and Smarcad1. Of these, KT loss is suppressed only by inactivation of CHD or RSC (via hrp3Δ and rsc1Δ, respectively; Fig. 2A, Extended Data Fig. 2d).
Fig. 2. Spo11 and Rec8 require the CHD or RSC chromatin remodelers, respectively, to dismantle meiotic KTs.

Quantitation of KT loss as in Figure 1a. (a) Deletion of hrp3+ or rsc1+ suppresses KT loss in the absence of the bouquet. (b) rsc1Δ or hrp3Δ specifically reverse KT loss caused by Rec8 or Spo11 overexpression, respectively. Total number of films analyzed is indicated above each bar. p values, determined by two-tailed Fisher’s exact tests, are indicated above brackets.
RSC aids cohesin loading during proliferative cell cycles29,30 by recruiting cohesin loaders and establishing nucleosome free regions. Therefore, the involvement of Rsc1 in KT loss may be exerted via meiotic Rec8 loading and clearing of local CenpA nucleosomes. Indeed, rsc1+ deletion suppresses the ability of Rec8 overexpression to elevate KT loss (Fig. 2b), but has no effect on Spo11 overexpression-mediated KT loss. To determine whether Rsc1 is required for Rec8 loading, we filmed both endogenously tagged (Extended Data Fig. 3) and overexpressed (Extended Data Fig. 4a–b) Rec8-GFP through meiosis. During prophase, Rec8 localizes diffusely throughout the nucleus, reflecting association with numerous chromosomal sites. As cells approach MI, Rec8 disappears along chromosome arms but concentrates near centromeres, forming foci visible in higher brightness images; these foci disappear at MII (Extended Data Fig. 3, 4a–b). When rsc1+ is deleted, these centromeric foci are vastly diminished, suggesting that Rsc1 promotes KT loss by promoting meiotic centromeric Rec8 loading and local nucleosome displacement.
Hrp3 has been implicated in promoting the regularity of nucleosome spacing downstream of promoters as well as silencing of centromeric and intragenic antisense transcription31–33. In contrast to rsc1+, hrp3+ deletion abolishes the KT loss conferred by Spo11 overexpression (Fig. 2b) while failing to suppress KT loss upon Rec8 overexpression. Hence, Hrp3 may promote Spo11 binding or may be recruited by Spo11 to destabilize local nucleosomes.
Spo11/Rec8 disrupt KTs in mitotic cells
The observation that Spo11 and Rec8 cause meiotic KT loss prompted us to ask whether ectopic expression of these meiosis-specific proteins in proliferative cells would lead to mitotic KT loss. Mitotically expressed Rec8 replaces its mitotic kleisin counterpart, Rad21, and associates with centromeres14,34. Western blots confirm that while endogenously myc-tagged Spo11 shows no expression in wt mitotic cells, a robust signal is seen when Spo11-myc is ectopically expressed (under adh1 promoter control); likewise, Rec8 expression is seen only when under adh1-control (Fig. 3a). While wt cells show occasional lagging chromosomes, these rarely lack KT signal. However, Spo11 expression confers KT loss (Fig. 3b–c). As in meiotic cells, mitotic Spo11-mediated KT loss is reversed upon hrp3+ deletion; as hrp3+ deletion has no effect on Spo11 levels (Fig. 3a), we infer that Hrp3 affects Spo11’s centromeric activity. Crucially, catalytically dead Spo11 also causes KT loss, while the DNA binding-deficient allele has no effect. Consistently, when a unique centromere, cen1, is monitored (cen1-tetO/R-tomato), Spo11 expression induces an increase in KT loss corresponding to õne-third of the KT loss rate seen when all three centromeres are monitored (Fig. 3c, Extended Data Fig. 4c–d).
Fig. 3. Expression of Spo11 or Rec8 in proliferating cells causes KT loss.

(a) Western blots show no detectable expression of endogenously (Endo) 13xmyc-tagged Spo11 or 3xHA-tagged Rec8, but strong expression when under control of the adh1 promoter. Expression levels do not change upon hrp3+ or rsc1+ deletion. anti-Cdc2 provides loading control. Representative images of 3 repeats are shown.
(b) KT loss in proliferating anaphase cells. Snapshots of fixed cells in late anaphase: KT (Ndc80–2xGFP), chromatin (DAPI, 4′,6-diamidino-2-phenylindole), SPB (Sid4-mCherry), and spindle (mCherry-Atb2α-Tubulin) are visualized. Lagging chromosomes lacking KT are indicated by arrows. Lagging chromosomes with intact KT are excluded from quantitation. Scale bars = 5μm.
(c) Quantitation of KT loss as in (b). Expression of Spo11 elevates KT loss rate; this is reversed by hrp3+ deletion. Spo11-cd, but not Spo11-dbd, confers mitotic KT loss. Rec8 expression increases mitotic KT loss; this is reversed by psc3–1T but not by rsc1Δ. Total number of films analyzed is indicated above each bar. p values, determined by two-tailed Fisher’s exact tests, are indicated above brackets.
Rec8 expression severely compromises mitotic centromere maintenance, conferring a ~16-fold increase in KT loss (Fig. 3c) or a 5-fold increase at cen1 (Extended Data Fig. 4c–d). Interestingly, neither mitotic Rec8-mediated KT loss nor mitotic centromeric Rec8-GFP foci are abolished upon rsc1+ deletion (Fig. 3c, Extended Data Fig. 5a), consistent with previous observations that mitotic cohesin loading can be served redundantly by multiple chromatin remodelers29,30. The enhanced KT loss rates seen upon mitotic Spo11 or Rec8 expression are accompanied by a modest increase in the percentage of inviable cells in the population as monitored by staining with methylene blue, which accumulates in dead cells (Extended Data Fig. 5b–c). Hence, Spo11 and Rec8 are each sufficient to disrupt KTs not only during meiotic prophase, but also when ectopically expressed in mitosis.
The rec8+ transcript contains multiple ‘determinant of selective removal’ (DSR) sequences, conferring its mitotic Red1-dependent selective removal35,36, raising the possibility that rec8+ overexpression saturates this RNA elimination machinery, causing KT loss indirectly via overexpression of other DSR genes. However, expression of the DSR genes crs1+ and mei4+ is not elevated upon rec8+ overexpression, while elevation is evident upon red1+ deletion (Extended Data Fig. 5d), ruling out this indirect effect. Indeed, our observation that psc3–1T suppresses the effects of Rec8 overexpression demonstrates that like meiotic Rec8, mitotically expressed Rec8 acts directly at centromeres to cause KT loss (Fig. 3c).
Intriguingly, centromeric enrichment levels in Cnp1CenpA chromatin immunoprecipitations (ChIPs) are reduced upon Spo11 or Rec8 expression (Fig. 4a–b, Extended Data Fig. 6a–b). The magnitude of these reductions was initially surprising given that KT loss rates are relatively low (5% and 15%, respectively) in these cells, and suggests that while mitotic Spo11 and Rec8 expression cause a mild overall reduction in centromeric Cnp1CenpA, only at a small subset of centromeres does Cnp1CenpA reach below a threshold level that triggers severe KT loss in cis. To further evaluate the apparent overall reduction in centromeric Cnp1CenpA, we quantified Cnp1CenpA intensity in single cells whose centromeres remain functional upon Spo11 or Rec8 expression. Remarkably, CenpA intensity is reduced significantly in these cells (Extended Data Fig. 6c), consonant with our ChIP data. Similar reductions were observed when quantifying the outer KT component Ndc80 (Extended Data Fig. 6d), suggesting that the CenpA reduction correlates with a modest reduction in all KT components.
Fig. 4. Expression of Spo11 or Rec8 reduces overall level of centromere bound Cnp1CenpA.

(a) Diagram of centromeric chromatin. Outer and inner KTs are built upon Cnp1CenpA nucleosomes at the central core, which is flanked by pericentric HC.
(b-c) ChIP analysis of Cnp1CenpA (b) and H3K9me2 (c) at centromeric central core. Ectopic Cnp1CenpA-GFP or H3K9me2 were immunoprecipitated with antibody against GFP or H3K9me2 and analyzed by qPCR. Enrichment levels at the central core were normalized against that of act1, and then with that of (b) a wt strain with no Cnp1CenpA tag, or (c) clr4Δ cells lacking H3K9me2. Each grey dot represents a biological replicate. Bars represent mean enrichment, and error bars the standard deviation.
In contrast with CenpA levels, HC levels are slightly increased at the centromeric central core upon Spo11 or Rec8 expression, as evinced by H3K9me2 ChIP (Fig. 4a,c); likewise, the intensities of Swi6HP1 foci at centromeres of properly segregating chromosomes increase upon Spo11 or Rec8 expression (Extended Data Fig. 6e). These HC increases are likely due to the mild reduction of centromeric CenpA, as HC spreads into the centromeric core when CenpA levels are compromised37. Remarkably, despite the slight increase in pericentric Swi6HP1 on segregating chromosomes, Swi6HP1 foci are severely reduced or absent from cen1-tetO/R-tomato foci on mis-segregating chromosomes upon Rec8 expression (Extended Data Fig. 7a–b). This loss of pericentric HC mirrors the HC loss seen on bouquet-deficient meiotic chromosomes experiencing KT loss1. Overexpression of Rec8 in meiosis also triggers loss of Swi6HP1 on those chromosomes that fail to segregate (Extended Data Fig. 7c). As each chromosome harbors roughly the same centromere core length but widely varying pericentric HC lengths, our finding that each chromosome has the same KT loss probability1 suggests that it originates within the CenpA-containing central core. Collectively, our data suggest that modest KT reductions occur at all centromeres upon Spo11 or Rec8 expression but fail to affect KT function and pericentric HC; however, at a subset of centromeres, the balance of CenpA stability versus Spo11/Rec8-mediated destabilization is tipped towards catastrophic CenpA reduction, which propagates outward, erasing pericentric HC.
Spo11 or Rec8 expression in human cells confers KT loss
While Spo11 and Rec8 are confined to meiotic cells in mammals as in S. pombe, they are inappropriately expressed in specific cancer cell types including melanoma and lung38,39. Indeed, meiotic processes are crucial for some cancer proliferation strategies including telomerase-negative ALT telomere maintenance, which requires the meiotic proteins Hop2 and Mnd1 to promote telomere mobility and homology search40. Hence, our finding that meiosis-specific proteins spur centromere dismantlement raises the vital question of whether mis-expression of meiotic proteins can lead to centromere dismantlement in human cells. To address this, we constructed stable U2OS cell lines harboring various human Spo11 alleles or Rec8 under control of the inducible Tet-On 3G system41 (Extended Data Fig. 8a). As for S. pombe, three Spo11 alleles were tested: wt, catalytically dead (YY137,138FF, Spo11-cd)42, and an allele harboring a mutation in the putative DNA binding pocket (G251E; Spo11-dbd)43. Each cell line was induced for ~48 hours before assessing KT loss. Robust inducible expression was confirmed by fluorescence microscopy and western analyses (Extended Data Fig. 8b–e).
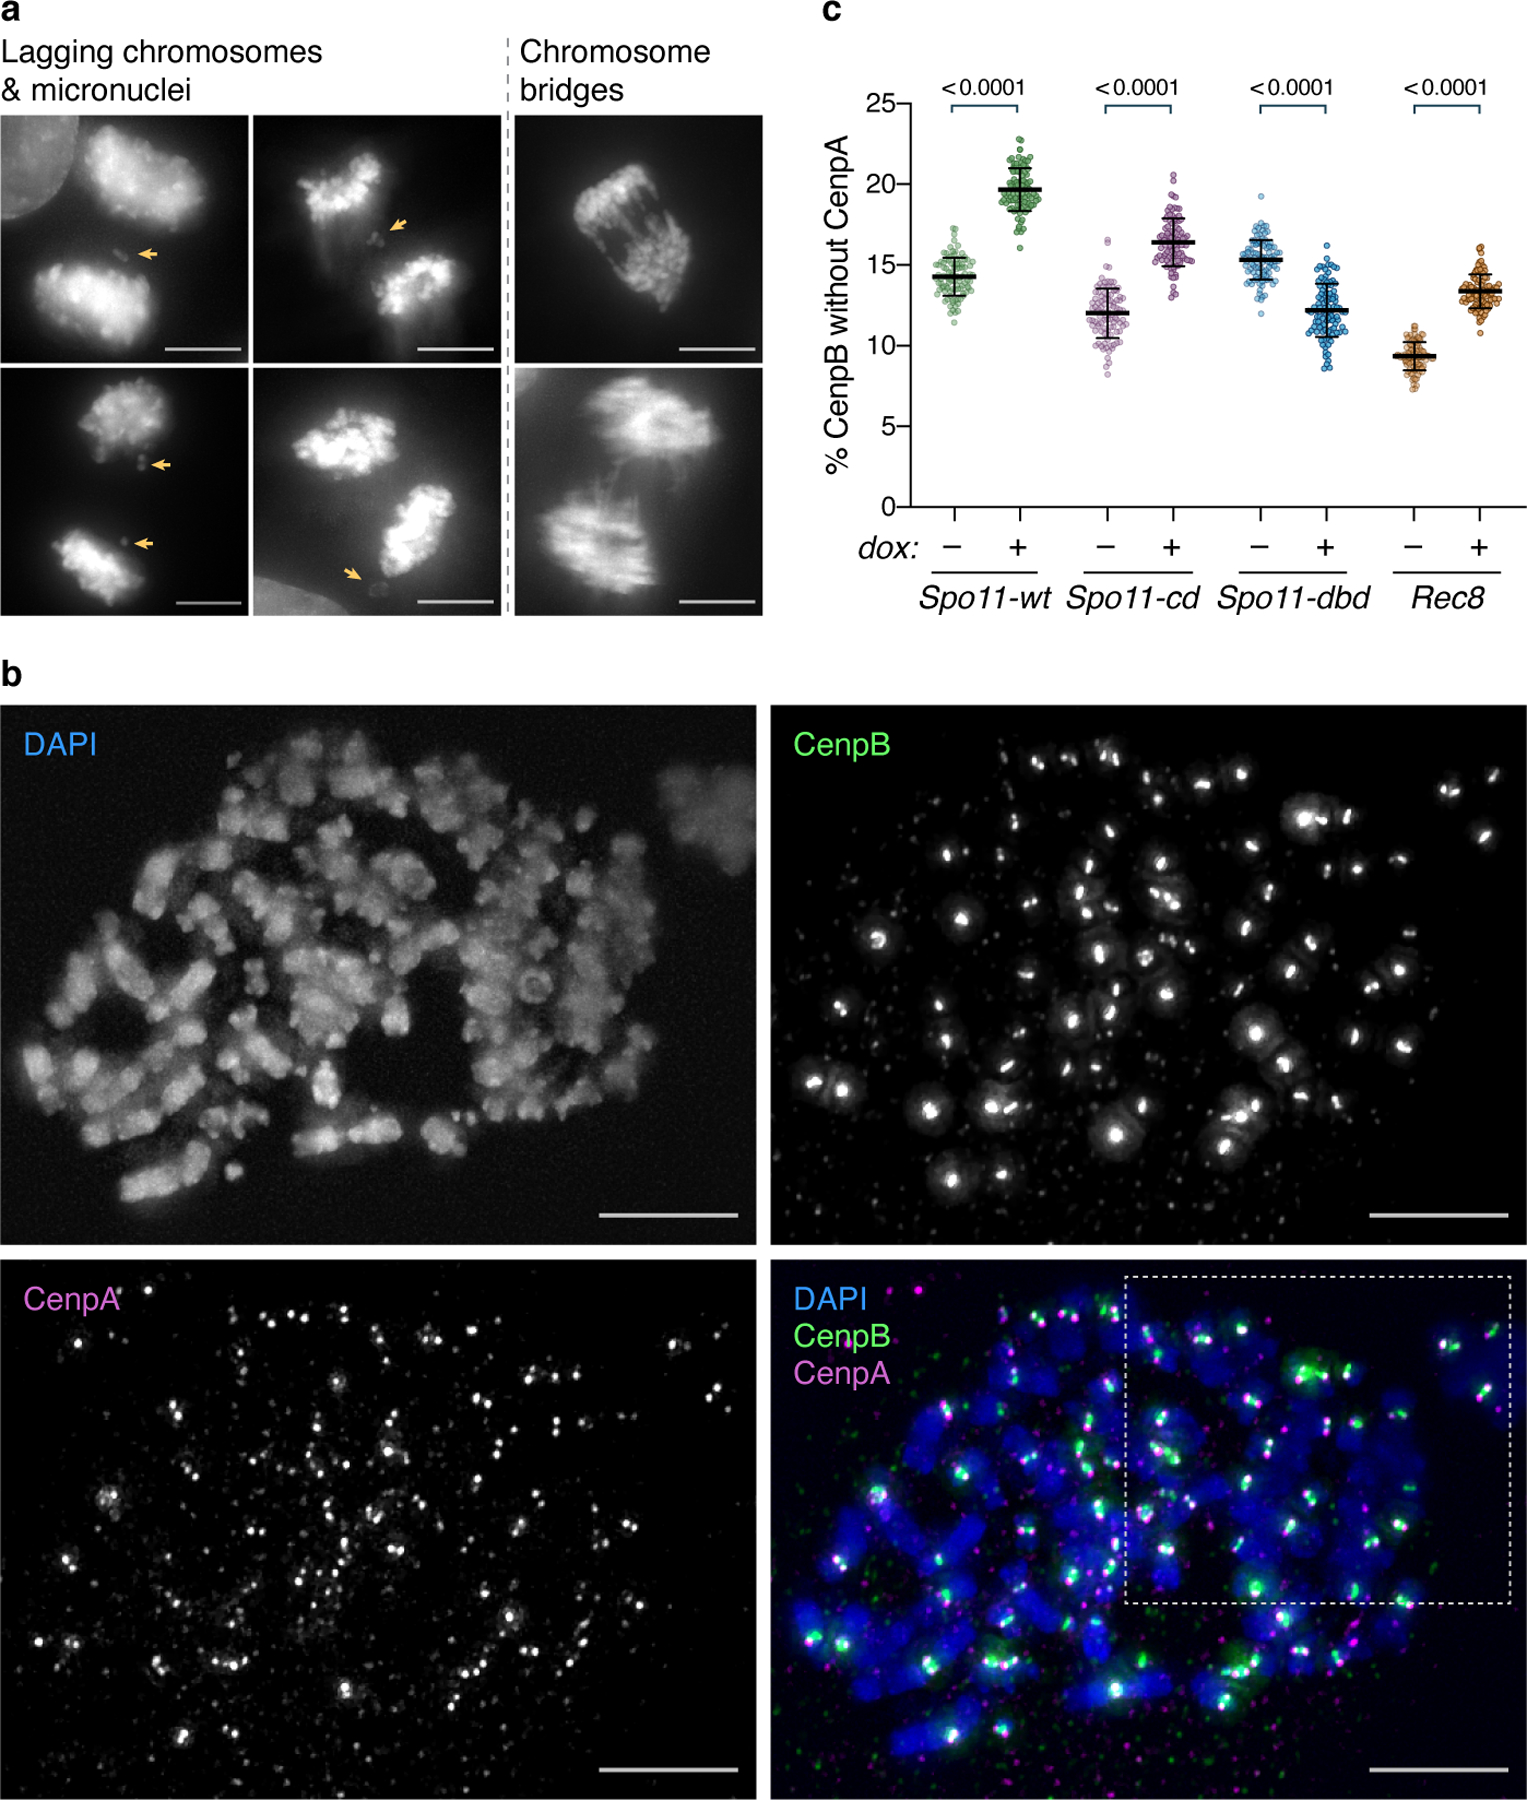
To probe whether human Spo11 and Rec8 confer increased KT loss, we first assessed whether these expressed proteins trigger mitotic defects (Fig. 5a–b, Extended Data Fig. 9a). Indeed, expression of Spo11 (wt and cd, but not dbd) or Rec8 exacerbates the frequency of mitoses with lagging chromosomes or micronuclei, both of which are expected outcomes of KT loss. In contrast, chromosome bridges spanning the two separating nuclei, known outcomes of the constant telomere recombination that occurs in U2OS cells, do not increase upon Spo11/Rec8 expression. Such chromosome bridges cannot stem from KT errors as functional centromeres are required for their formation. Hence, while expressed Spo11, Spo11-cd or Rec8 fail to affect a phenotype that reports on aberrant telomere associations, they confer increased lagging chromosomes and micronuclei.
Fig. 5. Spo11 and Rec8 expression in human cells compromises centromeres.

(a) Representative images of mitoses scored for missegregating chromosomes, examples of which are indicated by yellow arrows. Scale bars = 10 μm.
(b) Quantitation of chromosome segregation defects. Expression of Spo11-wt, Spo11-cd or Rec8, but not Spo11-dbd, increases the frequency of lagging chromosomes and micronuclei; chromosome bridge frequency remains unchanged in all cases. The total number of mitoses analyzed in 4 (Spo11) or 3 (Rec8) experiments is indicated above each bar. p values, determined by two-tailed Fisher’s exact tests, are indicated above brackets. ns: not significant.
(c) Representative image of metaphase chromosome spreads. KTs are stained for CenpB and CenpA; chromosomes with DAPI. Numbered arrowheads indicate boxed regions magnified alongside with automated Gaussian fits to CenpA/B intensity profiles (see Methods) and illustrate CenpA staining patterns: (1) two dots, (2) one-sided loss, or (3) complete loss of CenpA from the KT. Scale bars = 10 μm. See Extended Data Fig. 9b for single channels. BG indicates a representative region used for background subtraction. (d) Automated quantitation (see Methods) of KT loss on metaphase spreads as scored via centromeres lacking CenpA at one or both ends. Expression of Spo11, Spo11-cd or Rec8, but not Spo11-dbd, increases the KT loss rate. The total number of KTs analyzed over 3 experiments is indicated above each bar. p values, determined by two-tailed Fisher’s exact tests, are indicated above brackets. 95% confidence intervals of the odds ratio or its reciprocal (Spo11-dbd) are indicated in square brackets.
The mitotic errors conferred by human Spo11/Rec8 expression may evince that these proteins confer KT loss. As very small increases in KT loss are expected to cause substantially increased mitotic error rates (i.e. even one missegregating chromosome could lead to a lagging chromosome or micronucleus), we sought to quantify KT loss in a large number of chromosomes. To visualize KT loss, we monitored CenpA along with CenpB, an inner KT protein that directly binds ‘CenpB-box’44 DNA motifs. CenpB remains at dysfunctional centromeres depleted of CenpA despite loss of other KT proteins45,46. Hence, KT loss can be scored via the appearance of CenpB chromatin lacking CenpA. CenpB localizes beneath kinetochores47,, displaying a bar-shaped pattern on metaphase chromosomes, with CenpA foci at either end (Fig. 5c, example 1). We developed an algorithm that scores the presence of CenpA staining at either end of each CenpB signal (see Methods; Fig. 5c, Extended Data Fig. 9b–c). A background level of KT loss is seen in the absence of expressed Spo11 or Rec8, likely due to the inherent genomic instability of the multiploid U2OS line48,49. However, expression of Spo11 (wt and cd, but not dbd) or Rec8 triggers a significant increase in the number of CenpB bars lacking CenpA (Fig. 5c–d), evincing an increase in KT loss that can readily explain the increase in lagging chromosomes and micronuclei elicited by Spo11 and Rec8. KT loss can occur at one or two end(s) of the CenpB signal, suggesting that CenpA eviction can occur either before or after replication. Thus, KT loss is increased by Spo11 or Rec8 expression, and may be a point of diagnostic or therapeutic application in cancer cells expressing these meiotic proteins.
Discussion
Our observation that CenpA and KT maintenance become precarious during meiosis (Extended Data Fig. 10) raises the specter of imminent danger posed by meiotic processes. Indeed, Spo11/Rec8-mediated dismantlement may contribute to the CenpA decline, KT fragmentation and chromosome segregation errors seen in oocytes from female mammals of advanced age50,51. Our observations also lend perspective to emerging ideas about centromere maintenance under varying conditions. While CenpA nucleosome turnover rates are exceptionally low in proliferating metazoan cells52,53, they are continually destabilized during quiescence or meiotic prophase arrest, necessitating continual CenpA deposition for centromere maintenance and return to proliferation54. CenpA destabilization in these scenarios is caused at least in part by ongoing transcription of the underlying DNA. In a separate instance of centromere destabilization, the human SENP6 SUMO protease was identified as a KT maintenance factor in whose absence severe diminution of centromere-bound KT components is seen55,56. Indeed, transcription and sumoylation may play roles in Spo11- and Rec8-mediated KT loss.
Mild levels of Spo11- or Rec8-mediated CenpA disruption fail to spread into surrounding HC; however, severe CenpA disruption quashes this opposition, spreading disruption to the pericentric HC (Fig. 4, Extended Data Fig. 6). The mechanisms underlying this transition from mild to catastrophic centromere disruption are under investigation. As pericentric HC is required for de novo establishment of CenpA chromatin6, disruption of pericentric HC triggers loss of local CenpA reassembly potential. Indeed, the role of the telomere bouquet in promoting meiotic KT reassembly stems from the provision of telomeric HC in trans (HH, EK and JPC, in preparation).
Whether the potential centromere disruption imposed by Spo11 and Rec8 serves a positive role in meiosis is a crucial question. Assembly of the monopolar attachment machinery could be facilitated by transient dismantlement. Indeed, dissociation of outer KT components promotes monopolar attachment at budding yeast MI57. Moreover, centromere dismantlement can be considered risk-free in wt meiosis, as colocalization of centromeres and telomeres in early prophase during bouquet formation ensures that centromere reassembly is robust1 (Extended Data Fig. 10). In contrast, proliferating cells lack the bouquet and have no backup system to ensure centromere reassembly.
Overexpressed KT components are markers of cancers experiencing high levels of genome instability, and therefore heightened sensitivity to DNA damaging agents58. Our results suggest an additional mode of cancer cell vulnerability due to insufficient maintenance of centromeres upon Spo11 or Rec8 expression. The increasingly recognized tendency of cancer cells to express meiotic genes38,39 makes it essential to understand the consequences of this aberrant gene expression. Their meiosis-specificity among non-cancer cells would confer an obvious advantage to anti-cancer strategies targeting vulnerabilities introduced by Spo11 or Rec8.
Methods
Yeast strains and media
Details of strains are listed in Supplementary Table 1. spo11 mutations were introduced by replacing ura4 previously inserted at the endogenous spo11 locus and were verified by sequencing. For overexpression constructs, the open reading frames of spo11 with and without indicated mutations were cloned into pREP41 or pFA6a plasmids (under nmt41 or adh1 promoters, respectively) and then integrated at the S. pombe nmt1 termination site or adh1 promoter for overexpression. For lower levels of overexpression, spo11 was cloned into the pFA6A plasmid under control of the adh13 promoter, then integrated at the endogenous spo11 locus. Gene deletions of chromatin remodelers and C-terminal tagging of Pht1H2AZ1 and Cnp3CenpC were created by PCR-based gene replacement 59. Other mutants were obtained from the Japanese National Bioresource Project or as described previously 60–62. Strains with multiple mutated genotypes were generated by mating, sporulation and selection for recombinants. Media were as described (PombeNet; https://dornsife.usc.edu/pombenet/media/).
For overexpression of inducible nmt41-spo11 in meiotic cells, cells were grown in minimal media lacking thiamine to induce nmt41 for 24 hours before meiotic induction.
Cell culture and stable cell line generation
U2OS cells (a generous gift from Eros Lazzerini Denchi; originally from ATCC) were grown in DMEM media supplemented with 10% FBS and 1% Penicillin–Streptomycin-Glutamine at 37 °C in a 5% CO2 incubator. Mycoplasma infection was routinely ruled out. Inducible stable cell lines were generated by transposition with the piggyBac transposase as previously described63. Briefly, one day prior to transfection, cells were seeded at a density of 1.25–2.5 × 10⁵ cells/ml. Plasmids (the piggyBac vector along with the helper plasmid encoding the piggyBac transposase) were transfected with Lipofectamine 3000 (Life Technologies) in a 2:1 ratio according to the manufacturer’s instructions. Six hours after transfection, the medium was exchanged with medium containing Tetracycline-free FBS (Hyclone), to avoid leaky expression of the piggyBac vectors. Two days post transfection, cells were selected with Hygromycin B (250 μg/ml) for one week and expanded for downstream analysis. Cell lines were kept in Tetracycline-free medium containing Hygromycin B (250 μg/ml).
Spo11-myc-DDK from an Origene plasmid (NM_012444) was cloned into a pEGFP-N1 vector (a kind gift from Dr. Paul Meltzer). Mutations of Spo11 were introduced via overlapping PCR followed by replacement cloning of the original Spo11 into pEGFP-N1; mutations were confirmed by sequencing. Spo11 encoded in these constructs was amplified by PCR and introduced to a vector containing the Tet-ON 3G-inducible promoter (TREG), GFP and recognition sites for piggyBac transposase (piggyBac vector) (a kind gift from Dr. Iain Cheeseman) by Gibson assembly. Rec8 from an Origene plasmid (NM_005132) was introduced by Gibson assembly to the piggyBac vector.
Microscopy
Microscopy images were captured on a DeltaVision microscope system (GE Healthcare Life Sciences) equipped with an Olympus IX70 widefield inverted epifluorescence microscope, an Olympus UPlanSapo 60x NA 1.42 oil immersion objective, and a Photometrics CCD CoolSnap HQ camera. For each experiment, images were acquired with identical settings of light intensity, exposure time, number of focal planes and step size. Images were deconvolved and projected into a 2D image with the maximum intensity projection setting by SoftWorx (GE Healthcare Life Sciences). Image processing and analysis were performed using SoftWorx and ImageJ-based software Fiji.
For live cell imaging of meiosis, h90 or a mixture of h+ and h− cells grown to log phase at 30°C on EMM plates with required supplements were spotted on SPA plates at 30°C for 5–7 hours before live microscopy. Cells were adhered to 35 mm glass culture dishes (MatTek) with 0.2 mg/ml soybean lectin (Sigma) and immersed in 3 ml EMM lacking a nitrogen source with required supplements. Time-lapse images were acquired at 30°C in an Environmental Chamber with a DeltaVision Spectris (GE Healthcare Life Sciences) at intervals of 15 minutes. For cells containing Sid4-mCherry, mCherry-Atb2, Pht1H2AZ-mCherry and either Cnp3CenpC-GFP or Ndc80–2xGFP, images were acquired over 22 focal planes with a 0.4 μm step size at intervals of 15 minutes. A meiotic KT loss event was scored if at least one chromatin mass of Pht1H2AZ-mCherry remained unsegregated and lacked detectable KT signal. For cells containing Sid4-mCherry, mCherry-Atb2 and Rec8-GFP, images were acquired over 22 focal planes with a 0.4 μm step size at intervals of 10 minutes. For cells whose centromere 1 was visualized with tetO/R-tomato on dh1L(cen1)::tetO (cen1-tetO/R-tomato), images were acquired at 15 focal planes with a 0.6 μm step size. A meiotic event was scored if a centromere 1 remained unsegregated and lacked detectable Swi6HP1-GFP signal.
To examine live mitosis in cells containing cen1-tetO/R-tomato, cells grown in YES media at 32°C to mid-log phase were adhered to 35 mm glass culture dishes (MatTek) with 0.2 mg/ml soybean lectin (Sigma) and immersed in 3 ml YES (for cells containing Ndc80–2xGFP) or EMM with required supplements (for cells containing Swi6HP1-GFP). Images were acquired at 15 focal planes with a 0.6 μm step size. Cells were designated as late anaphase if the distance between spindle poles was greater than 6 μm; these were analyzed for lagging chromosomes. A lagging centromere 1 was scored as lacking KT or HC, respectively, if the lagging chromosome harbored cen1-tetO/R-GFP but no detectable Ndc80–2xGFP or HP1Swi6-GFP signal.
To examine mitosis in ethanol-fixed samples, cells were grown to mid-log phase (OD595nm = 0.5) in YES media at 32°C and kept in the dark on ice throughout the procedure until imaging. Cells were centrifuged at 3,000 rpm for 2 minutes, resuspended in 1ml 70% ethanol on ice, and incubated for 15 minutes; subsequent steps were also performed on ice. Fixed cells were centrifuged at 3,000 rpm for 30 seconds and resuspended in 1 ml water for rehydration, then centrifuged, resuspended in 1ml PBS containing 5 μg DAPI, and incubated for 3 minutes followed by three washes with 1 ml PBS. Images (size = 2048 × 2048 pixels) were acquired at 25 focal planes with a 0.4 μm step size; an identical exposure sequence of mCherry/FITC/DAPI was used for all images. Deconvolved images were projected as 2D images with the maximal intensity setting and analyzed with Fiji. Cells were designated as late anaphase when the distance between two SPBs (Sid4-mCherry dots) was greater than 6 μm; these were subjected to analysis for lagging chromosomes. To measure the intensities of centromeric proteins on properly segregating chromosomes, cells lacking lagging chromosomes were selected. For any analyzed fields, all qualified cells were measured to avoid bias. The mean intensity within a circle (diameter = 0.76 μm) including the Cnp1CenpA-GFP, Ndc80–2xGFP or Swi6HP1-GFP focus was measured, background subtracted and divided by background. The background was assigned as the mean intensity of two nearby circles with identical 0.76 μm diameter within the same cell.
To examine GFP expression and chromosome mis-segregation in interphase and mitotic U2OS cells, respectively, the cells were plated onto glass coverslips and induced by addition of doxycycline (1 μg/ml). Two days later (~48–50 hours), cells were fixed in 4% paraformaldehyde/PBST (1XPBS/0.1% Triton X-100). To investigate kinetochore loss, metaphase spreads were prepared as previously described64. Briefly, following mitotic shake off, cells were blocked in metaphase with 1μg/ml Colcemid and incubated at 37°C for 30 minutes. The supernatant was collected and mixed with adherent cells after their trypsinization. The cells were pelleted by centrifugation and were counted. For each slide, 1.5×10⁵ cells were resuspended in 75mM KCl, incubated at room temperature (RT) for 10 minutes and cytospun onto a glass slide in a single-chamber funnel for 10 minutes at 900 rpm on high acceleration, in a Shandon Cytospin 4. Cells were fixed as described above.
For immunofluorescence, cells were washed once in PBST and blocked in 1% BSA/PBST at RT for at least 30 minutes. Primary antibodies (CenpA (Abcam ab13939), CenpB (Abcam ab25734)) were incubated overnight at 4 °C. Secondary antibodies coupled to Alexa Fluor 555 and 647 (Invitrogen) were incubated for one hour at RT. All antibodies were used at 1:100 dilution, in 1% BSA in PBST. DNA was counterstained with DAPI in PBST (5 µg/ml), and coverslips were mounted on slides with Vectashield (Vector Laboratories). All images were taken as 50 Z-stacks of 0.2 μm increments, using the same exposure conditions for each genotype processed in a given experiment. Images were deconvolved on a SoftWorx Explorer Suite (Applied Precision) and analyzed on Fiji as described below.
To assess chromosome segregation defects, the presence of DAPI signal disconnected from the dividing nuclei was assessed blindly. Projections of maximum intensity are shown. Statistical analysis was performed with Prism 8 (GraphPad Software), using Fisher’s exact tests.
Semi-automated quantitation of KT loss
We developed a Fiji/ImageJ macro to score for the presence of CenpA signal on either side of a CenpB bar. For each imaged field of chromosome spreads (karyotype), we selected non-overlapping centromere pairs for analysis, as well as a number of equivalent-sized areas for background subtraction. This was the only manual step in the method, and was performed blind by initially viewing only the channels representing CenpB and DAPI.
The rest of the automated method proceeded as follows. To improve signal-to-noise, each image was denoised by 2D anisotropic diffusion, subjected to background (average intensity of selected background regions) subtraction, and normalized (pixel intensities were divided by average background, then by the mean of all selected centromere regions). Individual centromere pairs were oriented horizontally along the length of the CenpB bar, and the CenpA/B intensity profiles along this horizontal axis were computed. A peak counting method determined the number of CenpA peaks (maxima) above background in the intensity profiles. As appropriate, a single Gaussian or linear mixture of two Gaussians was fit to the CenpA/B intensity profiles. The output was the number of CenpB half-bars (centromeres) lacking CenpA, after discarding bad fits (r2 < 0.75) and completely overlapping CenpA/B profiles.
We aggregated the output from multiple images for each group (genotype ± doxycycline) from three independent experiments and calculated the percentage of centromeres lacking CenpA. We used GraphPad Prism 9 to perform two-sided Fisher’s exact tests for statistical significance and to compute 95% confidence intervals for the odds ratios, comparing induced vs uninduced samples for each genotype.
Bootstrapping
To examine, in a statistically rigorous manner, the validity of pooling data from multiple experiments quantifying KT loss, we used bootstrapping to assess the possible spread of experimental outcomes for each group (genotype ± doxycycline). Briefly, given a set of data points containing the number of CenpB half-bars (centromeres) lacking CenpA per karyotype from three independent experiments for a particular group, we used GNU Octave 4.4.1 to randomly resample with replacement from this set 100 times. For each iteration, we computed the percentage of centromeres lacking CenpA. Using these 100 estimates per group, we plotted the mean ± standard deviation (SD) of the percentage of centromeres lacking CenpA using GraphPad Prism 9 (Extended Data Fig. 9c). The bootstrapped estimates provided sufficient statistical power to perform tests that take into account variation both within and between groups; we performed an ordinary one-way ANOVA (assuming equal SDs) and Sidak’s multiple comparison test (comparing the means of induced vs uninduced samples for each genotype). We determined that there was low variation within groups, and thus between samples of the same genotype from different experiments, justifying the pooling of data from multiple experiments; we also found a statistically significant difference in the mean estimate of percentage of centromeres lacking CenpA upon doxycycline induction for each genotype.
Methylene blue staining
20ml of S. pombe cells grown to mid-log phase in YES media at 32°C were centrifuged at 3,000 rpm for 2 minutes and washed twice with 1 ml PBS (pH 7.4) at room temperature. Cell pellets were resuspended in 100 μl PBS, mixed with 100 μl 0.0002% methylene blue in PBS, and incubated in the dark at room temperature for 5 minutes. Cells were then centrifuged, washed twice in 1 ml PBS and kept in the dark before imaging. Snapshots of methylene blue-stained cells were acquired at the setting for Cy5 (excitation at 632 nm and emission at 679 nm) and overlaid on brightfield images for scoring.
ChIP analysis
ChIP experiments were performed as described with the exception of the final purification step 65. In brief, cells grown in EMM with required supplements (for experiments with Spo11.OE1 cells) or YES (for experiments with Rec8.OE cells) to mid-log phase were cross-linked with 3% paraformaldehyde and vigorously shaken with glass beads for lysis. The lysates were cleared by centrifugation, sonicated to generate DNA fragments with sizes of 0.5–1 kb, and immunoprecipitated with anti-Flag antibodies conjugated to magnetic beads (Sigma-Aldrich; for each reaction, 15 µl), anti-GFP antibodies (Abcam ab290, 3 µg/ml lysate) or anti-H3K9me2 antibodies (Abcam 1220, 3 µg/ml lysate); the latter two were subjected to pull-down with Protein G dynabeads (Thermo Fisher; 15 µl). The crosslinking was reversed, and DNA was purified with the Qiaquick PCR purification kit. Quantitative real-time PCR was performed with SYBR green master mix (Roche) in a real-time PCR system (Applied Biosystems), and data were analyzed with Microsoft Excel (Microsoft, version 16.29.1). For each primer pair, serial dilutions of DNA were used as templates to generate a standard curve of amplification for each plate of PCR reactions, and the relative concentration of target sequence was calculated accordingly. The enrichment of a target sequence in immunoprecipitated DNA over whole-cell extract was calculated and normalized to that of a reference sequence (act1).
Primers used for ChIP analysis:
act1: GATTCTCATGGAGCGTGGTT / GGAGGAAGATTGAGCAGCAG
centromere core: AAAAGGCCGGCTCATTTATAG / AGGCGATTGAAATCCCTTTA
Analysis of Gene Transcription
Total RNA was extracted from S.pombe cells at mid-log phase using the MasterPure™ Yeast RNA Purification Kit (Epicentre). Reverse transcription and real-time quantitative PCR were performed with a mixture of SuperScript™ III Reverse Transcriptase (Invitrogen) and SYBR green master mix (Roche). Serial dilutions of RNA were used as templates to generate the standard curve for each target sequence. The relative concentration of target sequence in each sample was calculated accordingly and normalized to that of a reference sequence (act1). For each gene, the RNA level in wild type cells served as a reference for normalization.
Primers used for transcription analysis
act1: GATTCTCATGGAGCGTGGTT / GGAGGAAGATTGAGCAGCAG
crs1: TGCGCTTCGTTCTGGGTCTT / TCTGCAGAACCATTTGTGGGCA
mei4: ACCGTTGACGACGCGAGAGA / GCATCGTTTGAGACTTCGGCAGC
Western Blotting
25 OD595 units of S. pombe cells (approximately 3.7–5 ×10⁸ cells) at mid-log phase were vigorously shaken with glass beads. 300 μl lysates in Laemmli buffer were heated at 95°C for 5 minutes and cleared by centrifugation. The supernatant was diluted 8-fold in Laemmli buffer, and 10–15 μl of each sample used for SDS-PAGE and western transfer. Expression of myc-tagged Spo11 and HA-tagged Rec8 was detected with antibodies against Myc (BioXcell at 1:50,000 dilution) and HA (Abcam ab9110 at 1:5,000 dilution). Cdc2 was detected with antibody from Santa Cruz Biotechnology (Sc-53 at 1:5,000 dilution) and served as loading control.
For western blot analysis of U2OS cell lines, extracts were prepared as previously described64. Following trypsinization, cells were resuspended in 2X Tris–Glycine SDS sample buffer (Novex, Life Technologies) at a concentration of 2.5 × 10⁴ cells/μl, sonicated for 5 cycles of 30s (high) and boiled for 5 min at 95 °C. GFP expression was detected with an antibody against GFP (Abcam ab290 at 1:5,000 dilution). Endogenous Spo11 expression was detected with a rabbit monoclonal (clone MB36–4) antibody against Spo11-β isoform (generous gift from Dr. D. Camerini-Otero66) at 1:500 dilution. As a loading control tubulin was detected (Abcam ab6160 at 1:5,000 dilution) on the same blots.
Software availability
The Fiji/ImageJ macro to score for the presence of CenpA signal on either side of a CenpB bar is available (Supplementary Software) under a GNU General Public License v3.0, and has been tested on Fiji/ImageJ 2.0.0-rc-69/1.53b.
Data Availability
Source data are provided with this paper. Reagents and any further information are available on request to JPC or HH.
Extended Data
Extended Data Fig. 1. Spo11 and Rec8 cause meiotic KT loss in the absence of HC.

Quantitation of KT loss phenotypes as exemplified in Figure 1a. KTs are visualized with Ndc80–2xGFP (a) or Cnp3CenpC−GFP (b-c). (a) spo11Δ and rec8Δ rescue KT loss in clr4Δ cells while deletions in other subcomplexes25 of the meiotic recombination machinery do not. (b) spo11+ deletion or the DNA binding-deficient spo11-dbn mutant rescue KT loss in the absence of Swi6HP1, while spo11-cd triggers KT loss as does wt spo11. (c) rec8+ deletion, but not rec11+ deletion, suppresses KT loss in the absence of Swi6HP1, mirroring these proteins’ effects in bqt1Δ cells. Total numbers of films analyzed are indicated above each bar. p values are determined by two-tailed Fisher’s exact tests and indicated above brackets.
Extended Data Fig. 2. Overexpression of Spo11/Rec8 elevates KT loss rate, and chromatin remodelers are required for meiotic KT dismantlement.

Quantitation of KT loss phenotypes as in Figure 1a. (a) Expressing a tandem copy of spo11+ under the control of weaker (relative to adh1 or nmt41) adh13 promoter (spo11.OE3) does not confer KT loss in a bqt1+ setting, but increases KT loss in the bqt1Δ setting. (b-c) Strong overexpression of spo11+ (spo11.OE1, controlled by nmt41 promoter) or rec8+ (rec8.OE, controlled by adh1 promoter) elevates the frequency of meiotic KT loss in bqt1Δ (b) and swi6Δ (c) settings. Total numbers of films analyzed indicated above each bar. p values are determined by two-tailed Fisher’s exact tests and indicated above brackets. (d) Loss of a CHD remodeler (Hrp3) or RSC component (Rsc1) rescues KT loss in the absence of swi6HP1; other chromatin remodelers have no effect. Total numbers of films analyzed indicated above each bar. p values are determined by two-tailed Fisher’s exact tests and indicated above brackets.
Extended Data Fig. 3. RSC facilitates Rec8 localization to meiotic centromeres.

(a) Frames of representative films monitoring endogenously GFP-tagged Rec8 through meiosis are shown. During prophase, Rec8 localizes throughout the nucleus. As cells approach MI, Rec8 begins to disappear but remains concentrated at centromeres, as seen at enhanced brightness. At the end of MI, Rec8 foci are clearly visible in the wt cell but not in the rsc1Δ cell. The frames highlighted in the yellow box are shown below; these foci subsequently disappear at MII. Scale bars = 5μm.
(b) Quantitation of meiotic cells harboring zero, one or two Rec8 foci at the end of MI. Total numbers of films analyzed are indicated above each bar. All rsc1Δ films show diminished Rec8-GFP at the end of MI, and most of them fail to show any detectable Rec8-GFP on at least one SPB.
Extended Data Fig. 4. RSC facilitates overexpressed Rec8 localization to meiotic centromeres, and expression of Spo11 and Rec8 in proliferating cells causes KT loss as visualized via a fluorescent array on cen1.

(a) Frames of representative films monitoring overexpressed Rec8-GFP through meiosis. During prophase, Rec8 localizes throughout the nucleus. As cells approach MI, Rec8 begins to disappear but remains concentrated at centromeres. At the end of MI, Rec8 foci are clearly visible in the wt cell, but not in rsc1Δ cells. The frames highlighted in the yellow box are enlarged in the right-hand panels; these foci subsequently disappear at MII. Scale bars = 5 μm.
(b) Quantitation of meiotic cells harboring Rec8 foci at the end of MI. Total numbers of films analyzed are indicated above each bar. All rsc1Δ films show diminished Rec8-GFP at the end of MI, and most fail to show any detectable Rec8-GFP on at least one SPB.
(c) Top: schematic outlining the loss of KT components on cen1 in anaphase cells. Below: Images of live cells in late anaphase; the KT is visualized with Ndc80–2xGFP, cen1 via cen1-tetO/R-tomato, and the spindle via mCherry-Atb2. Arrows indicate lagging cen1 with KT loss. Lagging cen1 with intact KT is also shown (right-hand panel) but is excluded from quantitation. Scale bars = 5μm. (d) Quantitation of cen1 KT loss as exemplified in (a). Expression of Spo11 or Rec8 increase the anaphase KT loss of cen1. Total numbers of cells analyzed are indicated above each bar. p values are determined by two-tailed Fisher’s exact tests and indicated above brackets.
Extended Data Fig. 5. Expression of Spo11 or Rec8 in proliferating cells causes KT loss and cell death, directly and independently of RSC.

(a) Deletion of rsc1+ does not affect centromeric localization of Rec8 in proliferating cells. Representative images of proliferating cells expression Rec8-GFP based on two independent experiments. Rec8-GFP forms foci at centromeres that co-localize with SPBs. No visible change in the intensity of these Rec8 foci is observed upon rsc1+ deletion. Scale bar = 5 μm.
(b) Expression of Spo11 or Rec8 increases the percentage of inviable cells. Representative images of fields of cells stained with methylene blue, which cannot be exported from inviable cells. Scale bars = 10 μm. Quantitation of 1 representative experiment (of three performed) is shown in (c). (d) Rec8 overexpression does not affect expression of other DSR-containing genes. The levels of crs1 and mei4 transcripts are elevated by red1+ deletion but not affected by rec8+ overexpression. Total RNA was extracted and analyzed by Real-time PCR with primers annealing to crs1+ and mei4+. The expression level is normalized against that of act1+, and then with that of a control wt strain. Mean expression levels and standard deviations are calculated based on 3 repeats of each genotype.
Extended Data Fig. 6. Expression of Spo11 and Rec8 reduces levels of CenpA at functioning KTs.

(a-b) ChIP analysis of Cnp1CenpA at centromeric central core region. Endogenously 3xFlag-tagged Cnp1CenpA was immunoprecipitated with anti-Flag antibody and analyzed by Real-Time qPCR using a primer pair annealing to the central cores of chromosomes I and III. Enrichment level is normalized against that of act1+, and then with that of a control wt strain with no tag on Cnp1CenpA. Spo11 was expressed under control of nmt41 (spo11-OE1) and cells were grown under conditions that induce nmt41 (minimal media). Mitotic Cnp1CenpA enrichment at the central core is reduced upon expression of Spo11(a) or Rec8 (b), as is the case for cells overexpressing Spo11 under the adh1 promoter, or Rec8 under adh1 control, in rich media (Fig. 4b). The values for each biological replicate are shown as grey dots. Mean enrichment and standard deviations are shown in bars.
(c-e) Expression of Spo11 and Rec8 confers overall reduction of KT components on properly segregating chromosomes. Dotplots of Cnp1CenpA-GFP, Swi6HP1-GFP and Ndc80-GFP intensity on segregated chromosomes (see Methods). Anaphase cells without lagging chromosomes, as exemplified in the images atop each graph, were analyzed, using the same strains as in Figure 4. Arrows indicate foci whose intensities are measured. Each dot in the plot represents a distinct centromere focus. Mean intensity and standard deviation are shown for a representative experiment of two or more performed. Spo11 or Rec8 expression reduces Cnp1CenpA and Ndc80 intensity (c,e) on properly segregated anaphase centromeres, but modestly increases Swi6HP1-GFP intensity (d). p values are determined by Kolmogorov-Smirnov tests and indicated above brackets. Scale bars = 5 μm.
Extended Data Fig. 7. Expression of Rec8 leads to HC loss on lagging cen1.

(a) Top: Schematic of possible cen1 and HC focus behaviors in anaphase cells; HC (represented by Swi6HP1-GFP) localizes to large centromeric foci as well as multiple small subtelomeric foci. Below: Images of live cells in late anaphase; HC is visualized via Swi6HP1-GFP, cen1 via cen1-tetO/R-tomato, and microtubules via mCherry-Atb2. Arrows indicate lagging cen1 with HC loss. Lagging cen1 with intact HC is excluded from quantitation. Scale bars = 5 μm.
(b) Quantitation of cen1 HC loss as exemplified in (A). Expression of Rec8 causes anaphase HC loss at cen1. Total numbers of cells are indicated above each bar. p values are determined by two-tailed Fisher’s exact tests and indicated above brackets.
(c) Quantitation of HC loss on unsegregated cen1 during meiosis. Overexpression of Rec8 during meiosis increases the incidence of unsegregated cen1 lacking detectable Swi6HP1-GFP. Total numbers of films analyzed are indicated above each bar. p values are determined by two-tailed Fisher’s exact tests and indicated above brackets.
Extended Data Fig. 8. Inducible expression of Spo11 alleles and Rec8 in U2OS cells.

(a) Experimental setup for inducible expression of Spo11 alleles and Rec8 in U2OS cells. Schematic of Tet-ON system used for inducible expression of GFP-tagged genes of interest (GOI) (upper panel). The reversible tetracycline activator (Tet-ON 3G) is constitutively expressed under regulation of the EF1α core promoter. Addition of doxycycline (dox) induces binding of the transactivator 3G (blue circles) to the TRE3G promoter, inducing expression of the GOI.
(b,c) Representative images of fixed cells with or without addition of doxycycline. Spo11 (b) and Rec8 (c) are C-terminally tagged with GFP and nuclei are counterstained with DAPI. Scale bars = 20μm. While Spo11/Rec8 localize largely to the cytoplasm, all alleles enter the nucleus as well.
(d) Western blots probed with anti-Spo11 or anti-GFP antibody show no detectable expression of endogenous Spo11 (predicted ~44kDa), but show robust induced expression of the GFP tagged Spo11 alleles (predicted size ~82.5KDa). Loading is controlled with an antibody against tubulin, and westerns were performed three times with identical results.
(e) Western blot probed with anti-GFP antibody shows expression of tagged Rec8 (predicted ~100KDa) upon doxycycline induction. Loading is controlled with anti-tubulin antibody.
Extended Data Fig. 9. U2OS cells expressing Spo11 alleles and Rec8 show centromeric and mitotic defects.
(a) Additional images of mitoses scored for segregation defects. Chromosomes are counterstained with DAPI. Examples of lagging chromosomes or micronuclei are indicated by yellow arrows. Scale bars = 10 μm. (b) Individual channels from representative image of metaphase chromosome spreads from Fig. 5c, in grayscale. KTs are stained for CenpB (green) and CenpA (magenta); chromosomes are counterstained with DAPI. Scale bar = 10 μm. (c) Data for KT loss (Fig. 5d) bootstrapped as described in Methods to generate 100 estimates of %CenpB half-bars (centromeres) without CenpA per sample. Mean ± standard deviation bars are superimposed on individual data points. p values indicated above brackets are calculated by an ordinary one-way ANOVA and Sidak’s multiple comparison test (for each genotype ±dox). The data show low variability between samples of the same genotype from different experiments, justifying pooling of data from independent experiments; statistically significant differences in means are seen upon doxycycline induction.
Extended Data Fig. 10. Working model for centromere dismantlement in meiosis.

Meiotic Spo11 and Rec8 binding to chromatin (1) destabilizes CenpA nucleosomes; (2) their dismantlement propagates outwards to surrounding pericentric HC (3). (4) Telomeres, which are in close proximity to centromeres during bouquet formation in meiotic prophase, provide a microdomain that favors centromeric reassembly.
Supplementary Material
Acknowledgements
We thank Eros Lazzerini Denchi for reagents, equipment and advice for human cell experiments; Iain Cheeseman for discussion and reagents for the piggyBac transposase system; our lab members and Michael Lichten for discussions; Daniel Camerini-Otero, Florencia Pratto and Kevin Brick for discussions and the Spo11 antibody; Andre Nussenzweig’s lab for sharing equipment; Maria Diaz de la Loza for help with illustrations. This work was supported by the National Cancer Institute and the University of Colorado School of Medicine.
Footnotes
Competing Interests
The authors declare no competing financial or non-financial interests.
References
- 1.Klutstein M, Fennell A, Fernandez-Alvarez A & Cooper JP The telomere bouquet regulates meiotic centromere assembly. Nat Cell Biol 17, 458–469 (2015). [DOI] [PMC free article] [PubMed] [Google Scholar]
- 2.Allshire RC & Karpen GH Epigenetic regulation of centromeric chromatin: old dogs, new tricks? Nat Rev Genet 9, 923–937 (2008). [DOI] [PMC free article] [PubMed] [Google Scholar]
- 3.McKinley KL & Cheeseman IM The molecular basis for centromere identity and function. Nat Rev Mol Cell Biol 17, 16–29 (2016). [DOI] [PMC free article] [PubMed] [Google Scholar]
- 4.Allshire RC, Javerzat JP, Redhead NJ & Cranston G Position effect variegation at fission yeast centromeres. Cell 76, 157–169 (1994). [DOI] [PubMed] [Google Scholar]
- 5.Cam HP et al. Comprehensive analysis of heterochromatin- and RNAi-mediated epigenetic control of the fission yeast genome. Nat Genet 37, 809–819 (2005). [DOI] [PubMed] [Google Scholar]
- 6.Folco HD, Pidoux AL, Urano T & Allshire RC Heterochromatin and RNAi are required to establish CENP-A chromatin at centromeres. Science 319, 94–97 (2008). [DOI] [PMC free article] [PubMed] [Google Scholar]
- 7.de Lange T Shelterin-Mediated Telomere Protection. Annu Rev Genet 52, 223–247 (2018). [DOI] [PubMed] [Google Scholar]
- 8.Hou H & Cooper JP Stretching, scrambling, piercing and entangling: Challenges for telomeres in mitotic and meiotic chromosome segregation. Differentiation 100, 12–20 (2018). [DOI] [PubMed] [Google Scholar]
- 9.Kanoh J, Sadaie M, Urano T & Ishikawa F Telomere binding protein Taz1 establishes Swi6 heterochromatin independently of RNAi at telomeres. Curr Biol 15, 1808–1819 (2005). [DOI] [PubMed] [Google Scholar]
- 10.Barchi M, Cohen P & Keeney S Special issue on “recent advances in meiotic chromosome structure, recombination and segregation”. Chromosoma 125, 173–175 (2016). [DOI] [PubMed] [Google Scholar]
- 11.Robert T et al. The TopoVIB-Like protein family is required for meiotic DNA double-strand break formation. Science 351, 943–949 (2016). [DOI] [PubMed] [Google Scholar]
- 12.Vrielynck N et al. A DNA topoisomerase VI-like complex initiates meiotic recombination. Science 351, 939–943 (2016). [DOI] [PubMed] [Google Scholar]
- 13.Klutstein M & Cooper JP The Chromosomal Courtship Dance-homolog pairing in early meiosis. Curr Opin Cell Biol 26C, 123–131 (2014). [DOI] [PMC free article] [PubMed] [Google Scholar]
- 14.Kitajima TS, Yokobayashi S, Yamamoto M & Watanabe Y Distinct cohesin complexes organize meiotic chromosome domains. Science 300, 1152–1155 (2003). [DOI] [PubMed] [Google Scholar]
- 15.Duro E & Marston AL From equator to pole: splitting chromosomes in mitosis and meiosis. Genes Dev 29, 109–122 (2015). [DOI] [PMC free article] [PubMed] [Google Scholar]
- 16.Kitajima TS, Kawashima SA & Watanabe Y The conserved kinetochore protein shugoshin protects centromeric cohesion during meiosis. Nature 427, 510–517 (2004). [DOI] [PubMed] [Google Scholar]
- 17.Chikashige Y et al. Telomere-led premeiotic chromosome movement in fission yeast. Science 264, 270–273 (1994). [DOI] [PubMed] [Google Scholar]
- 18.Cooper JP, Watanabe Y & Nurse P Fission yeast Taz1 protein is required for meiotic telomere clustering and recombination. Nature 392, 828–831 (1998). [DOI] [PubMed] [Google Scholar]
- 19.Nimmo ER, Pidoux AL, Perry PE & Allshire RC Defective meiosis in telomere-silencing mutants of Schizosaccharomyces pombe. Nature 392, 825–828 (1998). [DOI] [PubMed] [Google Scholar]
- 20.Scherthan H A bouquet makes ends meet. Nat Rev Mol Cell Biol 2, 621–627 (2001). [DOI] [PubMed] [Google Scholar]
- 21.Fennell A, Fernandez-Alvarez A, Tomita K & Cooper JP Telomeres and centromeres have interchangeable roles in promoting meiotic spindle formation. J Cell Biol 208, 415–428 (2015). [DOI] [PMC free article] [PubMed] [Google Scholar]
- 22.Sharif WD, Glick GG, Davidson MK & Wahls WP Distinct functions of S. pombe Rec12 (Spo11) protein and Rec12-dependent crossover recombination (chiasmata) in meiosis I; and a requirement for Rec12 in meiosis II. Cell Chromosome 1, 1 (2002). [DOI] [PMC free article] [PubMed] [Google Scholar]
- 23.Nichols MD, DeAngelis K, Keck JL & Berger JM Structure and function of an archaeal topoisomerase VI subunit with homology to the meiotic recombination factor Spo11. EMBO J 18, 6177–6188 (1999). [DOI] [PMC free article] [PubMed] [Google Scholar]
- 24.Diaz RL, Alcid AD, Berger JM & Keeney S Identification of residues in yeast Spo11p critical for meiotic DNA double-strand break formation. Mol Cell Biol 22 (2002). [DOI] [PMC free article] [PubMed] [Google Scholar]
- 25.Miyoshi T et al. A central coupler for recombination initiation linking chromosome architecture to S phase checkpoint. Mol Cell 47, 722–733 (2012). [DOI] [PubMed] [Google Scholar]
- 26.Fowler KR, Gutierrez-Velasco S, Martin-Castellanos C & Smith GR Protein determinants of meiotic DNA break hot spots. Mol Cell 49, 983–996 (2013). [DOI] [PMC free article] [PubMed] [Google Scholar]
- 27.Nonaka N et al. Recruitment of cohesin to heterochromatic regions by Swi6/HP1 in fission yeast. Nat Cell Biol 4, 89–93 (2002). [DOI] [PubMed] [Google Scholar]
- 28.Kugou K et al. Rec8 guides canonical Spo11 distribution along yeast meiotic chromosomes. Mol Biol Cell 20, 3064–3076 (2009). [DOI] [PMC free article] [PubMed] [Google Scholar]
- 29.Lopez-Serra L, Kelly G, Patel H, Stewart A & Uhlmann F The Scc2-Scc4 complex acts in sister chromatid cohesion and transcriptional regulation by maintaining nucleosome-free regions. Nat Genet 46, 1147–1151 (2014). [DOI] [PMC free article] [PubMed] [Google Scholar]
- 30.Munoz S, Minamino M, Casas-Delucchi CS, Patel H & Uhlmann F A Role for Chromatin Remodeling in Cohesin Loading onto Chromosomes. Mol Cell 74, 664–673 e665 (2019). [DOI] [PMC free article] [PubMed] [Google Scholar]
- 31.Pointner J et al. CHD1 remodelers regulate nucleosome spacing in vitro and align nucleosomal arrays over gene coding regions in S. pombe. EMBO J 31, 4388–4403 (2012). [DOI] [PMC free article] [PubMed] [Google Scholar]
- 32.Shim YS et al. Hrp3 controls nucleosome positioning to suppress non-coding transcription in eu- and heterochromatin. EMBO J 31, 4375–4387 (2012). [DOI] [PMC free article] [PubMed] [Google Scholar]
- 33.Hennig BP, Bendrin K, Zhou Y & Fischer T Chd1 chromatin remodelers maintain nucleosome organization and repress cryptic transcription. EMBO reports 13, 997–1003 (2012). [DOI] [PMC free article] [PubMed] [Google Scholar]
- 34.Folco HD et al. Untimely expression of gametogenic genes in vegetative cells causes uniparental disomy. Nature 543, 126–130 (2017). [DOI] [PMC free article] [PubMed] [Google Scholar]
- 35.Harigaya Y et al. Selective elimination of messenger RNA prevents an incidence of untimely meiosis. Nature 442, 45–50 (2006). [DOI] [PubMed] [Google Scholar]
- 36.Sugiyama T & Sugioka-Sugiyama R Red1 promotes the elimination of meiosis-specific mRNAs in vegetatively growing fission yeast. EMBO J 30, 1027–1039 (2011). [DOI] [PMC free article] [PubMed] [Google Scholar]
- 37.Lu M & He X Intricate regulation on epigenetic stability of the subtelomeric heterochromatin and the centromeric chromatin in fission yeast. Current genetics 65, 381–386 (2019). [DOI] [PubMed] [Google Scholar]
- 38.Lindsey SF et al. Potential role of meiosis proteins in melanoma chromosomal instability. Journal of skin cancer 2013, 190109 (2013). [DOI] [PMC free article] [PubMed] [Google Scholar]
- 39.Koslowski M et al. Multiple splice variants of lactate dehydrogenase C selectively expressed in human cancer. Cancer research 62, 6750–6755 (2002). [PubMed] [Google Scholar]
- 40.Cho NW, Dilley RL, Lampson MA & Greenberg RA Interchromosomal homology searches drive directional ALT telomere movement and synapsis. Cell 159, 108–121 (2014). [DOI] [PMC free article] [PubMed] [Google Scholar]
- 41.McKinley KL et al. The CENP-L-N Complex Forms a Critical Node in an Integrated Meshwork of Interactions at the Centromere-Kinetochore Interface. Mol Cell 60, 886–898 (2015). [DOI] [PMC free article] [PubMed] [Google Scholar]
- 42.Boateng KA, Bellani MA, Gregoretti IV, Pratto F & Camerini-Otero RD Homologous pairing preceding SPO11-mediated double-strand breaks in mice. Dev Cell 24, 196–205 (2013). [DOI] [PMC free article] [PubMed] [Google Scholar]
- 43.DeWall KM, Davidson MK, Sharif WD, Wiley CA & Wahls WP A DNA binding motif of meiotic recombinase Rec12 (Spo11) defined by essential glycine-202, and persistence of Rec12 protein after completion of recombination. Gene 356, 77–84 (2005). [DOI] [PMC free article] [PubMed] [Google Scholar]
- 44.Masumoto H, Masukata H, Muro Y, Nozaki N & Okazaki T A human centromere antigen (CENP-B) interacts with a short specific sequence in alphoid DNA, a human centromeric satellite. J Cell Biol 109, 1963–1973 (1989). [DOI] [PMC free article] [PubMed] [Google Scholar]
- 45.Fachinetti D et al. A two-step mechanism for epigenetic specification of centromere identity and function. Nat Cell Biol 15, 1056–1066 (2013). [DOI] [PMC free article] [PubMed] [Google Scholar]
- 46.Hoffmann S et al. CENP-A Is Dispensable for Mitotic Centromere Function after Initial Centromere/Kinetochore Assembly. Cell reports 17, 2394–2404 (2016). [DOI] [PMC free article] [PubMed] [Google Scholar]
- 47.Cooke CA, Bernat RL & Earnshaw WC CENP-B: a major human centromere protein located beneath the kinetochore. J Cell Biol 110, 1475–1488 (1990). [DOI] [PMC free article] [PubMed] [Google Scholar]
- 48.Bayani J et al. Spectral karyotyping identifies recurrent complex rearrangements of chromosomes 8, 17, and 20 in osteosarcomas. Genes Chromosomes Cancer 36, 7–16 (2003). [DOI] [PubMed] [Google Scholar]
- 49.Bakhoum SF, Thompson SL, Manning AL & Compton DA Genome stability is ensured by temporal control of kinetochore-microtubule dynamics. Nat Cell Biol 11, 27–35 (2009). [DOI] [PMC free article] [PubMed] [Google Scholar]
- 50.Gruhn JR et al. Chromosome errors in human eggs shape natural fertility over reproductive life span. Science 365, 1466–1469 (2019). [DOI] [PMC free article] [PubMed] [Google Scholar]
- 51.Zielinska AP et al. Meiotic Kinetochores Fragment into Multiple Lobes upon Cohesin Loss in Aging Eggs. Curr Biol 29, 3749–3765 e3747 (2019). [DOI] [PMC free article] [PubMed] [Google Scholar]
- 52.Jansen LE, Black BE, Foltz DR & Cleveland DW Propagation of centromeric chromatin requires exit from mitosis. J Cell Biol 176, 795–805 (2007). [DOI] [PMC free article] [PubMed] [Google Scholar]
- 53.Smoak EM, Stein P, Schultz RM, Lampson MA & Black BE Long-Term Retention of CENP-A Nucleosomes in Mammalian Oocytes Underpins Transgenerational Inheritance of Centromere Identity. Curr Biol 26, 1110–1116 (2016). [DOI] [PMC free article] [PubMed] [Google Scholar]
- 54.Swartz SZ et al. Quiescent Cells Actively Replenish CENP-A Nucleosomes to Maintain Centromere Identity and Proliferative Potential. Dev Cell 51, 25–48 (2019). [DOI] [PMC free article] [PubMed] [Google Scholar]
- 55.Liebelt F et al. The poly-SUMO2/3 protease SENP6 enables assembly of the constitutive centromere-associated network by group deSUMOylation. Nat Commun 10, 3987 (2019). [DOI] [PMC free article] [PubMed] [Google Scholar]
- 56.Mitra S et al. Genetic screening identifies a SUMO protease dynamically maintaining centromeric chromatin. Nat Commun 11, 501 (2020). [DOI] [PMC free article] [PubMed] [Google Scholar]
- 57.Miller MP, Unal E, Brar GA & Amon A Meiosis I chromosome segregation is established through regulation of microtubule-kinetochore interactions. Elife 1, e00117 (2012). [DOI] [PMC free article] [PubMed] [Google Scholar]
- 58.Zhang W et al. Centromere and kinetochore gene misexpression predicts cancer patient survival and response to radiotherapy and chemotherapy. Nat Commun 7, 12619 (2016). [DOI] [PMC free article] [PubMed] [Google Scholar]
- 59.Bahler J et al. Heterologous modules for efficient and versatile PCR-based gene targeting in Schizosaccharomyces pombe. Yeast 14, 943–951 (1998). [DOI] [PubMed] [Google Scholar]
- 60.Fennell A, Fernandez-Alvarez A, Tomita K & Cooper JP Telomeres and centromeres have interchangeable roles in promoting meiotic spindle formation. J Cell Biol 208, 415–428 (2015). [DOI] [PMC free article] [PubMed] [Google Scholar]
- 61.Fernandez-Alvarez A, Bez C, O’Toole ET, Morphew M & Cooper JP Mitotic Nuclear Envelope Breakdown and Spindle Nucleation Are Controlled by Interphase Contacts between Centromeres and the Nuclear Envelope. Dev Cell 39, 544–559 (2016). [DOI] [PMC free article] [PubMed] [Google Scholar]
- 62.Tomita K & Cooper JP The telomere bouquet controls the meiotic spindle. Cell 130, 113–126 (2007). [DOI] [PubMed] [Google Scholar]
- 63.McKinley KL et al. The CENP-L-N Complex Forms a Critical Node in an Integrated Meshwork of Interactions at the Centromere-Kinetochore Interface. Mol Cell 60, 886–898 (2015). [DOI] [PMC free article] [PubMed] [Google Scholar]
- 64.Kyriacou E & Heun P High-resolution mapping of centromeric protein association using APEX-chromatin fibers. Epigenetics Chromatin 11, 68 (2018). [DOI] [PMC free article] [PubMed] [Google Scholar]
- 65.Hou H et al. Histone variant H2A.Z regulates centromere silencing and chromosome segregation in fission yeast. J Biol Chem 285, 1909–1918 (2010). [DOI] [PMC free article] [PubMed] [Google Scholar]
- 66.Bellani MA, Boateng KA, McLeod D & Camerini-Otero RD The expression profile of the major mouse SPO11 isoforms indicates that SPO11beta introduces double strand breaks and suggests that SPO11alpha has an additional role in prophase in both spermatocytes and oocytes. Mol Cell Biol 30, 4391–4403 (2010). [DOI] [PMC free article] [PubMed] [Google Scholar]
Associated Data
This section collects any data citations, data availability statements, or supplementary materials included in this article.
Supplementary Materials
Data Availability Statement
Source data are provided with this paper. Reagents and any further information are available on request to JPC or HH.