eLife logoLink to eLife
. 2022 Jan 26;11:e71877. doi: 10.7554/eLife.71877

Simultaneous brain, brainstem, and spinal cord pharmacological-fMRI reveals involvement of an endogenous opioid network in attentional analgesia

Valeria Oliva 1,2,3, Ron Hartley-Davies 2,4, Rosalyn Moran 5, Anthony E Pickering 1,, Jonathan CW Brooks 2,6
Editors: Markus Ploner7, Timothy E Behrens8
PMCID: PMC8843089  PMID: 35080494

Abstract

Pain perception is decreased by shifting attentional focus away from a threatening event. This attentional analgesia engages parallel descending control pathways from anterior cingulate (ACC) to locus coeruleus, and ACC to periaqueductal grey (PAG) – rostral ventromedial medulla (RVM), indicating possible roles for noradrenergic or opioidergic neuromodulators. To determine which pathway modulates nociceptive activity in humans, we used simultaneous whole brain-spinal cord pharmacological-fMRI (N = 39) across three sessions. Noxious thermal forearm stimulation generated somatotopic-activation of dorsal horn (DH) whose activity correlated with pain report and mirrored attentional pain modulation. Activity in an adjacent cluster reported the interaction between task and noxious stimulus. Effective connectivity analysis revealed that ACC interacts with PAG and RVM to modulate spinal cord activity. Blocking endogenous opioids with Naltrexone impairs attentional analgesia and disrupts RVM-spinal and ACC-PAG connectivity. Noradrenergic augmentation with Reboxetine did not alter attentional analgesia. Cognitive pain modulation involves opioidergic ACC-PAG-RVM descending control which suppresses spinal nociceptive activity.

Research organism: Human

Introduction

Pain is a fundamental and evolutionarily conserved cognitive construct that is behaviourally prioritised by organisms to protect themselves from harm and facilitate survival. As such, pain perception is sensitive to the context within which potential harm occurs. There are well-recognised top-down influences on pain that can either suppress (e.g. placebo Wager and Atlas, 2015 or task engagement Büssing et al., 2010) or amplify (e.g. catastrophising Gracely et al., 2004, hypervigilance Crombez et al., 2004 or nocebo Benedetti and Piedimonte, 2019) its expression. These processes influence both acute and chronic pain and provide a dynamic, moment-by-moment regulation of pain as an organism moves through their environment.

A simple shift in attention away from a noxious stimulus can cause a decrease in pain perception – a phenomenon known as attentional analgesia. This effect can be considered to be a mechanism to enable focus, allowing prioritisation of task performance over pain interruption (Eccleston and Crombez, 1999; Erpelding and Davis, 2013). This phenomenon is reliably demonstrable in a laboratory setting (Miron et al., 1989) and a network of cortical and brainstem structures have been implicated in attentional analgesia (Bantick et al., 2002; Brooks et al., 2017; Bushnell et al., 2013; Lorenz et al., 2003; Petrovic et al., 2002; Peyron et al., 2000; Sprenger et al., 2012; Tracey et al., 2002; Valet et al., 2004).

We have shown that two parallel pathways are implicated in driving brainstem activity related to attentional analgesia (Brooks et al., 2017; Oliva et al., 2021b). Projections from rostral anterior cingulate cortex (ACC) were found to drive the periaqueductal grey (PAG) and rostral ventromedial medulla (RVM), which animal studies have shown to work in concert using opioidergic mechanisms to regulate spinal nociception (Fields, 2004; Fields and Basbaum, 1978; Heinricher et al., 1994; Ossipov et al., 2010). Similarly, a bidirectional connection between ACC and locus coeruleus (LC) was also directly involved in attentional analgesia. As the primary source of cortical noradrenaline, the LC is thought to signal salience of incoming sensory information (Aston-Jones and Cohen, 2005; Sara and Bouret, 2012), but can also independently modulate spinal nociception (De Felice et al., 2011; Hirschberg et al., 2017; Hughes et al., 2015; Llorca-Torralba et al., 2016). Although these animal studies provide a framework for our understanding of descending control mechanisms that are likely to be mediating attentional analgesia, the network interactions between brain, brainstem, and spinal cord and the neurotransmitter systems involved in producing attentional analgesia have yet to be elucidated in humans. In part, this gap in our knowledge is because of the distributed extent of the network spanning the entire neuraxis from forebrain to spinal cord, which has only relatively recently become accessible using simultaneous imaging approaches in humans (Cohen-Adad et al., 2010; Finsterbusch et al., 2013; Islam et al., 2019).

To address this issue, we conducted a double-blind, placebo-controlled, three-arm, cross-over pharmacological-fMRI experiment to investigate attentional analgesia using whole neuraxis imaging and a well validated experimental paradigm. To engage attention, we utilised a rapid serial visual presentation (RSVP) task (Brooks et al., 2017; Oliva et al., 2021b; Potter and Levy, 1969) with individually calibrated task difficulties (easy or hard), which was delivered concurrently with thermal stimulation (low or high), adjusted per subject, to evoke different levels of pain. We took advantage of recent improvements in signal detection (Duval et al., 2015) and pulse sequence design to simultaneously capture activity across the brain, brainstem, and spinal cord (i.e. whole CNS) in a single contiguous functional acquisition with slice-specific z-shimming (Finsterbusch et al., 2012). To resolve the relative contributions from the opioidergic and noradrenergic systems, subjects received either the opioid antagonist naltrexone (which we predicted would block attentional analgesia), the noradrenaline re-uptake inhibitor reboxetine (which we expected to augment attentional analgesia), or placebo control. By measuring the influence of these drugs on pain perception, BOLD activity and effective connectivity between a priori specified regions known to be involved in attentional analgesia (ACC, PAG, LC, RVM, spinal cord Brooks et al., 2017; Oliva et al., 2021b; Sprenger et al., 2012), we sought to identify the network interactions and neurotransmitter mechanisms mediating this cognitive modulation of pain.

Results

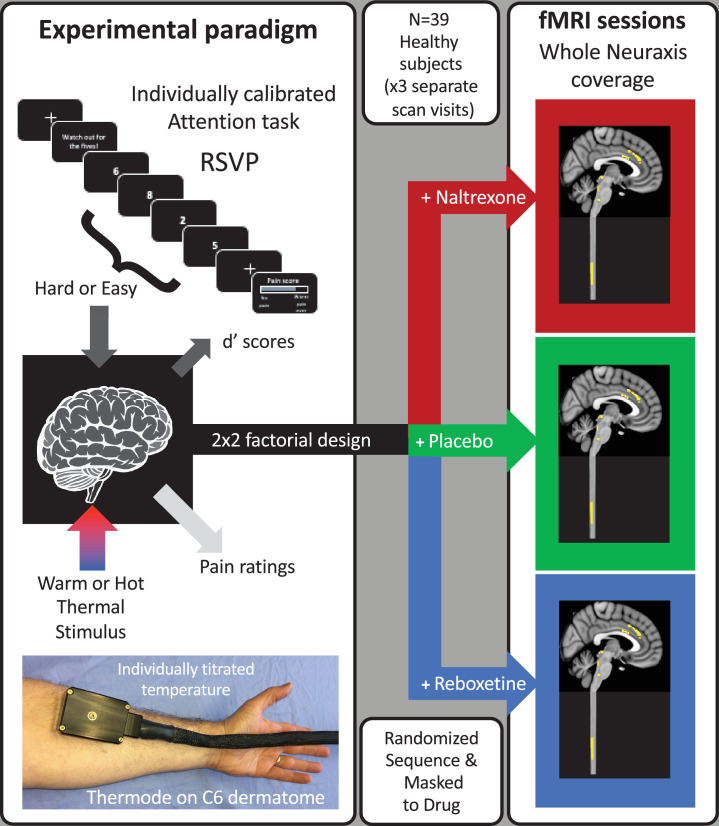
A total of 39 subjects (mean age 23.7, range [18 - 45] years, 18 females) completed the three fMRI imaging sessions with a 2 × 2 factorial experimental design (RSVP task difficulty: easy or hard, thermal stimulus intensity: low or high, Figure 1). A different drug was administered orally before each scan session (naltrexone [50 mg], reboxetine [4 mg], or placebo), which included whole CNS imaging with slice-specific z-shimming (see Figure 1—figure supplement 1).

Figure 1. Experimental design.

A total of 39 healthy subjects had thermal stimulation (to left forearm) while performing a rapid serial visual presentation (RSVP) task. The thermal stimuli were either warm or hot (individually titrated) and the task speed was adjusted for each subject to be either easy or hard (d’ 70%, 16 blocks giving four repeats of each condition). This 2 × 2 factorial design allowed the interaction between task and temperature to be tested to identify the attentional analgesic effect. Each subject repeated the experiment on three separate days (at least 1 week apart) with a different drug on each occasion (naltrexone, reboxetine, or placebo) and had whole CNS fMRI.

Figure 1.

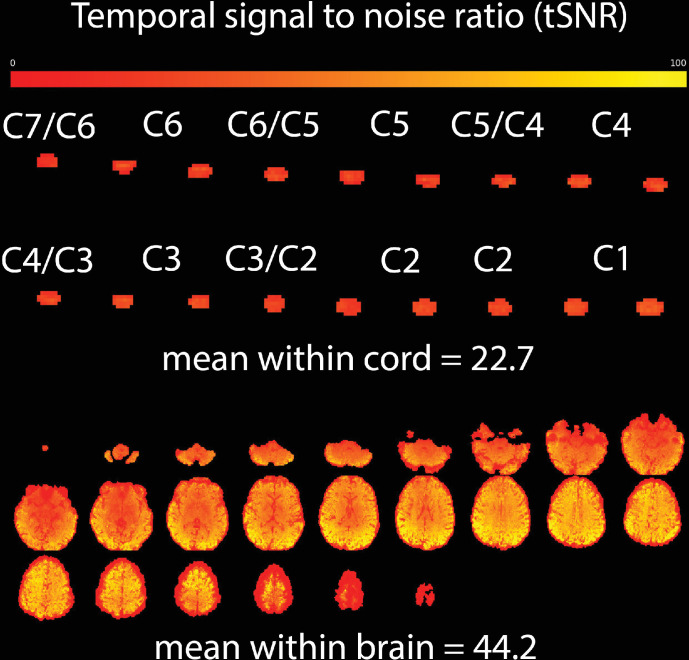
Figure 1—figure supplement 1. Representative temporal signal to noise ratio (tSNR) data for a single subject, acquired with identical parameters to those used in this study.

Figure 1—figure supplement 1.

Signal optimisation included manual selection of Z-shims, based on maximisation of cord signal and minimisation of distortion at each level in the cord (Finsterbusch et al., 2012). Image data (100 samples) acquired at rest were divided at the level of the odontoid process/dens, with that above (i.e. brain) motion corrected with a rigid body approach in FSL (6.0.3) and below (i.e. cord) with 2D correction in the Spinal Cord Toolbox (5.3.0), and the outputs generated with nearest neighbour interpolation to minimise smoothing. Following motion correction, the temporal mean was calculated and divided by the temporal standard deviation to produce the tSNR map.

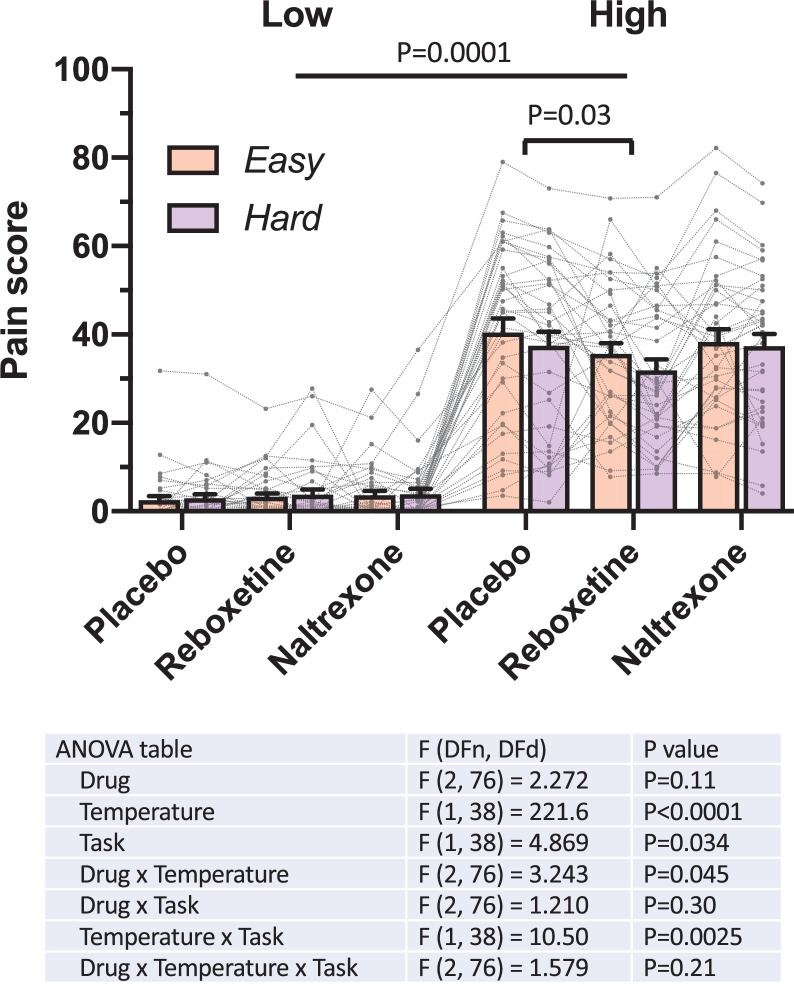
The behavioural signature of attentional analgesia is a task*temperature interaction, driven by a reduction in pain ratings during the high temperature-hard task condition (Brooks et al., 2017; Oliva et al., 2021a; Oliva et al., 2021b). A first level analysis of the pooled pain behavioural data across all experimental sessions showed: a main effect of temperature (F (1,38) = 221, p = 0.0001, Figure 2—figure supplement 1) with higher scores under the high temperature conditions; a main effect of task (F (1,38) = 4.9, p = 0.03); and importantly demonstrated the expected task*temperature interaction consistent with attentional pain modulation (F (1, 38) = 10.5, p = 0.0025, Figure 2—figure supplement 1).

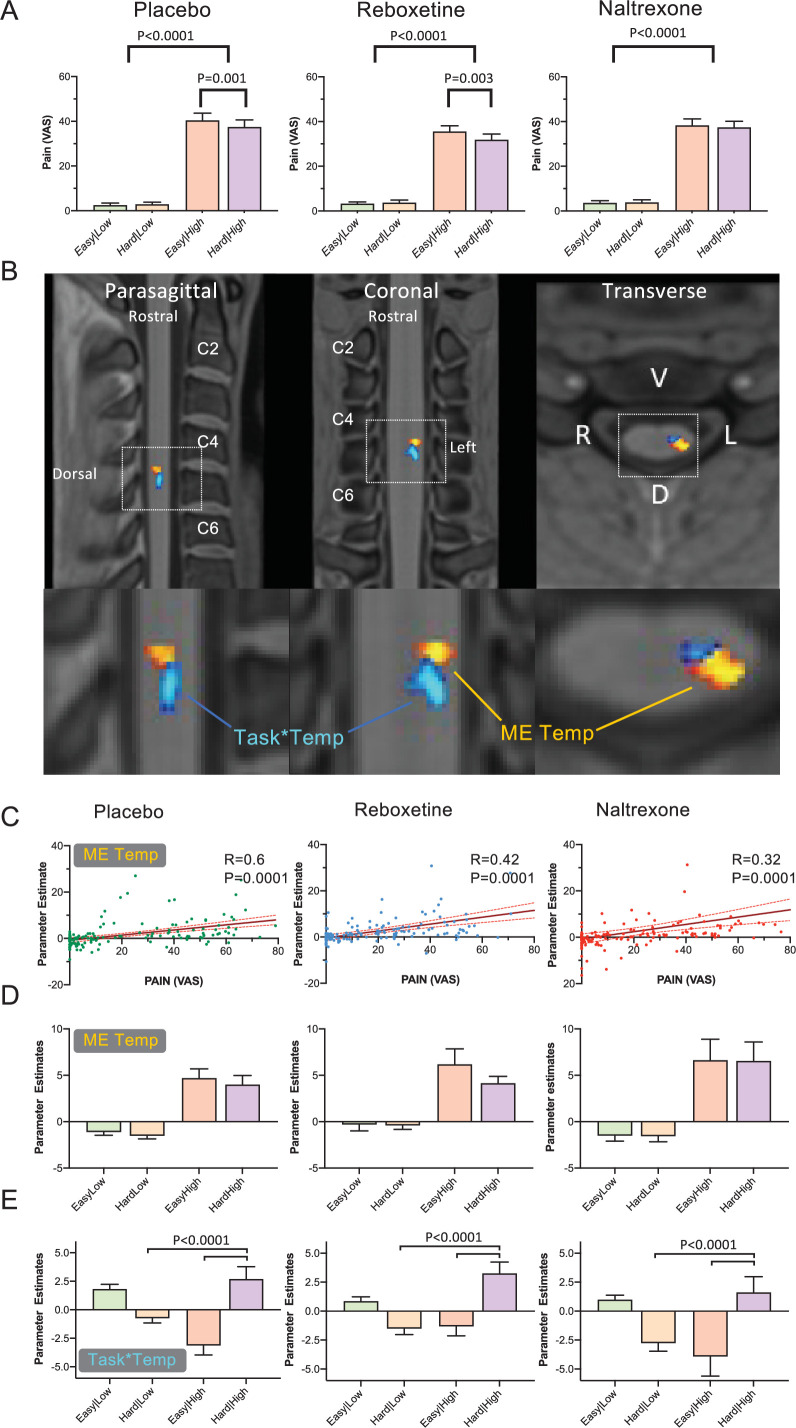
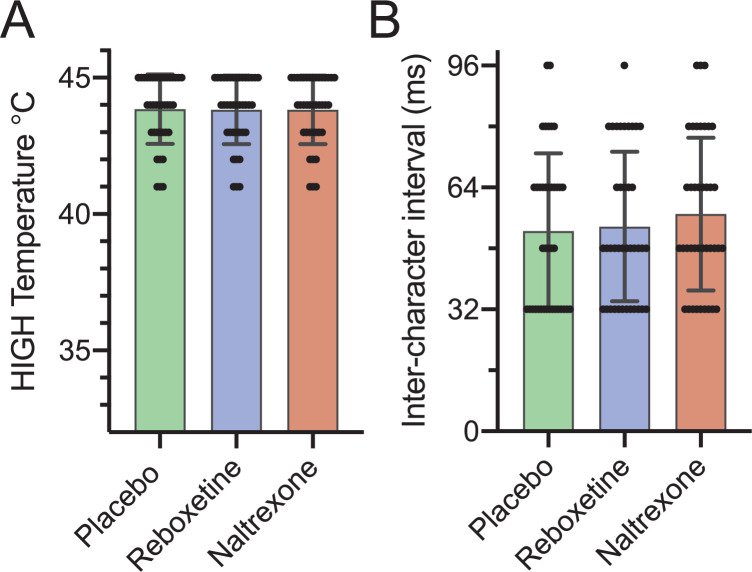
To assess the impact of the drugs on attentional analgesia, each experimental session was analysed independently (Figure 2A). Attentional analgesia was seen in the placebo condition (task*temperature interaction (F (1, 38) = 11.20, p = 0.0019), driven primarily by lower pain scores in the hard|high vs easy|high condition (37.5 ± 19.4 vs 40.4 ± 19.8, mean ± SD, p = 0.001, effect size of –0.55 (Cohen’s Dz)). Similarly, subjects given Reboxetine showed a task*temperature interaction (F (1, 38) = 9.023, p = 0.0047), again driven by decreased pain scores in the hard|high vs easy|high condition (31.9 ± 15.8 vs 35.6 ± 15.5, p = 0.0034, Dz = −0.42). In contrast, Naltrexone blocked the analgesic effect of attention with no task*temperature interaction (F (1, 38) = 0.4355, p = 0.5133), hard|high (37.4 ± 17.1) vs easy|high (38.3 ± 17.1), Dz = −0.11). Further analysis of the attentional modulation of pain showed that subjects in both the placebo and reboxetine conditions showed a significant decrease in pain score during the hard task that was not evident in the presence of naltrexone (Figure 2—figure supplement 2, one sample t-test). We used equivalence analysis (TOST method described by Lakens, 2017) to demonstrate that the plausible magnitude of the attentional analgesic effect under naltrexone was smaller than a 6% ( < 2.3 point) reduction in pain score (p = 0.049) confirming it as being smaller than that seen in the presence of placebo or reboxetine. This effect was specific to attentional analgesia as naltrexone had no effect on the calibrated temperature for the high thermal stimulus or the speed of character presentation for the RSVP task (Figure 2—figure supplement 3). Behaviourally these findings indicate that the attentional analgesic effect is robust, reproducible between and across subjects and that it involves an opioidergic mechanism.

Figure 2. Main effect of temperature and task*temperature interaction in the spinal cord.

(A) Pain scores across the four experimental conditions (i.e. easy|low, hard|low, easy|high and hard|high), for the three drugs. All conditions showed a main effect of temperature (two-way repeated measures ANOVA). Attentional analgesia was seen in the placebo and reboxetine limbs with a task*temperature interaction (F (1, 38) = 11.20, p = 0.0019 and F (1, 38) = 9.023, p = 0.004 respectively). In both cases, this was driven by lower pain scores in the hard|high versus easy|high condition (Sidak’s post hoc test). In contrast, Naltrexone blocked the analgesic effect of attention as reflected in a loss of the task*temperature interaction (F (1, 38) = 0.4355, p = 0.5133). (B) Cervical spine fMRI revealed two distinct clusters of activity within the left side of the C6 cord segment. The first showing the main effect of temperature (red-yellow, Spinalnoci) and a second showing task*temperature interaction (blue-light blue, Spinalint) (significance reported with p < 0.05 (TFCE) within a left sided C5/C6 anatomical mask). No cluster reached significance for the main effect of task. (C) Parameter estimates from the Spinalnoci cluster showed a positive correlation with the pain scores across all conditions (Pearson’s Correlation, 95% CI). (D) Parameter estimates from the Spinalnoci cluster revealed a decrease in BOLD in the hard|high versus easy|high condition, seen in placebo and reboxetine arms but not in naltrexone. Note the similarity in pattern with the pain scores in (A). (E) Extraction of parameter estimates from the Spinalint cluster revealed an increase in BOLD in the hard|high condition, across all three drug sessions compared to the easy|high and hard|low conditions (Friedman test p < 0.0001). Mean ± SEM. Parameter estimates extracted from the peak voxel in each cluster.

Figure 2—source data 1. 2A Pain ratings across contrasts by drug.
Figure 2—source data 2. 2C BOLD parameter estimates from spinal nociception cluster versus pain rating.
Figure 2—source data 3. 2D BOLD parameter estimates for spinal nociception cluster.
Figure 2—source data 4. 2E BOLD parameter estimates for spinal interaction cluster.
Figure 2—source data 5. Pain ratings across conditions by drug.

Figure 2.

Figure 2—figure supplement 1. Pain scores under the four experimental conditions (i.e. easy|low, hard|low, easy|high and hard|high), across the three drugs for each of the 39 subjects.

Figure 2—figure supplement 1.

A first level, three-way repeated measures ANOVA revealed the expected main effect of temperature (F (1,38) = 221, p = 0.0001), main effect of task (F (1,38) = 4.9, p = 0.03) and importantly a task*temperature interaction (F (1, 38) = 10.5, p = 0.0025). The first level analysis also showed a drug*temperature interaction on pain ratings (F (2, 76) = 3.2, p = 0.04). To further investigate the drug*temperature interaction, two second level three-way repeated measures ANOVAs were conducted for placebo vs reboxetine and placebo vs naltrexone (Figure 2). For reboxetine versus placebo, a drug*temperature interaction was revealed (F (1, 38) = 5.060, p = 0.03), with lower pain scores in high temperature condition in the reboxetine arm, indicating an analgesic effect of the drug. No drug*temperature interactions were observed in the ANOVA contrasting naltrexone with placebo. Mean + SEM with individual participants data.
Figure 2—figure supplement 1—source data 1. Figure 2 - figure supplement 1 Second level three way ANOVA of drug versus placebo.

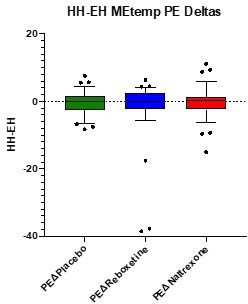
Figure 2—figure supplement 2. Influence of drug on attentional analgesia and on spinal BOLD parameter estimates.

Figure 2—figure supplement 2.

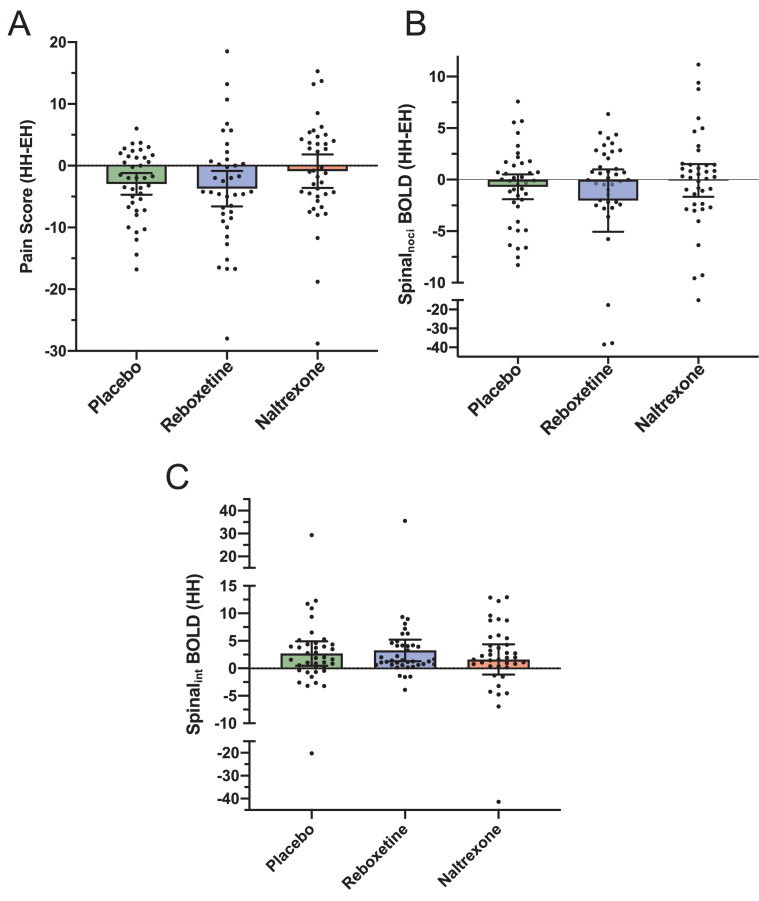
(A) Attentional analgesia effect reflected as the difference in pain score between the easy and hard condition in the high temperature condition (mean ± 95% confidence interval). The placebo and reboxetine groups show a significant reduction in pain scores in the high hard condition ie attentional analgesia (p = 0.0016 and p = 0.013, respectively) whereas there is no significant effect of naltrexone (p = 0.51, one sample t-tests). The corresponding effect sizes (Cohen’s Dz) are Placebo –0.55, Reboxetine –0.42 vs Naltrexone –0.11. The confidence interval for naltrexone spans zero and equivalence testing showed that the magnitude of the effect was smaller than a 6% (2.3 point) reduction in pain score (p = 0.049, using the TOST approach Lakens, 2017) and less than the analgesic effect seen in the presence of reboxetine or placebo. (B) Extraction of the BOLD parameter estimates from the Spinalnoci cluster for the HH-EH conditions showed a similar pattern of means but with an increased dispersion of values (note the break in the y-axis scale) reflecting the signal to noise associated with spinal cord functional imaging. As a consequence, the 95% confidence intervals all cross zero and there are no significant differences between the groups. (C) Extraction of the BOLD parameter estimates from the Spinalint cluster for the High Hard condition showed that the group means were significantly increased in the placebo (p = 0.018) and reboxetine (p = 0.0018) conditions but not in the presence of naltrexone (p = 0.24). (Mean ± 95% CI, one sample t-tests).
Figure 2—figure supplement 2—source data 1. Figure 2 - figure supplement 2A Difference in pain score between High|Hard and Easy|High conditions by drug.
Figure 2—figure supplement 2—source data 2. Figure 2 - figure supplement 2B Difference in BOLD parameter estimates from spinal nociceptive cluster between High|Hard and Easy|High conditions by drug.
Figure 2—figure supplement 2—source data 3. Figure 2 - figure supplement 2C BOLD parameter estimates from spinal nociceptive cluster in High|Hard condition by drug.

Figure 2—figure supplement 3. Temperature delivered and task speed across the three drug conditions.

Figure 2—figure supplement 3.

(A) Administration of Reboxetine or Naltrexone did not change the individually calibrated HIGH thermal stimulus required to evoke a 6/10 pain score (Mean ± SD). (B) Similarly, drug administration had no effect on RSVP task speed as reflected in the inter-character presentation interval (Mean ± SD, Friedman tests NS).
Figure 2—figure supplement 3—source data 1. Figure 2 - figure supplement 3 RSVP intercharacter intervals and thermode target temperatures for High thermal stimulus.

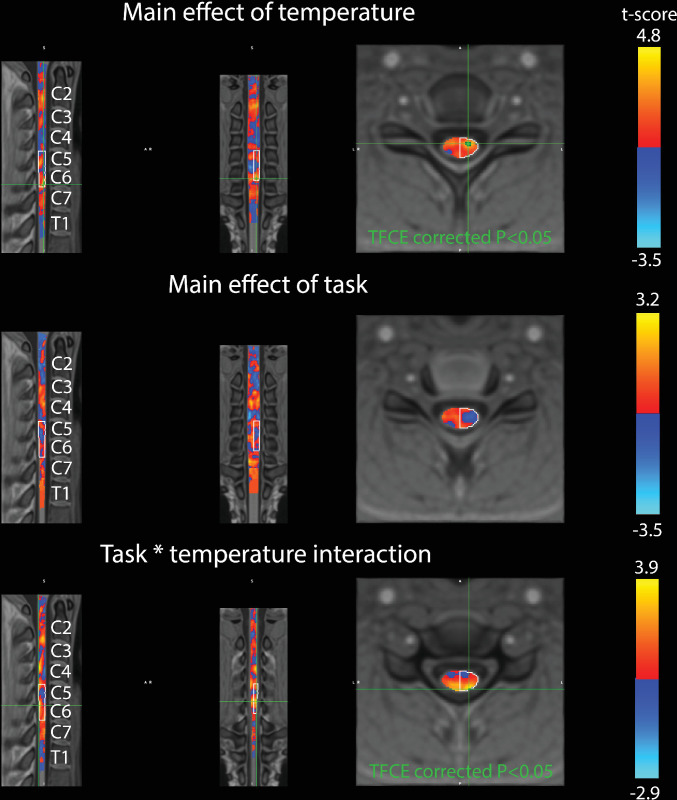
Figure 2—figure supplement 4. Analysis of pooled data for main effects and interaction within the cord.

Figure 2—figure supplement 4.

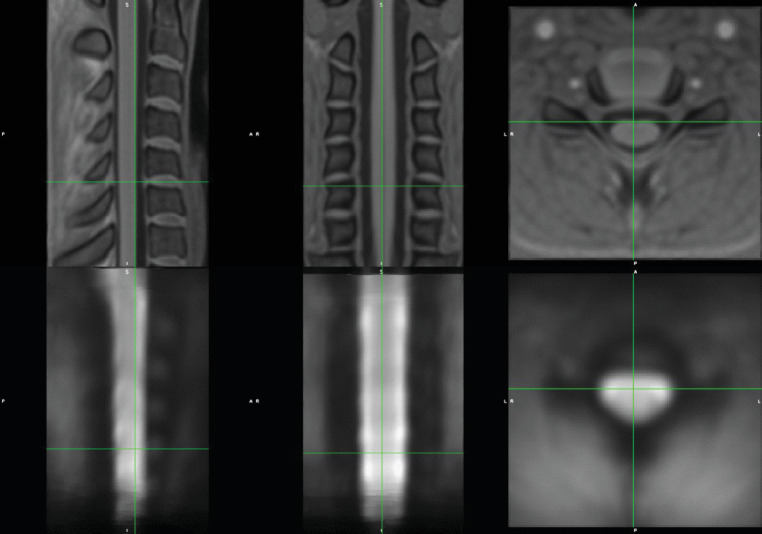
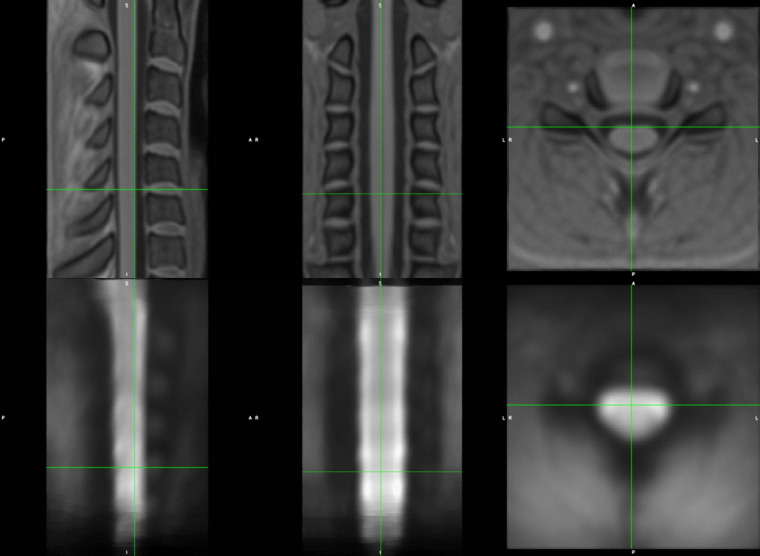
Top: PAM50 template T1-weighted cervical cord, bottom: mean functional image from all 39 subjects acquired during the placebo condition, shown following non-linear registration to the template. Note the good agreement with intervertebral disc levels and ventral surface of the cord. The registration pipeline included two steps: (1) registration of subject’s own T1-weighted structural scan to PAM50 T1-weighted template and (2) registration of acquired functional images to PAM50 template (T2*-weighted) to using the output from step one as an initial warping. This last step assumed that the subject’s T1-weighted scan and EPI data were in reasonable agreement, which was confirmed by visual inspection. Note that in every case it was found that manual intervention was required to improve the cord mask for the functional images.

Figure 2—figure supplement 5. Analysis of pooled data for main effects and interaction within the cord.

Figure 2—figure supplement 5.

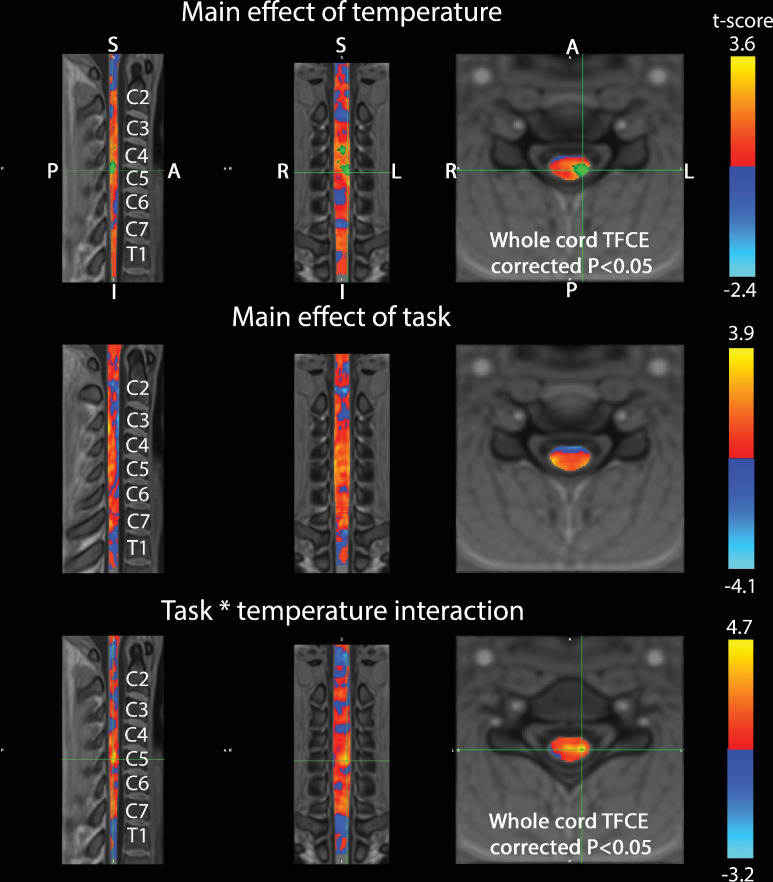
Inference was performed without masking for a specific vertebral level and produced t-scores shown in Red-Yellow (positive) and Blue-Light blue (negative). Importantly, the unmasked analysis confirmed the presence of a main effect of temperature at the C5/C6 level within the left dorsal horn region (shown in Green, with cross-hair on voxel of with lowest p-value), with TFCE corrected p < 0.05. Similarly, unmasked analysis provided confirmatory evidence for the existence of a task x temperature interaction located within the left dorsal horn region at the C5/C6 level (Green, cross-hair on voxel with lowest p-value), with TFCE corrected p < 0.05. No main effect of task was observed within the cord, in agreement with masked analysis.

Figure 2—video 1. Registration of functional imaging data to PAM50 template cord.

Download video file (101.1KB, mp4)
Overlaid PAM50 template T1-weighted cervical cord and mean functional image from all 39 subjects acquired during the placebo condition, shown following non-linear registration to the template. Note the good agreement with intervertebral disc levels and ventral surface of the cord. Note the cross hair marks the midline of the ventral surface of the spinal cord in both anatomical and functional images.

We also noted a drug*temperature interaction on pain ratings in the first level analysis (F (2, 76) = 3.2, p = 0.04, Figure 2—figure supplement 1). Comparing reboxetine versus placebo showed the presence of a drug*temperature interaction (F (1, 38) = 5.060, p = 0.03, Figure 2), with lower pain scores in the presence of reboxetine indicating that it was underpinned by an analgesic effect of the noradrenergic reuptake inhibitor (in contrast naltrexone vs placebo showed no drug*temperature interaction).

Whole CNS fMRI: main effects and interactions

To determine the neural substrates for attentional analgesia and to identify the possible involvement of the noradrenergic and opioidergic systems, we initially defined a search volume in which to focus subsequent detailed fMRI analyses. This was achieved by pooling individually averaged data across the three experimental imaging sessions to estimate main effects and interactions across all levels of the neuraxis.

Spinal cord

Following registration to the PAM50 spinal cord template (see Figure 2—video 1), a cluster of activation representing the positive main effect of temperature was identified in the left dorsal horn (DH), in the C6 spinal segment (Figure 2B, assessed using permutation testing with a left C5/C6 mask, p < 0.05, TFCE corrected). This represents activity in a population of spinal neurons that responded more strongly to noxious thermal stimulation. This Spinalnoci cluster was somatotopically localised, given that the thermal stimuli were applied to the left forearm in the C6 dermatome (and its location was also confirmed without masking, Figure 2—figure supplement 5). BOLD parameter estimates were extracted to investigate the activity of this Spinalnoci cluster across the four experimental conditions and three drug sessions (Figure 2C and D). There was a positive corelation between the pain ratings and activity in the Spinalnoci cluster across all subjects and experimental conditions (Figure 2C). Accordingly in the placebo session, the pattern of BOLD signal change across conditions was similar to the pain scores (Figure 2A and D), and the response to a noxious stimulus was lower in the hard|high than easy|high condition, suggesting that the Spinalnoci activity was modulated during attentional analgesia. A similar pattern was evident in the reboxetine condition however, this was not observed in the naltrexone arm consistent with the opioid antagonist-mediated blockade of attentional analgesia. Post hoc analysis of the differences in Spinalnoci BOLD in the hard|high - easy|high conditions, although showing the same pattern of differences in the means, did not show a group level difference between drug sessions. This absence of evidence for attentional modulation of absolute BOLD signal differences may reflect large interindividual differences, low signal to noise in spinal cord fMRI data, or an inability to discriminate between excitatory or inhibitory contributions to measured signal (Figure 2—figure supplement 2B).

Analysis of the task*temperature interaction revealed a second discrete spinal cluster (Spinalint, Figure 2B). This was also located on the left side of the C6 segment but was slightly caudal, deeper and closer to the midline with respect to the Spinalnoci cluster (with only marginal overlap). The location of this activity was again confirmed in an unmasked spinal analysis (Figure 2—figure supplement 5). Extraction of BOLD parameter estimates from the Spinalint cluster in the placebo and reboxetine condition, showed an increased level of activity in the hard|high condition compared to the easy|high and hard|low conditions (Figure 2E). The Spinalint cluster showed significant activation in the hard|high condition in the placebo and reboxetine trials which was not evident in the presence of naltrexone (Figure 2—figure supplement 2C). This activity profile suggests this Spinalint cluster, potentially composed of spinal interneurons, plays a role in the modulation of nociception during the attentional analgesic effect.

Brainstem and whole brain

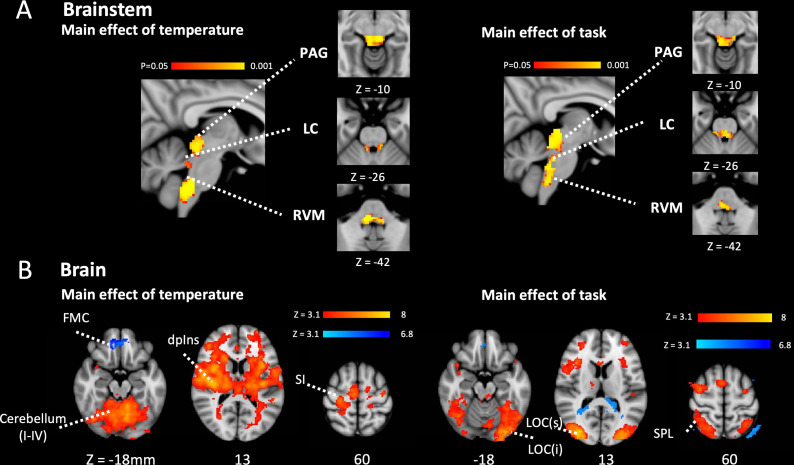
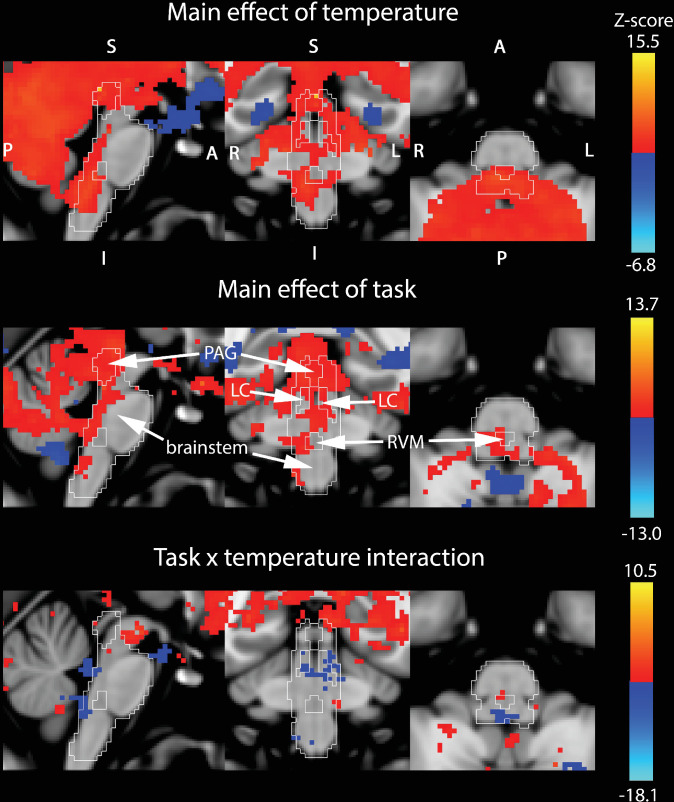
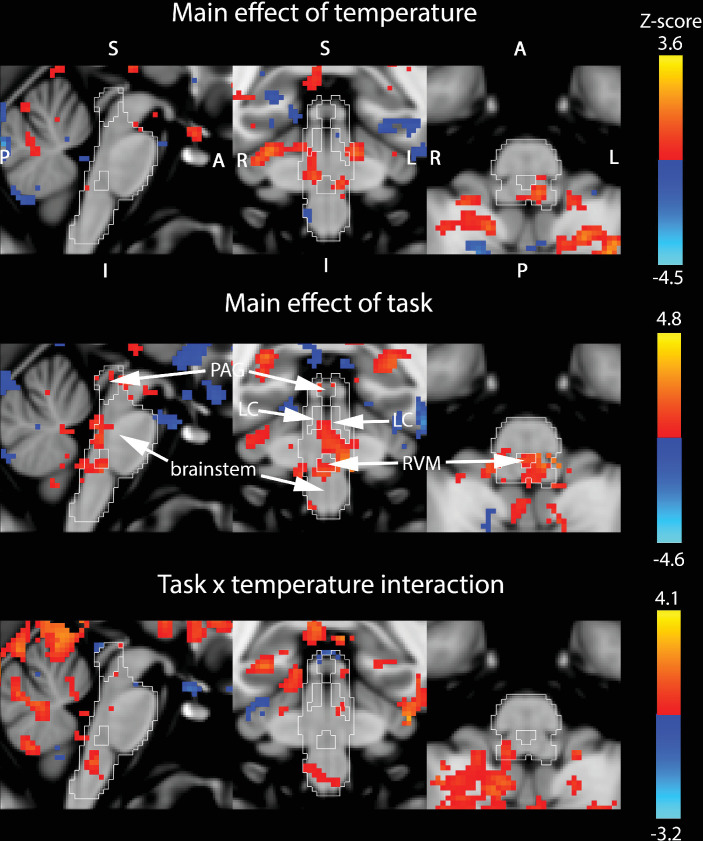
To identify the regions of the brainstem involved in mediating attentional analgesia and potentially interacting with the spinal cord, a similar pooled analysis strategy was employed. Activity in brainstem nuclei was investigated using permutation testing with a whole brainstem mask (significant results are reported for p < 0.05, TFCE corrected), with subsequent attribution of signal to specific nuclei made through probabilistic masks (from Brooks et al., 2017, available from: https://osf.io/xqvb6/). Analysis of the main effect of temperature within a whole brainstem mask showed substantial clusters of activity in the midbrain (PAG) and medulla (RVM) with more discrete clusters in the dorsal pons bilaterally (LC) (Figure 3A, Figure 3—figure supplement 1). In the main effect of task, the pattern of brainstem activation was more diffuse (Figure 3B, Figure 3—figure supplement 1), but again included activation of the PAG, RVM, and bilateral LC. Importantly for the mediation of attentional analgesia, no task*temperature interaction was observed within the brainstem (Figure 3—figure supplement 1).

Figure 3. Main effect of task and temperature in Brainstem and Cerebrum.

(A) Main effect of temperature and task in the brainstem after permutation testing with a whole brainstem mask showing clusters of activation in PAG, bilateral LC and RVM. Activity reported with corrected p< 0.05 (TFCE). (B) Main effects of temperature and task in brain. In the main effect of temperature contrast there were clusters of activation in a number of pain related sites including in the contralateral primary somatosensory cortex, the dorsal posterior insula and the PAG (red-yellow). The frontal medial cortex de-activated (blue-light blue). In the main effect of task contrast there were clusters of activation in the visual and attention networks including superior parietal cortex, the frontal pole, and the anterior cingulate cortex (red-yellow). The posterior cingulate cortex and lateral occipital cortex showed de-activation (blue-light blue). Activity was estimated with a cluster forming threshold of Z > 3.1 and FWE corrected p < 0.05. (PAG – Periaqueductal grey, LC – Locus coeruleus, RVM – Rostral ventromedial medulla, FMC – Frontomedial cortex, dpIns – dorsal posterior insula, SI – primary somatosensory cortex, LOC – Lateral ocipital cortex (sup and inf), SPL Superior parietal lobule.).

Figure 3—source data 1. Cluster sizes, peak Z-scores, locations and anatomical locations for each experimental contrast.

Figure 3.

Figure 3—figure supplement 1. Whole brain mixed effects analysis of pooled data (inputs are the average of each subject’s three sessions) for the three contrasts (main effects of temperature, task and their interaction).

Figure 3—figure supplement 1.

Slices shown (left to right) (i) midline sagittal, (ii) coronal through the PAG, bilateral LC and RVM masks, and (iii) axial at the level of the midline RVM mask. To allow visualisation of underlying anatomy, data were thresholded at an uncorrected p-value of 0.05 (i.e. Z > 1.65). The location of relevant masks are outlined in white, with labels shown. Also included is the brainstem mask derived from the Harvard-Oxford sub-cortical probabilistic atlas, which was thresholded at 50% and used for estimating brainstem activity reported in the manuscript (rather than the whole brain analysis shown here). Assignment of activity to specific nuclei was based on overlap with probabilistic brainstem nuclei masks (Brooks et al., 2017). Positive Z-scores are shown in Red-Yellow colours, whilst negative ones are in Blue-Light blue. Activity was rarely observed in the 4th ventricle, nor in the aqueduct, indicating that physiological noise was adequately corrected for with the chosen scheme (see Brooks et al., 2008; Kong et al., 2012 for more details).
Figure 3—figure supplement 2. Anterior Insula and medulla response after Naltrexone administration.

Figure 3—figure supplement 2.

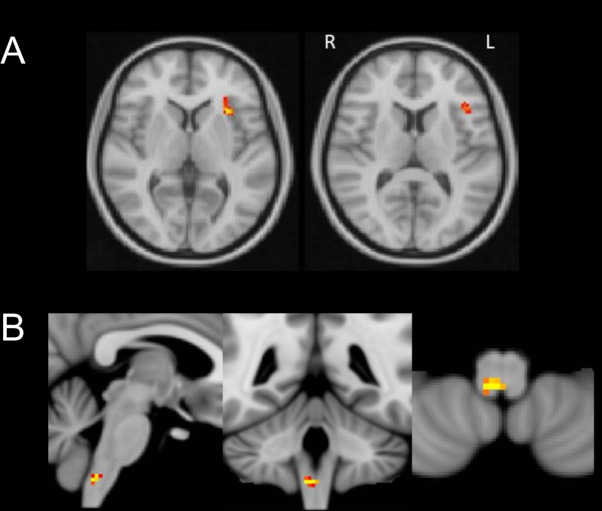
(A) The anterior insula responded more strongly in the naltrexone than in the placebo in the main effect of task (obtained with permutation testing with a main effect of task mask, obtained from the pooled analysis). (B) A cluster in the lower medulla responded more strongly in the naltrexone than in the placebo main effect of temperature. Result obtained with permutation testing (using a main effect of temperature brainstem mask, obtained from the pooled analysis). TFCE corrected p < 0.05.

Whole-brain analysis of the main effect of temperature (mixed effects analysis, cluster forming threshold Z > 3.1, family wise error (FWE) corrected p < 0.05) showed activation in pain-associated regions such as primary somatosensory cortex, dorsal posterior insula, operculum, anterior cingulate cortex, and cerebellum with larger clusters contralateral to the side of stimulation (i.e. right side of brain). A cluster in the medial pre-frontal cortex exhibited deactivation. (Figure 3B and cluster table in Figure 3—source data 1). For the main effect of task, bilateral activation was seen in attention and visual processing areas including lateral occipital cortex, anterior insular cortex, and anterior cingulate cortex. Deactivation was observed in the cerebellum (Crus I), precuneus and lateral occipital cortex (superior division). (Figure 3B and cluster table in Figure 3—source data 1). No cluster in the whole brain analysis reached significance in the positive task*temperature interaction. Note that cluster thresholding does not permit inference on specific voxel locations (Woo et al., 2014), we report the full list of regions encompassed by each significant cluster (see Figure 3 cluster table in Figure 3—source data 1).

The distribution of these patterns of regional brain and brainstem activity were closely similar to those found in our previous studies of attentional analgesia (Brooks et al., 2017; Oliva et al., 2021a; Oliva et al., 2021b), with the difference that no area in the brain or brainstem showed a task*temperature interaction (unlike the spinal cord). Parameter maps for all subjects and conditions (in MNI space) for the main effect analyses of brain, brainstem, and spinal cord are available from: https://osfio/dtpr6/.

Attentional analgesia and effective network connectivity

Following identification of brain, brainstem, and spinal cord regions active during the attentional analgesia paradigm, and in keeping with our pre-specified regions of interest, we sought to investigate whether their connectivity was altered under the different experimental conditions and whether this was subject to specific neurotransmitter modulation. To determine the baseline evidence for the attentional analgesia network, we performed a generalised psychophysiological interaction (gPPI) analysis for the placebo condition alone within the a priori identified seed/target regions (after Brooks et al., 2017; Oliva et al., 2021b) and based on previous human (Eippert et al., 2009b; Tracey et al., 2002) and animal studies (Fields, 2004; Ossipov et al., 2010) of descending control: ACC, PAG, right LC, RVM and cervical spinal cord (left C5/C6 mask).

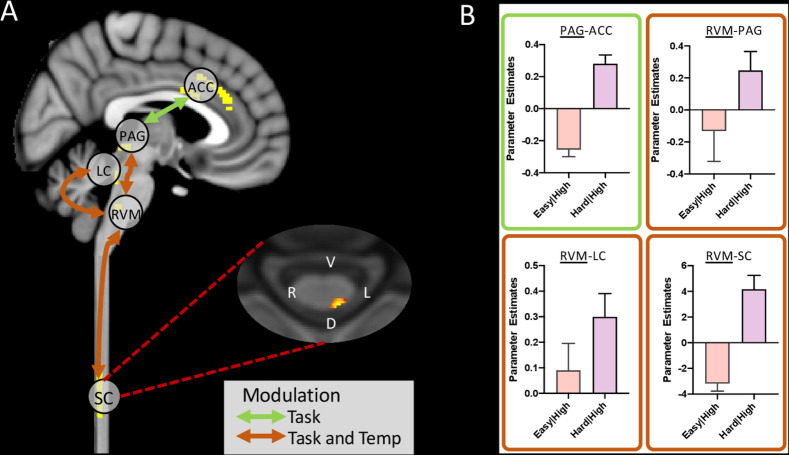
The gPPI identified the following pairs of connections [seed-target] as being significantly modulated by our experimental conditions (Figure 4A, Figure 4—figure supplements 1 and 2):

Figure 4. Summary of significant connection changes revealed by the gPPI analysis (placebo condition only).

(A) Permutation testing revealed a significant change in connectivity in the main effect of task contrast between ACC and PAG, and in the task*temperature interaction contrast between PAG and RVM, LC and RVM, and importantly RVM and spinal cord. Masks used for time-series extraction are shown in the sagittal slice (yellow). The spinal cord axial slice shows the voxels with significantly connections with RVM (threshold at = 0.1 for visualisation purposes). (B) Extraction of parameter estimates revealed an increase in coupling in the analgesic condition for all of these connections (i.e. hard|high). (Mean ± SEM).

Figure 4—source data 1. gPPI parameter estimates across connections and conditions.

Figure 4.

Figure 4—figure supplement 1. Unmasked whole brain group data for effective connectivity analysis of the placebo condition only.

Figure 4—figure supplement 1.

For each subject, the seed was extracted for the main effect of temperature (within the pooled simple main effects data) within the RVM. That is, a functional mask was derived from the group data, masked anatomically then applied to each subject separately to identify their peak voxel time series (the seed). Subsequently, the connectivity profile was estimated for each subject using generalised psychophysiological analysis (gPPI), with separate contrasts between the gPPI regressors for the three conditions (main effects of task, temperature and their interaction). To allow visualisation of underlying anatomy, these whole brain data were thresholded at an uncorrected p-value of 0.05 (i.e. Z > 1.65). The location of relevant masks are outlined in white (see labels on previous brainstem figure). Positive Z-scores are shown in Red-Yellow colours, whilst negative ones are in Blue-Light blue.
Figure 4—figure supplement 2. Unmasked group cord data from connectivity analysis of the placebo condition shown on the PAM50 spinal cord template.

Figure 4—figure supplement 2.

For each subject, the physiological regressor was extracted from a functional mask representing the main effect of temperature within the RVM for the placebo condition. Subsequently, generalised psychophysiological interaction (gPPI) regressors were formed for each of the conditions and contrasts between them created. The data represent uncorrected positive (Red-Yellow) and negative (Blue-Lightblue) t-scores, which are the output from RANDOMISE. Vertebral levels are indicated on sagittal section (left side of image). Due to masking steps in the registration pipeline it was not possible to include tissues outside the cord. To aid interpretation of the patterns of activity, the left C5-C6 vertebral mask is shown (white outline). Significant group activity detected within the mask for each contrast are shown in green, with TFCE corrected p < 0.05.
  • main effect of temperature [PAG-rLC], [rLC-ACC], [rLC-RVM] and [RVM-spinal cord]

  • main effect of task [RVM-rLC] and [PAG-ACC]

  • task*temperature interaction [RVM-PAG], [RVM-rLC], and [RVM-spinal cord].

This pattern of network interactions has a number of common features shared with our previous analysis (Oliva et al., 2021b) including the task modulation of connectivity between PAG and ACC and the effect of the task*temperature interaction on connectivity between RVM and PAG. The new features were the important linkage between the spinal cord activity and RVM which is modulated by both temperature and the task*temperature interaction and also the influence of all conditions on communication between RVM and rLC.

Parameter estimates extracted from the connections modulated by task, revealed that the PAG-ACC, RVM-PAG, RVM-rLC, and RVM-Spinal cord connections were stronger in the hard|high versus the easy|high condition (Figure 4B), consistent with their potential roles in attentional analgesia.

Impact of neuromodulators on regional brain activations and network interactions

Having identified this group of regions, in a network spanning the length of the neuraxis, whose activity and connectivity correspond to aspects of the attentional analgesia paradigm we examined whether naltrexone or reboxetine affected the regional BOLD activity or connectivity, comparing each drug against the placebo condition (using paired t-tests).

At the whole brain level, neither drug altered the activations seen for the main effect of temperature. Only the left anterior insula responded more strongly in the presence of Naltrexone for the main effect of task (Figure 3—figure supplement 2); however, this was not considered relevant to the analgesic effect as our behavioural findings showed no effect of naltrexone on task performance (Figure 2—figure supplement 3B). In the brainstem, a stronger response to temperature was detected in the lower medulla in the presence of naltrexone compared to placebo (Figure 3—figure supplement 2). There was no difference between naltrexone and placebo in the main effect of task in the brainstem. Similarly, no differences in either main effect were uncovered in the brainstem for the reboxetine versus placebo comparison.

The relative lack of effect of either drug on absolute BOLD signal changes provided little evidence for the localisation of their effects in either blocking attentional analgesia (naltrexone) or producing antinociception (reboxetine). However, it has previously been demonstrated that administration of opioidergic antagonists such as naloxone have measurable effects on neural dynamics assessed with fMRI (e.g. Eippert et al., 2009a). Therefore, we investigated the network of brain, brainstem and spinal regions that show effective connectivity changes associated with attentional analgesia (under the placebo condition) and explored whether these patterns were altered in the presence of reboxetine or naltrexone (paired t-tests versus placebo).

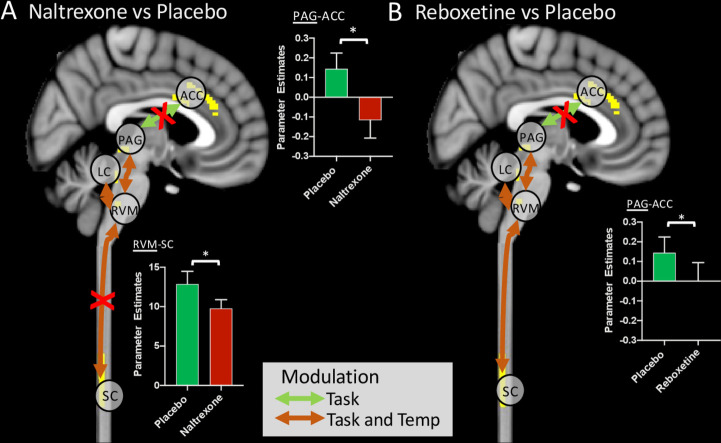
The administration of naltrexone, which abolished attentional analgesia behaviourally, significantly reduced the connection strength of RVM-spinal cord in the task*temperature interaction (Figure 5), indicating a role for opioids in this network interaction. The communication between ACC and PAG was also significantly weakened by both naltrexone and reboxetine, suggesting this connection to be modulated by both endogenous opioids and noradrenaline (Figure 5). The strength of the RVM-LC connection in the main effect of temperature was significantly diminished by reboxetine. None of the other connections in the network were altered significantly by the drugs compared to placebo.

Figure 5. Alteration of functional connectivity after dosing with naltrexone or reboxetine compared to placebo.

Figure 5.

The ACC-PAG connection was significantly weakened by Naltrexone and Reboxetine administration. The RVM-spinal cord connection was significantly weakened by Naltrexone. Red crosses indicate significantly weaker connections after drug. Inset bar plots show BOLD parameter estimates extracted from the PAG-ACC and RVM-spinal cord connections. (Means ± SEM, paired t-test, *p < 0.05).

Figure 5—source data 1. gPPI parameter estimates for connections by drug.

Discussion

Using brain, brainstem, and spinal cord fMRI we have been able to simultaneously measure the changes in neural activity during this attentional pain modulation study at all levels of the neuraxis during a randomised, placebo-controlled, crossover pharmacological study. This approach allowed unambiguous identification of the nociceptive signal at its site of entry in the dorsal horn and revealed that the task-driven cognitive reductions in pain perception echo the change in absolute BOLD signal at a spinal level. Remarkably the spinal imaging also identified a nearby cluster of neural activity that tracked the interaction between cognitive task and thermal stimulus. Analysis of effective connectivity between brain and brainstem regions and the spinal cord in a single acquisition allowed extension from previous findings (Brooks et al., 2017; Oliva et al., 2021a; Oliva et al., 2021b; Sprenger et al., 2012; Sprenger et al., 2015) to demonstrate causal changes mediating the interaction of pain and cognitive task including descending influences on the spinal dorsal horn. Naltrexone selectively blocked attentional analgesia and reduced connectivity between RVM and dorsal horn as well as between ACC and PAG. This provides evidence for opioid-dependent mechanisms in the descending pain modulatory pathway that is recruited to mediate the attentional modulation of pain.

The use of individually titrated noxious and innocuous stimuli from a thermode applied to the C6 dermatome of the medial forearm, allowed the identification of a somatotopic Spinalnoci cluster in the main effect of temperature contrast in the dorsal horn of the C6 segment. This was strikingly similar to the pattern of activation noted in several previous focussed spinal imaging pain studies in humans (Brooks et al., 2012; Eippert et al., 2009b; Sprenger et al., 2012; Sprenger et al., 2015; Tinnermann et al., 2017) and non-human primates (Yang et al., 2015). The extracted absolute BOLD from the Spinalnoci cluster was tightly correlated to the pain scores across the four experimental conditions and therefore the pattern of changes paralleled the changes in pain percept as it was modulated by task. This is similar to the seminal findings from electrophysiological recordings in non-human primates (Bushnell et al., 1984), which showed thermal stimulus evoked neural activity in the spinal nucleus of the trigeminal nerve to be altered by attentional focus. Further, it suggested that task related modulation of pain (Miron et al., 1989) could occur at the first relay point in the nociceptive transmission pathway. This finding of cognitive modulation of nociceptive input was extended through human spinal fMRI by Sprenger et al., 2012, who in a second psychophysical experiment with naloxone provided evidence that the modulation of pain percept may involve opioids. We show that naltrexone attenuates spinal responses to attentional analgesia, which underly the behavioural differences between the high|hard and easy|hard conditions.

Uniquely, our 2 × 2 factorial study design enabled the identification of neural activity reading out the interaction between task and temperature which strikingly was only seen at a spinal level in a cluster located deep and medial to the Spinalnoci cluster. The activity in this Spinalint cluster was highest in the high|hard condition (ie when the attentional analgesic effect is seen) and this activation was no longer significant in the presence of naltrexone. This may be consistent with the presence of a local interneuron population in the deeper dorsal horn that could influence the onward transmission of nociceptive information (Hughes and Todd, 2020; Koch et al., 2018). Such a circuit organisation is predicted by many animal models of pain regulation with the involvement of inhibitory interneurons that shape the incoming signals from the original gate theory of Melzack and Wall, 1965 through to descending control (Millan, 2002). For example, opioids like enkephalin are released from such local spinal inter-neuronal circuits (Corder et al., 2018; François et al., 2017) and similarly descending noradrenergic projections exert their influence in part via inhibitory interneurons and an alpha1-adrenoceptor mechanism (Baba et al., 2000a; Baba et al., 2000b; Gassner et al., 2009; Yoshimura and Furue, 2006). As such the ability to resolve this Spinalint cluster may open a window into how such local interneuron pools are recruited to shape nociceptive transmission in humans according to cognitive context.

Since our goal was to explore the functional connections between brain, brainstem, and spinal cord, we opted to use a single acquisition, with identical imaging parameters (e.g. orientation of slices, voxel dimensions, point spread function) for the entire CNS. This differs from other approaches using different parameters for spinal and brain acquisitions in two fields of view (Finsterbusch et al., 2012; Finsterbusch et al., 2013; Islam et al., 2019; Sprenger et al., 2015; Tinnermann et al., 2017 and reviewed in Tinnermann et al., 2021). Our choice was motivated by (i) the need to capture signal across the entire CNS region involved in the task (including the entire medulla), and (ii) that the use of different acquisition parameters for brain and spinal cord could be a confounding factor, particularly for connectivity analyses, due to altered BOLD sensitivity and point-spread function for the separate image acquisitions. By taking advantage the z-shimming approach (Finsterbusch et al., 2012) and of the recently developed Spinal Cord Toolbox (De Leener et al., 2017), we have been able to detect significant BOLD signal changes in response to experimental manipulations, across the entire CNS.

A key objective of the study was to determine how the information regarding the attentional task demand could be conveyed to the spinal cord. Analysis of regional BOLD signal showed activity in both the main effect of task and of temperature in all three of the key brainstem sites PAG, RVM, and LC with no interaction between task and temperature in the brainstem providing little indication as to which area might be mediating any analgesic effect (in line with previous Oliva et al., 2021b). However, an interaction effect was observed on the effective connectivity between RVM and dorsal horn, with coupling highest in the high|hard conditions. The importance of this descending connection to the attentional analgesic effect is emphasised by the effect of naltrexone which blocked both the modulation of RVM-spinal cord connectivity and attentional analgesia a behavioural finding previously noted by Sprenger et al., 2012. This fits with the classic model of descending pain modulation that has been developed through decades of animal research (Fields, 2004; Ossipov et al., 2010) that is engaged in situations of fight or flight and also during appetitive behaviours like feeding and reproduction. Here, we identify that the opioidergic system is also engaged moment by moment, in specific contexts, during a relatively simple cognitive tasks and uncover one of its loci of action in humans.

Analysis of effective connectivity also showed evidence for modulation of pathways from ACC to PAG and PAG to RVM by task and the interaction between task and temperature, respectively (in agreement with Oliva et al., 2021b). The communication between ACC and PAG was also disrupted by the opioid antagonist naltrexone. This is similar to the previous finding from studies of placebo analgesia where naloxone was shown to disrupt ACC-PAG communication which was also linked to the mediation of its analgesic effects (Eippert et al., 2009a), although behavioural findings of additive analgesia from concurrent placebo and attentional analgesia Buhle et al., 2012 have been used to argue for distinct pathways of mediation. Activation of the analogous ACC-PAG pathway in rats has recently been shown to produce an analgesic effect mediated via an inhibition of activity at a spinal level indicating that it indeed represents a component of the descending analgesic system (Drake et al., 2021). Interestingly, this study also found that this system failed in a chronic neuropathic pain model. This provides evidence for top-down control of spinal nociception during distraction from pain, via the ACC-PAG-RVM-dorsal horn pathway. These findings suggest that the ACC primarily signals the high cognitive load associated with the task to the PAG, that recruits spinally-projecting cells in the RVM. Analgesia could be achieved through disinhibition of spinally-projecting OFF-cells (Heinricher et al., 1994; Lau and Vaughan, 2014; Roychowdhury and Fields, 1996), that inhibit dorsal horn neurons both directly via GABAergic and opioidergic projections to the primary afferents (Morgan et al., 2008; Zhang et al., 2015) and also indirectly via local inhibitory interneuron pools at a spinal level (François et al., 2017) reflected in reduced BOLD signal in the Spinalnoci cluster and activation of the Spinalint pool.

Previous human imaging studies have provided evidence for a role of the locus coeruleus in attentional analgesia (Brooks et al., 2017; Oliva et al., 2021b). We replicate some of those findings in showing activity in the LC related to both task and thermal stimulus as well as interactions between the LC and RVM that were modulated by the interaction between task and temperature. However, we neither found evidence for an interaction between task and temperature nor for a correlation with analgesic effect in the LC that we reported in our previous studies (Brooks et al., 2017; Oliva et al., 2021b). We also could not demonstrate altered connectivity between the LC and the spinal cord during the paradigm as we anticipated given its known role in descending pain modulation (Hickey et al., 2014; Hirschberg et al., 2017; Llorca-Torralba et al., 2016; Millan, 2002; Oliva et al., 2021b; Ossipov et al., 2010). It is likely that the brainstem focussed slice prescription used previously is necessary for capturing sufficient signal from the LC, and that extending slice coverage to allow inclusion of the spinal cord compromised signal fidelity in this small brainstem nucleus. The noradrenergic manipulation with reboxetine did show a significant analgesic effect which was independent of task difficulty. This indicates that this dose of reboxetine is capable of altering baseline gain in the nociceptive system, but has no selective effect on attentional pain modulation. We performed a post hoc Bayesian paired t-test analysis contrasting reboxetine with placebo which showed moderate level of confidence in this null effect on attentional analgesia (Bayes Factor 6.8). Reboxetine also modulated a task-dependent connection between ACC and PAG, although this did not appear to influence task performance and so its behavioural significance is uncertain. In interpreting these findings, one potential explanation is that noradrenaline is not involved in attentional analgesia; however, it could also be because of a ceiling effect where the reuptake inhibitor cannot increase the noradrenaline level any further during the attentional task. In this sense, a noradrenergic antagonist experiment, similar to that used to examine the role of the opioids, would be ideal. However, selective alpha2-antagonists are not used clinically and even experimental agents like Yohimbine have a number of issues that would have confounded this study in that they cause anxiety, excitation and hypertension. Therefore, we conclude that were not able to provide any additional causal evidence to support a role of the LC in attentional analgesia, but this likely reflects a limitation of our approach and lack of good pharmacological tools to resolve the influence of this challenging target.

This combination of simultaneous whole CNS imaging with concurrent thermal stimulation and attentional task in the context of pharmacological manipulation, has enabled the identification of long-range network influences on spinal nociceptive processes and their neurochemistry. An important aspect of this approach is that it has enabled the linkage between a large body of fundamental pain neuroscience that focussed on primary afferent to spinal communication and brainstem interactions (nociception) which can be directly integrated to the findings of whole CNS human imaging. This also offers novel opportunities for translational studies to investigate mechanisms and demonstrate drug target engagement. The finding that it is the effective connectivity of these networks that is of importance in the mediation of the effect of attention and the influence of the opioid antagonist reflects recent observations from large scale studies relating psychological measures to functional connectivity (e.g. Dubois et al., 2018). In patient populations, this focus on long range connectivity may help to differentiate between processes leading to augmented nociception and/or altered perception and control (e.g. in fibromyalgia Oliva et al., 2021a). Finally, we note that the location of the observed interaction between task and temperature indicates that cognitive tasks are integrated to act at the earliest level in the nociceptive transmission pathway introducing the novel concept of spinal psychology.

Methods

Data acquisition

Participants

Healthy volunteers were recruited through email and poster advertisement in the University of Bristol and were screened via self-report for their eligibility to participate. Exclusion criteria included any psychiatric disorder (including anxiety/depression), diagnosed chronic pain condition (e.g. fibromyalgia), left handedness, recent use of psychoactive compounds (e.g. recreational drugs or antidepressants) and standard MRI-safety exclusion criteria.

The study was approved by the University of Bristol Faculty of Science Human Research Ethics Committee (reference 23111759828). An initial power analysis was done to determine the sample size using the fmripower software (Mumford and Nichols, 2008). Using data from our previous study of attentional analgesia (Brooks et al., 2017, main effect of task contrast in the periaqueductal grey matter mask) we designed the study to have an 80% power to detect an effect size of 0.425 (one sample t-test) in the PAG with an alpha of 0.05 requiring a cohort of 40 subjects. Of 57 subjects screened, two were excluded for claustrophobia, three were excluded for regular or recent drug use (including recreational), and five were excluded due to intolerance of the thermal stimulus. This was defined as high pain score ( ≥ 8/10) for a temperature that should be non-nociceptive ( < 43 °C). In addition, six participants withdrew from the study as they were unable to attend for the full three visits. One participant had an adverse reaction (nausea) to a study drug (naltrexone) and dropped out of the study. One subject was excluded for being unable to perform the task correctly. Thirty-nine participants completed all three study visits (mean age 23.7, range [18 - 45] years, 18 females).

Calibration of temperature and task velocity

In the first screening/calibration visit, the participants were briefed on the experiment and gave written informed consent. The participants were familiarised with thermal stimulation by undergoing a modified version of quantitative sensory testing (QST) based on the DFNS protocol (Rolke et al., 2006). QST was performed using a Pathway device (MEDOC, Haifa, Israel) with a contact ATS thermode of surface area 9 cm2 placed on the subject’s left forearm (corresponding to the C6 dermatome). Subsequently, the CHEPS thermode (surface area 5.73 cm2) was used at the same site to deliver a 30-s hot stimulus, to determine the temperature to be used in the experimental visits. Each stimulus consisted of a plateau temperature of 36°C to 45°C, and approximately thirty pseudorandomised ‘heat spikes’ of 2, 3, or 4 degrees superimposed on the plateau, each lasting less than a second. This temperature profile was used in our previous studies (Brooks et al., 2017; Oliva et al., 2021a; Oliva et al., 2021b) to maintain painful perception, while at the same time avoiding sensitisation and skin damage (Lautenbacher et al., 1995). Participants received a range of temperatures between 36°C and 45°C, and were asked to rate the sensation they felt for each stimulus, on a scale from 0 (no pain) to 10 (the worst pain imaginable). The stimulus provoking a pain rating of 6 out of 10 at least three times in a row, was used for the ‘high’ temperature stimulation in the experiment. If the participant only gave pain scores lower than six to all stimuli, then the maximum programmable plateau temperature of 45 °C was used, but with higher temperature spikes of 3, 4, and 5 degrees above, reaching the highest temperature allowed for safety (50 °C maximum).

The session also included a calibration of the rapid serial visual presentation (RSVP) task (Potter and Levy, 1969), where participants were asked to spot the number five among distractor characters. The task was repeated 16 times at different velocities (i.e. different inter-character intervals) in pseudorandom order, ranging from 32 to 256ms. To identify the optimal speed for the hard version of the RSVP task (defined as 70% of each subject’s maximum d’ score), the d’ scores for the different velocities were plotted and the curve fit to a sigmoidal function, using a non-linear least squares fitting routine in Excel (Solver). Once parameterised, the target speed for 70% performance was recorded for subsequent use during the imaging session.

Imaging sessions

Following the screening/calibration session, participants returned for three imaging sessions, spaced at least a week apart. Participants underwent drug screening (questionnaire) and pregnancy testing. After eating a light snack, they were given either an inert placebo capsule, naltrexone (50 mg). or reboxetine (4 mg) according to a randomised schedule. The dose of the opioid antagonist Naltrexone (50 mg) was as per the British National Formulary (BNF) where it is licensed to prevent relapse in opioid or alcohol dependency. Naltrexone is well absorbed with high oral bioavailability and its levels in the serum peak after 1 hr with a half-life of between 8 and 12 hr (Verebey et al., 1976). Reboxetine is used for the treatment of depression, and we used the lowest dose recommended by the BNF (4 mg). It has high oral bioavailability (~95%), serum levels peak at around 2 hr after oral administration and it has a half-life of 12 hr (Fleishaker, 2000). Both drugs have previously been used for imaging studies and these formed the basis for our choice of dosing and protocol timings. Oral naltrexone (50 mg) produces 95% blockade of mu opioid receptor binding in the brain (assessed with Carfentanil PET, Weerts et al., 2008). Additionally, naltrexone (50 mg) altered network activity in a pharmaco-fMRI study and was well tolerated (Morris et al., 2018). Oral reboxetine (4 mg) has been used successfully in human volunteer studies of affective bias with fMRI neuroimaging (Harmer et al., 2003; Miskowiak et al., 2007). Harmer and colleagues reported an effect of the noradrenergic reuptake inhibitor on emotional processing but no effect on performance of a rapid serial visual presentation task.

All tablets were encased in identical gelatine capsules and dispensed in numbered bottles prepared by the hospital pharmacy (Bristol Royal Infirmary, University Hospitals Bristol and Weston NHS Foundation Trust). Neither the participant nor the investigator knew the identity of the drug which was allocated by a computer-generated randomised schedule. No subject reported being aware of whether they had received active drug or placebo (but the effectiveness of masking was not formally assessed post hoc after dosing).

One hour after drug dosing, calibration of the RSVP task was repeated (to control for any effect on performance). Before scanning, participants received the high thermal stimulus at their pre-determined temperature, which they rated verbally. If the rating was 6 ± 1, the temperature was kept the same, otherwise it was adjusted accordingly (up or down). Neither reboxetine nor naltrexone caused a significant change in pain perception or task velocity during the calibration, as verified with paired t tests (placebo versus reboxetine and placebo versus naltrexone, see Figure 2—figure supplement 3). On average, the plateau temperature used for high temperature stimuli was 43.8°C ± 1.25°C. The median inter-stimulus interval for the hard RSVP task was 48ms, range [32-96].

In the MRI scanner, participants performed the RSVP task at either difficulty level (easy or hard) whilst innocuous (low) or noxious (high) thermal stimuli were delivered concurrently to their left forearm. The four experimental conditions (easy|high, hard|high, easy|low, hard|low), were repeated four times each, in a pseudo-random order. The hard version (70% d’ performance) of the task and the high (noxious) thermal stimulus were calibrated as described above. In the easy version of the task, the inter-character presentation speed was always set at 192ms, except when a participant’s hard task velocity of was equal or slower than 96ms, whereby the easy task was set to 256ms. The low (innocuous) thermal stimulus was always set to be a plateau of 36 °C with spikes of 2, 3, and 4 °C above this baseline. Participants performed the task (identifying targets) and provided pain ratings 10 s after the end of each experimental block on a visual analogue scale (0–100), using a button box (Lumina) held in their dominant (right) hand.

Acquisition of functional images

Functional images were obtained with a 3T Siemens Skyra MRI scanner, and 64 channel receive-only head and neck coil. After acquisition of localiser images, a sagittal volumetric T1-weighted structural image of brain, brainstem and spinal cord was acquired using the MPRAGE pulse sequence, (TR = 2000ms, TE = 3.72ms, TI = 1000ms, flip angle 9°, field of view (FoV) 320 mm, GRAPPA acceleration factor = 2) and 1.0 mm isotropic resolution. Blood oxygenation level dependent (BOLD) functional data was acquired axially from the top of the brain to the intervertebral disc between the C6 and C7 vertebral bodies, with TR = 3000ms, TE = 39ms, GRAPPA acceleration factor = 2, flip angle 90°, FoV 170 mm, phase encoding direction P>>A, matrix size 96 by 96.

Slices were positioned perpendicular to the long axis of the cord for the C5-C6 spinal segments, whilst still maintaining whole brain coverage, and had an in-plane resolution of 1.77 × 1.77 mm and slice thickness of 4 mm and a 40% gap between slices (increased to 45–50% in taller participants). To determine the optimal shim offset for each slice, calibration scans were acquired cycling through 15 shim offsets. For the caudal 20 slices covering from spinal cord to medulla, manual inspection of images determined the optimal shim offset to be used for each subject (Finsterbusch et al., 2012). The remaining supraspinal slices were acquired with the first and higher order shim offsets determined using the scanner’s automated routine. The ability of z-shimmed whole CNS imaging to adequately capture BOLD signal was assessed through pilot data examining the temporal signal to noise ratio (tSNR) across cord and brain, see Figure 1—figure supplement 1.

During scanning, cardiac and respiratory processes were recorded using a finger pulse oximeter (Nonin 7500) and pneumatic bellows (Lafayette), respectively. These physiological signals and scanner triggers were recorded using an MP150 data acquisition unit (BIOPAC, Goleta, CA), and converted to text files for subsequent use during signal modelling.

Data analysis

Analysis of pain scores

Pain scores recorded during the experiment were investigated collectively for the three visits using a three-way ANOVA in Prism version eight for Windows (GraphPad Software, La Jolla, California). Any significant interaction was further investigated with two separate three-way ANOVAs (placebo versus naltrexone and placebo versus reboxetine). Finally, each drug condition was analysed individually with three separate two-way ANOVAs. Two-tailed post-hoc tests were used to further investigate any interactions.

Pre-processing of functional data and single-subject analysis

Functional data were divided into spinal cord and brain/brainstem, by splitting at the top of the odontoid process (dens) of the 2nd cervical vertebra. The resulting two sets of images underwent separate, optimised, pre-processing pipelines.

Spinal cord data was motion corrected with AFNI 2dImReg (Cox, 1996), registering all time points to the temporal mean. Data was smoothed with an in-plane 2D Gaussian smoothing kernel of 2mm x 2mm FWHM, using an in-house generated script. The Spinal Cord Toolbox (SCT, v4.1.1) was then used to create a 25 mm diameter cylindrical mask around the entire cord to crop the functional data. The SCT was also used to segment the cord from the cerebrospinal fluid (CSF) and register functional images to the PAM50 template (De Leener et al., 2018). Manual intervention was necessary to ensure accurate cord segmentation on EPI data. The registration pipeline included two steps: (1) registration of each subject’s T1-weighted structural scan to the PAM50 T1-weighted template, (2) registration of acquired functional images to PAM50 template (T2*-weighted) using the output from step one as an initial warping. The inverse warping fields generated by this process were also used to transform the PAM50 CSF mask to subject space (Figure 2—figure supplement 4 and Animation 1). The mask was then used to create a CSF regressor for use during correction for physiological noise during first level FEAT analysis (part of FSL Jenkinson et al., 2012).

Brain functional data was pre-processed and analysed in FEAT. Pre-processing included smoothing with a 6 mm Gaussian kernel, and motion correction with MCFLIRT (Jenkinson et al., 2002). Functional data was unwarped with a fieldmap using FUGUE (Jenkinson, 2003), then co-registered to the subject’s T1-weighted structural scan using boundary-based registration (Greve and Fischl, 2009). Structural scans were registered to the 2 mm MNI template using a combination of linear (FLIRT, Jenkinson and Smith, 2001) and non-linear (FNIRT, Andersson et al., 2007) registration with 5 mm warp resolution.

Physiological noise correction was conducted for the brain and spinal cord (Brooks et al., 2008; Harvey et al., 2008) within FEAT, and as recommended for use in PPI analyses (Barton et al., 2015). Cardiac and respiratory phases were determined using a physiological noise model (PNM, part of FSL), and slice specific regressors determined for the entire CNS coverage. Subsequently these regressors (which are 4D images) were split at the level of the odontoid process, to be used separately for brain and spinal cord physiological noise correction. For the brain data the PNM consisted of 32 regressors, with the addition of a CSF regressor for the spinal cord, giving a total of 33 regressors for this region.

All functional images were analysed using a general linear model (GLM) in FEAT with high-pass temporal filtering (cut-off 90 s) and pre-whitening using FILM (Woolrich et al., 2001). The model included a regressor for each of the experimental conditions (easy|high, hard|high, easy|low, hard|low), plus regressors of no interest (task instructions, rating periods), and their temporal derivatives. Motion parameters and physiological regressors were also included in the model to help explain signal variation due to bulk movement and physiological noise. The experimental regressors of interest were used to build the following planned statistical contrasts: positive and negative main effect of temperature (high temperature conditions versus low temperature conditions and vice versa), positive and negative main effect of task (hard task conditions versus easy task conditions and vice versa), and positive and negative interactions.

Activity within the cerebrum was assessed using conventional whole-brain cluster-based thresholding and mixed-effects modelling, based on recent recommendations (Eklund et al., 2016). However, such an approach would not have been appropriate for the small, non-spherical nuclei within the brainstem and laminar arrangement of the spinal cord dorsal horn, which will typically have a larger rostro-caudal extent. Here we chose to use probabilistic anatomical masks (from Brooks et al., 2017 and available from https://osf.io/xqvb6/ and De Leener et al., 2017) to restrict analysis to specific regions, along with permutation testing to assess significance levels with threshold free cluster enhancement (TFCE) (Smith and Nichols, 2009).

Group analysis

We used a conservative approach to investigate differences in CNS activity in main effects and interactions due to administration of reboxetine or naltrexone. All first-level analyses, single group averages and pooled analyses were performed with the experimenter masked to the study visit (i.e. drug session). The pooled analysis separately averaged across sessions the brain, brainstem, and spinal cord activation in the planned contrasts (main effects of temperature, task, and their interaction): individual subjects’ data were averaged using a within-subject ‘group’ model (treating variance between sessions as a random effect), and resultant outputs averaged (across subjects) using a mixed effects model. This allowed the generation of functional masks, to use for investigation of differences between drug conditions.

Generalised psychophysiological interaction (gPPI) analysis (McLaren et al., 2012) was used to assess effective connectivity changes between brain, brainstem, and spinal cord during the attentional analgesia experiment. The list of regions to be investigated were specified a priori on the basis of our previous study (Oliva et al., 2021b), and included the ACC, PAG, LC, and RVM – to which was added the left side of the spinal cord at the C5/C6 vertebral level. Following partial unblinding to drug, an initial analysis was performed for the placebo visit. This analysis strategy, which examined connectivity between CNS regions identified in the pooled data and previously (Brooks et al., 2017; Oliva et al., 2021b), was initially limited to examination of the placebo data and largely replicated our earlier findings (Oliva et al., 2021b). By identifying those connections that are normally active during attentional analgesia, we could then test whether they are subject to specific neurotransmitter modulation. This involved partial-unmasking to the remaining two conditions (information on the specific drug used was withheld), so paired t-tests could be performed between the connections of interest. Finally, after the analysis was completed the full unmasking was allowed for the purpose of interpretation of paired differences between conditions.

Pooled analysis – spinal cord

For each subject, parameter maps estimated for each contrast and each visit (i.e. drug session), were registered to the PAM50 template with SCT. Each contrast was then averaged across visits using a within-subject ordinary least squares (OLS) model using FLAME (part of FSL) from command line. The resulting average contrasts (registered to the PAM50 template) were each concatenated across subjects (i.e. each contrast had 39 samples). These were then investigated with a one-sample t-test in RANDOMISE, using a left C5-6 vertebral mask, based on the probabilistic atlas from the SCT. The choice to use a relatively large vertebral level mask, rather than a more focussed grey matter mask, was based on consideration of (1) the voxel size of our fMRI data compared to the high-resolution data (0.5 mm) used to define probabilistic grey matter masks in SCT, and (2) to allow for inter-subject differences in segmental representation of the stimulation site on the left forearm. It should be noted that by using larger masks we effectively decreased our sensitivity to detect activation, due to the more punitive multiple comparison correction. Results are reported with threshold free cluster enhancement (TFCE) p < 0.05 corrected for multiple comparisons. Significant regions of activation from this pooled analysis were used to generate masks for subsequent comparison between conditions, using paired t-tests.

Pooled analysis – brainstem

Similar to the spinal cord, for each subject, parameter maps from the brainstem for each planned contrast and visit were averaged with an OLS model in FEAT software. The resulting average was the input to a between-subjects, mixed effects, one-sample t-test in FEAT. Subsequently, group activations for each of the six contrasts were investigated with permutation testing in RANDOMISE, using a probabilistic mask of the brainstem taken from the Harvard-Oxford subcortical atlas (threshold set to p = 0.5). Results are reported with TFCE correction and p < 0.05. Significant regions of activity were binarized and used as a functional mask for the between conditions comparison.

Pooled analysis – brain

Brain data was averaged and analysed with the same FEAT analyses that were applied in the brainstem. Following within subject averaging, group activity was assessed with a mixed effects two-tailed one sample t-test at the whole-brain level, with results reported for cluster forming threshold of Z > 3.1, and corrected cluster significance of p < 0.05. This produced maps of activity (one per planned contrast) that were then binarized to produce masks that were used in follow up paired t-tests.

Within subject comparison – paired tests

Paired t tests were performed to resolve potential changes in activity in reboxetine versus placebo and naltrexone versus placebo, separately. Design and contrast files for input in RANDOMISE were built in FEAT. A group file with appropriately defined exchangeability blocks was additionally defined. Permutation testing in RANDOMISE was used to assess group level differences between placebo and the two drugs, separately for brain, brainstem, and spinal cord. The investigation was restricted to the functional masks derived from the main effect an`alysis for each contrast.

Effective connectivity analysis (gPPI)

For connectivity analysis, functional data for brain, brainstem, and spinal cord were pre-processed as previously described (Oliva et al., 2021b). To restrict analysis to connections typically observed during attentional analgesia, we initially estimated the connection pattern for the placebo session, then within this network tested for differences in the other drug conditions. To achieve this goal, placebo data were first analysed for main effects/interaction with the simple (non-gPPI) analysis to define the pattern of BOLD activity. Subsequently, time series extraction was restricted to anatomical regions/contrasts identified previously (Oliva et al., 2021b), and a left sided C5/C6 spinal mask which was used to determine spinal cord activation (derived from the spinal cord toolbox De Leener et al., 2017). Physiological time-series were extracted from the voxel of greatest significance identified in the analysis of the placebo session, within the prespecified anatomical regions. In particular, time series were extracted from the peak voxel responding to the main effect of temperature in the RVM and spinal cord, the main effect of task in the ACC, PAG and LC, and the task * temperature interaction in the spinal cord (see Figure 4—figure supplements 1 and 2).

For gPPI, physiological time-series were included in a GLM that also included the same regressors present in the first level main effects analysis that is regressors for the experimental conditions and all nuisance regressors (rating period, instruction, PNM, movement parameters). Interaction regressors were then built by multiplying the physiological time-series by each of the experimental regressors, and the planned contrasts constructed (e.g. positive main effect of task). Slice timing correction was not used for this connectivity analysis, as (1) there is no clear recommendation for its use (Harrison et al., 2017; McLaren et al., 2012; O’Reilly et al., 2012), (2) it was omitted in a similar cortico-spinal fMRI study (Tinnermann et al., 2017), and (3) to be consistent with our previous study (Oliva et al., 2021b). Apart from systematically varying the input physiological timeseries corresponding to different seed regions, models used for estimating connectivity for brain and spinal cord seeds were otherwise identical. Estimates of effective connectivity for the group were obtained with permutation testing with RANDOMISE, using as targets the same ROI masks used for time-series extraction. For example, a gPPI analysis with an RVM seed timeseries (taken from the region responding during the main effect of temperature), examined connectivity to brain/brainstem and spinal cord with PAG, LC, ACC, and left C5-6 vertebral masks. To test whether drug administration altered connectivity during attentional analgesia, the significant connections detected in the placebo session were examined for differences in the other drug conditions i.e. the same masks were used for time-series extraction for gPPI analysis of the naltrexone/reboxetine conditions. At the group level, two-tailed paired t-tests were used to detect differences with RANDOMISE (TFCE, p < 0.05) between placebo and naltrexone, and between placebo and reboxetine visits, as described above.

Acknowledgements

The authors thank Aileen Wilson (Lead Research Radiographer, CRiCBristol) for her support in running experiments, and the subjects who kindly agreed to take part. This research was funded in whole, or in part, by the Wellcome Trust [203963/Z/16/Z; and 088373/Z/09 /A] and Medical Research Council [MR/N026969/1]. For the purpose of Open Access, the author has applied a CC BY public copyright licence to any Author Accepted Manuscript version arising from this submission.

Funding Statement

The funders had no role in study design, data collection and interpretation, or the decision to submit the work for publication.

Contributor Information

Anthony E Pickering, Email: tony.pickering@bristol.ac.uk.

Markus Ploner, Technische Universität München, Germany.

Timothy E Behrens, University of Oxford, United Kingdom.

Funding Information

This paper was supported by the following grants:

  • Wellcome Trust 203963/Z/16/Z to Valeria Oliva.

  • Wellcome Trust 088373/Z/09/A to Anthony E Pickering.

  • Medical Research Council MR/N026969/1 to Jonathan CW Brooks.

Additional information

Competing interests

No competing interests declared.

Author contributions

Conceptualization, Data curation, Formal analysis, Investigation, Visualization, Writing – original draft, Writing – review and editing.

Methodology, Software.

Conceptualization, Writing – review and editing.

Conceptualization, Funding acquisition, Methodology, Project administration, Supervision, Visualization, Writing – original draft, Writing – review and editing.

Conceptualization, Data curation, Methodology, Project administration, Supervision, Writing – original draft, Writing – review and editing.

Ethics

Human subjects: The study was approved by the University of Bristol Faculty of Science Human Research Ethics Committee (reference 23111759828). All participants were given a participant information sheet. In the first screening/calibration visit, the participants were briefed on the experiment and gave written informed consent.

Additional files

Transparent reporting form

Data availability

Source data is provided for Figure 2 (A, C, D, E, and supplementary 1, 2 and 3) and Figure 4 (B) and Figure 5. Un-thresholded statistical maps have been shared in Open Science Framework and are available at the following link: https://osf.io/dtpr6/ and the brainstem regional masks of PAG, LC, RVM are available from https://osf.io/xqvb6/.

The following dataset was generated:

Oliva V, Pickering T, Brooks J. 2021. Simultaneous brain, brainstem and spinal cord pharmacological-fMRI reveals endogenous opioid network interactions mediating attentional analgesia. Open Science Framework.

The following previously published dataset was used:

Oliva V, Pickering T, Brooks J. 2021. Probabalistic anatomical gray matter masks of Periaqueductal grey, Locus coeruleus and Rostroventromedial medulla. Open Science Framework.

References

  1. Andersson JLR, Jenkinson M, Smith S. Non-Linear Registration Aka Spatial Normalisation FMRIB. Oxford, United Kingdom: Oxford Press; 2007. [Google Scholar]
  2. Aston-Jones G, Cohen JD. An integrative theory of locus coeruleus-norepinephrine function: adaptive gain and optimal performance. Annual Review of Neuroscience. 2005;28:403–450. doi: 10.1146/annurev.neuro.28.061604.135709. [DOI] [PubMed] [Google Scholar]
  3. Baba H, Goldstein PA, Okamoto M, Kohno T, Ataka T, Yoshimura M, Shimoji K. Norepinephrine facilitates inhibitory transmission in substantia gelatinosa of adult rat spinal cord (part 2): effects on somatodendritic sites of GABAergic neurons. Anesthesiology. 2000a;92:485–492. doi: 10.1097/00000542-200002000-00031. [DOI] [PubMed] [Google Scholar]
  4. Baba H, Shimoji K, Yoshimura M. Norepinephrine facilitates inhibitory transmission in substantia gelatinosa of adult rat spinal cord (part 1): effects on axon terminals of GABAergic and glycinergic neurons. Anesthesiology. 2000b;92:473–484. doi: 10.1097/00000542-200002000-00030. [DOI] [PubMed] [Google Scholar]
  5. Bantick SJ, Wise RG, Ploghaus A, Clare S, Smith SM, Tracey I. Imaging how attention modulates pain in humans using functional MRI. Brain. 2002;125:310–319. doi: 10.1093/brain/awf022. [DOI] [PubMed] [Google Scholar]
  6. Barton M, Marecek R, Rektor I, Filip P, Janousova E, Mikl M. Sensitivity of PPI analysis to differences in noise reduction strategies. Journal of Neuroscience Methods. 2015;253:218–232. doi: 10.1016/j.jneumeth.2015.06.021. [DOI] [PubMed] [Google Scholar]
  7. Benedetti F, Piedimonte A. The neurobiological underpinnings of placebo and nocebo effects. Seminars in Arthritis and Rheumatism. 2019;49:S18–S21. doi: 10.1016/j.semarthrit.2019.09.015. [DOI] [PubMed] [Google Scholar]
  8. Brooks JCW, Beckmann CF, Miller KL, Wise RG, Porro CA, Tracey I, Jenkinson M. Physiological noise modelling for spinal functional magnetic resonance imaging studies. NeuroImage. 2008;39:680–692. doi: 10.1016/j.neuroimage.2007.09.018. [DOI] [PubMed] [Google Scholar]
  9. Brooks JCW, Kong Y, Lee MC, Warnaby CE, Wanigasekera V, Jenkinson M, Tracey I. Stimulus Site and Modality Dependence of Functional Activity within the Human Spinal Cord. Journal of Neuroscience. 2012;32:6231–6239. doi: 10.1523/JNEUROSCI.2543-11.2012. [DOI] [PMC free article] [PubMed] [Google Scholar]
  10. Brooks JCW, Davies WE, Pickering AE. Resolving the Brainstem Contributions to Attentional Analgesia. The Journal of Neuroscience. 2017;37:2279–2291. doi: 10.1523/JNEUROSCI.2193-16.2016. [DOI] [PMC free article] [PubMed] [Google Scholar]
  11. Buhle JT, Stevens BL, Friedman JJ, Wager TD. Distraction and placebo: two separate routes to pain control. Psychological Science. 2012;23:246–253. doi: 10.1177/0956797611427919. [DOI] [PubMed] [Google Scholar]
  12. Bushnell MC, Duncan GH, Dubner R, He LF. Activity of trigeminothalamic neurons in medullary dorsal horn of awake monkeys trained in a thermal discrimination task. Journal of Neurophysiology. 1984;52:170–187. doi: 10.1152/jn.1984.52.1.170. [DOI] [PubMed] [Google Scholar]
  13. Bushnell MC, Ceko M, Low LA. Cognitive and emotional control of pain and its disruption in chronic pain. Nature Reviews. Neuroscience. 2013;14:502–511. doi: 10.1038/nrn3516. [DOI] [PMC free article] [PubMed] [Google Scholar]
  14. Büssing A, Ostermann T, Neugebauer EAM, Heusser P. Adaptive coping strategies in patients with chronic pain conditions and their interpretation of disease. BMC Public Health. 2010;10:507. doi: 10.1186/1471-2458-10-507. [DOI] [PMC free article] [PubMed] [Google Scholar]
  15. Cohen-Adad J, Gauthier CJ, Brooks JCW, Slessarev M, Han J, Fisher JA, Rossignol S, Hoge RD. BOLD signal responses to controlled hypercapnia in human spinal cord. NeuroImage. 2010;50:1074–1084. doi: 10.1016/j.neuroimage.2009.12.122. [DOI] [PubMed] [Google Scholar]
  16. Corder G, Castro DC, Bruchas MR, Scherrer G. Endogenous and Exogenous Opioids in Pain. Annual Review of Neuroscience. 2018;41:453–473. doi: 10.1146/annurev-neuro-080317-061522. [DOI] [PMC free article] [PubMed] [Google Scholar]
  17. Cox RW. AFNI: Software for Analysis and Visualization of Functional Magnetic Resonance Neuroimages. Computers and Biomedical Research. 1996;29:162–173. doi: 10.1006/cbmr.1996.0014. [DOI] [PubMed] [Google Scholar]
  18. Crombez G, Eccleston C, Van den Broeck A, Goubert L, Van Houdenhove B. Hypervigilance to pain in fibromyalgia: the mediating role of pain intensity and catastrophic thinking about pain. The Clinical Journal of Pain. 2004;20:98–102. doi: 10.1097/00002508-200403000-00006. [DOI] [PubMed] [Google Scholar]
  19. De Felice M, Sanoja R, Wang R, Vera-Portocarrero L, Oyarzo J, King T, Ossipov MH, Vanderah TW, Lai J, Dussor GO, Fields HL, Price TJ, Porreca F. Engagement of descending inhibition from the rostral ventromedial medulla protects against chronic neuropathic pain. Pain. 2011;152:2701–2709. doi: 10.1016/j.pain.2011.06.008. [DOI] [PMC free article] [PubMed] [Google Scholar]
  20. De Leener B, Lévy S, Dupont SM, Fonov VS, Stikov N, Louis Collins D, Callot V, Cohen-Adad J. SCT: Spinal Cord Toolbox, an open-source software for processing spinal cord MRI data. NeuroImage. 2017;145:24–43. doi: 10.1016/j.neuroimage.2016.10.009. [DOI] [PubMed] [Google Scholar]
  21. De Leener B, Fonov VS, Collins DL, Callot V, Stikov N, Cohen-Adad J. PAM50: Unbiased multimodal template of the brainstem and spinal cord aligned with the ICBM152 space. NeuroImage. 2018;165:170–179. doi: 10.1016/j.neuroimage.2017.10.041. [DOI] [PubMed] [Google Scholar]
  22. Drake RA, Steel KA, Apps R, Lumb BM, Pickering AE. Loss of cortical control over the descending pain modulatory system determines the development of the neuropathic pain state in rats. eLife. 2021;10:e65156. doi: 10.7554/eLife.65156. [DOI] [PMC free article] [PubMed] [Google Scholar]
  23. Dubois J, Galdi P, Paul LK, Adolphs R. A distributed brain network predicts general intelligence from resting-state human neuroimaging data. Philosophical Transactions of the Royal Society B. 2018;373:20170284. doi: 10.1098/rstb.2017.0284. [DOI] [PMC free article] [PubMed] [Google Scholar]
  24. Duval T, McNab JA, Setsompop K, Witzel T, Schneider T, Huang SY, Keil B, Klawiter EC, Wald LL, Cohen-Adad J. In vivo mapping of human spinal cord microstructure at 300 mT/m. NeuroImage. 2015;118:494–507. doi: 10.1016/j.neuroimage.2015.06.038. [DOI] [PMC free article] [PubMed] [Google Scholar]
  25. Eccleston C, Crombez G. Pain demands attention: A cognitive–affective model of the interruptive function of pain. Psychological Bulletin. 1999;125:356–366. doi: 10.1037/0033-2909.125.3.356. [DOI] [PubMed] [Google Scholar]
  26. Eippert F, Bingel U, Schoell ED, Yacubian J, Klinger R, Lorenz J, Büchel C. Activation of the opioidergic descending pain control system underlies placebo analgesia. Neuron. 2009a;63:533–543. doi: 10.1016/j.neuron.2009.07.014. [DOI] [PubMed] [Google Scholar]
  27. Eippert F, Finsterbusch J, Bingel U, Büchel C. Direct evidence for spinal cord involvement in placebo analgesia. Science (New York, N.Y.) 2009b;326:404. doi: 10.1126/science.1180142. [DOI] [PubMed] [Google Scholar]
  28. Eklund A, Nichols TE, Knutsson H. Cluster failure: Why fMRI inferences for spatial extent have inflated false-positive rates. PNAS. 2016;113:7900–7905. doi: 10.1073/pnas.1602413113. [DOI] [PMC free article] [PubMed] [Google Scholar]
  29. Erpelding N, Davis KD. Neural underpinnings of behavioural strategies that prioritize either cognitive task performance or pain. Pain. 2013;154:2060–2071. doi: 10.1016/j.pain.2013.06.030. [DOI] [PubMed] [Google Scholar]
  30. Fields HL, Basbaum AI. Brainstem Control of Spinal Pain-Transmission Neurons. Annual Review of Physiology. 1978;40:217–248. doi: 10.1146/annurev.ph.40.030178.001245. [DOI] [PubMed] [Google Scholar]
  31. Fields H. State-dependent opioid control of pain. Nature Reviews. Neuroscience. 2004;5:565–575. doi: 10.1038/nrn1431. [DOI] [PubMed] [Google Scholar]
  32. Finsterbusch J, Eippert F, Büchel C. Single, slice-specific z-shim gradient pulses improve T2*-weighted imaging of the spinal cord. NeuroImage. 2012;59:2307–2315. doi: 10.1016/j.neuroimage.2011.09.038. [DOI] [PubMed] [Google Scholar]
  33. Finsterbusch J, Sprenger C, Büchel C. Combined T2*-weighted measurements of the human brain and cervical spinal cord with a dynamic shim update. NeuroImage. 2013;79:153–161. doi: 10.1016/j.neuroimage.2013.04.021. [DOI] [PubMed] [Google Scholar]
  34. Fleishaker JC. Clinical pharmacokinetics of reboxetine, a selective norepinephrine reuptake inhibitor for the treatment of patients with depression. Clinical Pharmacokinetics. 2000;39:413–427. doi: 10.2165/00003088-200039060-00003. [DOI] [PubMed] [Google Scholar]
  35. François A, Low SA, Sypek EI, Christensen AJ, Sotoudeh C, Beier KT, Ramakrishnan C, Ritola KD, Sharif-Naeini R, Deisseroth K, Delp SL, Malenka RC, Luo L, Hantman AW, Scherrer G. A Brainstem-Spinal Cord Inhibitory Circuit for Mechanical Pain Modulation by GABA and Enkephalins. Neuron. 2017;93:822–839. doi: 10.1016/j.neuron.2017.01.008. [DOI] [PMC free article] [PubMed] [Google Scholar]
  36. Gassner M, Ruscheweyh R, Sandkühler J. Direct excitation of spinal GABAergic interneurons by noradrenaline. Pain. 2009;145:204–210. doi: 10.1016/j.pain.2009.06.021. [DOI] [PubMed] [Google Scholar]
  37. Gracely RH, Geisser ME, Giesecke T, Grant MAB, Petzke F, Williams DA, Clauw DJ. Pain catastrophizing and neural responses to pain among persons with fibromyalgia. Brain. 2004;127:835–843. doi: 10.1093/brain/awh098. [DOI] [PubMed] [Google Scholar]
  38. Greve DN, Fischl B. Accurate and robust brain image alignment using boundary-based registration. NeuroImage. 2009;48:63–72. doi: 10.1016/j.neuroimage.2009.06.060. [DOI] [PMC free article] [PubMed] [Google Scholar]
  39. Harmer CJ, Hill SA, Taylor MJ, Cowen PJ, Goodwin GM. Toward a neuropsychological theory of antidepressant drug action: increase in positive emotional bias after potentiation of norepinephrine activity. The American Journal of Psychiatry. 2003;160:990–992. doi: 10.1176/appi.ajp.160.5.990. [DOI] [PubMed] [Google Scholar]
  40. Harrison TM, McLaren DG, Moody TD, Feusner JD, Bookheimer SY. Generalized Psychophysiological Interaction (PPI) Analysis of Memory Related Connectivity in Individuals at Genetic Risk for Alzheimer’s Disease. Journal of Visualized Experiments. 2017;14:55394. doi: 10.3791/55394. [DOI] [PMC free article] [PubMed] [Google Scholar]
  41. Harvey AK, Pattinson KTS, Brooks JCW, Mayhew SD, Jenkinson M, Wise RG. Brainstem functional magnetic resonance imaging: Disentangling signal from physiological noise. Journal of Magnetic Resonance Imaging. 2008;28:1337–1344. doi: 10.1002/jmri.21623. [DOI] [PubMed] [Google Scholar]
  42. Heinricher MM, Morgan MM, Tortorici V, Fields HL. Disinhibition of off-cells and antinociception produced by an opioid action within the rostral ventromedial medulla. Neuroscience. 1994;63:279–288. doi: 10.1016/0306-4522(94)90022-1. [DOI] [PubMed] [Google Scholar]
  43. Hickey L, Li Y, Fyson SJ, Watson TC, Perrins R, Hewinson J, Teschemacher AG, Furue H, Lumb BM, Pickering AE. Optoactivation of Locus Ceruleus Neurons Evokes Bidirectional Changes in Thermal Nociception in Rats. Journal of Neuroscience. 2014;34:4148–4160. doi: 10.1523/JNEUROSCI.4835-13.2014. [DOI] [PMC free article] [PubMed] [Google Scholar]
  44. Hirschberg S, Li Y, Randall A, Kremer EJ, Pickering AE. Functional dichotomy in spinal- vs prefrontal-projecting locus coeruleus modules splits descending noradrenergic analgesia from ascending aversion and anxiety in rats. eLife. 2017;6:e29808. doi: 10.7554/eLife.29808. [DOI] [PMC free article] [PubMed] [Google Scholar]
  45. Hughes S, Hickey L, Donaldson LF, Lumb BM, Pickering AE. Intrathecal reboxetine suppresses evoked and ongoing neuropathic pain behaviours by restoring spinal noradrenergic inhibitory tone. Pain. 2015;156:328–334. doi: 10.1097/01.j.pain.0000460313.73358.31. [DOI] [PubMed] [Google Scholar]
  46. Hughes DI, Todd AJ. Central Nervous System Targets: Inhibitory Interneurons in the Spinal Cord. Neurotherapeutics : The Journal of the American Society for Experimental NeuroTherapeutics. 2020;17:874–885. doi: 10.1007/s13311-020-00936-0. [DOI] [PMC free article] [PubMed] [Google Scholar]
  47. Islam H, Law CSW, Weber KA, Mackey SC, Glover GH. Dynamic per slice shimming for simultaneous brain and spinal cord fMRI. Magnetic Resonance in Medicine. 2019;81:825–838. doi: 10.1002/mrm.27388. [DOI] [PMC free article] [PubMed] [Google Scholar]
  48. Jenkinson M, Smith S. A global optimisation method for robust affine registration of brain images. Medical Image Analysis. 2001;5:143–156. doi: 10.1016/s1361-8415(01)00036-6. [DOI] [PubMed] [Google Scholar]
  49. Jenkinson M., Bannister P, Brady M, Smith S. Improved optimization for the robust and accurate linear registration and motion correction of brain images. NeuroImage. 2002;17:825–841. doi: 10.1016/s1053-8119(02)91132-8. [DOI] [PubMed] [Google Scholar]
  50. Jenkinson M. Fast, automated, N-dimensional phase-unwrapping algorithm. Magnetic Resonance in Medicine. 2003;49:193–197. doi: 10.1002/mrm.10354. [DOI] [PubMed] [Google Scholar]
  51. Jenkinson Mark, Beckmann CF, Behrens TEJ, Woolrich MW, Smith SM. FSL. NeuroImage. 2012;62:782–790. doi: 10.1016/j.neuroimage.2011.09.015. [DOI] [PubMed] [Google Scholar]
  52. Koch SC, Acton D, Goulding M. Spinal Circuits for Touch, Pain, and Itch. Annual Review of Physiology. 2018;80:189–217. doi: 10.1146/annurev-physiol-022516-034303. [DOI] [PMC free article] [PubMed] [Google Scholar]
  53. Kong Y, Jenkinson M, Andersson J, Tracey I, Brooks JCW. Assessment of physiological noise modelling methods for functional imaging of the spinal cord. NeuroImage. 2012;60:1538–1549. doi: 10.1016/j.neuroimage.2011.11.077. [DOI] [PubMed] [Google Scholar]
  54. Lakens D. Equivalence Tests: A Practical Primer for t Tests, Correlations, and Meta-Analyses. Social Psychological and Personality Science. 2017;8:355–362. doi: 10.1177/1948550617697177. [DOI] [PMC free article] [PubMed] [Google Scholar]
  55. Lau BK, Vaughan CW. Descending modulation of pain: the GABA disinhibition hypothesis of analgesia. Current Opinion in Neurobiology. 2014;29:159–164. doi: 10.1016/j.conb.2014.07.010. [DOI] [PubMed] [Google Scholar]
  56. Lautenbacher S, Roscher S, Strian F. Tonic pain evoked by pulsating heat: temporal summation mechanisms and perceptual qualities. Somatosensory & Motor Research. 1995;12:59–70. doi: 10.3109/08990229509063142. [DOI] [PubMed] [Google Scholar]
  57. Llorca-Torralba M, Borges G, Neto F, Mico JA, Berrocoso E. Noradrenergic Locus Coeruleus pathways in pain modulation. Neuroscience. 2016;338:93–113. doi: 10.1016/j.neuroscience.2016.05.057. [DOI] [PubMed] [Google Scholar]
  58. Lorenz J, Minoshima S, Casey KL. Keeping pain out of mind: the role of the dorsolateral prefrontal cortex in pain modulation. Brain. 2003;126:1079–1091. doi: 10.1093/brain/awg102. [DOI] [PubMed] [Google Scholar]
  59. McLaren DG, Ries ML, Xu G, Johnson SC. A generalized form of context-dependent psychophysiological interactions (gPPI): a comparison to standard approaches. NeuroImage. 2012;61:1277–1286. doi: 10.1016/j.neuroimage.2012.03.068. [DOI] [PMC free article] [PubMed] [Google Scholar]
  60. Melzack R, Wall PD. Pain mechanisms: a new theory. Science (New York, N.Y.) 1965;150:971–979. doi: 10.1126/science.150.3699.971. [DOI] [PubMed] [Google Scholar]
  61. Millan MJ. Descending control of pain. Progress in Neurobiology. 2002;66:355–474. doi: 10.1016/s0301-0082(02)00009-6. [DOI] [PubMed] [Google Scholar]
  62. Miron D, Duncan GH, Bushnell CM. Effects of attention on the intensity and unpleasantness of thermal pain. Pain. 1989;39:345–352. doi: 10.1016/0304-3959(89)90048-1. [DOI] [PubMed] [Google Scholar]
  63. Miskowiak K, Papadatou-Pastou M, Cowen PJ, Goodwin GM, Norbury R, Harmer CJ. Single dose antidepressant administration modulates the neural processing of self-referent personality trait words. NeuroImage. 2007;37:904–911. doi: 10.1016/j.neuroimage.2007.05.036. [DOI] [PubMed] [Google Scholar]
  64. Morgan MM, Whittier KL, Hegarty DM, Aicher SA. Periaqueductal gray neurons project to spinally projecting GABAergic neurons in the rostral ventromedial medulla. Pain. 2008;140:376–386. doi: 10.1016/j.pain.2008.09.009. [DOI] [PMC free article] [PubMed] [Google Scholar]
  65. Morris LS, Baek K, Tait R, Elliott R, Ersche KD, Flechais R, McGonigle J, Murphy A, Nestor LJ, Orban C, Passetti F, Paterson LM, Rabiner I, Reed L, Smith D, Suckling J, Taylor EM, Bullmore ET, Lingford-Hughes AR, Deakin B, Nutt DJ, Sahakian BJ, Robbins TW, Voon V, ICCAM Consortium Naltrexone ameliorates functional network abnormalities in alcohol-dependent individuals. Addiction Biology. 2018;23:425–436. doi: 10.1111/adb.12503. [DOI] [PMC free article] [PubMed] [Google Scholar]
  66. Mumford JA, Nichols TE. Power calculation for group fMRI studies accounting for arbitrary design and temporal autocorrelation. NeuroImage. 2008;39:261–268. doi: 10.1016/j.neuroimage.2007.07.061. [DOI] [PMC free article] [PubMed] [Google Scholar]
  67. Oliva V, Gregory R, Brooks JCW, Pickering AE. Central pain modulatory mechanisms of attentional analgesia are preserved in fibromyalgia. Pain. 2021a;163:125–136. doi: 10.1097/j.pain.0000000000002319. [DOI] [PMC free article] [PubMed] [Google Scholar]
  68. Oliva V, Gregory R, Davies WE, Harrison L, Moran R, Pickering AE, Brooks JCW. Parallel cortical-brainstem pathways to attentional analgesia. NeuroImage. 2021b;226:117548. doi: 10.1016/j.neuroimage.2020.117548. [DOI] [PMC free article] [PubMed] [Google Scholar]
  69. Ossipov MH, Dussor GO, Porreca F. Central modulation of pain. Journal of Clinical Investigation. 2010;120:3779–3787. doi: 10.1172/JCI43766. [DOI] [PMC free article] [PubMed] [Google Scholar]
  70. O’Reilly JX, Woolrich MW, Behrens TEJ, Smith SM, Johansen-Berg H. Tools of the trade: psychophysiological interactions and functional connectivity. Social Cognitive and Affective Neuroscience. 2012;7:604–609. doi: 10.1093/scan/nss055. [DOI] [PMC free article] [PubMed] [Google Scholar]
  71. Petrovic P, Kalso E, Petersson KM, Ingvar M. Placebo and opioid analgesia-- imaging a shared neuronal network. Science (New York, N.Y.) 2002;295:1737–1740. doi: 10.1126/science.1067176. [DOI] [PubMed] [Google Scholar]
  72. Peyron R, Laurent B, García-Larrea L. Functional imaging of brain responses to pain A review and meta-analysis (2000) Neurophysiologie Clinique = Clinical Neurophysiology. 2000;30:263–288. doi: 10.1016/s0987-7053(00)00227-6. [DOI] [PubMed] [Google Scholar]
  73. Potter MC, Levy EI. Recognition memory for a rapid sequence of pictures. Journal of Experimental Psychology. 1969;81:10–15. doi: 10.1037/h0027470. [DOI] [PubMed] [Google Scholar]
  74. Rolke R, Baron R, Maier C, Tölle TR, Treede D R, Beyer A, Binder A, Birbaumer N, Birklein F, Bötefür IC, Braune S, Flor H, Huge V, Klug R, Landwehrmeyer GB, Magerl W, Maihöfner C, Rolko C, Schaub C, Scherens A, Sprenger T, Valet M, Wasserka B. Quantitative sensory testing in the German Research Network on Neuropathic Pain (DFNS): standardized protocol and reference values. Pain. 2006;123:231–243. doi: 10.1016/j.pain.2006.01.041. [DOI] [PubMed] [Google Scholar]
  75. Roychowdhury SM, Fields HL. Endogenous opioids acting at a medullary mu-opioid receptor contribute to the behavioral antinociception produced by GABA antagonism in the midbrain periaqueductal gray. Neuroscience. 1996;74:863–872. doi: 10.1016/0306-4522(96)00180-7. [DOI] [PubMed] [Google Scholar]
  76. Sara SJ, Bouret S. Orienting and Reorienting: The Locus Coeruleus Mediates Cognition through Arousal. Neuron. 2012;76:130–141. doi: 10.1016/j.neuron.2012.09.011. [DOI] [PubMed] [Google Scholar]
  77. Smith SM, Nichols TE. Threshold-free cluster enhancement: Addressing problems of smoothing, threshold dependence and localisation in cluster inference. NeuroImage. 2009;44:83–98. doi: 10.1016/j.neuroimage.2008.03.061. [DOI] [PubMed] [Google Scholar]
  78. Sprenger C, Eippert F, Finsterbusch J, Bingel U, Rose M, Büchel C. Attention modulates spinal cord responses to pain. Current Biology. 2012;22:1019–1022. doi: 10.1016/j.cub.2012.04.006. [DOI] [PubMed] [Google Scholar]
  79. Sprenger C, Finsterbusch J, Büchel C. Spinal cord-midbrain functional connectivity is related to perceived pain intensity: a combined spino-cortical FMRI study. The Journal of Neuroscience. 2015;35:4248–4257. doi: 10.1523/JNEUROSCI.4897-14.2015. [DOI] [PMC free article] [PubMed] [Google Scholar]
  80. Tinnermann A, Geuter S, Sprenger C, Finsterbusch J, Büchel C. Interactions between brain and spinal cord mediate value effects in nocebo hyperalgesia. Science (New York, N.Y.) 2017;358:105–108. doi: 10.1126/science.aan1221. [DOI] [PubMed] [Google Scholar]
  81. Tinnermann A, Büchel C, Cohen-Adad J. Cortico-spinal imaging to study pain. NeuroImage. 2021;224:117439. doi: 10.1016/j.neuroimage.2020.117439. [DOI] [PubMed] [Google Scholar]
  82. Tracey I, Ploghaus A, Gati JS, Clare S, Smith S, Menon RS, Matthews PM. Imaging attentional modulation of pain in the periaqueductal gray in humans. The Journal of Neuroscience. 2002;22:2748–2752. doi: 10.1523/JNEUROSCI.22-07-02748.2002. [DOI] [PMC free article] [PubMed] [Google Scholar]
  83. Valet M, Sprenger T, Boecker H, Willoch F, Rummeny E, Conrad B, Erhard P, Tolle TR. Distraction modulates connectivity of the cingulo-frontal cortex and the midbrain during pain--an fMRI analysis. Pain. 2004;109:399–408. doi: 10.1016/j.pain.2004.02.033. [DOI] [PubMed] [Google Scholar]
  84. Verebey K, Volavka J, Mulé SJ, Resnick RB. Naltrexone: disposition, metabolism, and effects after acute and chronic dosing. Clinical Pharmacology and Therapeutics. 1976;20:315–328. doi: 10.1002/cpt1976203315. [DOI] [PubMed] [Google Scholar]
  85. Wager TD, Atlas LY. The neuroscience of placebo effects: connecting context, learning and health. Nature Reviews. Neuroscience. 2015;16:403–418. doi: 10.1038/nrn3976. [DOI] [PMC free article] [PubMed] [Google Scholar]
  86. Weerts EM, Kim YK, Wand GS, Dannals RF, Lee JS, Frost JJ, McCaul ME. Differences in delta- and mu-opioid receptor blockade measured by positron emission tomography in naltrexone-treated recently abstinent alcohol-dependent subjects. Neuropsychopharmacology. 2008;33:653–665. doi: 10.1038/sj.npp.1301440. [DOI] [PubMed] [Google Scholar]
  87. Woo CW, Krishnan A, Wager TD. Cluster-extent based thresholding in fMRI analyses: pitfalls and recommendations. NeuroImage. 2014;91:412–419. doi: 10.1016/j.neuroimage.2013.12.058. [DOI] [PMC free article] [PubMed] [Google Scholar]
  88. Woolrich MW, Ripley BD, Brady M, Smith SM. Temporal autocorrelation in univariate linear modeling of FMRI data. NeuroImage. 2001;14:1370–1386. doi: 10.1006/nimg.2001.0931. [DOI] [PubMed] [Google Scholar]
  89. Yang PF, Wang F, Chen LM. Differential fMRI Activation Patterns to Noxious Heat and Tactile Stimuli in the Primate Spinal Cord. The Journal of Neuroscience. 2015;35:10493–10502. doi: 10.1523/JNEUROSCI.0583-15.2015. [DOI] [PMC free article] [PubMed] [Google Scholar]
  90. Yoshimura M, Furue H. Mechanisms for the anti-nociceptive actions of the descending noradrenergic and serotonergic systems in the spinal cord. Journal of Pharmacological Sciences. 2006;101:107–117. doi: 10.1254/jphs.crj06008x. [DOI] [PubMed] [Google Scholar]
  91. Zhang Y, Zhao S, Rodriguez E, Takatoh J, Han BX, Zhou X, Wang F. Identifying local and descending inputs for primary sensory neurons. The Journal of Clinical Investigation. 2015;125:3782–3794. doi: 10.1172/JCI81156. [DOI] [PMC free article] [PubMed] [Google Scholar]

Editor's evaluation

Markus Ploner 1

This paper will be of great interest to researchers interested in cognitive modulations of sensory processing as well as in the brain mechanisms of pain. It shows that attentional modulations of pain are associated with changes in neural communication between cortical areas, brainstem, and spinal cord which are sensitive to opioidergic but not to noradrenergic modulations. These findings are conclusively supported by state-of-the-art simultaneous pharmacological fMRI of the brain and the spinal cord.

Decision letter

Editor: Markus Ploner1
Reviewed by: Markus Ploner2

Our editorial process produces two outputs: (i) public reviews designed to be posted alongside the preprint for the benefit of readers; (ii) feedback on the manuscript for the authors, including requests for revisions, shown below. We also include an acceptance summary that explains what the editors found interesting or important about the work.

Decision letter after peer review:

Thank you for submitting your article "Simultaneous Brain, Brainstem and Spinal Cord pharmacological-fMRI reveals endogenous opioid network interactions mediating attentional analgesia" for consideration by eLife. Your article has been reviewed by 3 peer reviewers, including Markus Ploner as Reviewing Editor and Reviewer #1, and the evaluation has been overseen by Christian Büchel as the Senior Editor.

The reviewers have discussed their reviews with one another, and the Reviewing Editor has drafted this to help you prepare a revised submission.

Essential revisions:

(1) Negative findings in the noradrenergic condition play an important role. You might therefore consider Bayesian statistics which allow for distinguishing between evidence of absence and absence of evidence.

(2) A crucial part of the reasoning is the correspondence between behavioral and neuroimaging effects. So far, the correspondence is mostly based on similar patterns of modulations on the group level. Extending this correspondence to the individual level might provide further support. For instance, the authors might relate the individual behavioral effects to the individual neural effects. This would substantially strengthen the relationship between behavioral and neural effects.

(3) Please discuss the absence of a main effect of task difficulty with reference to previous studies on attentional effects on pain.

(4) Please report and discuss effect sizes at least for the behavioural results. Furthermore, please provide a statistical test for the pharmacological modulation of attentional analgesia, i.e. a task temperature drug interaction.

(5) Please test the parameter estimates extracted from the main effect of temperature for a difference between the attentional conditions in the high-temperature condition.

(6) Please modify or justtfy the use of 'functional localizers' for the connectivity analyses which are built based on the 'Placebo' condition and then used for evaluating connectivity differences between 'Placebo' and each of the drugs.

(7) Please explain (i) how the omission of slice-time correction impact on the obtained results (considering the TR of 3s), (ii) why time-courses were only extracted from one seed voxel (considering how noisy single-voxel time-series are, especially in areas such as the brainstem), (iii) and how the choice of using different contrast for seed-voxel identification in different regions impact / bias the connectivity results.

(8) Please explain and modify the correction for multiple comparisons. The pooled analysis has been used to come up with a set of regions in which the other analyses were carried out. It is not clear whether you performed corrections within each of these masks separately or whether you performed correction across one large mask consisting of all these regions. If you chose the former approach, a correction for the number of regions used would be appropriate.

(9) Please consider using probabilistic masks for your target structures of interest (e.g. PAG or spinal gray matter and spinal segmental level masks), the use of which would clearly bolster confidence in the spatial assignment of the reported results. Please provide the masks as (supplementary) figures. Please clarify already in the main text that the spinal cord analysis was based on the left C5/C6 anatomical mask but not on the whole spinal cord analysis.

(10) Please provide details on the pharmacological challenge. (i) What is the expected onset and duration of the drugs they used and how does this relate to the start and duration of their paradigm? (ii) What kind of side effects can be expected from these drugs and were those assessed in a structured way in their participants and compared across drug-conditions? (iii) Were participants asked about their beliefs regarding which drug they had received on which visit (as this is crucial to ascertain the double-blind nature of the study)? (iv) How does their dosing compare to previous studies using these drugs (and are there data on receptor occupancy)?

(11) Please provide as supplementary data (i) group-average tSNR maps or group-average tSNR values per region of interest (so one can judge the data quality obtainable across such a large imaging volume), (ii) transverse cross-sections of a group-average spinal cord mean EPI image in template space (so one can judge the precision of the employed registration procedures), and (iii) unmasked brainstem and spinal cord activation and connectivity results (so one can judge the success of their physiological noise correction procedure).

(12) Please explain details of the study design. (i) fMRI-based power analysis: the power analysis is based on PAG data and a one-sample t-test, which is different from crucial parts of this manuscript (e.g. spinal data having different signal characteristics and different statistical tests being used, such as ANOVAs). (ii) Reasons for choosing this particular heat stimulation model (30s plateau with random spikes), as it is a rather unusual approach (and also give some more details on the calibration procedure, as it is hard to follow right now) (iii) Did imaging sessions occur at the same time of day for each participant? (iv) Do you indeed only have 4 trials per condition?

(13) Please revise and tone down the interpretation of the results. (i) Neither do the data allow to make the claim that the blockade of RVM-DH connectivity by Naltrexone is indeed the reason for the reduced analgesic effect in that condition nor do their data allow to make a direct link between deep dorsal horn interneuron pools and the observed BOLD effects. (ii) Please cite the relevant work by Tinnermann and colleagues, who did not only report brainstem-spinal coupling during a cognitive manipulation (Tinnermann et al., 2017, Science), but have also written a review on the difficulties of cortico-spinal imaging (Tinnermann et al., 2021, Neuroimage). (iii) Considering that the authors demonstrate the involvement of a system (ACC, PAG, RVM) in attentional analgesia that has also been implicated in placebo analgesia, it might be worth to comment on shared/distinct underlying mechanisms across such forms of pain modulation (see also Buhle et al., 2012, Psychological Science). (iv) Please expand on your statement in the Discussion that optimized cortico-spinal fMRI protocols with tailored acquisition parameters (Finsterbusch et al., 2013, Neuroimage; Islam et al., 2019, Magnetic Resonance in Medicine) could create confounds for functional connectivity analyses?

(14) It was difficult to find detailed quantitative descriptions of the results shown in Figure 1C and 1D. For example, the authors conducted some post-hoc analyses using BOLD estimates extracted from the clusters identified from Figure 1B, and thus they should be able to provide statistical values to make comments like "In the placebo session, the pattern of BOLD signal change across conditions was strikingly similar to the pain scores", or "… showed an increased level of activity in the hard | high condition". By not providing quantitative results, these descriptions become meaningless. The authors even used the word "strikingly" without any statistical evidence, weakening the overall credibility of their findings.

(15) Some detailed information about the fMRI analyses, such as thresholding methods, were given in the Method section only (e.g., the whole-brain analysis in Figure 2B). But given that this journal has the Results section earlier than the Methods section, it would be better to provide some basic information about thresholding in the Results section as well.

(16) The authors used TFCE methods for the spinal cord and brainstem analyses but used a different thresholding method for the whole-brain analysis. The reason should be provided. It seems arbitrary and post-hoc in the current version of the manuscript.

(17) They used cluster-level thresholding for the whole-brain analysis. With the cluster extent thresholding, "researchers can only infer that there is signal somewhere within a significant cluster and cannot make inferences about the statistical significance of specific locations within the cluster" (a quote from the NeuroImage paper titled "Cluster-extent based thresholding in fMRI analyses: Pitfalls and recommendations"). Their description of the whole brain results does not seem to recognize this pitfall of the cluster extent thresholding. They should note the caution about the interpretation of their whole-brain results.

(18) Naltrexone is also known to reverse the placebo effects. I wonder if they tested this effect as well. It is unclear in which context they provided the placebo pill to participants.

Reviewer #1 (Recommendations for the authors):

– The authors should avoid equalling the absence of a statistically significant difference with the similarity of brain responses, e.g. when reporting the spinal BOLD responses under different conditions.

– Harmonizing the layout of Figure 1 and Supplementary Figure 1 would facilitate comparisons of the figures.

Reviewer #2 (Recommendations for the authors):

Size and robustness of effects. I would strongly encourage the authors to report effect sizes at least for their behavioural results. While the reported analgesic effect is highly significant, it seems to be of rather small size (~3-point difference on a 0-100 scale for the placebo condition) and so the behavioural relevance is limited – such a small difference might also place limits on the detectability of underlying neurobiological changes. Furthermore, I was surprised by the lack of a statistical test for the pharmacological modulation of attentional analgesia, i.e. a task temperature drug interaction: if the authors want to make the claim that Naltrexone disrupted attentional analgesia (i.e. that it relies on an opioidergic component), it is not enough to show a significant effect in the placebo condition and a non-significant effect in the Naltrexone condition – these two effects would need to be statistically compared. I am not at all trying to suggest that any effect not surviving p <.05 is not of interest, but for the sake of scientific rigour the appropriate tests should be carried out (I am even more inclined to make this point because for the imaging data, the authors do actually carry out such comparisons).

Analysis choices for fMRI data. While I was in general impressed by the rigor of the fMRI data analysis approach (e.g. blinding of researcher, use of permutation-based statistics), there are several questions I have with regard to the appropriateness of the chosen analysis approaches for the fMRI data.

1) Why do the authors not test the parameter estimates extracted from the main effect of temperature for a difference between the attentional conditions in the high-temperature condition? This is a test they carry out in the behavioural data (Figure 1a), but not in the imaging data (Figure 1c), although it would be necessary to establish a reduction of spinal cord BOLD responses under distraction. Currently, they only report this descriptively, without providing statistical support.

2) I am particularly concerned about the use of 'functional localizers' for the connectivity analyses: these are built based on the 'Placebo' condition and then used for evaluating connectivity differences between 'Placebo' and each of the drugs – does this procedure not automatically create a bias toward finding stronger effects in the 'Placebo' condition compared to the other condition, because 'testing' is not independent of 'selection'? Interestingly, all reported results show exactly this pattern, i.e. stronger responses in the 'Placebo' condition.

3) With respect to their (very interesting) connectivity results, I wondered about three further things: i) how does the omission of slice-time correction impact on the obtained results (considering the TR of 3s), ii) why were time-courses only extracted from one seed voxel (considering how noisy single-voxel time-series are, especially in areas such as the brainstem), and iii) how does the choice of using different contrast for seed-voxel identification in different regions impact / bias the connectivity results?

4) How did the authors address the multiple comparison problem? I understood that they used the pooled analysis to come up with a set of regions in which to carry out the other analyses, but I was not able to determine whether they performed corrections within each of these masks separately or whether they performed correction across one large mask consisting of all these regions? If they chose the former approach, a correction for the number of regions used would be appropriate.

Identification of small target regions in brainstem and spinal cord. I apologize in advance if I have missed the relevant information, but I did not see the authors make use of available probabilistic masks for their target structures of interest (e.g. PAG or spinal gray matter and spinal segmental level masks), the use of which would clearly bolster confidence in the spatial assignment of the reported results. Otherwise, how would the authors confidently make the assignment of BOLD responses to their small target regions? This is especially relevant due to some acquisition and analysis parameters not being optimal for these small-scale structures (e.g. overall voxel size of ~1.8x1.8x5.6mm and 6mm smoothing kernel in the brainstem).

Pharmacological challenge. There are several details that are needed in order to judge the success of their double-blind pharmacological challenge design but are currently not mentioned.

1) What is the expected onset and duration of the drugs they used and how does this relate to the start and duration of their paradigm?

2) What kind of side effects can be expected from these drugs and were those assessed in a structured way in their participants and compared across drug-conditions?

3) Were participants asked about their beliefs regarding which drug they had received on which visit (as this is crucial to ascertain the double-blind nature of the study)?

4) How does their dosing compare to previous studies using these drugs (and are there data on receptor occupancy)?

Quality of fMRI data. Considering the immense difficulties in obtaining high-quality fMRI data from the entire CNS simultaneously, it would be reassuring to have some more data at hand to judge the quality of the acquired data-set. Therefore, could the authors provide as supplementary data (1) group-average tSNR maps or group-average tSNR values per region of interest (so one can judge the data quality obtainable across such a large imaging volume), (2) transverse cross-sections of a group-average spinal cord mean EPI image in template space (so one can judge the precision of the employed registration procedures), and (3) unmasked brainstem and spinal cord activation and connectivity results (so one can judge the success of their physiological noise correction procedure)?

Study design. A few points regarding the design of the study could be expanded upon to help the reader understand their choices.

(1) I applaud the authors for carrying out an fMRI-based power analysis, but can currently not follow their rationale: the power analysis is based on PAG data and a one-sample t-test, which is different from crucial parts of this manuscript (e.g. spinal data having different signal characteristics and different statistical tests being used, such as ANOVAs).

(2) Could the authors explain why they chose this particular heat stimulation model (30s plateau with random spikes), as it is a rather unusual approach (and also give some more details on the calibration procedure, as it is hard to follow right now)?

(3) Did imaging sessions occur at the same time of day for each participant?

(4) Do they indeed only have 4 trials per condition or did I misunderstand this part?

Interpretation of results and relation to other work.

(1) While their discussion is in general a pleasure to read and nicely links their own results to a large body of animal work, I think in several instances it might be worth to tone down the interpretation of their results. For example, neither do their data allow to make the claim that the blockade of RVM-DH connectivity by Naltrexone is indeed the reason for the reduced analgesic effect in that condition nor do their data allow to make a direct link between deep dorsal horn interneuron pools and the observed BOLD effects.

(2) I would suggest to cite the relevant work by Tinnermann and colleagues, who did not only report brainstem-spinal coupling during a cognitive manipulation (Tinnermann et al., 2017, Science), but have also written a review on the difficulties of cortico-spinal imaging (Tinnermann et al., 2021, Neuroimage). (2) Considering that the authors demonstrate the involvement of a system (ACC, PAG, RVM) in attentional analgesia that has also been implicated in placebo analgesia, it might be worth to comment on shared/distinct underlying mechanisms across such forms of pain modulation (see also Buhle et al., 2012, Psychological Science).

(3) Could the authors expand on their statement in the Discussion that optimized cortico-spinal fMRI protocols with tailored acquisition parameters (Finsterbusch et al., 2013, Neuroimage; Islam et al., 2019, Magnetic Resonance in Medicine) could create confounds for functional connectivity analyses?

P4: Is it appropriate to speak of 'low pain' regarding the low innocuous temperature employed?

P4: Stating hypotheses would be welcome and helpful for the reader (i.e. what is the direction of effects the authors were expecting for naltrexone and reboxetine and what previous animal/human studies would they base this on).

P10: Considering that the authors have used DCM in their earlier work on very similar brain and brainstem data, what is the reason for not using this effective connectivity approach here?

P10: Why did they choose the right LC and RVM and not opt for a bilateral region – is there any evidence from animal studies for contralateral responses that motivates this choice?

P11: In many imaging studies on descending control, the ACC results are located next to the genu of the corpus callosum – but as the ACC connectivity result seems to be located much more posteriorly here, could the authors comment on this in terms of function of these regions?

P21: If the calibration of the RSVP tasked was repeated at each study-visit, why was it carried out during the initial screening visit?

P22: It might make sense to mention here that all behavioural data analyses were repeated-measures ANOVAs and paired t-tests.

P22: The FWHM of the smoothing kernel for the spinal cord data is almost identical to the in-plane voxel size – could the authors explain this choice (as it is somewhat unusual)?

P23: Were the EPI data directly registered to a target image in template space or was this done via an intermediate step using the high-resolution MPRAGE data?

P25: I really liked their 'Pooled analysis' approach (as it should be unbiased and sensitive), but was not able to follow their 'Pooled analysis' strategy for spinal cord, brainstem and brain, as the authors report different strategies for the different regions. Sometimes they report using two different t-tests (mixed-effects and permutation-based) and also seem to use different thresholding strategies (TFCE vs 'classical' cluster-based). Could they re-phrase this part and use one consistent strategy throughout?

P32: Why do the authors report using a mixed ANOVA, when their experimental paradigm is a within-subject repeated-measures design and does not have a 'group' factor?

Reviewer #3 (Recommendations for the authors):

I will point out some issues in more detail below:

1) It was difficult to find detailed quantitative descriptions of the results shown in Figure 1C and 1D. For example, the authors conducted some post-hoc analyses using BOLD estimates extracted from the clusters identified from Figure 1B, and thus they should be able to provide statistical values to make comments like "In the placebo session, the pattern of BOLD signal change across conditions was strikingly similar to the pain scores", or "… showed an increased level of activity in the hard | high condition". By not providing quantitative results, these descriptions become meaningless. The authors even used the word "strikingly" without any statistical evidence, weakening the overall credibility of their findings.

2) Some detailed information about the fMRI analyses, such as thresholding methods, were given in the Method section only (e.g., the whole-brain analysis in Figure 2B). But given that this journal has the Results section earlier than the Methods section, it would be better to provide some basic information about thresholding in the Results section as well.

3) The spinal cord analysis was based on the left C5/C6 anatomical mask, but it was unclear until I see the figure caption or Methods. Only reading the main texts provides the impression that the authors conducted the whole spinal cord analysis.

4) They also used the brainstem mask, which should be provided as a figure.

5) The authors used TFCE methods for the spinal cord and brainstem analyses but used a different thresholding method for the whole-brain analysis. The reason should be provided. It seems arbitrary and post-hoc in the current version of the manuscript.

6) They used cluster-level thresholding for the whole-brain analysis. With the cluster extent thresholding, "researchers can only infer that there is signal somewhere within a significant cluster and cannot make inferences about the statistical significance of specific locations within the cluster" (a quote from the NeuroImage paper titled "Cluster-extent based thresholding in fMRI analyses: Pitfalls and recommendations"). Their description of the whole brain results does not seem to recognize this pitfall of the cluster extent thresholding. They should note the caution about the interpretation of their whole-brain results.

7) Naltrexone is also known to reverse the placebo effects. I wonder if they tested this effect as well. It is unclear in which context they provided the placebo pill to participants.

[Editors’ note: further revisions were suggested prior to acceptance, as described below.]

Thank you for resubmitting your work entitled "Simultaneous Brain, Brainstem and Spinal Cord pharmacological-fMRI reveals endogenous opioid network interactions mediating attentional analgesia" for further consideration by eLife. Your revised article has been evaluated by Timothy Behrens (Senior Editor) and a Reviewing Editor.

The manuscript has been improved but there are some remaining issues that need to be addressed, as outlined below (see recommendations for the authors by reviewer #2).

Reviewer #1 (Recommendations for the authors):

My comments and concerns have been adequately addressed.

Reviewer #2 (Recommendations for the authors):

The authors have convincingly addressed most of the points I raised, but there are a few outstanding issues that have not been resolved.

Drug-specific effects on attentional analgesia. The authors aim to show that their pharmacological interventions modulate attentional analgesia and the adequate way to do so would be via a 3-way interaction (i.e. drug task temperature) in the chosen ANOVA approach. However, the behavioural data do not provide evidence for such an effect (i.e. the newly-added ANOVA table). I appreciate the novel inclusion of equivalence-testing results (though it is impossible for me to follow the details of this analysis, since it is not described in the methods section), but their main ANOVA approach simply does not show a significant effect of drug on attentional analgesia and this needs to be made clear prominently in the manuscript – at the moment, this lack of an effect is not even mentioned in the main text.

Attentional effects in spinal cord responses. I am at a loss to follow the authors' claim in the abstract that "Noxious thermal forearm stimulation generated somatotopic-activation of dorsal horn (DH) whose activity correlated with pain report and mirrored attentional pain modulation.", as well as their lines 169-177, since the figure they added to their response letter shows exactly the opposite: there was no difference between HH and EH in the nociceptive cluster in the dorsal horn (I would actually find it very instructive for the reader if this figure were added to the supplement next to the same plot for the pain ratings; currently Figure 2 Supplement 2). Similarly, in lines 182-185 the authors make statements that are not based on any statistical inference.

Assessment of group differences in connectivity. I appreciate the authors' response on this point, but it has unfortunately not assuaged my concerns at all. Since the authors use a 'pooled' analysis for the standard GLM analyses, why do they not use this 'pooled' approach for the PPI as well? This would mitigate the risk I have mentioned before, namely that the current approach might introduce a significant amount of bias into their results (e.g. partial 'double-dipping', see Kriegeskorte et al., 2009, Nature Neuroscience).

Spinal cord: choice of mask. I am still not able to follow the authors' rationale as to why they use rather unspecific vertebral level & hemi-cord masks instead of the available probabilistic masks, which represent the current gold-standard: i.e. why do they not limit their search to the segment of interest (C6) and the grey matter therein? I would ask the authors to indicate within the manuscript why they are using a mask that does not allow spatial assignment of BOLD responses with respect to segmental level and grey matter.

Spinal cord: assessment of denoising success. It is unfortunate that the authors are not sharing the asked-for unmasked spinal cord data (but still use a cord mask), as such data would be most helpful for assessing the remaining level of physiological noise as well as the local nature of spinal cord BOLD responses (e.g. draining vein contributions). I am not able to follow the authors' argument that "due to masking steps in the registration pipeline, it was not possible to include tissues outside the spinal cord" – showing a few millimetres of data around the cord / CSF should be possible.

Reviewer #3 (Recommendations for the authors):

The authors have addressed my comments and requests satisfactorily.

eLife. 2022 Jan 26;11:e71877. doi: 10.7554/eLife.71877.sa2

Author response


Essential revisions:

(1) Negative findings in the noradrenergic condition play an important role. You might therefore consider Bayesian statistics which allow for distinguishing between evidence of absence and absence of evidence.

The reviewer is correct, with the Noradrenergic manipulation we still see an attentional analgesic effect whose magnitude appears similar to placebo. However, we do find that the noradrenaline reuptake inhibitor has produced a significant reduction in the pain scores in the high temperature condition indicating that the drug has had an effect in our experiment (providing evidence of efficacy at this dose). We thank the reviewers for the suggestion of using Bayesian statistics to clarify and strengthen our findings. We calculated the difference in pain ratings between the Easy|High and Hard|High conditions and performed a Bayesian paired t test for the comparison of Placebo vs Reboxetine, to obtain a likelihood ratio of 6.8:1 (in favour of the null versus alternative hypothesis). According to commonly used thresholds, this is considered to indicate moderate evidence in support of the null hypothesis. Therefore, we provide evidence in support of no difference between the Placebo and Reboxetine conditions and have added this statement to the discussion (P19 para2). See also the new figure showing the magnitude of the attentional analgesic effect (Figure 2 Supplementary Figure 2) and the response to point 4 below.

Note the contrast between the reboxetine and naltrexone manipulations is biologically challenging to interpret (the drugs have two different mechanisms of action and are likely acting on distinct neural substrates). Accordingly, this comparison was not part of our original hypothesis and so we have not included this analysis (which does not show any statistically significant difference) to avoid confusing the reader.

(2) A crucial part of the reasoning is the correspondence between behavioral and neuroimaging effects. So far, the correspondence is mostly based on similar patterns of modulations on the group level. Extending this correspondence to the individual level might provide further support. For instance, the authors might relate the individual behavioral effects to the individual neural effects. This would substantially strengthen the relationship between behavioral and neural effects.

We thank the reviewers for this important suggestion, and we have examined the correlation between pain report and the activity in the Spinalnoci cluster. This shows that there is a strong correlation between pain rating (for the placebo condition) and the extracted BOLD parameter estimate. This substantially strengthens the relationship between behaviour and neural effects at an individual level. We have added the new analysis to Figure 2C.

(3) Please discuss the absence of a main effect of task difficulty with reference to previous studies on attentional effects on pain.

We find a main effect of task in our behavioural results which is reported (p6 para 1). We also find a main effect of task in our brainstem and cerebral imaging findings in terms of regional activations in the visual processing and attention networks, deactivation in the default mode network and brainstem activations in the PAG, LC and RVM (p11 para1 and Figure 3). As the reviewer notes, these findings are in line with our previous studies (Brooks et al., 2017; Oliva et al., 2021b) which have previously used the 2x2 experimental design and identified a main effect of task. Other fMRI studies have shown equivalent attention task related changes in pain percept and regional brain activity (e.g. (Bantick et al., 2002; Peyron et al., 1999; Valet et al., 2004)). We present novel data showing that task modulates the effective connectivity in the network (RVM-LC and PAG-ACC p12 para 2) and that this connectivity between PAG and ACC is sensitive to pharmacological intervention. We do not find any main effect of task at a spinal level but crucially were able to demonstrate a task temperature interaction, which we postulate is related to the mediation of the attentional analgesic effect and reflects the influence of inputs from the brainstem and we note there is appropriate connectivity between the RVM and the spinal cord in the task temp contrast.

(4) Please report and discuss effect sizes at least for the behavioural results.

The attentional analgesia effect is typically of the order of 6-10% (Peyron et al., 1999; Bantick 2002; Valet 2004; Tracey 2002). We have seen similar effect for example in the placebo condition with a 7.3% reduction in pain scores corresponding to an effect size (Cohen’s Dz) of 0.55 which is moderate. These analgesic effect sizes are similar to those we found in our previous studies involving three independent cohorts employing the same RSVP task and thermal stimulus paradigm (effect size of 0.58, n=57 healthy subjects, data from Oliva et al., 2021 Neuroimage). We have undertaken additional analysis and added a plot of the attentional analgesia effects (Figure 2 Supplementary Figure 3) and to the Discussion.

The placebo and reboxetine conditions show a significant reduction in pain scores in the high hard condition ie attentional analgesia (P=0.0016 and 0.0126 respectively vs 0.5119 for naltrexone, one sample t-tests). The corresponding effect sizes are -0.55 for Placebo, -0.42 for Reboxetine vs -0.11 in the presence of Naltrexone (Cohen’s Dz). Using equivalence testing we can provide confidence limits on the magnitude of attentional analgesia seen in the presence of naltrexone using the TOST approach (Lakens, 2017). Using a threshold of a 6% change in pain scores as being a lower boundary for the magnitude of the reported attentional analgesia effects (-2.3 points on the VAS scale) which is less than that seen in the placebo or reboxetine conditions (and in our previous studies e.g. Oliva et al., 2021 Neuroimage) then we can state that the effect size seen in the presence of naltrexone lies below this threshold (P=0.049). (Now added to the Results section P6 Para2)

Furthermore, please provide a statistical test for the pharmacological modulation of attentional analgesia, i.e. a task temperature drug interaction.

We have provided statistical tests of attentional analgesia which are the individual 2 way ANOVAs which show an interaction between task and temperature that is not seen in the presence of naltrexone (P6, Figure 2). The first level 3 way ANOVA was significant for a main effect of temperature and task and also for the drug temp interaction and the temp task interaction (see Author response table 1) which we explored further with the 2way ANOVAs. This analysis did not show a significant 3 way drug temp task interaction, potentially due to the influence of additional factors influencing the behavioural response to the low temperature condition or task performance. We have now reported the full analysis output in Figure 2 Supplementary Figure 2 (see Author response table 1).

Author response table 1.

ANOVA table F (DFn, DFd) P value
Drug F (2, 76) = 2.272 P=0.11
Temperature F (1, 38) = 221.6 P<0.0001
Task F (1, 38) = 4.869 P=0.034
Drug x Temperature F (2, 76) = 3.243 P=0.045
Drug x Task F (2, 76) = 1.210 P=0.30
Temperature x Task F (1, 38) = 10.50 P=0.0025
Drug x Temperature x Task F (2, 76) = 1.579 P=0.21

(5) Please test the parameter estimates extracted from the main effect of temperature for a difference between the attentional conditions in the high-temperature condition.

We tested the parameter estimates for the Spinalnoci cluster for differences between the Hard|High and Easy|High conditions. There were no significant differences between Parameter Estimates across the drug conditions. Also see pain scores vs Spinalnoci BOLD shown in Figure 2C and comments in response to point 2 above.

Author response image 1.

Author response image 1.

(6) Please modify or justtfy the use of 'functional localizers' for the connectivity analyses which are built based on the 'Placebo' condition and then used for evaluating connectivity differences between 'Placebo' and each of the drugs.

The rationale behind the connectivity analysis was as follows: we wished to test for differences in connectivity between CNS areas found active in the “simple” 2x2 ANOVA of “pooled” group data (see Page 27 Para 1). We reasoned that by restricting our analyses to the subset of active regions, we would reduce complexity and increase interpretability of connectivity findings. To this end we also sought to minimize the number of SEED-TARGET connections examined, by first seeking evidence for modulation of these links in the placebo condition. Subsequently we tested whether connections that are modulated by attentional analgesia are subject to specific neurotransmitter modulation. It is worth noting that the analysis of the placebo condition largely replicated the findings from an independent data set as reported in Oliva et al., 2021 Neuroimage.

We have altered the description of the process, and removed the term “functional localizers” as this does not adequately capture the purpose of this analysis: Methods section (page 27 para 2):

“This analysis strategy, which examined connectivity between CNS regions identified in the pooled data, was initially limited to examination of the placebo data and largely replicated our earlier findings (Oliva et al., 2021 Neuroimage). By identifying those connections that are normally active during attentional analgesia, we could then test whether they are subject to specific neurotransmitter modulation”

(7) Please explain (i) how the omission of slice-time correction impact on the obtained results (considering the TR of 3s),

The long block length (30sec) and TR (3sec) used makes the use of slice-timing correction (STC) unnecessary for modelling the basic 2x2 ANOVA results, however, it is possible that STC would have altered the results from our generalized psychophysiological interaction (gPPI) analyses. Whilst the use of physiological noise modelling is recommended when performing PPI analyses (Barton et al., 2015), there is no information on whether similar benefits may be had with STC (Friston et al., 1997; Gitelman et al., 2003; McLaren et al., 2012; O'Reilly et al., 2012; Parker and Razlighi, 2019). Indeed, FSL’s implementation of physiological noise modelling requires that STC is not performed, as this would break the relationship between the slice-specific physiological regressors (capturing the time of acquisition relative to the cardiac/respiratory cycle) and the data as acquired during scanning. We also note that the complex interaction between motion correction parameters and STC is not well understood (Churchill et al., 2012; Sladky et al., 2011). Therefore, we chose not to use STC in our analyses favouring physiological noise correction, and this appears to be consistent with other reports using PPI analysis (e.g. (Harrison et al., 2017; Ploner et al., 2010; Tinnermann et al., 2017)) and we note that similar conclusions were reached in a recent review of methodology for cortico-spinal imaging (Tinnermann et al., 2021).

(ii) why time-courses were only extracted from one seed voxel (considering how noisy single-voxel time-series are, especially in areas such as the brainstem),

Time-courses were extracted from the voxel that showed the highest Z-score for the contrast of interest. By identifying the voxel that most closely matched the applied model we have chosen an approach that eschews potential SNR improvements that may come from averaging over a larger mask or taking a spherical region of interest, and have thus favoured specificity of response as per our earlier study (Oliva et al., 2021). This approach also allows for anatomical heterogeneity between individuals. Lastly, the reviewer notes that single voxel timeseries are noisy – but we would argue that this “noise” is exactly what the gPPI is attempting to assess, and were it to be truly random in nature, we would be highly unlikely to find consistent patterns of connectivity within our target regions (determined using correction for multiple comparisons).

(iii) and how the choice of using different contrast for seed-voxel identification in different regions impact / bias the connectivity results.

As stated above (point 6), the rationale here was to minimize the number of comparisons performed, to increase the interpretability of findings. To this end, we sought to limit our examination to only those connections found present during attentional analgesia in the placebo condition. By restricting our analyses to only those connections and contrasts, we believe we minimize bias and help reduce the number of comparisons performed. The choice of contrasts for brain and brainstem areas was also consistent with our previous paper (Oliva et al., 2021 Neuroimage), with the purpose of testing whether naltrexone and/or reboxetine altered this network. The rationale for choosing a main effect of attention contrast for ACC, PAG and LC, versus a main effect of temperature contrast in the RVM was to attempt to detect the effect of attention on pain: whether task-responding regions are modulating lower-level temperature-responding regions as would be expected for descending control. In the spinal cord, we used both significant contrasts.

The following was added to the Methods (P29, Para 2):

“Slice timing correction was not used for this connectivity analysis, as (1) there is no clear recommendation for its use (Harrison et al., 2017; McLaren et al., 2012; O'Reilly et al., 2012), (2) it was omitted in a similar cortico-spinal fMRI study (Tinnermann et al., 2017) and (3) to be consistent with our previous studies (Oliva et al., 2021b).”

(8) Please explain and modify the correction for multiple comparisons. The pooled analysis has been used to come up with a set of regions in which the other analyses were carried out. It is not clear whether you performed corrections within each of these masks separately or whether you performed correction across one large mask consisting of all these regions. If you chose the former approach, a correction for the number of regions used would be appropriate.

We previously identified a network of brain regions (ACC, PAG, LC, RVM) involved in attentional analgesia, which included brainstem structures originally identified using probabilistic masks (Brooks et al., 2017). Subsequently we showed that with a larger sample (n=57) it was possible to identify the same pattern of activity within a whole brainstem mask (Oliva et al., 2021b), confirming the original results. However, the brainstem and spinal cord remain difficult to image, suffering from low intrinsic signal to noise, signal drop-out and increased influence from physiological noise (Brooks et al., 2013; Eippert et al., 2017; Tinnermann et al., 2021). Were there no evidence from human brain imaging or experimental animal studies for the involvement of these structures in pain processing, we would agree that a suitably cautious and conservative approach to statistical inference would be necessary. However, not only are these structures known to be involved in pain processing, as has been adequately demonstrated by numerous papers using masked analyses (e.g. Baliki et al., 2010; Geuter et al., 2017; Ploner et al., 2010), but they were specified a priori on the basis of our earlier studies (Brooks et al., 2017; Oliva et al., 2021b) and the existing literature.

In this study, rather than use masks for specific brainstem nuclei we determined activity using a probabilistic whole brainstem mask (see Results -> Brainstem and whole brain, page 10, and Methods -> Pooled analysis – brainstem page 28, para 2). Cerebral activation patterns were determined using whole brain analysis. Both analyses were performed with correction for multiple comparisons. Subsequently, activity within specific regions was extracted using our previously published brainstem masks (LC, PAG, RVM) and the Harvard-Oxford probabilistic cortical atlas (ACC). Whilst the spinal activity was reported using a probabilistic left C5-C6 mask (PAM50 template), it should be noted that the same pattern of activity is found with a whole cord analysis (corrected for multiple comparisons), that matches the expected segmental input to the cord given the stimulation site (see Point 11 below and Figure 2 supplementary figure 4). We hope these data give the reviewers (and the reader) confidence that the masking procedure has not biased results for this region, and that a correction for the number of pre-specified masks is unwarranted.

The planned connectivity analysis between areas identified as active in the pooled data (unmasked or masked), was performed within the a priori specified masks, but rather than present uncorrected statistics (as is frequently done for PPI analyses) we have used permutation testing and TFCE correction (P<0.05) to provide confidence that the connectivity changes between each seed and target region are unlikely to have happened by chance.

(9) Please consider using probabilistic masks for your target structures of interest (e.g. PAG or spinal gray matter and spinal segmental level masks), the use of which would clearly bolster confidence in the spatial assignment of the reported results. Please provide the masks as (supplementary) figures. Please clarify already in the main text that the spinal cord analysis was based on the left C5/C6 anatomical mask but not on the whole spinal cord analysis.

We used the probabilistic brainstem masks developed in our lab, and previously reported (Brooks et al., 2017). These masks were estimated from an independent sample and were based on T2-weighted anatomical imaging and so will not introduce bias into the estimation of activation-changes. The brainstem masks have been previously illustrated in (Brooks et al., 2017; Oliva et al., 2021b), are now outlined in Figure 3 Supplementary Figure 1 and we have clearly signposted their location to the reader (P10 para 1), including making them available through the OSF (link): https://osf.io/xqvb6/.

Similarly, spinal cord data were estimated within masks for the vertebral locations that were determined on the basis of probabilistic analysis of imaging data in the Spinal Cord Toolbox “PAM50” template. We added clarification of the mask used for spinal cord analysis in the main text of the manuscript (Results section, p 7):

“assessed using permutation testing with a left C5/C6 mask, P<0.05, TFCE corrected”.

(10) Please provide details on the pharmacological challenge. (i) What is the expected onset and duration of the drugs they used and how does this relate to the start and duration of their paradigm?

For our paradigm participants had an oral dose of active drug or placebo. One hour later they had a calibration RSVP test and determination of their heat pain threshold (using the previously determined speeds and temperatures) before the fMRI session which lasted from 90 to 150 minutes after dosing across the expected maximum concentration of reboxetine and naltrexone. The rationale for the doses and protocols are explained below.

Naltrexone – dose (50mg) as per the British National Formulary (BNF) – used to prevent relapse in formerly opioid or alcohol dependency. Naltrexone is well absorbed with high oral bioavailability and its levels in the serum peak after 1 hour with a half-life of between 8 and 12 hours (Verebey et al., 1976).

Reboxetine is used for the treatment of depression and has a proven safety record. The study used a single oral dose which is the lowest recommended by the BNF (4mg). It has high oral bioavailability (~95%), serum levels peak at around 2 hours after oral administration and it has a half-life of 12 hours (Fleishaker, 2000).

(ii) What kind of side effects can be expected from these drugs and were those assessed in a structured way in their participants and compared across drug-conditions?

The common and significant side effects lists were provided from the BNF to the participants in the study information sheet. Based on previous studies in volunteers with both active drugs we did not expect a high incidence of side effects and participants were not formally screened for side effects but were asked during the study visit and were given contact details for the study team in the event of any symptoms/illness. Only one participant reported a side effect (nausea after receiving naltrexone – during scanning) and withdrew from the study.

(iii) Were participants asked about their beliefs regarding which drug they had received on which visit (as this is crucial to ascertain the double-blind nature of the study)?

Participants were not formally asked whether they knew which drug they were given in any session. However, the drugs were packaged identically and were formulated in gelatin capsules that were indistinguishable. They were allocated according to a randomized schedule by our hospital pharmacy. Additionally, subjects were not given any information about the anticipated effects of the drugs on pain or its attentional modulation in order to avoid expectation effects. The following statement has been added to the methods (P 23 para 2):

“Neither the participant nor the investigator knew the identity of the drug which was allocated by a computer-generated randomised schedule. No subject reported being aware of whether they had received active drug or placebo (but the effectiveness of blinding was not formally assessed post hoc after dosing).”

(iv) How does their dosing compare to previous studies using these drugs (and are there data on receptor occupancy)?

Both drugs have previously been used for imaging studies and these informed our choice of dosing and protocol timings:

50mg of oral naltrexone produces 95% blockade of mu opioid receptor binding in the brain (assessed with Carfentanil PET, (Weerts et al., 2008)). Additionally, pharmaco-fMRI showed effects of naltrexone on network activity using the same dose and timing for the protocol providing a positive neurobiological signal for target engagement (Morris et al., 2018).

This same oral dose of reboxetine (4mg) and delay before testing has been used successfully in human volunteer studies of affective bias with fMRI neuroimaging (Harmer et al., 2003; Miskowiak et al., 2007). Harmer and colleagues reported an effect of the noradrenergic reuptake inhibitor on emotional processing but no effect on performance of a rapid serial visual presentation task. Another imaging study showed an effect of this does of oral reboxetine (4mg) on fear-induced amygdala activation without any evidence of non-specific effects of reboxetine on brain activity (Onur et al., 2009).

This information has been added to the methods (P22-3)

(11) Please provide as supplementary data (i) group-average tSNR maps or group-average tSNR values per region of interest (so one can judge the data quality obtainable across such a large imaging volume),

It was not possible to derive group average tSNR maps, as no suitable resting state data were acquired in this study. Indeed, we did not consider this necessary as we had already performed several pilot studies to determine the tSNR of our technique, and consistency across the areas imaged. This pilot data (N=3) gave average tSNR values for brain (43.1 ± 3.1, range 39.6–45.4) and cord (18.7 ± 4.2, 14.3–22.7), which compare favourably with published simultaneous imaging results, 31.4 ± 8.6 and 8.6 ± 2.1, respectively (Finsterbusch et al., 2013). This difference in SNR (in the cord) is likely due to difference in voxel size (this study: 12.5mm3 vs 5mm3, (Finsterbusch et al., 2013)) and it points towards data of sufficiently high tSNR to detect BOLD signal change. Note, the effective tSNR of the data will be higher through modelling of physiological noise.

(ii) transverse cross-sections of a group-average spinal cord mean EPI image in template space (so one can judge the precision of the employed registration procedures),

Please see Author response image 2 that shows the quality of our registration procedures. The functional image is an average of all functional images (from the placebo visit) registered to the PAM50 template. It is possible to see that not only is the cord centred within the template, but the spinal discs are also aligned.

Author response image 2.

Author response image 2.

and (iii) unmasked brainstem and spinal cord activation and connectivity results (so one can judge the success of their physiological noise correction procedure).

Please see unmasked brainstem activity pattern obtained via whole brain mixed effects analysis of pooled data. (Following that there are the equivalent data for the spinal cord, then the data for the connectivity results (brainstem/cord)). The results reflect a group analysis (N=39) of the average response for each subject (i.e. across the 3 sessions) for the 3 conditions (main effects of temperature, task and their interaction). Slices shown (left to right) midline sagittal, coronal through the PAG, bilateral LC and RVM masks, axial at the level of the midline RVM mask. To allow visualisation of the underlying anatomy, data were thresholded at an uncorrected P-value of 0.05 (i.e. Z>1.65). The location of relevant masks are outlined in white, with labels shown. Note the outline of the brainstem mask derived from the Harvard-Oxford sub-cortical probabilistic atlas, which was thresholded at 50% and used for estimating brainstem activity (rather than the whole brain analysis presented here). Assignment of activity to specific nuclei was based on overlap with probabilistic brainstem nuclei masks (Brooks et al., 2017). Positive Z-scores are shown in Red-Yellow colours, whilst negative ones are in Blue-Lightblue. It can be seen that activity was rarely observed in the 4th ventricle, nor in the aqueduct, indicating that physiological noise was adequately corrected for with the chosen scheme, see (Brooks et al., 2008; Kong et al., 2012) for more details. These data are now added to Figure 3 Supplementary Figure 1.

Unmasked cord EPI data from pooled analysis (across all 3 sessions) for the 3 conditions (main effects of task, temperature and their interaction) are shown on the PAM50 spinal cord template. The uncorrected t-score data from RANDOMISE are shown positive (Red-Yellow) and negative (Blue-Light blue), along with the corrected activity (in green) estimated from these data. Vertebral levels are indicated on sagittal section (left side of image). Due to masking steps in the registration pipeline it was not possible to include tissues outside the cord. Activity for the whole cord (i.e. unmasked) is shown for each contrast in green, with TFCE correction P<0.05. These data are now added to Figure 2 Supplementary Figure 4.

Unmasked whole brain group data for effective connectivity analysis of the placebo condition only. For each subject the seed was extracted for the main effect of temperature (within the pooled simple main effects data) within the RVM. I.e. a functional mask was derived from the group data, masked anatomically then applied to each subject separately to identify their peak voxel time series (the seed). Subsequently, the connectivity profile was estimated for each subject using generalised psychophysiological analysis (gPPI), with separate contrasts between the gPPI regressors for the 3 conditions (main effects of task, temperature and their interaction). To allow visualisation of underlying anatomy, data were thresholded at an uncorrected P-value of 0.05 (i.e. Z>1.65). The location of relevant masks are outlined in white (see labels on previous brainstem figure). Positive Z-scores are shown in Red-Yellow colours, whilst negative ones are in Blue-Light blue. Note that significance of connectivity was assessed by using permutation testing within a priori identified anatomical masks. These data are now added as Figure 4 Supplementary Figure 1.

Unmasked group cord data from connectivity analysis of the placebo condition shown on the PAM50 spinal cord template. For each subject the physiological regressor was extracted from a mask representing the main effect of temperature contrast determined with pooled brainstem data within the RVM. Subsequently, generalised psychophysiological interaction (gPPI) regressors were formed for each of the basic contrasts and contrasts between them created. The data represent uncorrected positive (Red-Yellow) and negative (Blue-Lightblue) t-scores, which are the output from RANDOMISE. Vertebral levels are indicated on sagittal section (left side of image). Due to masking steps in the registration pipeline it was not possible to include tissues outside the cord. To aid interpretation of the patterns of activity, the left C5-C6 vertebral mask is shown (white outline). Significant group activity detected within the mask for each contrast are shown in green, with TFCE corrected P<0.05. These data are now added as Figure 4 Supplementary Figure 2.

(12) Please explain details of the study design. (i) fMRI-based power analysis: the power analysis is based on PAG data and a one-sample t-test, which is different from crucial parts of this manuscript (e.g. spinal data having different signal characteristics and different statistical tests being used, such as ANOVAs).

For the a priori power analysis we used the fMRI data from our previous study using an identical experimental paradigm (Brooks et al., 2017). The region of interest used for this purpose (the PAG), is a crucial region of interest for attentional analgesia, and presents similar (although not identical) noise characteristics to the spinal cord data. Because of the novelty of our acquisition with both spinal and brain/brainstem data for an attentional analgesia paradigm, no better dataset was available at that time to inform the calculation. We also note that our study has been adequately powered to identify not only main effects (in the PAG and elsewhere in the brainstem) but also interactions even at a spinal level, to resolve connectivity and to identify effects of drugs on this connectivity. The power calculation was conducted before the study onset, was accepted by our ethical committee and we propose to share the original protocol document as a supplementary file for the sake of transparency. By sharing our imaging data we will make it possible for others to conduct more accurate power calculations for whole neuraxial imaging.

(ii) Reasons for choosing this particular heat stimulation model (30s plateau with random spikes), as it is a rather unusual approach (and also give some more details on the calibration procedure, as it is hard to follow right now)

The stimulation protocol is based on that proposed by (Lautenbacher et al., 1995), and previously used by (Valet et al., 2004) in a block design imaging experiment. The model attempts to produce a “stable and predictable temporal pattern of tonic pain” (Lautenbacher et al., 1995), by means of a constant background of heat (~42-45°C) on to which are superimposed heat spikes. This heating protocol has been used by us across three separate studies (Brooks et al., 2017; Oliva et al., 2021a; Oliva et al., 2021b), and gives rise to stable pain ratings.

Clarification on the heat stimulation model was added to page 22:

“This temperature profile was used in our previous studies (Brooks et al., 2017; Oliva et al., 2021; Oliva et al. 2021) to maintain pain perception, while at the same time avoiding sensitization and skin damage.”

We added detail on the calibration procedure in our methods section (p. 22), which now reads:

“Participants received a range of thermal stimuli between 36 and 45°C, and were asked to rate the sensation they felt for each stimulus during the whole stimulation period, on a scale from 0 (no pain) to 10 (the worst pain imaginable). The temperature which consistently produced a pain rating of 6 out of 10 at least 3 times in a row, was used for the noxious stimulation in the experiment. If the participant only gave pain scores lower than 6 to all stimuli, then the maximum programmable plateau temperature of 45°C was used, but with higher temperature spikes of 3, 4 and 5 degrees above, reaching the highest temperature allowed for safety (50°C maximum).”

(iii) Did imaging sessions occur at the same time of day for each participant?

The imaging sessions did not happen at the same time of the day. All of the experimental sessions started in a 6-hour window between 9am and 3pm (booked as am or pm sessions, 65% of the scans were done in the pm slot). We tried wherever possible to scan participants at the same time of day and achieved that for 54% of participants (which is >4 fold greater than chance). However, this was a challenging study to get the same participants to attend for scanning on 3 different days over a 3 week period and so we prioritized flexibly finding scan slots that worked for the study participants rather than risk losing subjects who had already been through the protocol. There was no evidence of systematic bias in timings across the drug groups as analysis of the distribution of sessions showed no significant difference (Chi2(3.68,2), p=0.16).

(iv) Do you indeed only have 4 trials per condition?

Yes, we had four repetitions of each of the four conditions (hard|high, easy|high, hard|low, easy|low), each lasting 30 seconds. Please see Figure 1 from Brooks et al., 2017 for clarification. Note, the “control” task depicted in this Figure was omitted in the current experiment.

(13) Please revise and tone down the interpretation of the results. (i) Neither do the data allow to make the claim that the blockade of RVM-DH connectivity by Naltrexone is indeed the reason for the reduced analgesic effect in that condition nor do their data allow to make a direct link between deep dorsal horn interneuron pools and the observed BOLD effects.

These are postulates based on our experimental findings and build in part from the animal literature. We have revised and toned down the language to make it clear that we are suggesting that these are interpretations of the data. We think these are both reasonable hypotheses based on our findings (which we have strengthened with the additional analyses) and that there is nothing factually incorrect with either statement.

(ii) Please cite the relevant work by Tinnermann and colleagues, who did not only report brainstem-spinal coupling during a cognitive manipulation (Tinnermann et al., 2017, Science), but have also written a review on the difficulties of cortico-spinal imaging (Tinnermann et al., 2021, Neuroimage).

We thank the reviewer for their comment and have redressed the oversights in not including these papers. The discussion of implementation of PPI in the Science paper was particularly helpful and is now mentioned in the manuscript (Methods p29), as is the review outlining the challenges of cortico-spinal imaging (Discussion – p16, 17)

(iii) Considering that the authors demonstrate the involvement of a system (ACC, PAG, RVM) in attentional analgesia that has also been implicated in placebo analgesia, it might be worth to comment on shared/distinct underlying mechanisms across such forms of pain modulation (see also Buhle et al., 2012, Psychological Science).

The interesting paper by Buhle and colleagues shows that placebo and attentional analgesia are additive suggesting different mechanisms on the basis of behaviour. In part this is based on the idea that a 3-back task saturates the cognitive capacity of PFC and so that it could not produce the additive placebo analgesia. We have cited Buhle et al., in our discussion as a caveat to the argument that they are acting via similar mechanisms (P18).

(iv) Please expand on your statement in the Discussion that optimized cortico-spinal fMRI protocols with tailored acquisition parameters (Finsterbusch et al., 2013, Neuroimage; Islam et al., 2019, Magnetic Resonance in Medicine) could create confounds for functional connectivity analyses?

We have added the following information to the Discussion (see below), which takes into account the difference in bandwidth, echo time, echo train length and voxel size between the “tailored” brain and spinal cord acquisitions, which we felt might reasonably alter BOLD sensitivity and point spread function for the voxel. Clearly there are advantages to using bespoke acquisitions for each region, but until it has been demonstrated that this does not adversely impact relatively insensitive techniques such as PPI, we thought it prudent to stick with an identical acquisition across our regions of interest.

P17 “Our choice was motivated by (i) the need to capture signal across the entire CNS region involved in the task (including the entire medulla), and (ii) that the use of different acquisition parameters for brain and spinal cord could be a confounding factor, particularly for connectivity analyses, due to altered BOLD sensitivity and point-spread function for the separate image acquisitions.”

(14) It was difficult to find detailed quantitative descriptions of the results shown in Figure 1C and 1D. For example, the authors conducted some post-hoc analyses using BOLD estimates extracted from the clusters identified from Figure 1B, and thus they should be able to provide statistical values to make comments like "In the placebo session, the pattern of BOLD signal change across conditions was strikingly similar to the pain scores", or "… showed an increased level of activity in the hard | high condition". By not providing quantitative results, these descriptions become meaningless. The authors even used the word "strikingly" without any statistical evidence, weakening the overall credibility of their findings.

We have now included the correlation between the pain scores and the BOLD activity in the Spinalnoci cluster (see answer to Point 2 and Figure 2C) linking behaviour and the imaging findings statistically and robustly at an individual level. This, to a large extent, accounts for the similar pattern of changes in pain scores and spinal BOLD across the conditions and drugs in the graphs in Figure 2A and D. We have removed the term “striking” as requested as the relationships shown in the graphs are clear to the reader.

(15) Some detailed information about the fMRI analyses, such as thresholding methods, were given in the Method section only (e.g., the whole-brain analysis in Figure 2B). But given that this journal has the Results section earlier than the Methods section, it would be better to provide some basic information about thresholding in the Results section as well.

We thank the reviewer for suggesting this necessary clarification. We added this detail to the Results section as follows:

Spinal cord – p. 6: Activity in the spinal cord was assessed using permutation testing with a left C5/C6 mask based on the probabilistic cord atlas available in the spinal cord toolbox (PAM50 template). Significant results are reported for P<0.05, TFCE corrected.

Brainstem – p. 10: Activity in brainstem nuclei was investigated using permutation testing with a whole brainstem mask which was based on the Harvard-Oxford subcortical atlas available in FSLeyes, thresholded at P=0.5 (i.e. > = 50% probability of being brainstem). Significant results are reported for P<0.05, TFCE corrected.

Whole brain – p. 11: Whole-brain analyses were performed in FEAT without ROI masking. Significant results are reported with cluster forming threshold of Z > 3.1, family wise error (FWE) corrected P < 0.05.

(16) The authors used TFCE methods for the spinal cord and brainstem analyses but used a different thresholding method for the whole-brain analysis. The reason should be provided. It seems arbitrary and post-hoc in the current version of the manuscript.

Activity within the cerebrum was assessed using conventional whole-brain cluster-based thresholding and mixed-effects modelling, based on recent recommendations from (Eklund et al., 2016). Such an approach would not have been appropriate for the small, non-spherical nuclei within the brainstem and laminar arrangement of the spinal cord dorsal horn, which will typically have a larger rostro-caudal extent. Here we chose to use anatomical masks to restrict analysis to specific regions, along with permutation testing to assess significance levels. In the permutation tool chosen, RANDOMISE, the most typically applied method for multiple-comparisons correction within a mask is threshold free cluster enhancement (TFCE), which we have used here.

(17) They used cluster-level thresholding for the whole-brain analysis. With the cluster extent thresholding, "researchers can only infer that there is signal somewhere within a significant cluster and cannot make inferences about the statistical significance of specific locations within the cluster" (a quote from the NeuroImage paper titled "Cluster-extent based thresholding in fMRI analyses: Pitfalls and recommendations"). Their description of the whole brain results does not seem to recognize this pitfall of the cluster extent thresholding. They should note the caution about the interpretation of their whole-brain results.

We thank the reviewer for this note. We are indeed aware of the pitfalls of cluster-level thresholding. We believe we addressed this issue by reporting, for each significant cluster, all the regions involved, according to the Harvard-Oxford probabilistic atlas (please see Supplementary table 1). We now added a note of caution for the interpretation of the results at p. 11:

“Note that cluster thresholding does not permit inference on specific voxel locations (Woo et al., 2014), we report the full list of regions encompassed by each significant cluster (see Figure 3 Supplementary Table 1).”

(18) Naltrexone is also known to reverse the placebo effects. I wonder if they tested this effect as well. It is unclear in which context they provided the placebo pill to participants.

The reviewer is correct that opioid antagonists have been shown in some studies to attenuate placebo analgesic effects. However, these studies manipulate the participant’s expectations to embed the prior belief that the inert treatment is in fact a potent analgesic either by suggestion or by classical conditioning. In our study the placebo control session was used as a contrast to the two active drugs (reboxetine and naltrexone). This allowed the identification of specific pharmacological actions of the two drugs without the effect of placebo – so in effect the placebo effect from the capsule administration has been subtracted from the experiment in this design. Therefore, we cannot answer the reviewer’s question as to whether naltrexone blocks any placebo effects. We have added an additional methodology figure (Figure 1) to emphasise the study design with the aim of clarifying the role of placebo.

Reviewer #2 (Recommendations for the authors):

P4: Is it appropriate to speak of 'low pain' regarding the low innocuous temperature employed?

We appreciate the point the reviewer is making here and although our low temperature stimulus did produce non-zero average pain ratings at a group level (and so technically this is a low pain state) nonetheless we meant to imply low versus high temperature conditions and have reworded the sentence as below (P. 4, para 2):

“….with individually calibrated task difficulties (easy or hard), which was delivered concurrently with thermal stimulation (low or high), adjusted per subject, to evoke different levels of pain.”

P4: Stating hypotheses would be welcome and helpful for the reader (i.e. what is the direction of effects the authors were expecting for naltrexone and reboxetine and what previous animal/human studies would they base this on).

We have now stated the expected actions of the drug interventions upon attentional analgesia (P 4, para 2). “To resolve the relative contributions from the opioidergic and noradrenergic systems, subjects received either the opioid antagonist naltrexone (which we predicted would block attentional analgesia), the noradrenaline re-uptake inhibitor reboxetine (which we would propose to augment attentional analgesia), or placebo control.” The animal and human evidence for these actions is summarised earlier in the introduction and in the discussion.

P10: Considering that the authors have used DCM in their earlier work on very similar brain and brainstem data, what is the reason for not using this effective connectivity approach here?

We indeed plan to undertake DCM of this rich dataset but that is for a follow-on paper exploring the direction and valency of the connectivity changes and what this can tell us about the mechanisms of analgesia.

P10: Why did they choose the right LC and RVM and not opt for a bilateral region – is there any evidence from animal studies for contralateral responses that motivates this choice?

The RVM is a midline structure and we did not choose/analyse just the right RVM. However, the reviewer is correct that we chose the right (contralateral) LC a priori as that was a finding from our previous similar studies (Oliva et al., 2021 Neuroimage) and there is animal evidence summarised in that paper for a lateralised response to noxious stimulation in the LC.

P11: In many imaging studies on descending control, the ACC results are located next to the genu of the corpus callosum – but as the ACC connectivity result seems to be located much more posteriorly here, could the authors comment on this in terms of function of these regions?

We thank the reviewer for raising this interesting point. We agree that others have identified signal change in and around the genu of the corpus callosum, but would argue that much of that pertains to specific placebo manipulations. Our subjects were fully informed about the exact nature of this study, no manipulation was performed to alter expectations around any of the drugs received, nor was there any covert alteration in applied stimulus temperature to “enhance” perceived pain relief. Instead, we delivered painful thermal stimulation against the background of a cognitively demanding task (after subjects had received their drugs). We note recent discussions around compartmentalisation of the cingulate (van Heukelum et al., 2020), and we acknowledge that our results pertain to both to MCC (involved in conflict resolution between competing attentional demands, amongst other things) and ACC (nociceptive, affective processing). The location of our “ACC” region is sat on the ACC-MCC border by this definition, and likely reflects a combination of task demand and pain processing.

P21: If the calibration of the RSVP tasked was repeated at each study-visit, why was it carried out during the initial screening visit?

The initial calibration was done to both familiarise the subject with the test procedures and to identify the starting point for future sessions. The recalibration before each subsequent session could be expedited and started from this speed to check performance which was often consistent across testing sessions as indicated in Figure 2 Supplementary Figure 3

P22: The FWHM of the smoothing kernel for the spinal cord data is almost identical to the in-plane voxel size – could the authors explain this choice (as it is somewhat unusual)?

The chosen smoothing kernel reflects a desire to match it to the likely size of activation within the cord, whilst still attempting to improve signal to noise ratio. Given that the cross-sectional area of the cord is of the order ~1cm2, we felt that this small amount of smoothing provided a reasonable compromise. It should be noted that even though the voxel size (1.77mm) and FWHM of smoothing kernel (2mm) are similar, the smoothing will include regions beyond the nominal 2mm extent of the kernel.

P23: Were the EPI data directly registered to a target image in template space or was this done via an intermediate step using the high-resolution MPRAGE data?

The author is correct in thinking that the spinal cord EPI data were registered to the PAM50 template via an intermediate step registering each subject’s T1-weighted MPRAGE data, which covered brain and spinal cord, to the PAM50 template. This procedure is similar to the registration process for brain EPI data recommended in FSL. This clarification was now added to the manuscript page 25, para 4 (“The registration pipeline included two steps: (1) registration of each subject’s T1-weighted structural scan to the PAM50 T1-weighted template, (2) registration of acquired functional images to PAM50 template (T2*-weighted) using the output from step 1 as an initial warping.”) and is demonstrated and described in Figure 2 animation 1.

P32: Why do the authors report using a mixed ANOVA, when their experimental paradigm is a within-subject repeated-measures design and does not have a 'group' factor?

The reviewer is correct – this was a 3-way repeated measures ANOVA and now changed in the figure legend.

References

Baliki, M.N., Geha, P.Y., Fields, H.L., and Apkarian, A.V. (2010). Predicting value of pain and analgesia: nucleus accumbens response to noxious stimuli changes in the presence of chronic pain. Neuron 66, 149-160.

Bantick, S.J., Wise, R.G., Ploghaus, A., Clare, S., Smith, S.M., and Tracey, I. (2002). Imaging how attention modulates pain in humans using functional MRI. Brain 125, 310-319.

Barton, M., Marecek, R., Rektor, I., Filip, P., Janousova, E., and Mikl, M. (2015). Sensitivity of PPI analysis to differences in noise reduction strategies. J Neurosci Methods 253, 218-232.

Brooks, J.C., Beckmann, C.F., Miller, K.L., Wise, R.G., Porro, C.A., Tracey, I., and Jenkinson, M. (2008). Physiological noise modelling for spinal functional magnetic resonance imaging studies. Neuroimage 39, 680-692.

Brooks, J.C., Davies, W.E., and Pickering, A.E. (2017). Resolving the Brainstem Contributions to Attentional Analgesia. J Neurosci 37, 2279-2291.

Brooks, J.C., Faull, O.K., Pattinson, K.T., and Jenkinson, M. (2013). Physiological noise in brainstem FMRI. Front Hum Neurosci 7, 623.

Churchill, N.W., Oder, A., Abdi, H., Tam, F., Lee, W., Thomas, C., Ween, J.E., Graham, S.J., and Strother, S.C. (2012). Optimizing preprocessing and analysis pipelines for single-subject fMRI. I. Standard temporal motion and physiological noise correction methods. Hum Brain Mapp 33, 609-627.

Eippert, F., Kong, Y., Jenkinson, M., Tracey, I., and Brooks, J.C.W. (2017). Denoising spinal cord fMRI data: Approaches to acquisition and analysis. Neuroimage 154, 255-266.

Eklund, A., Nichols, T.E., and Knutsson, H. (2016). Cluster failure: Why fMRI inferences for spatial extent have inflated false-positive rates. Proc Natl Acad Sci U S A 113, 7900-7905.

Finsterbusch, J., Eippert, F., and Buchel, C. (2012). Single, slice-specific z-shim gradient pulses improve T2*-weighted imaging of the spinal cord. Neuroimage 59, 2307-2315.

Finsterbusch, J., Sprenger, C., and Buchel, C. (2013). Combined T2*-weighted measurements of the human brain and cervical spinal cord with a dynamic shim update. Neuroimage 79, 153-161.

Fleishaker, J.C. (2000). Clinical pharmacokinetics of reboxetine, a selective norepinephrine reuptake inhibitor for the treatment of patients with depression. Clin Pharmacokinet 39, 413-427.

Friston, K.J., Buechel, C., Fink, G.R., Morris, J., Rolls, E., and Dolan, R.J. (1997). Psychophysiological and modulatory interactions in neuroimaging. Neuroimage 6, 218-229.

Geuter, S., Boll, S., Eippert, F., and Buchel, C. (2017). Functional dissociation of stimulus intensity encoding and predictive coding of pain in the insula. eLife 6.

Gitelman, D.R., Penny, W.D., Ashburner, J., and Friston, K.J. (2003). Modeling regional and psychophysiologic interactions in fMRI: the importance of hemodynamic deconvolution. Neuroimage 19, 200-207.

Harmer, C.J., Hill, S.A., Taylor, M.J., Cowen, P.J., and Goodwin, G.M. (2003). Toward a neuropsychological theory of antidepressant drug action: increase in positive emotional bias after potentiation of norepinephrine activity. Am J Psychiatry 160, 990-992.

Harrison, T.M., McLaren, D.G., Moody, T.D., Feusner, J.D., and Bookheimer, S.Y. (2017). Generalized Psychophysiological Interaction (PPI) Analysis of Memory Related Connectivity in Individuals at Genetic Risk for Alzheimer's Disease. J Vis Exp.

Kong, Y., Jenkinson, M., Andersson, J., Tracey, I., and Brooks, J.C. (2012). Assessment of physiological noise modelling methods for functional imaging of the spinal cord. Neuroimage 60, 1538-1549.

Lakens, D. (2017). Equivalence Tests: A Practical Primer for t Tests, Correlations, and Meta-Analyses. Soc Psychol Personal Sci 8, 355-362.

Lautenbacher, S., Roscher, S., and Strian, F. (1995). Tonic pain evoked by pulsating heat: temporal summation mechanisms and perceptual qualities. Somatosens Mot Res 12, 59-70.

McLaren, D.G., Ries, M.L., Xu, G., and Johnson, S.C. (2012). A generalized form of context-dependent psychophysiological interactions (gPPI): a comparison to standard approaches. Neuroimage 61, 1277-1286.

Miskowiak, K., Papadatou-Pastou, M., Cowen, P.J., Goodwin, G.M., Norbury, R., and Harmer, C.J. (2007). Single dose antidepressant administration modulates the neural processing of self-referent personality trait words. Neuroimage 37, 904-911.

Morris, L.S., Baek, K., Tait, R., Elliott, R., Ersche, K.D., Flechais, R., McGonigle, J., Murphy, A., Nestor, L.J., Orban, C., et al. (2018). Naltrexone ameliorates functional network abnormalities in alcohol-dependent individuals. Addict Biol 23, 425-436.

O'Reilly, J.X., Woolrich, M.W., Behrens, T.E., Smith, S.M., and Johansen-Berg, H. (2012). Tools of the trade: psychophysiological interactions and functional connectivity. Soc Cogn Affect Neurosci 7, 604-609.

Oliva, V., Gregory, R., Brooks, J.C.W., and Pickering, A.E. (2021a). Central pain modulatory mechanisms of attentional analgesia are preserved in fibromyalgia. Pain in Press.

Oliva, V., Gregory, R., Davies, W.E., Harrison, L., Moran, R., Pickering, A.E., and Brooks, J.C.W. (2021b). Parallel cortical-brainstem pathways to attentional analgesia. Neuroimage 226, 117548.

Onur, O.A., Walter, H., Schlaepfer, T.E., Rehme, A.K., Schmidt, C., Keysers, C., Maier, W., and Hurlemann, R. (2009). Noradrenergic enhancement of amygdala responses to fear. Soc Cogn Affect Neurosci 4, 119-126.

Parker, D.B., and Razlighi, Q.R. (2019). The Benefit of Slice Timing Correction in Common fMRI Preprocessing Pipelines. Front Neurosci 13, 821.

Peyron, R., Garcia-Larrea, L., Gregoire, M.C., Costes, N., Convers, P., Lavenne, F., Mauguiere, F., Michel, D., and Laurent, B. (1999). Haemodynamic brain responses to acute pain in humans: sensory and attentional networks. Brain 122 ( Pt 9), 1765-1780.

Ploner, M., Lee, M.C., Wiech, K., Bingel, U., and Tracey, I. (2010). Prestimulus functional connectivity determines pain perception in humans. Proc Natl Acad Sci U S A 107, 355-360.

Sladky, R., Friston, K.J., Trostl, J., Cunnington, R., Moser, E., and Windischberger, C. (2011). Slice-timing effects and their correction in functional MRI. Neuroimage 58, 588-594.

Tinnermann, A., Buchel, C., and Cohen-Adad, J. (2021). Cortico-spinal imaging to study pain. Neuroimage 224, 117439.

Tinnermann, A., Geuter, S., Sprenger, C., Finsterbusch, J., and Buchel, C. (2017). Interactions between brain and spinal cord mediate value effects in nocebo hyperalgesia. Science 358, 105-108.

Valet, M., Sprenger, T., Boecker, H., Willoch, F., Rummeny, E., Conrad, B., Erhard, P., and Tolle, T.R. (2004). Distraction modulates connectivity of the cingulo-frontal cortex and the midbrain during pain--an fMRI analysis. Pain 109, 399-408.

van Heukelum, S., Mars, R.B., Guthrie, M., Buitelaar, J.K., Beckmann, C.F., Tiesinga, P.H.E., Vogt, B.A., Glennon, J.C., and Havenith, M.N. (2020). Where is Cingulate Cortex? A Cross-Species View. Trends Neurosci 43, 285-299.

Verebey, K., Volavka, J., Mule, S.J., and Resnick, R.B. (1976). Naltrexone: disposition, metabolism, and effects after acute and chronic dosing. Clin Pharmacol Ther 20, 315-328.

Weerts, E.M., Kim, Y.K., Wand, G.S., Dannals, R.F., Lee, J.S., Frost, J.J., and McCaul, M.E. (2008). Differences in δ- and mu-opioid receptor blockade measured by positron emission tomography in naltrexone-treated recently abstinent alcohol-dependent subjects. Neuropsychopharmacology 33, 653-665.

Woo, C.W., Krishnan, A., and Wager, T.D. (2014). Cluster-extent based thresholding in fMRI analyses: pitfalls and recommendations. Neuroimage 91, 412-419.

[Editors' note: further revisions were suggested prior to acceptance, as described below.]

Reviewer #2 (Recommendations for the authors):

The authors have convincingly addressed most of the points I raised, but there are a few outstanding issues that have not been resolved.

Drug-specific effects on attentional analgesia. The authors aim to show that their pharmacological interventions modulate attentional analgesia and the adequate way to do so would be via a 3-way interaction (i.e. drug task temperature) in the chosen ANOVA approach. However, the behavioural data do not provide evidence for such an effect (i.e. the newly-added ANOVA table). I appreciate the novel inclusion of equivalence-testing results (though it is impossible for me to follow the details of this analysis, since it is not described in the methods section), but their main ANOVA approach simply does not show a significant effect of drug on attentional analgesia and this needs to be made clear prominently in the manuscript – at the moment, this lack of an effect is not even mentioned in the main text.

The 3-way repeated measures ANOVA tests seven null hypotheses relating to main effects and their interactions (we showed significant findings for Temperature, Task, TempTask and Drug Temp). In this case the absence of a Drug Task Temp interaction does not mean that there is no effect of drug on attentional analgesia; any more than its presence would have indicated with any certainty that a drug modulation of attentional analgesic effect was present. Hypothetically, such a 3-way interaction could be caused by other drug effects for example an analgesic action associated with a degree of sedation (such as would be produced by an opioid or alpha2-adrenoceptor agonist) that would have influenced pain scores and task performance differentially (but not have had anything to do with attentional analgesia).

We are not particularly surprised by the absence of a significant 3-way interaction given that attentional analgesia (~7% change in pain scores) is only seen in the difference in pain between the high temperature conditions and that only one of the drugs (naltrexone) selectively influenced attentional analgesia (only evident in the high|hard condition ie 1/12th of the observations). In contrast the effect of temperature has a very large influence on the variance in the pain scores and accordingly it dominates the statistics. Nonetheless the presence of significant interactions of Drug Temp and Temp Task is further investigated in the individual 2-way ANOVA analyses that show the behavioural signature of attentional analgesia is present under the placebo and reboxetine conditions but is attenuated by naltrexone. This is reinforced through equivalence testing, described in the paper of Lakens (2017) and as cited in the text in the relevant Results section (p5 final para).

We also emphasise that our findings are the product of a carefully controlled experimental design with blinding, placebo control, repeated-measures within the same subjects, an a priori defined experimental plan (included as a supplementary document) and power calculation, using an established attentional analgesia paradigm that has been developed over a series of recent studies combined with sophisticated imaging protocols. This has allowed us to hold many of the experimental parameters constant (as indicated by the excellent reproducibility of the results across scan sessions and indeed corroboration with our previous studies) enabling the identification the effects of the drugs on attentional analgesia. We have transparently reported these findings for the reader, and they have both biological plausibility, reproducibility and are underpinned by statistical inferences. Therefore, we do not agree that it is correct to report that the lack of a 3-way interaction indicates a lack of influence of naltrexone on attentional analgesia.

Attentional effects in spinal cord responses. I am at a loss to follow the authors' claim in the abstract that "Noxious thermal forearm stimulation generated somatotopic-activation of dorsal horn (DH) whose activity correlated with pain report and mirrored attentional pain modulation.", as well as their lines 169-177, since the figure they added to their response letter shows exactly the opposite: there was no difference between HH and EH in the nociceptive cluster in the dorsal horn (I would actually find it very instructive for the reader if this figure were added to the supplement next to the same plot for the pain ratings; currently Figure 2 Supplement 2).

We see main effect of temperature in the spinal dorsal horn in the C6 segment which corresponds to the forearm dermatome where the thermal stimulus was applied (Figure 2 and also see the unmasked analysis – Figure 2- supplementary Figure 5) so we think the first part of this statement is amply justified “Noxious thermal forearm stimulation generated somatotopic-activation of dorsal horn (DH)”.

We provided additional data analysis after the previous round of revisions to show clearly that the parameter estimates extracted from this spinalnoci cluster correlate with pain scores across conditions with good coefficients (0.32-0.6) and slopes that were significantly nonzero so the second clause is supported “whose activity correlated with pain report…”.

This then leaves the statement “mirroring attentional pain modulation” which reflects the observation of the clear similarity between the plots of the behavioural pain scores across the four conditions and the parameter estimates extracted from the Spinalnoci cluster. We note the reviewers point about the lack of statistical significance which reflects the difficulty inherent in measuring small signal differences with fMRI in the spinal cord (as the reviewer is aware). The supplementary plot we have provided of this activity (Figure 2 supplementary figure 2B) shows the pattern of deltas in the means that we describe but also the large variance in the parameter estimates. For the purpose of the abstract we think “mirrors” is an appropriate concise term that does not imply statistical significance, we only ask the reader to compare the patterns shown in the two sets of graphs (Figure 2A and D) and they can draw their own conclusions. To enable this to be done we have included the requested plot in Figure 2- supplementary figure 2, have modified our statements in the results paragraph (p 6-7) and have added the following statement to the manuscript.

“Post hoc analysis of the differences in Spinalnoci BOLD in the hard|high – easy|high conditions, although showing the same pattern of differences in the means, did not show a group level difference between drug sessions. This absence of evidence for attentional modulation of absolute BOLD signal differences may reflect large interindividual differences, low signal to noise in spinal cord fMRI data, or an inability to discriminate between excitatory or inhibitory contributions to measured signal (Figure 2 -Supplementary figure 2B).”

Similarly, in lines 182-185 the authors make statements that are not based on any statistical inference.

At the reviewer’s request we have now conducted a post-hoc statistical analysis of the BOLD parameter estimates extracted from the spinalint cluster. This shows that the spinalint cluster is more active in the high|hard condition than in either the easy|high or hard|low conditions consistent with our proposal that this neural population may be an interneuron pool recruited in the high|hard condition. We further show that significant activation is seen in the spinalint cluster in the high|hard condition in the presence of both placebo and reboxetine but not in naltrexone (Figure 2 supplementary figure 2C). These results have now been added to Figure 2E / legend and the results text and are noted in the discussion (p 12 para 2).

Assessment of group differences in connectivity. I appreciate the authors' response on this point, but it has unfortunately not assuaged my concerns at all. Since the authors use a 'pooled' analysis for the standard GLM analyses, why do they not use this 'pooled' approach for the PPI as well? This would mitigate the risk I have mentioned before, namely that the current approach might introduce a significant amount of bias into their results (e.g. partial 'double-dipping', see Kriegeskorte et al., 2009, Nature Neuroscience).

For the generalised psychophysiological interaction (gPPI) analysis we built upon our results from a completely independent sample (Oliva et al., 2021), to limit our seed/target regions to those previously found connected during attentional analgesia.

We hypothesised that, as a result of drug manipulation, changes in connectivity might be observed within this network. Given the inherent lack of statistical power in effective connectivity analyses (Friston et al., 1997; O'Reilly et al., 2012), we were concerned that initial pooling across the drug conditions might obscure the attentional analgesia network we sought to examine (if for example a drug altered connectivity). To this end, we focussed on the placebo (baseline) condition. The pattern of cortical/brainstem connectivity identified in this independent sample (N=39) is strikingly similar to that observed previously (N=57, (Oliva et al., 2021)), with the addition of the important new information about effective connectivity to the spinal cord (all assessed using corrected statistics, which is uncommon for reported PPI results). This should provide the reader with confidence that these results are (1) reliable and reproducible, and (2) do not introduced significant bias into the study.

Therefore, we reject the reviewer’s assertion that we should have initially pooled across conditions to determine the network involved in attentional analgesia. This could have altered the identified network, potentially eradicating the connection to the spinal cord – due to drug effects. We believe that we are testing our hypotheses appropriately, and our methods are described in enough detail to allow proper scrutiny by the readership of eLife. We do not believe that this approach has involved “partial double-dipping” of the sort described by Kriegeskorte et al., 2009 – indeed we have explicitly sought to avoid this kind of confound.

Spinal cord: choice of mask. I am still not able to follow the authors' rationale as to why they use rather unspecific vertebral level & hemi-cord masks instead of the available probabilistic masks, which represent the current gold-standard: i.e. why do they not limit their search to the segment of interest (C6) and the grey matter therein? I would ask the authors to indicate within the manuscript why they are using a mask that does not allow spatial assignment of BOLD responses with respect to segmental level and grey matter.

The masks the reviewer refers to as “rather unspecific”, were derived from the probabilistic atlases used in the Spinal Cord Toolbox, as such they reflect the least biased way to identify activity localised to a particular segment and level. Our demonstration that even when using an entire spinal cord mask we still find activity at the “correct” location, increases confidence in the result, not diminishes it (as the correction for multiple comparisons is more punitive). As an aside it should be noted that the probabilistic atlases are based on segmentations of high-resolution structural images, which are then transformed into the space of the spinal functional data (with their inherent distortions), so probably do not reflect the true extent of grey matter. Nonetheless we have clearly signposted our choice of probabilistic masks, and the rationale behind their use (see Page 23, Para 1).

Spinal cord: assessment of denoising success. It is unfortunate that the authors are not sharing the asked-for unmasked spinal cord data (but still use a cord mask), as such data would be most helpful for assessing the remaining level of physiological noise as well as the local nature of spinal cord BOLD responses (e.g. draining vein contributions). I am not able to follow the authors' argument that "due to masking steps in the registration pipeline, it was not possible to include tissues outside the spinal cord" – showing a few millimetres of data around the cord / CSF should be possible.

We have previously demonstrated the success of denoising techniques for identifying BOLD activity within the human spinal cord (Brooks et al., 2008; Brooks et al., 2012; Eippert et al., 2017; Kong et al., 2012). We took an identical approach in the current study and used what we had learnt from those methodological studies to help answer questions about spinal cord function and descending pain control, not the role of denoising in spinal fMRI. We have no reason at all to think that our data can be explained by some residual physiological noise artefact – the pattern of the activations at a spinal level is anatomically distinctive (reinforced by the unmasked analysis) and fits remarkably well with the known human and animal neurobiology.

References

Brooks, J.C., Beckmann, C.F., Miller, K.L., Wise, R.G., Porro, C.A., Tracey, I., and Jenkinson, M. (2008). Physiological noise modelling for spinal functional magnetic resonance imaging studies. Neuroimage 39, 680-692.

Brooks, J.C., Kong, Y., Lee, M.C., Warnaby, C.E., Wanigasekera, V., Jenkinson, M., and Tracey, I. (2012). Stimulus Site and Modality Dependence of Functional Activity within the Human Spinal Cord. J Neurosci 32, 6231-6239.

Eippert, F., Kong, Y., Winkler, A.M., Andersson, J.L., Finsterbusch, J., Buchel, C., Brooks, J.C.W., and Tracey, I. (2017). Investigating resting-state functional connectivity in the cervical spinal cord at 3T. Neuroimage 147, 589-601.

Friston, K.J., Buechel, C., Fink, G.R., Morris, J., Rolls, E., and Dolan, R.J. (1997). Psychophysiological and modulatory interactions in neuroimaging. Neuroimage 6, 218-229. Kong, Y., Jenkinson, M., Andersson, J., Tracey, I., and Brooks, J.C. (2012). Assessment of physiological noise modelling methods for functional imaging of the spinal cord. Neuroimage 60, 1538-1549.

Lakens, D. (2017). Equivalence Tests: A Practical Primer for t Tests, Correlations, and MetaAnalyses. Soc Psychol Personal Sci 8, 355-362.

O'Reilly, J.X., Woolrich, M.W., Behrens, T.E., Smith, S.M., and Johansen-Berg, H. (2012). Tools of the trade: psychophysiological interactions and functional connectivity. Soc Cogn Affect Neurosci 7, 604-609.

Oliva, V., Gregory, R., Davies, W.E., Harrison, L., Moran, R., Pickering, A.E., and Brooks, J.C.W. (2021). Parallel cortical-brainstem pathways to attentional analgesia. Neuroimage 226, 117548.

Associated Data

    This section collects any data citations, data availability statements, or supplementary materials included in this article.

    Data Citations

    1. Oliva V, Pickering T, Brooks J. 2021. Simultaneous brain, brainstem and spinal cord pharmacological-fMRI reveals endogenous opioid network interactions mediating attentional analgesia. Open Science Framework. [DOI] [PMC free article] [PubMed]
    2. Oliva V, Pickering T, Brooks J. 2021. Probabalistic anatomical gray matter masks of Periaqueductal grey, Locus coeruleus and Rostroventromedial medulla. Open Science Framework. [DOI]

    Supplementary Materials

    Figure 2—source data 1. 2A Pain ratings across contrasts by drug.
    Figure 2—source data 2. 2C BOLD parameter estimates from spinal nociception cluster versus pain rating.
    Figure 2—source data 3. 2D BOLD parameter estimates for spinal nociception cluster.
    Figure 2—source data 4. 2E BOLD parameter estimates for spinal interaction cluster.
    Figure 2—source data 5. Pain ratings across conditions by drug.
    Figure 2—figure supplement 1—source data 1. Figure 2 - figure supplement 1 Second level three way ANOVA of drug versus placebo.
    Figure 2—figure supplement 2—source data 1. Figure 2 - figure supplement 2A Difference in pain score between High|Hard and Easy|High conditions by drug.
    Figure 2—figure supplement 2—source data 2. Figure 2 - figure supplement 2B Difference in BOLD parameter estimates from spinal nociceptive cluster between High|Hard and Easy|High conditions by drug.
    Figure 2—figure supplement 2—source data 3. Figure 2 - figure supplement 2C BOLD parameter estimates from spinal nociceptive cluster in High|Hard condition by drug.
    Figure 2—figure supplement 3—source data 1. Figure 2 - figure supplement 3 RSVP intercharacter intervals and thermode target temperatures for High thermal stimulus.
    Figure 3—source data 1. Cluster sizes, peak Z-scores, locations and anatomical locations for each experimental contrast.
    Figure 4—source data 1. gPPI parameter estimates across connections and conditions.
    Figure 5—source data 1. gPPI parameter estimates for connections by drug.
    Transparent reporting form

    Data Availability Statement

    Source data is provided for Figure 2 (A, C, D, E, and supplementary 1, 2 and 3) and Figure 4 (B) and Figure 5. Un-thresholded statistical maps have been shared in Open Science Framework and are available at the following link: https://osf.io/dtpr6/ and the brainstem regional masks of PAG, LC, RVM are available from https://osf.io/xqvb6/.

    The following dataset was generated:

    Oliva V, Pickering T, Brooks J. 2021. Simultaneous brain, brainstem and spinal cord pharmacological-fMRI reveals endogenous opioid network interactions mediating attentional analgesia. Open Science Framework.

    The following previously published dataset was used:

    Oliva V, Pickering T, Brooks J. 2021. Probabalistic anatomical gray matter masks of Periaqueductal grey, Locus coeruleus and Rostroventromedial medulla. Open Science Framework.


    Articles from eLife are provided here courtesy of eLife Sciences Publications, Ltd

    RESOURCES