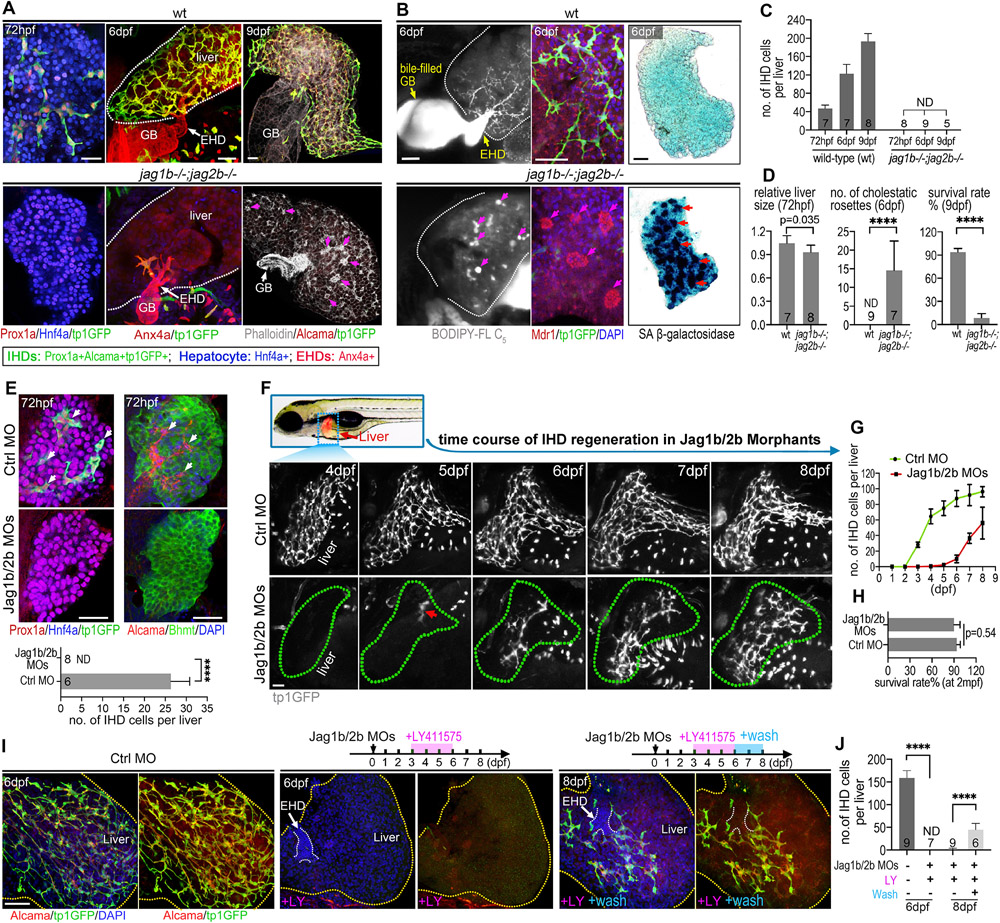
Figure 1. Developmental loss of intrahepatic duct cells regenerates upon resumption of Jagged/Notch signaling.
(A) Confocal images of zebrafish livers at embryonic (72 hpf) and juvenile (6 dpf and 9 dpf) stages in wild-type (wt) with IHD cells and jag1b/2b mutant (jag1b−/−;2b−/−) without IHD cells. IHD cells (tp1:GFP+/Prox1+/Alcama+/Anx4a+); hepatocytes (Hnf4a+/Prox1a+). F-actin (phalloidin+) staining reveals cholestatic rosettes (magenta arrows) in mutants. (B) BODIPY vital labeling shows ductal bile flow in wt but appears as pooled droplets (magenta arrows) in mutants. White dotted lines indicate liver margin; GB: gallbladder; EHD: extrahepatic duct; Mdr1 staining shows bile canaliculi distributed along the IHD in wt but densely aggregated at the center of cholestatic rosettes (magenta arrows) in mutants; SA β-gal staining shows cellular senescence (red arrows) in mutants but not in wt. (C) Number of IHD cells per liver in wt and jag1b/2b mutants. Animal numbers are indicated in graph. (D) Relative liver size, number of cholestatic rosettes, and survival rates of wt and jag1b/2b mutants. Survival rates from 4 independent experiments (n=80 wt; n=98 mutants). (E) IHD cells (arrows) found in developing livers from control are absent in Jagged1b/2b morphants at 72 hpf. IHD cells (Alcama+/tp1GFP+/Prox1a+), hepatocytes (Hnf4a+/Bhmt+). n is noted in graph. (F) (top) Dotted blue rectangle outlines area with liver (fabp10a:DsRed+) imaged in live zebrafish. (bottom) Live time course of the same liver from 4-8 dpf with IHD cells labeled (tp1:GFP+) in wt control and Jagged1b/2b morphant. Red arrow indicates initial regenerated IHD cells. Green dotted lines indicate liver margin. (G) Number of IHD cells in control (n=4) and Jag1b/2b morphant (n=5) livers from time course experiments. (H) Survival rates at 2 months post fertilization (mpf) (n=80 wt; n=79 morphants). (L) IHD cells (Alcama+/tp1:GFP+) in control and Jag1b/2b morphants with LY411575 treatment at 6 dpf and LY411575 wash out at 8 dpf. (M) Quantification of IHD cell number in L at 6 dpf and 8 dpf. Scale bars, 50μm. ND: not detected.

