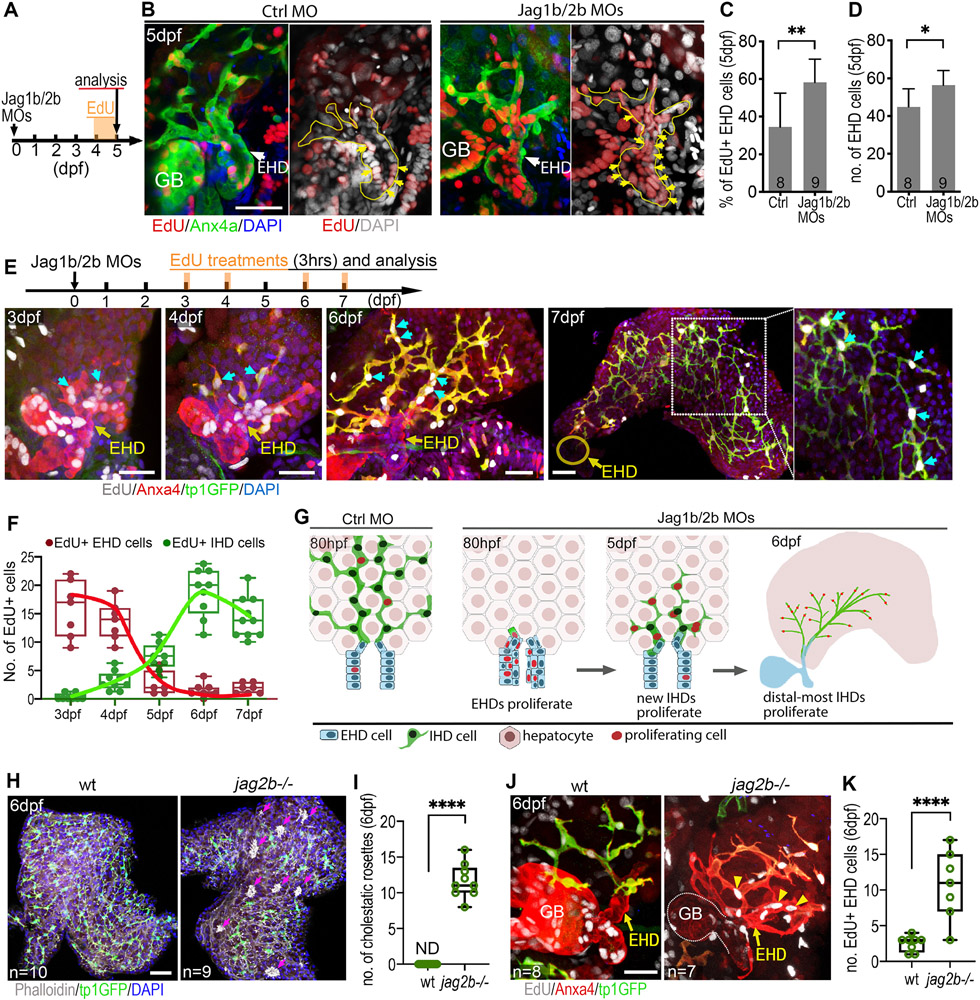
Figure 4. Extrahepatic duct cells contribute proliferative progenitors to the regenerating liver.
(A-D) (A) EdU incorporation experiment to assess cell proliferation from 4 to 5 dpf. (B) EdU+ EHD cells (yellow arrows) in the EHDs of control and Jag1b/2b morphants at 5 dpf. EHD margin outlined with yellow dotted lines. (C) Percentage of EdU+ EHD cells and (D) total EHD cell numbers in control and Jag1b/2b morphants at 5 dpf. Number of animals examined indicated. (E, F) (E, top) EdU treatment was pulsed in Jag1b/2b morphants for 3hrs at indicated time points. (E, bottom) EdU+ EHD cells (cyan arrows) in the EHDs and regenerated IHDs of Jag1b/2b morphants at 3 dpf (n=7), 4 dpf (n=7), 6 dpf (n=9), and 7 dpf (n=10). (F) Number of EdU+ cells in the EHDs or IHDs of Jag1b/2b morphants at indicated stages. (G) Model summarizing proliferation pattern during normal IHD development versus IHD regeneration in Jag1b/2b morphants. During development, proliferation is low in the EHD and scattered in the IHDs, whereas during regeneration, EHD cells initially proliferate to supply progenitors to the liver. These progenitors subsequently differentiate into IHD cells in the liver and continue to proliferate, more robustly in the distal-most IHD cells. (H, I) Liver in wt and jag2b−/− mutants at 6 dpf showing hepatic cholestatic rosettes (magenta arrows) revealed by phalloidin-dense staining (white clusters) in areas of the mutant liver devoid of tp1:GFP+ IHD cells, but not in wt, (I) as quantified. (J, K) EdU+ cells in the EHD of wt and jag2b−/− mutants at 6 dpf (following an 8hr EdU treatment) showing increased cell proliferation in an expanded mutant EHD (yellow arrowheads), (K) as quantified (n= # of livers). Scale bars, 50μm.

