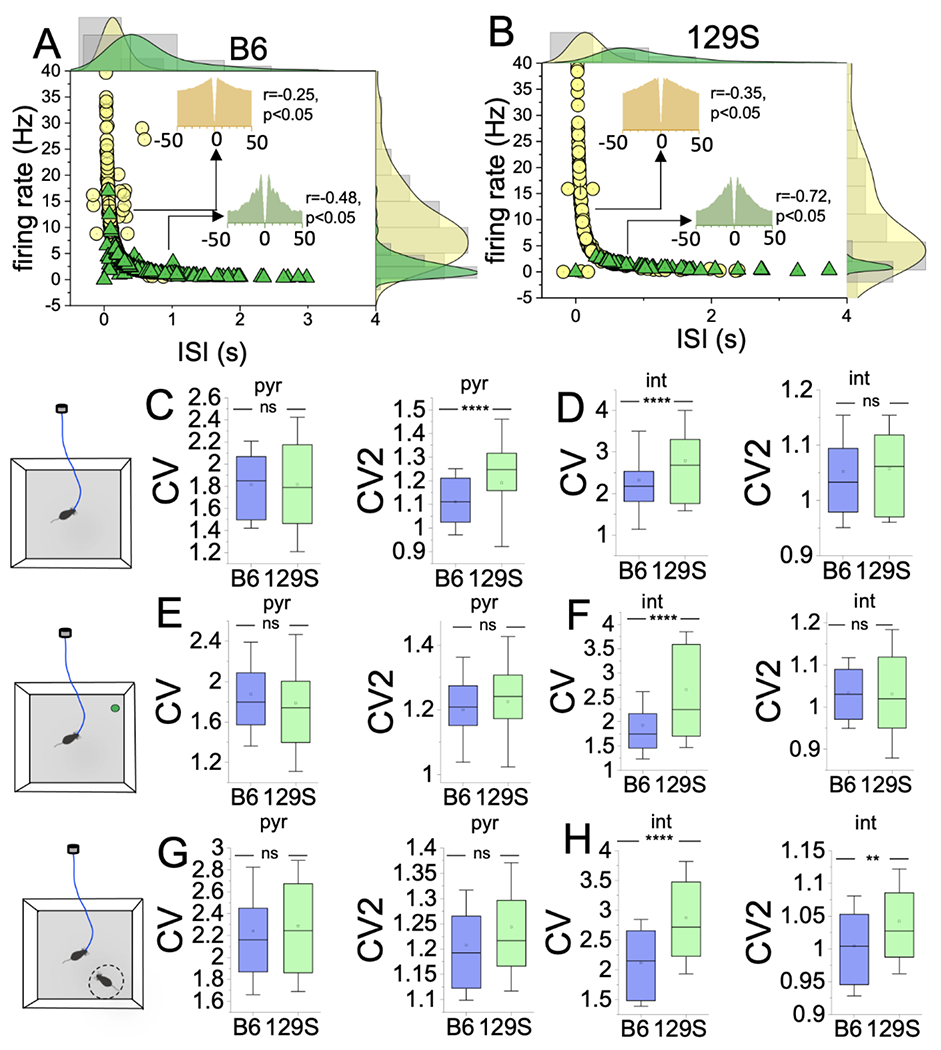
Figure 6: 129S mouse putative interneurons show significant FR variability and irregularity.

A-B, Edge histograms demonstrating the clustering of putative pyr and int units based on mean FR (HZ) and ISI (sec) scores. Putative pyr cells show significant ISI variability, and int units show FR variability (Pearson’s r).
Graphs comparing CV and CV2 scores for putative neurons detected in B6 and 129S CA1 during behavioral tasks (T-test).
C, Open field (spatial exploration task). The CV score was not significantly different for B6 and 129S putative pyr units (p=0.92). The 129S pyr cells exhibited higher CV2 scores than the B6 neurons (p<0.0001).
D, Spatial exploration task. The CV score was significantly elevated in 129S int versus B6 units (p<0.0001). The CV2 score was not significantly different (B6 vs 129S, p=0.44)
E, Object exploration: pyr CV (ns; p=0.11), pyr CV2 (ns; p=0.053).
F, Object exploration: int CV (p<0.0001), CV2 (ns; p=0.96).
G, Sociability tasks: pyr CV (ns; p=0.65), pyr CV2 (ns; p=0.17).
H, Sociability tasks: int CV (p<0.0001), CV2 (p=0.001).
