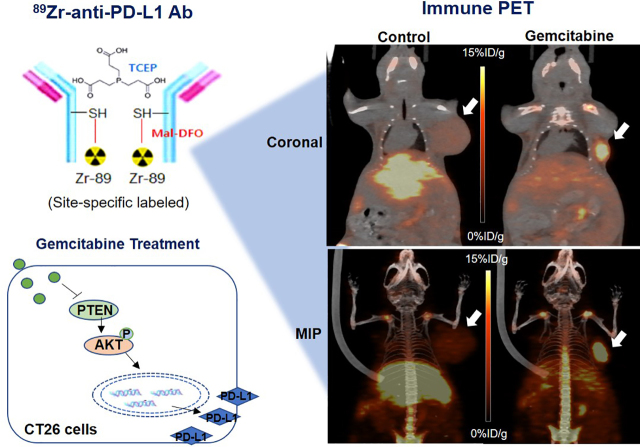
Visual Abstract
Keywords: 89Zr, PD-L1, antibody, cancer, gemcitabine, immuno-PET
Abstract
We developed an 89Zr-labeled anti–programmed death ligand 1 (anti-PD-L1) immune PET that can monitor chemotherapy-mediated modulation of tumor PD-L1 expression in living subjects. Methods: Anti-PD-L1 underwent sulfohydryl moiety–specific conjugation with maleimide-deferoxamine followed by 89Zr radiolabeling. CT26 colon cancer cells and PD-L1–overexpressing CT26/PD-L1 cells underwent binding assays, flow cytometry, and Western blotting. In vivo pharmacokinetics, biodistribution, and PET imaging were evaluated in mice. Results: 89Zr-anti-PD-L1 synthesis was straightforward and efficient. Sodium dodecyl sulfate polyacrylamide gel electrophoresis showed that reduction produced half-antibody fragments, and matrix-assisted laser desorption ionization time-of-flight analysis estimated 2.18 conjugations per antibody, indicating specific conjugation at the hinge-region disulfide bonds. CT26/PD-L1 cells showed 102.2 ± 6.7-fold greater 89Zr-anti-PD-L1 binding than that of weakly expressing CT26 cells. Excellent target specificity was confirmed by a drastic reduction in binding by excess cold antibody. Intravenous 89Zr-anti-PD-L1 followed biexponential blood clearance. PET/CT image analysis demonstrated decreases in major organ activity over 7 d, whereas high CT26/PD-L1 tumor activity was maintained. Again, this was suppressed by excess cold antibody. Treatment of CT26 cells with gemcitabine for 24 h augmented PD-L1 protein to 592.4% ± 114.2% of the control level and increased 89Zr-anti-PD-L1 binding, accompanied by increased AKT (protein kinase B) activation and reduced phosphatase and tensin homolog (PTEN). In CT26 tumor–bearing mice, gemcitabine treatment substantially increased tumor uptake from 1.56% ± 0.48% to 6.24% ± 0.37% injected dose per gram (tumor-to-blood ratio, 34.7). Immunoblots revealed significant increases in tumor PD-L1 and activated AKT and a decrease in PTEN. Conclusion: 89Zr-anti-PD-L1 showed specific targeting with favorable imaging properties. Gemcitabine treatment upregulated cancer cell and tumor PD-L1 expression and increased 89Zr-anti-PD-L1 uptake. 89Zr-anti-PD-L1 PET may thus be useful for monitoring chemotherapy-mediated tumor PD-L1 modulation in living subjects.
Immune checkpoint therapy is revolutionizing treatment for cancers that evade immune surveillance, and programmed death ligand 1 (PD-L1) stands out as a promising target (1). This transmembrane protein engages with programmed cell death protein 1 (PD1) on T cells to suppress their proliferation, survival, and cytokine production (2). Accordingly, inhibitors that block PD-1/PD-L1 interaction show antitumor effects (1). However, treatment benefit remains limited to only a fraction of cancer patients.
The first obvious question for predicting a PD-L1 blockade response is whether the target protein is sufficiently present (3). Immunohistochemistry of biopsied specimen is limited by inter- and intralesion heterogeneities (4) and is unable to assess the whole-tumor PD-L1 amount that may influence immunotherapy efficacy (5). PET can overcome limitations of immunohistochemistry such as sampling error, invasiveness, and the difficulty of serial examinations (6). Immuno-PET has thus been demonstrated to detect tumor PD-L1 with high sensitivity and resolution (7,8).
It is also critical to recognize that tumor PD-L1 status changes over time (9). This dynamic nature of expression might contribute to varied therapeutic responses, underscoring the importance of better understanding tumor PD-L1 regulation (10). In addition to transcriptional regulation by inflammatory signaling (11), there is rising interest in the influence of chemotherapeutic agents (12–15). Given the current clinical trials combining immunotherapy with conventional chemotherapeutics (16), the ability to monitor the immunomodulatory effects of chemotherapeutic drugs will benefit their rational use. However, current investigations are limited by their dependence on peripheral blood (17) rather than tumor PD-L1 status. Immune PET may be able to assess changes in the immunologic status of the tumor by chemotherapeutics.
In this study, we developed an antibody site-specifically labeled with 89Zr that allows high-resolution and specific imaging of tumor PD-L1. We then explored the capacity of this radiotracer to noninvasively monitor changes in PD-L1 expression on cancer cells and tumors before and after treatment with gemcitabine. We further explored the signaling pathways that are involved.
MATERIALS AND METHODS
Cell Culture and Reagents
CT26 mouse colon cancer cells (American Type Culture Collection) were maintained in 5% CO2 at 37°C in RPMI 1640 supplemented with 10% fetal bovine serum, 2 mM l-glutamine, and 100 U/mL penicillin-streptomycin. Gemcitabine, olaparib, 5-fluorouracil, cisplatin, and 4,6-dimorpholino-N-(4-nitrophenyl)-1,3,5-triazin-2-amine (MHY1485) were from Sigma Chemicals. Rapamycin was from LC Laboratories.
Preparation of Cells Stably Overexpressing PD-L1
We used a Cd274 (NM_021893) mouse tagged open-reading-frame clone lentiviral particle from Origene. The lentiviral particle was constructed with the pLenti-C-mGFP-P2A-Puro tagged cloning vector, which contains the mGFP gene and the puromycin resistance gene as selection markers. PD-L1–overexpressing CT26/PD-L1 cells were prepared by infection with the lentivirus followed by selection 72 h later under 10 μg/mL puromycin. Single-cell clones were picked up, amplified in medium containing puromycin, and stored in liquid nitrogen. The clone with the greatest specific anti-PD-L1 binding was used.
Deferoxamine Conjugation and Site-Specific 89Zr Labeling
Rat IgG against mouse PD-L1 (10F.9G2; BioXcell) was site-specifically conjugated with deferoxamine-maleimide on sulfohydryl residues. Briefly, 2 mg of antibody were incubated with 100 mM tris(2-carboxyethyl)phosphine for 20 min at room temperature (RT) at a 1:100 molar ratio. Sulfohydryl residues of anti-PD-L1 diluted in 0.1 M sodium phosphate containing 150 mM NaCl and 1 mM ethylene diamine tetraacetic acid were conjugated for 60 min at RT with 56.4 μL of 2 mM N-(3,11,14,22,25,33-hexaoxo-4,10,15,21,26,32-hexaaza-10,21,32-trihydroxytetratriacontane) maleimide (deferoxamine-maleimide). The molar ratio of deferoxamine-maleimide to antibody was 60:1. 89Zr-oxalate (50 μL; Korea Atomic Energy Research Institute) was neutralized with 25 μL of 2 M Na2CO3 and mixed with deferoxamine-conjugated anti-PD-L1 in 75 μL of 0.5 M 4-(2-hydroxyethyl)-1-piperazineethanesulfonic acid buffer (pH 7.5). After 60 min of incubation at RT, the mixture was eluted through a PD-10 column with 0.25 M sodium acetate containing 0.5% gentisic acid. Fractions of 0.5 mL were collected and counted for radioactivity, and the peak activity fraction was used.
Matrix-Assisted Laser Desorption Ionization (MALDI) Time of Flight
Intact and deferoxamine-conjugated (by tris[2-carboxyethyl]phosphine reduction) anti-PD-L1 was analyzed by mass spectrometry. Samples mixed (1:1 v/v) with sinapinic acid matrix solution (10 mg/mL) were prepared in 50% acetonitrile and 0.1% trifluoroacetic acid, and 1 μL was deposited and air dried on a ground stainless steel 384-density MALDI plate. ZipTips (Millipore) were used to desalt the samples. MALDI mass spectra and tandem mass spectra were acquired using a MALDI time-of-flight 5800 System (AB SCIEX) with a linear mode and an accelerating voltage of 25 kV.
Polyacrylamide Gel Electrophoresis (PAGE) and Autoradiography
For nonreducing sodium dodecyl sulfate PAGE, 2-μg antibody samples were diluted with water and ×5 nonreducing sample buffer without dithiothreitol. Samples were boiled at 95°C for 10 min and then separated on an 8% sodium dodecyl sulfate PAGE gel by electrophoresis. The gel was stained with 0.5% Coomassie blue. Autoradiography was also performed for 89Zr-anti-PD-L1, which was separated by 8% native PAGE with sample buffer without sodium dodecyl sulfate or dithiothreitol.
Radiochemical Purity and Stability
Radiochemical purity and stability were assessed by radio–instant thin-layer chromatography. The radiotracer was incubated in fetal bovine serum or phosphate-buffered saline at 37°C for 0, 1 or 4 d. Radio–instant thin-layer chromatography was then performed using 50 mM ethylene diamine tetraacetic acid (pH 5.5) as an eluent on instant thin-layer chromatography glass microfiber chromatography paper impregnated with silica gel. Under this condition, intact radiolabeled antibody remains at baseline while free 89Zr4+ ions and 89Zr-ethylene diamine tetraacetic acid migrate at the solvent front.
Cell Binding Assays
CT26 and CT26/PD-L1 cells were incubated with 74 kBq of 89Zr-anti-PD-L1 for 60 min at 37°C in RPMI 1640. The cells were washed twice with cold phosphate-buffered saline, lysed with 0.5 mL 0.1N NaOH, and measured for radioactivity. Binding specificity was evaluated with 100 nM cold anti-PD-L1.
Flow Cytometry for PD-L1 Expression
Cell surface–expressed PD-L1 was assessed by flow cytometry using a phycoerythrin-conjugated antibody against PD-L1 (clone MIH5). Cells were harvested with nonenzymatic cell-dissociation solution, washed, and incubated with the phycoerythrin antibody for 30 min at RT in phosphate-buffered saline containing 5% fetal bovine serum and 0.2% bovine serum albumin. After washing with fluorescence-activated cell sorting (FACS) buffer, 500 μL of FACS buffer were added, and flow cytometry was performed on a FACSCalibur (BE Biosciences) using CellQuest software.
Immunohistochemistry for Tumor PD-L1 Expression
Frozen tumor sections underwent overnight incubation at 4°C with a primary antimouse PD-L1 antibody (ab213480, 1:200; Abcam). An EnVision detection system kit (peroxidase-conjugated polymer backbone; DAKO) was used to incubate slides with antirabbit secondary antibody. Finally, sections were counterstained with hematoxylin and mounted with coverslips.
Western Blotting of Cultured Cell and Tumor Tissue Protein
Immunoblotting was performed as previously described (18). Overnight incubation was performed at 4°C with rabbit primary antibodies against PD-L1 (ab213480, 1:1,000; Abcam) and phosphorylated forms of AKT (p-AKT) (protein kinase B) (4058S; 1:1,000; Cell Signaling Technology), mammalian target of rapamycin (p-mTOR) (2971S; 1:2,000), and phosphatase and tensin homolog (p-PTEN) (9549S; 1:1,000). After washing with Tris-buffered saline and 0.1% polysorbate 20, membranes were incubated with horseradish peroxidase–conjugated secondary antirabbit IgG antibodies (7074S; 1:2,000 or 1:4,000; Santa Cruz Biotechnology) at RT for 1 h. Immunoreactive protein was detected with enhanced chemiluminescence substrate, and band intensities were quantified as previously described. After visualization of target protein, membranes were stripped and reincubated with antibodies against β-actin (sc47778; Santa Cruz Biotechnology), total forms of AKT (t-AKT) (9272S; Cell Signaling Technology), t-mTOR (2972S), or t-PTEN (9552S).
In Vivo Pharmacokinetics
All animal experiments were conducted in accordance with the National Institutes of Health Guide for the Care and Use of Laboratory Animals and approved by the institute ethics committee. For pharmacokinetic analysis, normal C57BL/6 mice were intravenously injected with 3 MBq of 89Zr-anti-PD-L1. Serially collected blood from the tail vein (5 μL) was measured for radioactivity and expressed as percentage injected dose (%ID) per milliliter. Time–activity curves were fitted by nonlinear regression with GraphPad Prism, version 3.02, using 2-phase exponential decay equations. Early (K 1) and late (K 2) clearance rate constants and half-lives (early distribution [T½α] and late clearance [T½β]) were calculated as parameters.
Murine Tumor Models and Gemcitabine Treatment
Tumor models were prepared in BALB/c mice by subcutaneous injection of 5 × 10⁶ CT26 or CT26/PD-L1 cells into the right shoulder. When tumor diameter reached 0.5 cm at approximately 10 d after cell inoculation, biodistribution and PET imaging were performed with or without cold anti-PD-L1 blocking.
The effect of gemcitabine was investigated in CT26 tumor–bearing mice. Randomly allocated control and gemcitabine groups were intraperitoneally injected with dimethylsulfoxide vehicle and 100 mg/kg gemcitabine, respectively, every 3 d 3 times.
In Vivo PET Imaging and Biodistribution Studies in Tumor Models
Mice intravenously injected with 4.8 MBq of 89Zr-anti-PD-L1 were isoflurane-anesthetized and underwent PET/CT on a Siemens Inveon scanner. The specificity of the uptake was assessed by a 1-h preinjection of a 5:1 molar ratio of cold anti-PD-L1 antibody over the radiotracer. PET-based tissue radioactivity was measured on non–attenuation-corrected coronal images by placing regions of interest on the blood pool, major organs, and tumor. Tumor margins were automatically delineated using a 50% threshold of maximal activity to include the entire tumor while excluding normal tissue. After PET/CT imaging, the mice were sacrificed by cervical dislocation, and major organs and tumors were extracted, weighed, and measured for radioactivity.
Statistical Analysis
Data are presented as means ± SDs unless otherwise specified. Significant differences between groups were analyzed by 2-tailed unpaired Student t tests for 2 groups and ANOVA with Tukey post hoc tests for 3 or more groups. P values of less than 0.05 were statistically significant.
RESULTS
Deferoxamine Conjugation and Site-Specific 89Zr Labeling
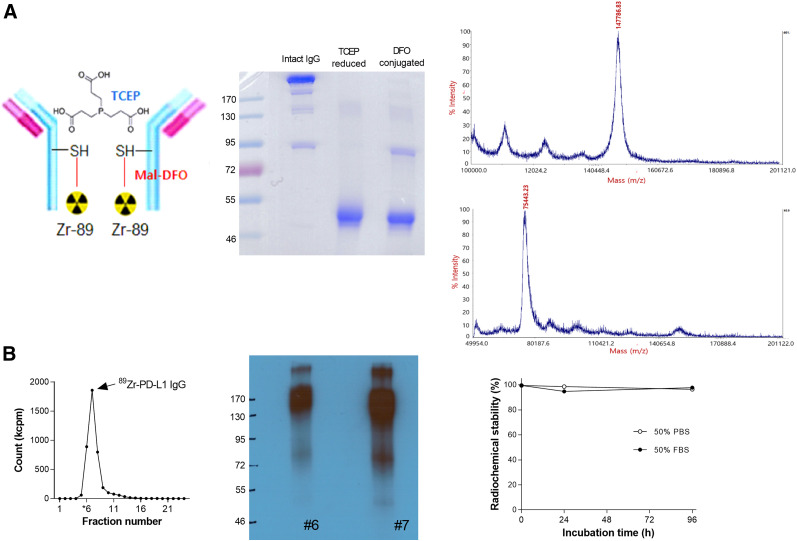
B7-1H anti-PD-L1 was conjugated on sulfohydryl residues (Fig. 1A). Nonreduced sodium dodecyl sulfate-PAGE demonstrated that tris(2-carboxyethyl)phosphine completely reduced target disulfide bonds to produce fragments half the size of the intact antibody, which remained reduced after deferoxamine conjugation (Fig. 1A). The MALDI peak measured by mass spectrometry revealed a mass of 147,786.83 Da for unmodified antibody and 75,443.23 Da for deferoxamine-conjugated antibody (Fig. 1A). This indicates an average of 2.18 conjugations per antibody, which likely corresponds to the 2 hinge-region disulfide bonds.
FIGURE 1.
89Zr-labeling of anti-PD-L1. (A) Diagram of 89Zr-anti-PD-L1 (left), nonreduced sodium dodecyl sulfate PAGE (middle), and MALDI time-of-flight results (right). (B) Radioactivity profile of PD-10 column–eluted fractions (left), autoradiography on native PAGE (middle), and in vitro stability (right). DFO = deferoxamine; FBS = fetal bovine serum; Mal = maleimide; PBS = phosphate-buffered saline; SH = sulfohydryl; TCEP = tris(2-carboxyethyl)phosphine
89Zr labeling was reproducible, with an efficiency of more than 80% (Fig. 1B). PAGE analysis of the first peak elute fraction displayed a clear radioactive band at the 170-kD region (Fig. 1B). Radiochemical purity was more than 99%, and specific activity was 0.8 mCi/mg. Radiochemical stability by instant thin-layer chromatography showed that the radiolabel was more than 96% intact after 96 h of incubation in 50% fetal bovine serum, as well as in phosphate-buffered saline (Fig. 1B).
Cancer Cell Binding
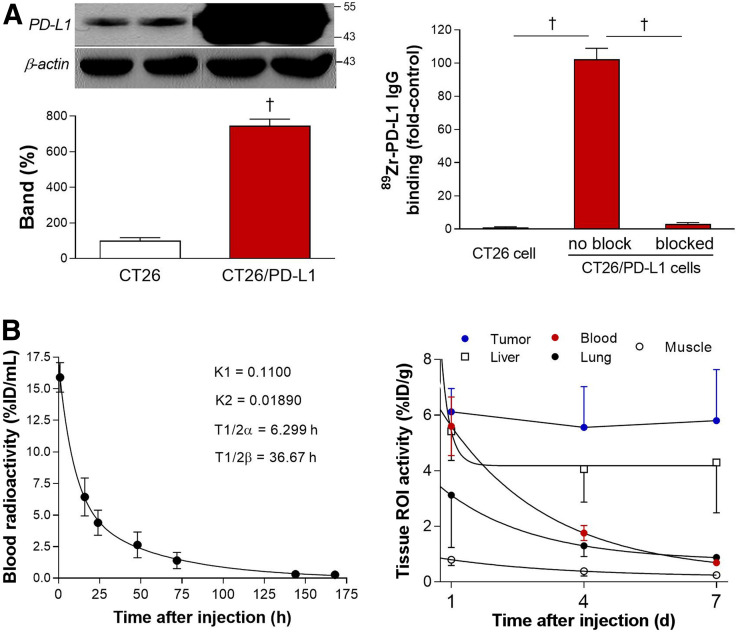
Compared with parental CT26 cells, CT26/PD-L1 cells displayed 7.5 ± 0.4-fold higher levels of PD-L1 protein (Fig. 2A). Cell binding assays revealed high 89Zr-anti-PD-L1 binding to CT26/PD-L1 cells—binding that reached 100.2-fold of the binding to CT26 cells. This binding was completely abolished to 3.0% ± 0.8% of the unblocked level by 100 nM cold anti-PD-L1 (Fig. 2A).
FIGURE 2.
Cell binding and pharmacokinetic properties. (A) Western blotting of PD-L1 (left) and 89Zr-anti-PD-L1 binding (right) are shown for CT26 and CT26/PD-L1 cancer cells. Bars are means ± SDs. † P < 0.005. (B) Time-dependent blood clearance in normal mice shows early and late rate constants (K 1 and K 2) and half-lives (T½α and T½β) (left). Pharmacokinetic profile in major organs and tumor was measured by PET-based analysis in CT26/PD-L1 tumor mice (n = 5) at 1, 4, and 7 d (right). ROI = region of interest.
In Vivo Pharmacokinetic Properties
In normal mice, intravenous 89Zr-anti-PD-L1 followed a biexponential pattern of blood clearance. Early K 1 and late K 2 rate constants of 0.11 and 0.0189, respectively, led to aT½α of 6.3 h and a T½β of 36.7 h (Fig. 2B). Region-of-interest analysis of PET/CT images in CT26/PD-L1 tumor mice showed that although blood pool, lung, liver, and muscle activity decreased over time, tumor activity stayed at a high level for up to 7 d (Fig. 2B). Hence, a time point of 7 d after injection was selected for the rest of the experiments.
Tissue Biodistribution and PET Imaging
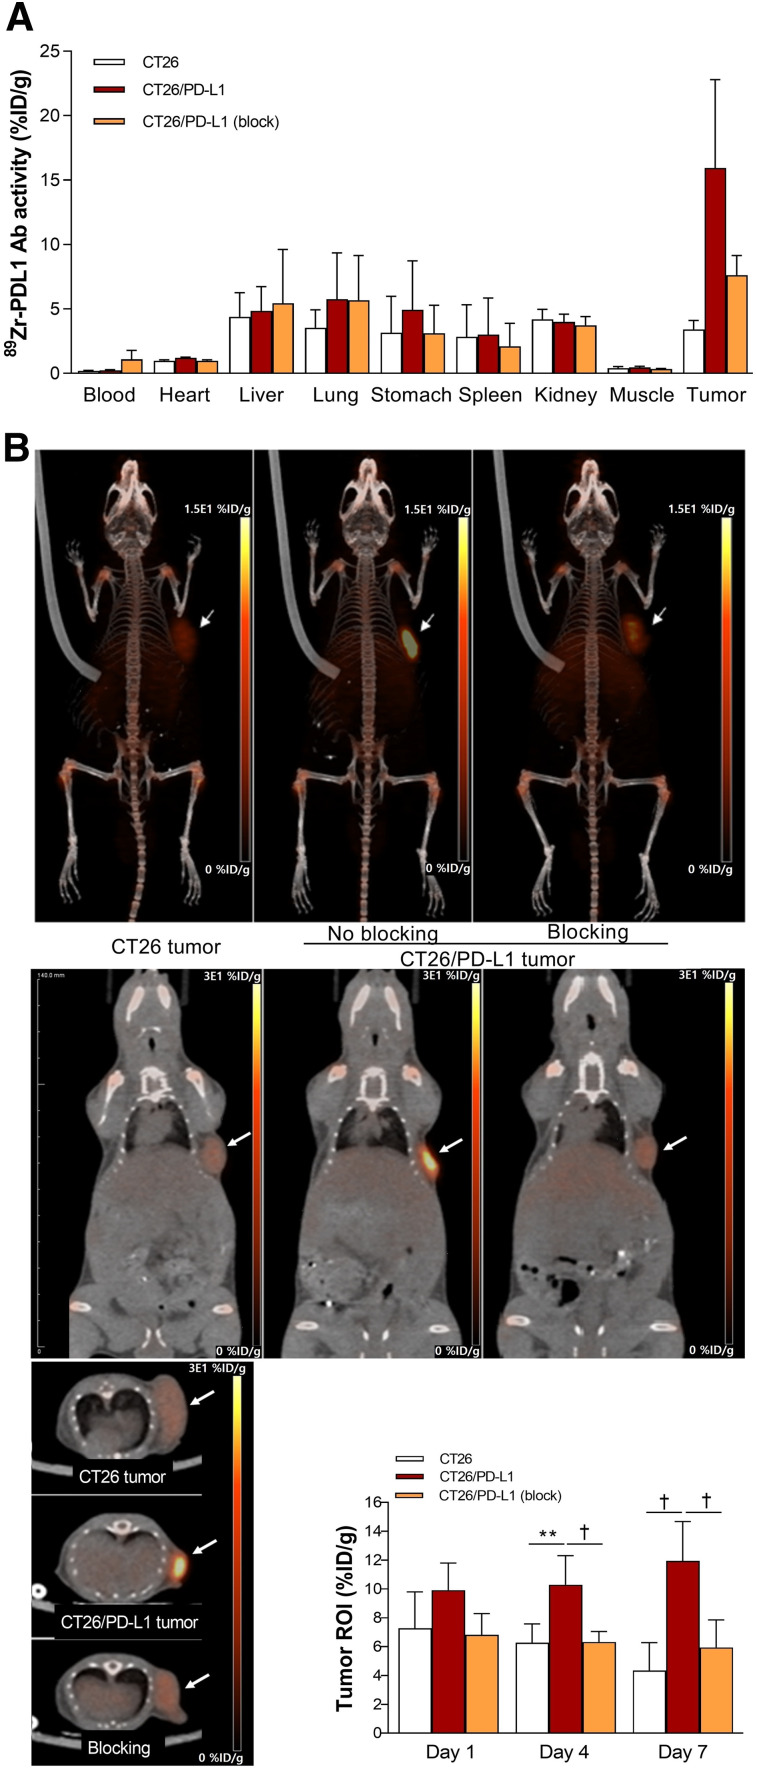
Biodistribution on day 7 revealed high 89Zr-anti-PD-L1 accumulation in CT26/PD-L1 tumors, reaching 12.6 ± 5.1 %ID/g, which was 3.9-fold that in CT26 tumors. Preinjection of cold anti-PD-L1 caused a 66.1% reduction in CT26/PD-L1 tumor uptake, confirming its specificity (Fig. 3A). Remarkably, liver, spleen, and renal activities were relatively low.
FIGURE 3.
Biodistribution and tumor imaging. (A) Biodistribution in CT26 and CT26/PD-L1 tumor–bearing mice with or without blocking at day 7. (B) Representative maximum-intensity-projection (top), coronal (middle), and transaxial (bottom) PET images. PET-based tumor uptakes are also shown. All bars are means ± SDs of values from 5 mice per group. **P < 0.01. † P < 0.005. Ab = antibody; ROI = region of interest.
PET/CT imaging displayed clear tumor visualization from 4 d (Fig. 3B). Again, there was relatively low uptake in the liver, spleen, and kidneys. Image-based CT26/PD-L1 tumor uptake slightly increased from day 4 to day 7, whereas uptake in CT26 tumors slightly decreased (Fig. 3B). CT26/PD-L1 tumor uptake was significantly reduced by cold anti-PD-L1.
Chemotherapy Induces PD-L1 Expression on Cancer Cells
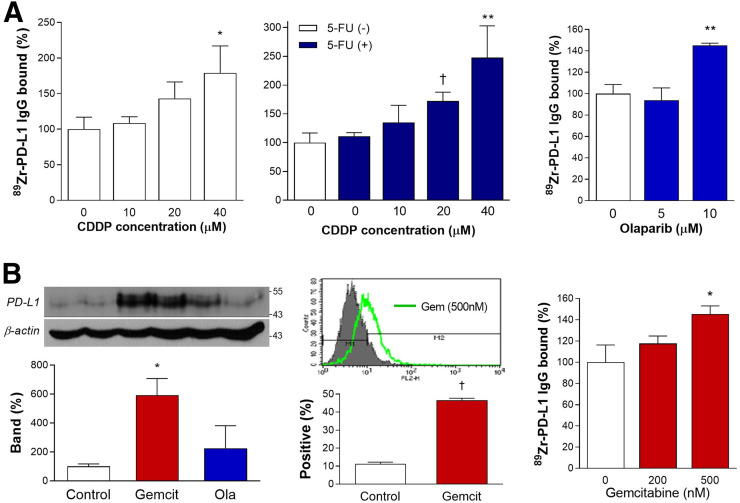
89Zr-anti-PD-L1 binding to CT26 cells was cisplatin dose–dependently increased to 179.1% ± 38.0% of controls by 24 h of treatment and was further increased to 247.6% ± 55.1% when 500 μM 5-fluorouracil was combined. Binding was increased by 10 μM olaparib to 145.1% ± 2.2% of the level in controls (Fig. 4A).
FIGURE 4.
Effects of chemotherapeutic agents on CT26 cells. (A) Stimulatory effects of 24-h treatment with graded doses of cisplatin (CDDP) alone (left), CDDP plus 5-fluorouracil (middle), or olaparib (right) on 89Zr-anti-PD-L1 binding. (B) PD-L1 immunoblots and β-actin–corrected band (left), flow cytometry of PD-L1–positive cells (middle), and 89Zr-anti-PD-L1 binding (right). Bars are means ± SDs. Binding data are from triplicate samples per group. *P < 0.05, compared with controls. **P < 0.01, compared with controls. † P < 0.005, compared with controls.
Immunoblotting revealed that CT26 cell PD-L1 expression was substantially increased to 592.4% ± 114.2% and 224.8% ± 155.9% of controls by 50 nM gemcitabine and 10 μM olaparib, respectively (Fig. 4B). FACS analysis confirmed that 24 h gemcitabine treatment increased PD-L1–positive CT26 cells from 11.3% ± 0.9% at baseline to 46.6% ± 1.0% (Fig. 4B). Gemcitabine treatment at 500 nM increased 89Zr-anti-PD-L1 binding to 145.4% ± 7.8% of controls (Fig. 4B).
Roles of AKT and PTEN Signaling
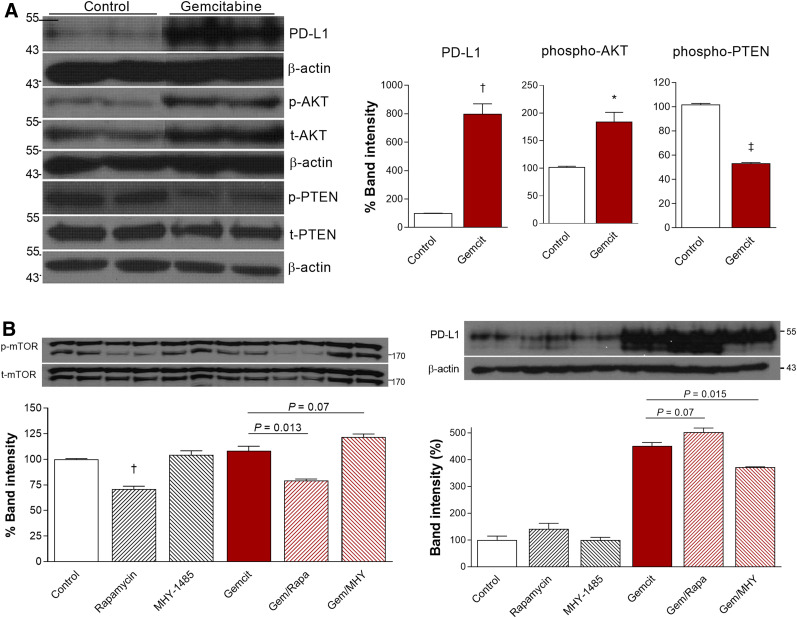
Western blot analysis showed that 500 nM gemcitabine substantially increased CT26 cell PD-L1 protein to 799.9% ± 70.1% of the control level (P < 0.005). Among potential signaling proteins, gemcitabine treatment increased p-AKT to 184.3% ± 17.0% (P < 0.05) and reduced p-PTEN to 53.4% ± 0.6% of the control level (P < 0.001; Fig. 5A). PD-L1 expression stimulated by gemcitabine was modestly augmented from 451.0% ± 13.6% to 502.8% ± 15.5% of the control level (P = 0.07) by the mTOR inhibitor rapamycin, whereas it was suppressed to 372.9% ± 0.8% of the control level (P = 0.015) by the specific mTOR activator MHY1485 (Fig. 5B). Together, these results demonstrate roles for AKT activation and reduced PTEN activation in the ability of gemcitabine to upregulate PD-L1 and further suggest a role for mTOR signaling.
FIGURE 5.
AKT and PTEN signaling in gemcitabine effect on CT26 cells. (A) Immunoblots and quantified protein band intensities (corrected by appropriate controls) for PD-L1, p-AKT, and p-PTEN. (B) Effects of rapamycin (1 μM) and MHY1485 (2 μM) on immunoblots and band intensities for p-mTOR (corrected by t-mTOR) and PD-L1 (corrected by β-actin). Bars are means ± SDs. *P < 0.05. † P < 0.005. ‡ P < 0.001.
In Vivo Effects of Gemcitabine on Tumors
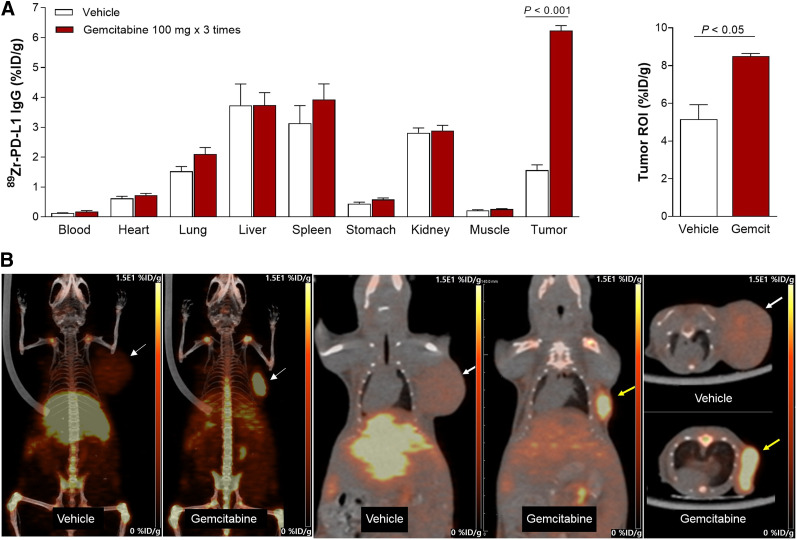
In murine models at 7 d, gemcitabine substantially enhanced CT26 tumor 89Zr-anti-PD-L1 uptake to 6.24 ± 0.37 %ID/g, compared with only 1.56 ± 0.48 %ID/g in controls (P < 0.005; Fig. 6A). Tumor-to-blood ratios were 38.2 ± 11.3 and 11.9 ± 2.78 for gemcitabine and control groups, respectively. PET/CT recapitulated these findings by showing significantly higher CT26 tumor uptake (8.5 ± 0.14 vs. 5.15 ± 0.78 %ID/g, P < 0.05) and tumor-to-tissue ratios after gemcitabine treatment (Fig. 6B).
FIGURE 6.
Effect of gemcitabine on tumor 89Zr-anti-PD-L1 uptake. (A) Biodistribution in CT26 tumor mice treated with vehicle or gemcitabine at day 7 (left). PET-based tumor activity is shown on right. Data are mean ± SD of %ID/g (n = 5 per group). (B) Representative maximum-intensity-projection (left), coronal (middle), and transaxial (right) PET images of vehicle- and gemcitabine-treated animals. ROI = region of interest.
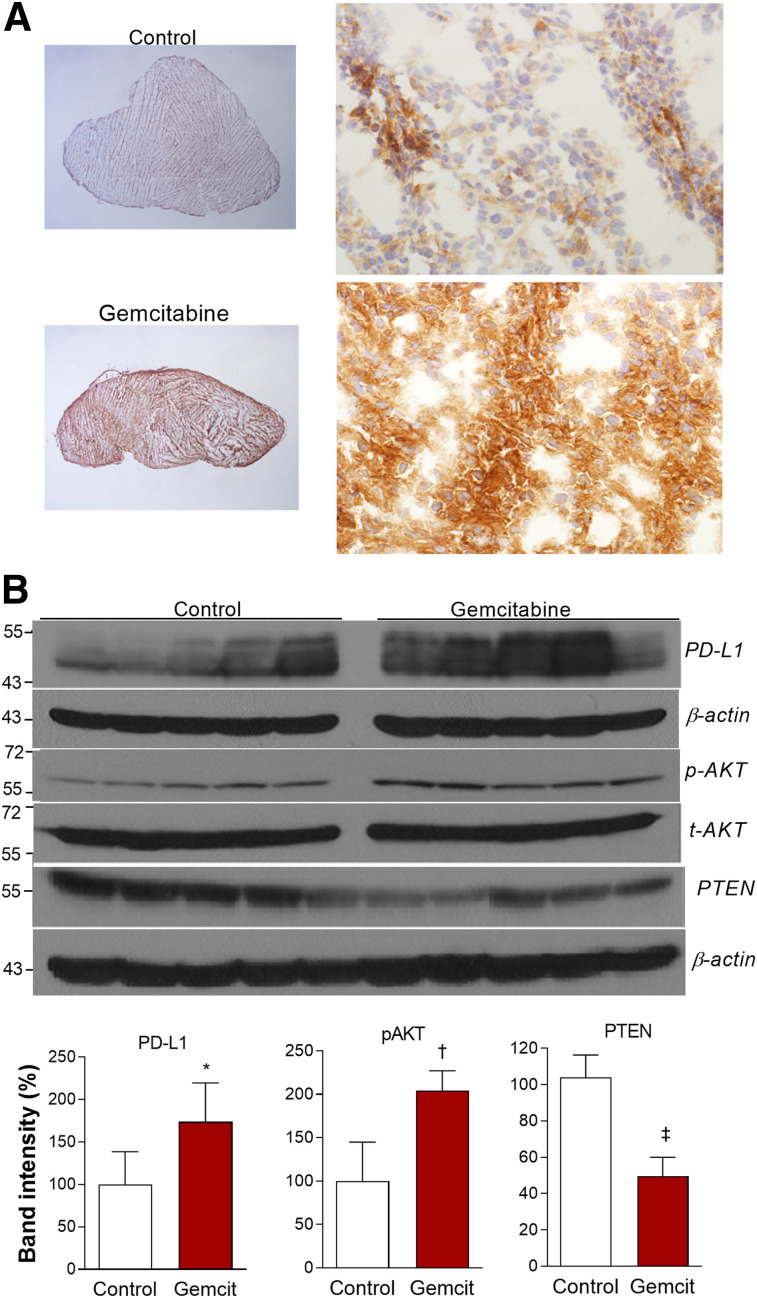
Immunohistochemistry confirmed strong PD-L1 staining in CT26 tumor tissue from gemcitabine-treated mice but weak staining in controls (Fig. 7A). Finally, CT26 tumor tissues revealed that PD-L1 expression (P < 0.05) and AKT activation (P < 0.005) were significantly increased after gemcitabine treatment, whereas PTEN expression was significantly suppressed, (P < 0.001; Fig. 7B).
FIGURE 7.
Effects of gemcitabine on CT26 tumor expression. (A) Representative tumor PD-L1 immunohistochemistry (magnification, ×12.5 on left and ×400 on right). (B) Immunoblots of tumor tissues (top), and protein band intensities of PD-L1 and PTEN corrected by β-actin and p-AKT corrected by t-AKT (bottom). Bars are means ± SDs (n = 5 per group). *P < 0.05. † P < 0.005. ‡ P < 0.001.
DISCUSSION
In this study, we developed an immune PET that can noninvasively image tumor PD-L1 status. The monoclonal antibody used was a rat IgG2b (10F.9G2) that specifically binds to the extracellular domain of mouse PD-L1. Although rat antibodies are limited in use for clinical translation, the 10F.9G2 antibody has been used in several previous studies to investigate PD-L1 expression and function (19–21). The antibody has been shown to block PD-L1/PD-1 interaction and is used for Western blotting, immunochemistry, FACS, and as a neutralizing antibody. High affinity for PD-L1 comparable to 10F.2H11 antibody (20) and binding specific for PD-L1 were shown (21).
89Zr-anti-PD-L1 showed prominent binding to cancer cells with high PD-L1 expression and had high target specificity, indicating good immunoreactivity. Cysteine-specific conjugation is an elegant way of tailoring the location of 89Zr attachment to antibodies for PET (22). The maleimide-deferoxamine conjugation technique we exploited has not been reported for 89Zr labeling of anti-PD-L1, although it has been used for other antibodies. A very recent study successfully conjugated anti-PD-L1 to deferoxamine chelators site-specifically on enzymatically modified glycans before 89Zr labeling (8). However, this procedure required an overnight reaction at 37°C, whereas our method was straightforward and efficient, with a short 1-h reaction at RT.
Our analysis indicted that that tris(2-carboxyethyl)phosphine treatment led to a site-specific reduction and deferoxamine conjugation of our antibody, likely at the 2 hinge-region disulfide bonds. This finding is consistent with the notion that preferential reduction of the hinge-region disulfide bonds yields monovalent components with free thiol groups that can be used for site-directed labeling (23). Site-specific conjugation allows radioprobe homogeneity and immunoreactivity compared with other nonspecific radiolabeling methods, and its advantages for in vivo imaging are well established.
89Zr-anti-PD-L1 PET visualized CT26/PD-L1 tumors with excellent contrast by 4 d after injection. Accumulation was high in overexpressing CT26/PD-L1 tumors but low in weakly expressing CT26 tumors. Previous studies with 89Zr-labeled antibodies against PD-L1 have shown high splenic uptake, which is attributed to PD-L1–expressing splenic cells. At low tracer doses, the spleen acts as a sink organ that reduces tumor targeting (23). Our radiotracer showed low liver and renal uptake—an advantage for imaging intraabdominal tumors. Spleen uptake was also only modest, likely because we injected a relatively higher radiotracer dose to reduce splenic accumulation. Indeed, it is known that increasing tracer dose can saturate spleen uptake and restore tumor targeting (24).
Because only a small portion of patients responds to checkpoint inhibitors as monotherapy, there is growing interest in combining other chemotherapies to enhance treatment efficacy (16). Each chemotherapeutic drug impacts the tumor microenvironment differently, and selection of the best combination partner requires a better understanding of these behaviors. This study attempted to monitor this effect using PD-L1–targeted immune PET. We tested the effects of the pyrimidine nucleoside analog gemcitabine. Previous studies indicated that gemcitabine shows antitumor activities in a manner less related to drug sensitivity than to the immunogenicity of the tumor (25). Preclinical studies using gemcitabine combined with immune checkpoint inhibitors have shown tumor control and survival that outperformed immunotherapy alone (14).
In our results, gemcitabine increased 89Zr-anti-PD-L1 binding to cancer cells in vitro and uptake in tumors in vivo. In mice, gemcitabine-stimulated uptake was restricted to the tumor, whereas uptake in other organs, including the spleen, was unaffected. This finding was attributed to upregulated PD-L1 levels. Upregulated tumor PD-L1 expression by gemcitabine was previously observed in other cancer types (13,15) and represents an opportunity for inducing a more effective response to immune checkpoint blockade.
Mechanistically, chemotherapeutic drugs might modulate PD-L1 expression in cancer cells through oncogenic signaling. In hepatoma cells, cisplatin-induced PD-L1 upregulation was shown to occur through extracellular-signal-regulated kinase 1/2 activation (12). Another study, on pancreatic cancer cells, suggested that 5-fluorouracil, paclitaxel, or high-dose gemcitabine increased PD-L1 expression through signaling of the Janus kinase signal transducer and activator of transcription (13). In our study, cultured CT26 cells and CT26 tumors showed reduction of the tumor-suppressor PTEN after gemcitabine treatment. PTEN alterations are thought to contribute to tumor escape from PD-1/PD-L1 inhibition (26). Previous studies showed that PTEN loss in malignant cells increased PD-L1 expression (27–29). This finding supports the role of PTEN reduction in the strengthening of tumor PD-L1 expression by gemcitabine.
PTEN is a major negative regulator of AKT signaling (22), and PTEN reduction in tumors is associated with AKT activation (29,30). In our results, gemcitabine-treated CT26 cells and CT26 tumors displayed increased AKT activation accompanying PD-L1 upregulation. Therapeutic AKT targeting is recognized to enhance immune surveillance (31), and early clinical efficacy has been demonstrated. In addition, AKT signaling has been implicated to upregulate cancer PD-L1 expression (30). In glioma cells, AKT activation by PTEN loss increased PD-L1 expression (27). In colon cancer cells, PTEN loss strengthened and pharmacologic AKT inhibition suppressed PD-L1 expression (29). Taken together, the stimulation of PD-L1 expression by gemcitabine could be explained by PTEN reduction that caused AKT activation. This supports the benefit of combining drugs that target oncogenic PTEN and AKT pathways to improve the outcome of immune checkpoint therapies.
Although it would be interesting to explore whether gemcitabine can lead to better efficacy for anti-PD-L1 therapy, the antitumor effect of gemcitabine itself would require adjusting the drug dose and timing with a large number of animals. Therefore, this experiment was beyond the scope of the present study.
Our results suggest that 89Zr-anti-PD-L1 PET could be used in screening for drugs to combine with immune checkpoint therapies. Inducible tumor PD-L1 expression is likely transient rather than persistent (15), and the impact of drug dosage on immunomodulatory effects has yet to be elucidated. Therefore, 89Zr-anti-PD-L1 PET may be helpful for selecting the optimal combination-treatment protocol, including timing, dosage, and sequence of administration for best patient outcomes.
CONCLUSION
Gemcitabine increased CT26 cell PD-L1 expression, and this increase was faithfully represented by augmented cellular 89Zr-anti-PD-L1 binding in vitro and tumor uptake in vivo. Thus, 89Zr-anti-PD-L1 PET may be useful for noninvasively monitoring PD-L1 modulation to screen for conventional drugs that can enhance the efficacy of immune checkpoint therapies.
DISCLOSURE
This research was supported by the Basic Science Research Program through the National Research Foundation of Korea (NRF) funded by the Ministry of Education (2016R1D1A1B03932202) and the NRF grant funded by the Korean government (MIST) (2019R1A2C1084959). No other potential conflict of interest relevant to this article was reported.
KEY POINTS
QUESTION: Can noninvasively based immune PET monitor changes in tumor PD-L1 expression induced by conventional chemotherapy?
PERTINENT FINDINGS: 89Zr-anti-PD-L1 showed PD-L1–dependent specific binding to CT26 cancer cells and provided high-contrast tumor imaging. Gemcitabine increased CT26 cell PD-L1 expression, and this increase was faithfully represented by augmented cellular binding of 89Zr-anti-PD-L1 in vitro and tumor uptake in vivo.
IMPLICATIONS FOR PATIENT CARE: 89Zr-anti-PD-L1 PET may be useful for noninvasively monitoring PD-L1 modulation to screen for conventional drugs that can enhance the efficacy of immune checkpoint therapies.
REFERENCES
- 1. Topalian SL, Hodi FS, Brahmer JR, et al. Safety, activity, and immune correlates of anti-PD-1 antibody in cancer. N Engl J Med. 2012;366:2443–2454. [DOI] [PMC free article] [PubMed] [Google Scholar]
- 2. Butte MJ, Keir ME, Phamduy TB, Sharpe AH, Freeman GJ. Programmed death-1 ligand 1 interacts specifically with the B7-1 costimulatory molecule to inhibit T cell responses. Immunity. 2007;27:111–122. [DOI] [PMC free article] [PubMed] [Google Scholar]
- 3. Song Y, Li Z, Xue W, Zhang M. Predictive biomarkers for PD-1 and PD-L1 immune checkpoint blockade therapy. Immunotherapy. 2019;11:515–529. [DOI] [PubMed] [Google Scholar]
- 4. McLaughlin J, Han G, Schalper KA, et al. Quantitative assessment of the heterogeneity of PD-L1 expression in non-small-cell lung cancer. JAMA Oncol. 2016;2:46–54. [DOI] [PMC free article] [PubMed] [Google Scholar]
- 5. Brodská B, Otevřelová P, Šálek C, Fuchs O, Gašová Z, Kuželová K. High PD-L1 expression predicts for worse outcome of leukemia patients with concomitant NPM1 and FLT3 mutations. Int J Mol Sci. 2019;20:2823. [DOI] [PMC free article] [PubMed] [Google Scholar]
- 6. Meng Y, Sun J, Qv N, Zhang G, Yu T, Piao H. Application of molecular imaging technology in tumor immunotherapy. Cell Immunol. 2020;348:104039. [DOI] [PubMed] [Google Scholar]
- 7. Bensch F, van der Veen EL, Lub-de Hooge MN, et al. 89Zr-artezolizumab imaging as a non-invasive approach to assess clinical response to PD-L1 blockade in cancer. Nat Med. 2018;24:1852–1858. [DOI] [PubMed] [Google Scholar]
- 8. Christensen C, Kristensen LK, Alfsen MZ, Nielsen CH, Kjaer A. Quantitative PET imaging of PD-L1 expression in xenograft and syngeneic tumour models using a site-specifically labelled PD-L1 antibody. Eur J Nucl Med Mol Imaging. 2020;47:1302–1313. [DOI] [PMC free article] [PubMed] [Google Scholar]
- 9. Guan J, Wang R, Hasan S, et al. Prognostic significance of the dynamic change of programmed death-ligand 1 expression in patients with multiple myeloma. Cureus. 2019;11:e4401. [DOI] [PMC free article] [PubMed] [Google Scholar]
- 10. Sun C, Mezzadra R, Schumacher TN. Regulation and function of the PD-L1 checkpoint. Immunity. 2018;48:434–452. [DOI] [PMC free article] [PubMed] [Google Scholar]
- 11. Dong H, Strome SE, Salomao DR, et al. Tumor-associated B7-H1 promotes T-cell apoptosis: a potential mechanism of immune evasion. Nat Med. 2002;8:793–800. [DOI] [PubMed] [Google Scholar]
- 12. Qin X, Liu C, Zhou Y, Wang G. Cisplatin induces programmed death-1-ligand (PD-L1) over-expression in hepatoma H22 cells via Erk/MAPK signaling pathway. Cell Mol Biol. 2010;56:OL1366–OL1372. [PubMed] [Google Scholar]
- 13. Doi T, Ishikawa T, Okayama T, et al. The JAK/STAT pathway is involved in the upregulation of PD-L1 expression in pancreatic cancer cell lines. Oncol Rep. 2017;37:1545–1554. [DOI] [PubMed] [Google Scholar]
- 14. Tallón de Lara P, Cecconi V, Hiltbrunner S, et al. Gemcitabine synergizes with immune checkpoint inhibitors and overcomes resistance in a preclinical model and mesothelioma patients. Clin Cancer Res. 2018;24:6345–6354. [DOI] [PubMed] [Google Scholar]
- 15. Peng J, Hamanishi J, Matsumura N, et al. Chemotherapy induces programmed cell death-ligand 1 overexpression via the nuclear factor-κB to foster an immunosuppressive tumor microenvironment in ovarian cancer. Cancer Res. 2015;75:5034–5045. [DOI] [PubMed] [Google Scholar]
- 16. Smyth MJ, Ngiow SF, Ribas A, Teng MW. Combination cancer immunotherapies tailored to the tumour microenvironment. Nat Rev Clin Oncol. 2016;13:143–158. [DOI] [PubMed] [Google Scholar]
- 17. Homma Y, Taniguchi K, Nakazawa M, et al. Changes in the immune cell population and cell proliferation in peripheral blood after gemcitabine-based chemotherapy for pancreatic cancer. Clin Transl Oncol. 2014;16:330–335. [DOI] [PubMed] [Google Scholar]
- 18. Jung K-H, Lee JH, Park JW, et al. Troglitazone exerts metabolic and antitumor effects on T47D breast cancer cells by suppressing mitochondrial pyruvate availability. Oncol Rep. 2020;43:711–717. [DOI] [PubMed] [Google Scholar]
- 19. Twyman-Saint Victor C, Rech AJ, Maity A, et al. Radiation and dual checkpoint blockade activate non-redundant immune mechanisms in cancer. Nature. 2015;520:373–377. [DOI] [PMC free article] [PubMed] [Google Scholar]
- 20. Paterson AM, Brown KE, Keir ME, et al. The PD-L1:B7-1 pathway restrains diabetogenic effector T cells in vivo. J Immunol. 2011;187:1097–1105. [DOI] [PMC free article] [PubMed] [Google Scholar]
- 21. Eppihimer MJ, Gunn J, Freeman GJ, et al. Expression and regulation of the PD-L1 immunoinhibitory molecule on microvascular endothelial cells. Microcirculation. 2002;9:133–145. [DOI] [PMC free article] [PubMed] [Google Scholar]
- 22. Tinianow JN, Gill HS, Ogasawara A, et al. Site-specifically 89Zr-labeled monoclonal antibodies for immunoPET. Nucl Med Biol. 2010;37:289–297. [DOI] [PubMed] [Google Scholar]
- 23. Makaraviciute A, Jackson CD, Millner PA, Ramanaviciene A. Considerations in producing preferentially reduced half-antibody fragments. J Immunol Methods. 2016;429:50–56. [DOI] [PubMed] [Google Scholar]
- 24. Wierstra P, Sandker G, Aarntzen E, et al. Tracers for non-invasive radionuclide imaging of immune checkpoint expression in cancer. EJNMMI Radiopharm Chem. 2019;4:29. [DOI] [PMC free article] [PubMed] [Google Scholar]
- 25. Suzuki E, Sun J, Kapoor V, Jassar AS, Albelda SM. Gemcitabine has significant immunomodulatory activity in murine tumor models independent of its cytotoxic effects. Cancer Biol Ther. 2007;6:880–885. [DOI] [PubMed] [Google Scholar]
- 26. Cretella D, Digiacomo G, Giovannetti E, Cavazzoni A. PTEN alterations as a potential mechanism for tumor cell escape from PD-1/PD-L1 inhibition. Cancers (Basel). 2019;11:1318. [DOI] [PMC free article] [PubMed] [Google Scholar]
- 27. Parsa AT, Waldron JS, Panner A, et al. Loss of tumor suppressor PTEN function increases B7-H1 expression and immunoresistance in glioma. Nat Med. 2007;13:84–88. [DOI] [PubMed] [Google Scholar]
- 28. Xu C, Fillmore CM, Koyama S, et al. Loss of LKB1 and PTEN leads to lung squamous cell carcinoma with elevated PD-L1 expression. Cancer Cell. 2014;25:590–604. [DOI] [PMC free article] [PubMed] [Google Scholar]
- 29. Song M, Chen D, Lu B, et al. PTEN loss increases PD-L1 protein expression and affects the correlation between PD-L1 expression and clinical parameters in colorectal cancer. PLoS One. 2013;8:e65821. [DOI] [PMC free article] [PubMed] [Google Scholar]
- 30. Atefi M, Avramis E, Lassen A, et al. Effects of MAPK and PI3K pathways on PD-L1 expression in melanoma. Clin Cancer Res. 2014;20:3446–3457. [DOI] [PMC free article] [PubMed] [Google Scholar]
- 31. Noh K-H, Kang TH, Kim JH, et al. Activation of Akt as a mechanism for tumor immune evasion. Mol Ther. 2009;17:439–447. [DOI] [PMC free article] [PubMed] [Google Scholar]


