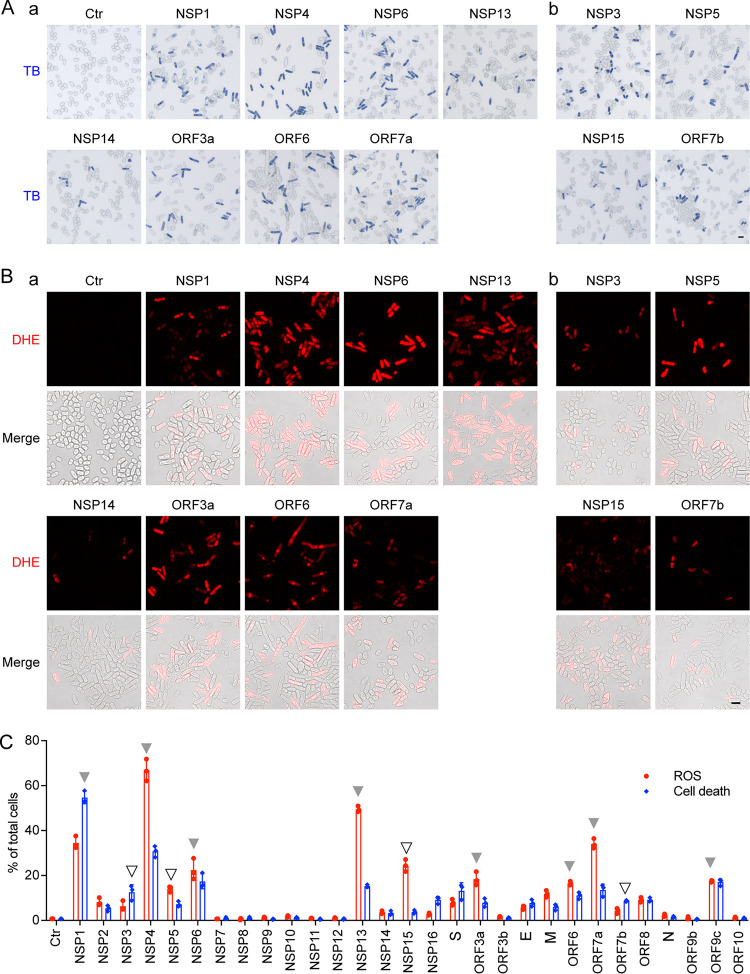
FIG 3.
Correlation of SARS-CoV-2 protein-mediated cell death with the induction of oxidative stress in fission yeast. (A) SARS-CoV-2 protein-induced cell death was measured 48 h agi by trypan blue staining. (B) SARS-CoV-2 protein induces oxidative stress, as indicated by the DHE staining showing the production of ROS. Images were taken 48 h agi. Scale bar = 10 μM. BF, bright field; ROS, reactive oxidative species. DHE, an oxidative stress-specific dye (8, 67). (C) Quantitative correlation of SARS-CoV-2 protein-induced cell death (blue bars) and the production of ROS (red bars). Data represent mean ± SE from three independent experiments. Complete SARS-CoV-2 genome-wide data on fission yeast cell death and ROS production are included in Fig. S4.

