

Abstract
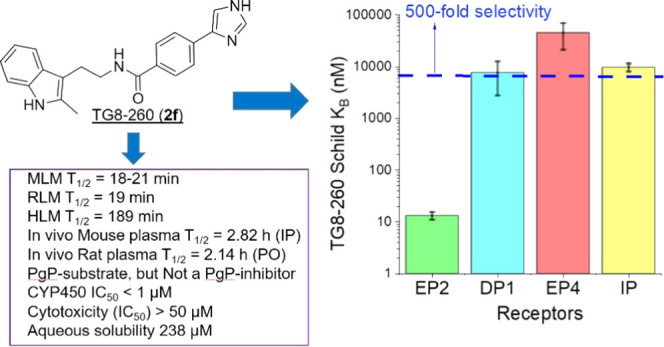
EP2, a G-protein-coupled prostaglandin-E2 receptor, has emerged as a seminal biological target for drug discovery. EP2 receptor activation is typically proinflammatory; therefore, the development of EP2 antagonists to mitigate the severity and disease pathology in a variety of inflammation-driven central nervous system and peripheral disorders would be a novel strategy. We have recently developed a second-generation EP2 antagonist TG8-260 and shown that it reduces hippocampal neuroinflammation and gliosis after pilocarpine-induced status epilepticus in rats. Here, we present details of synthesis, lead optimization on earlier leads that resulted in TG8-260, potency and selectivity evaluations using cAMP-driven time-resolved fluorescence resonance energy-transfer (TR-FRET) assays and [H3]-PGE2-binding assays, absorption, distribution, metabolism, and excretion (ADME), and pharmacokinetics. TG8-260 (2f) showed Schild KB = 13.2 nM (3.6-fold more potent than the previous lead TG8-69 (1c)) and 500-fold selectivity to EP2 against other prostanoid receptors. Pharmacokinetic data indicated that TG8-260 has a plasma half-life of 2.14 h (PO) and excellent oral bioavailability (77.3%). Extensive ADME tests indicated that TG8-260 is a potent inhibitor of CYP450 enzymes. Further, we show that TG8-260 displays antagonistic activity on the induction of EP2 receptor-mediated inflammatory gene expression in microglia BV2-hEP2 cells; therefore, it can serve as a tool for investigating anti-inflammatory pathways in peripheral inflammatory disease animal models.
Keywords: inflammation, anti-inflammatory, lead optimization, pharmacokinetics, CYP450 inhibition, competitive antagonism
Inflammation plays a deleterious role in central nervous system diseases including status epilepticus, epilepsy, traumatic brain injury, Alzheimer’s disease, and Parkinson’s disease.1−6 Inflammation is also an early event and plays an exacerbating role in several peripheral diseases such as arthritis, inflammatory bowel diseases, cancer, and endometriosis.7−11 Induction of inflammatory cytokines (interleukins), chemokines, and cyclooxygenase-2 (COX-2) and activation of microglia and astrocytes are the hallmarks of inflammation.12,13 Thus, the development of agents that target these inflammatory mediators will provide novel strategies to treat patients who suffer from these varieties of neurodegenerative and peripheral diseases. Prostaglandin-E2 (PGE2) receptor EP2 acts downstream of COX-2/PGE2 signaling. Upon activation by PGE2, EP2 produces cAMP via Gs-coupled receptor and promotes cell signaling pathways via protein kinase A (PKA) and exchange factor activated by cAMP (EPAC).14−16 Moreover, EP2 also promotes G-protein-independent pathways that often crosstalk with other pathways including EGFR-mediated signaling.14−16 Studies from our laboratory demonstrated that EP2 promotes inflammation in in vitro models17,18 and neuroinflammation in acute brain injury mouse and rat models of status epilepticus; short-term exposure of EP2 antagonist at the time of peak COX-2 induction has multiple beneficial effects.19−25 EP2 receptor antagonism also reduces inflammation and has beneficial effects in models of glioblastoma,26 endometriosis,27 intracranial aneurysms,28 rheumatoid arthritis,29 cancer cell proliferation,30 and sepsis,31 underscoring the value of small-molecule EP2 antagonist development for use in a variety of preclinical disease models and eventually in patients.
We began our EP2 antagonist discovery program with the development of a high-throughput screening (HTS) assay, followed by screening of a library containing 262 000 small molecules and identified first-generation acryl-amide (cinnamic amide) derivatives as hits, which showed high EP2 potency (Schild KB 2–20 nM) with moderate (10-fold) selectivity against other prostanoid receptors.32−34 By structure–activity relationship (SAR) studies on HTS-hits, we then developed second-generation amide derivatives as potent EP2 antagonists for lead development.35 We continued to investigate lead optimization on our previous research lead EP2 antagonists35,36 to further identify compounds with suitable potency, selectivity, oral bioavailability, absorption, distribution, metabolism, and excretion (ADME), and pharmacokinetics. We now report additional SAR and lead-optimization studies, which led to the development of compound 2f (named TG8-260) with several suitable attributes as presented below. Concurrent with us, Pfizer developed azetidine-carboxylic acid derivative PF-04418948 as a potent EP2 antagonist.37 Later, Amgen also revealed another class of EP2 antagonists including a lead compound named 52.38 Our (Emory) compounds are structurally distinct from either Pfizer or Amgen compounds.
Results and Discussion
We synthesized second-generation EP2 antagonists including TG8-15 (1a), TG7-174 (1b), and TG8-69 (1c)36 (Figure 1) to study their adsorption, distribution, metabolism, excretion, and pharmacokinetic (ADME-PK) properties. From these, a tetrazole ring derivative with a 1-indole ring on the left side TG8-15 (1a) was a potent EP2 antagonist (Schild KB = 22.3 nM) and showed good stability in mouse liver microsomes (T1/2 > 60 min; Table 1), but it showed moderate selectivity to EP2 vs DP1 receptor (29-fold) and a very short plasma half-life in mice after ip administration (T1/2 = 0.3 h).35 Compound 1b, with a morpholine ring on right and 3-indole on the left side, is also a potent EP2 antagonist (Schild KB = 28.6 nM) and highly selective to EP2 (>300-fold); however, it was very unstable in mouse liver microsomes (T1/2 = ∼2 min; Table 1). Compound 1c (TG8-69) displayed about 2-fold less EP2 potency than 1a and 1b with Schild KB = 48.5 nM, >300-fold selectivity against other prostanoid receptors, excellent stability in liver microsomes (>60 min), and in vivo mouse plasma half-life (10.5 h) by oral (po) administration. However, it has low oral bioavailability (14.5%).36 Moreover, it showed low permeability across Madin Darby canine kidney (MDR1-MDCK) cell membranes with Papp, B–A: 0.12 × 10⁻⁶ cm/s, A–B: 0.41 × 10⁻⁶ cm/s, a low efflux ratio: 0.3. We envisioned that the tetrazole moiety in TG8-69 might have been acting as a carboxylic acid mimetic, therefore limiting its permeability across the gut membrane, limiting its oral bioavailability. These parameters precluded the development of TG8-69. To improve upon these ADME parameters, we further modified either the morpholine or tetrazole region (ring) of the second-generation scaffold (1a,b) as shown in Figure 1 for further SAR studies and lead optimization as shown below.
Figure 1.

Earlier and current second-generation lead EP2 antagonists.
Table 1. Novel EP2 Antagonists: Potency and Aqueous Solubility and Mouse Liver Microsomal (MLM) Stabilityad.


Schild KB values are calculated using time-resolved fluorescence resonance energy-transfer (TR-FRET) assay (see the Experimental Methods section) using C6-glioma cells overexpressing human EP2 receptors. KB values are an average of 2 runs in duplicate using a single concentration of the compound (1 μM).
The solubility of the compounds is measured by nephelometry in PBS buffer (pH 7.4) with 1% dimethyl sulfoxide (DMSO) at RT.
Liver microsomal stability was determined at Absorption Systems (USA) or Sai-Life (India) Laboratories using a 1 μM compound incubation with a 0.5 mg/mL mouse liver microsomal protein in the presence of NADPH and following % remaining from 0 to 60 min.
The half-life (T1/2) value is from human liver microsomes under identical conditions.
Chemical Synthesis
From previous SAR studies, we discerned that the right-side ring is flexible and can be modified further to maintain the potency against the EP2 receptor.35,36,39 Therefore, we further intended to explore the right-side ring for further structural modification. To achieve this, we needed various advanced precursors 6a–j, which were not commercially available. There was no general method to produce all of them using a common starting material. Therefore, we synthesized them using commercially available starting materials 3, 7, 8, and 10 (Scheme 1). Initially, 6a was synthesized from methyl 4-iodobenzoate (3) and 4a using K3PO4 and CuI as a catalyst in N,N-dimethyl formamide (DMF)40,41 followed by hydrolysis. The acid precursors, 6b and 6i, were synthesized commencing from boronic acid 7 and 4b–c in a single step in the presence of Cu(OAc)2 in methanol at room temperature. Methyl 4-(4,4,5,5-tetramethyl-1,3,2-dioxaborolan-2-yl)benzoate (8) was coupled with bromo-substituted imidazoles, pyrazoles, and thiazoles (4d–g) under Suzuki reaction conditions42−44 using Pd(dppf)Cl2·CH2Cl2 complex as a catalyst to afford compounds 9a–d in modest yields, which on hydrolysis using LiOH yielded corresponding acid precursors 6d–e, 6h, and 6j in good yield. Compounds 6c and 6g were purchased from Combi-Blocks Inc. (San Diego, CA). However, 6f was synthesized starting from 4-acetyl benzoic acid (10), first by bromination to afford 11, and then reaction with formamide in moderate yield (Scheme 1).45,46
Scheme 1. Synthesis of Acid Intermediates 6a–j.
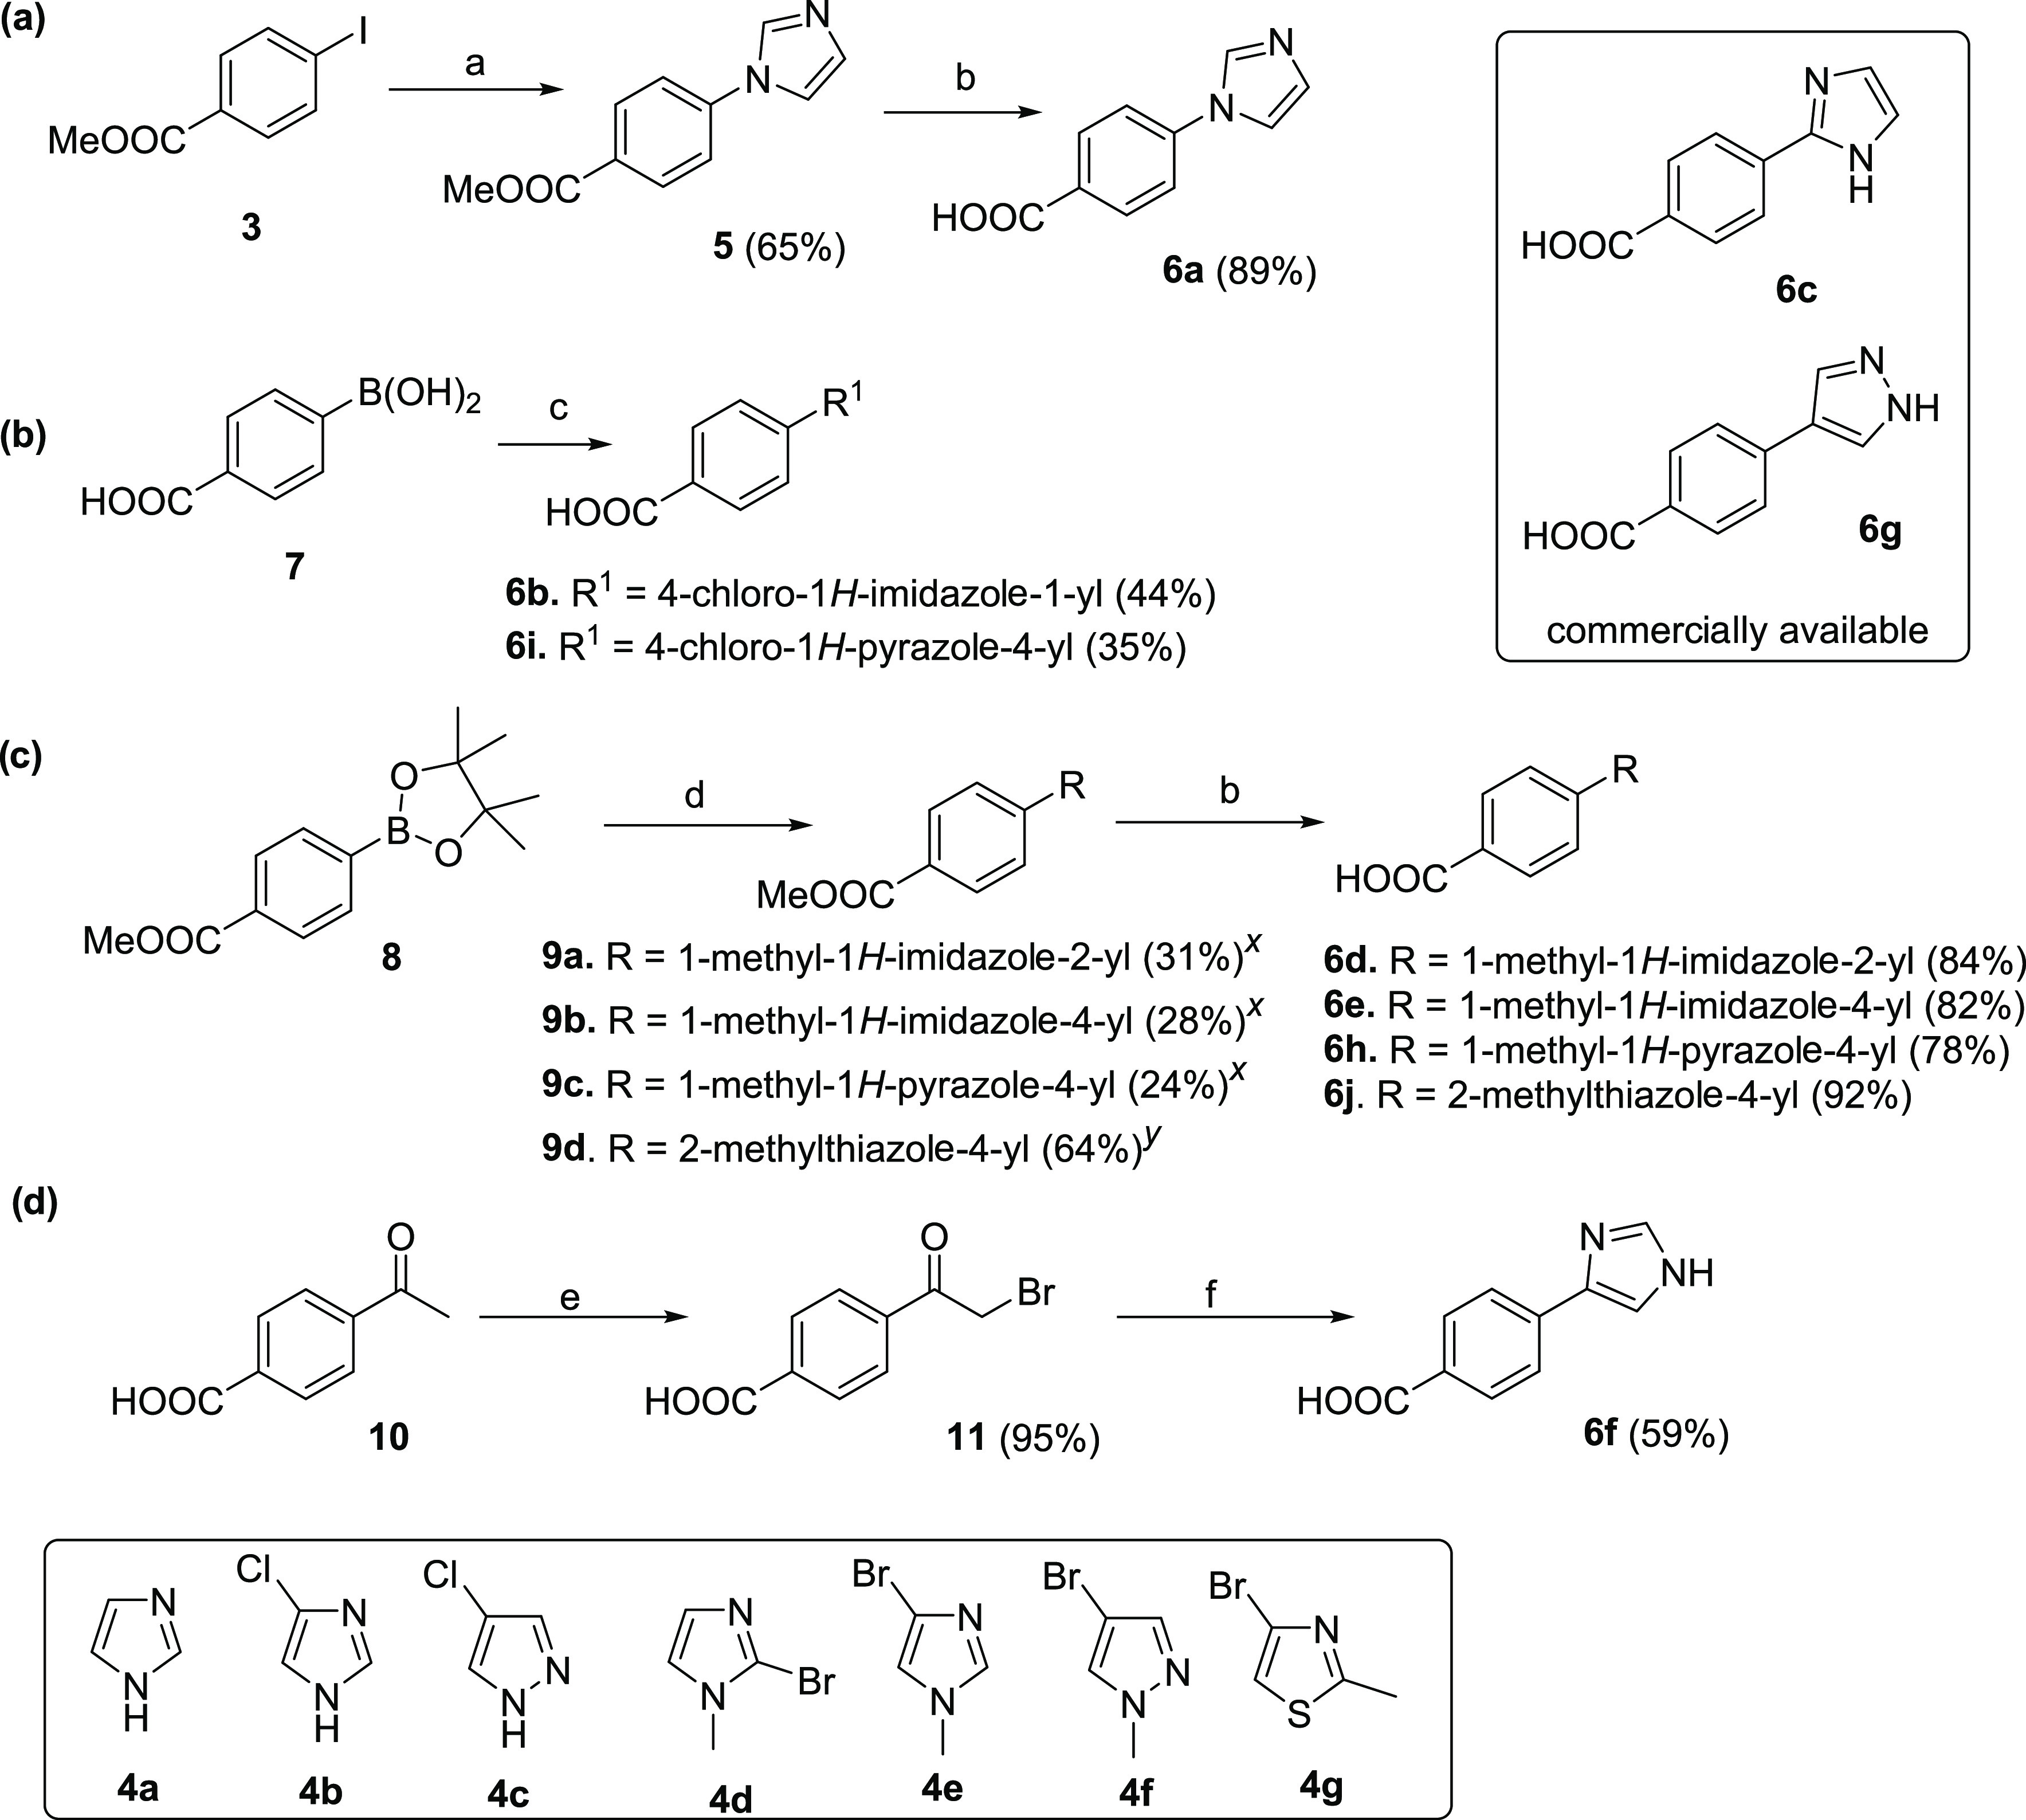
Reagents and conditions: (a) 4a, K3PO4, CuI, DMF, rt, 24 h, 65%; (b) LiOH, tetrahydrofuran (THF), and water (7:3), 65 °C, 14–16 h, 82–92%; (c) 4b,c, Cu(OAc)2·H2O, MeOH, 24 h, 35–44%; (d) 4d–g, aq. Na2CO3, Pd(dppf)Cl2·CH2Cl2, dioxane, 100 °C, 14–18 h, 24–64%; (e) Br2, AcOH, 70 °C, 1 h, 95%; and (f) HCONH2, 175 °C, 5 h, 59%. Yields are not optimized except for 6f. xReaction was carried out in microwave for 1.5 h at 100 °C; yreaction was carried out in an oil bath at 100 °C for 18 h.
All of these substituted benzoic acids, 6a–j, were coupled to 2-(2-methyl-1H-indol-3-yl)ethan-1-amine (12)47 in N,N-dimethyl formamide at room temperature in the presence of 1-ethyl-3-(3-dimethylaminopropyl)carbodiimide·hydrochloride (EDCI·HCl) and N,N-dimethylamino pyridine (DMAP) to furnish novel final compounds 2a–j in modest yields (Scheme 2).
Scheme 2. Synthesis of Novel EP2 Antagonists with Modification on the Right-Side Ring.

Reagents and conditions: (a) 6a–j, DMAP, EDCI, DMF, rt, 24.
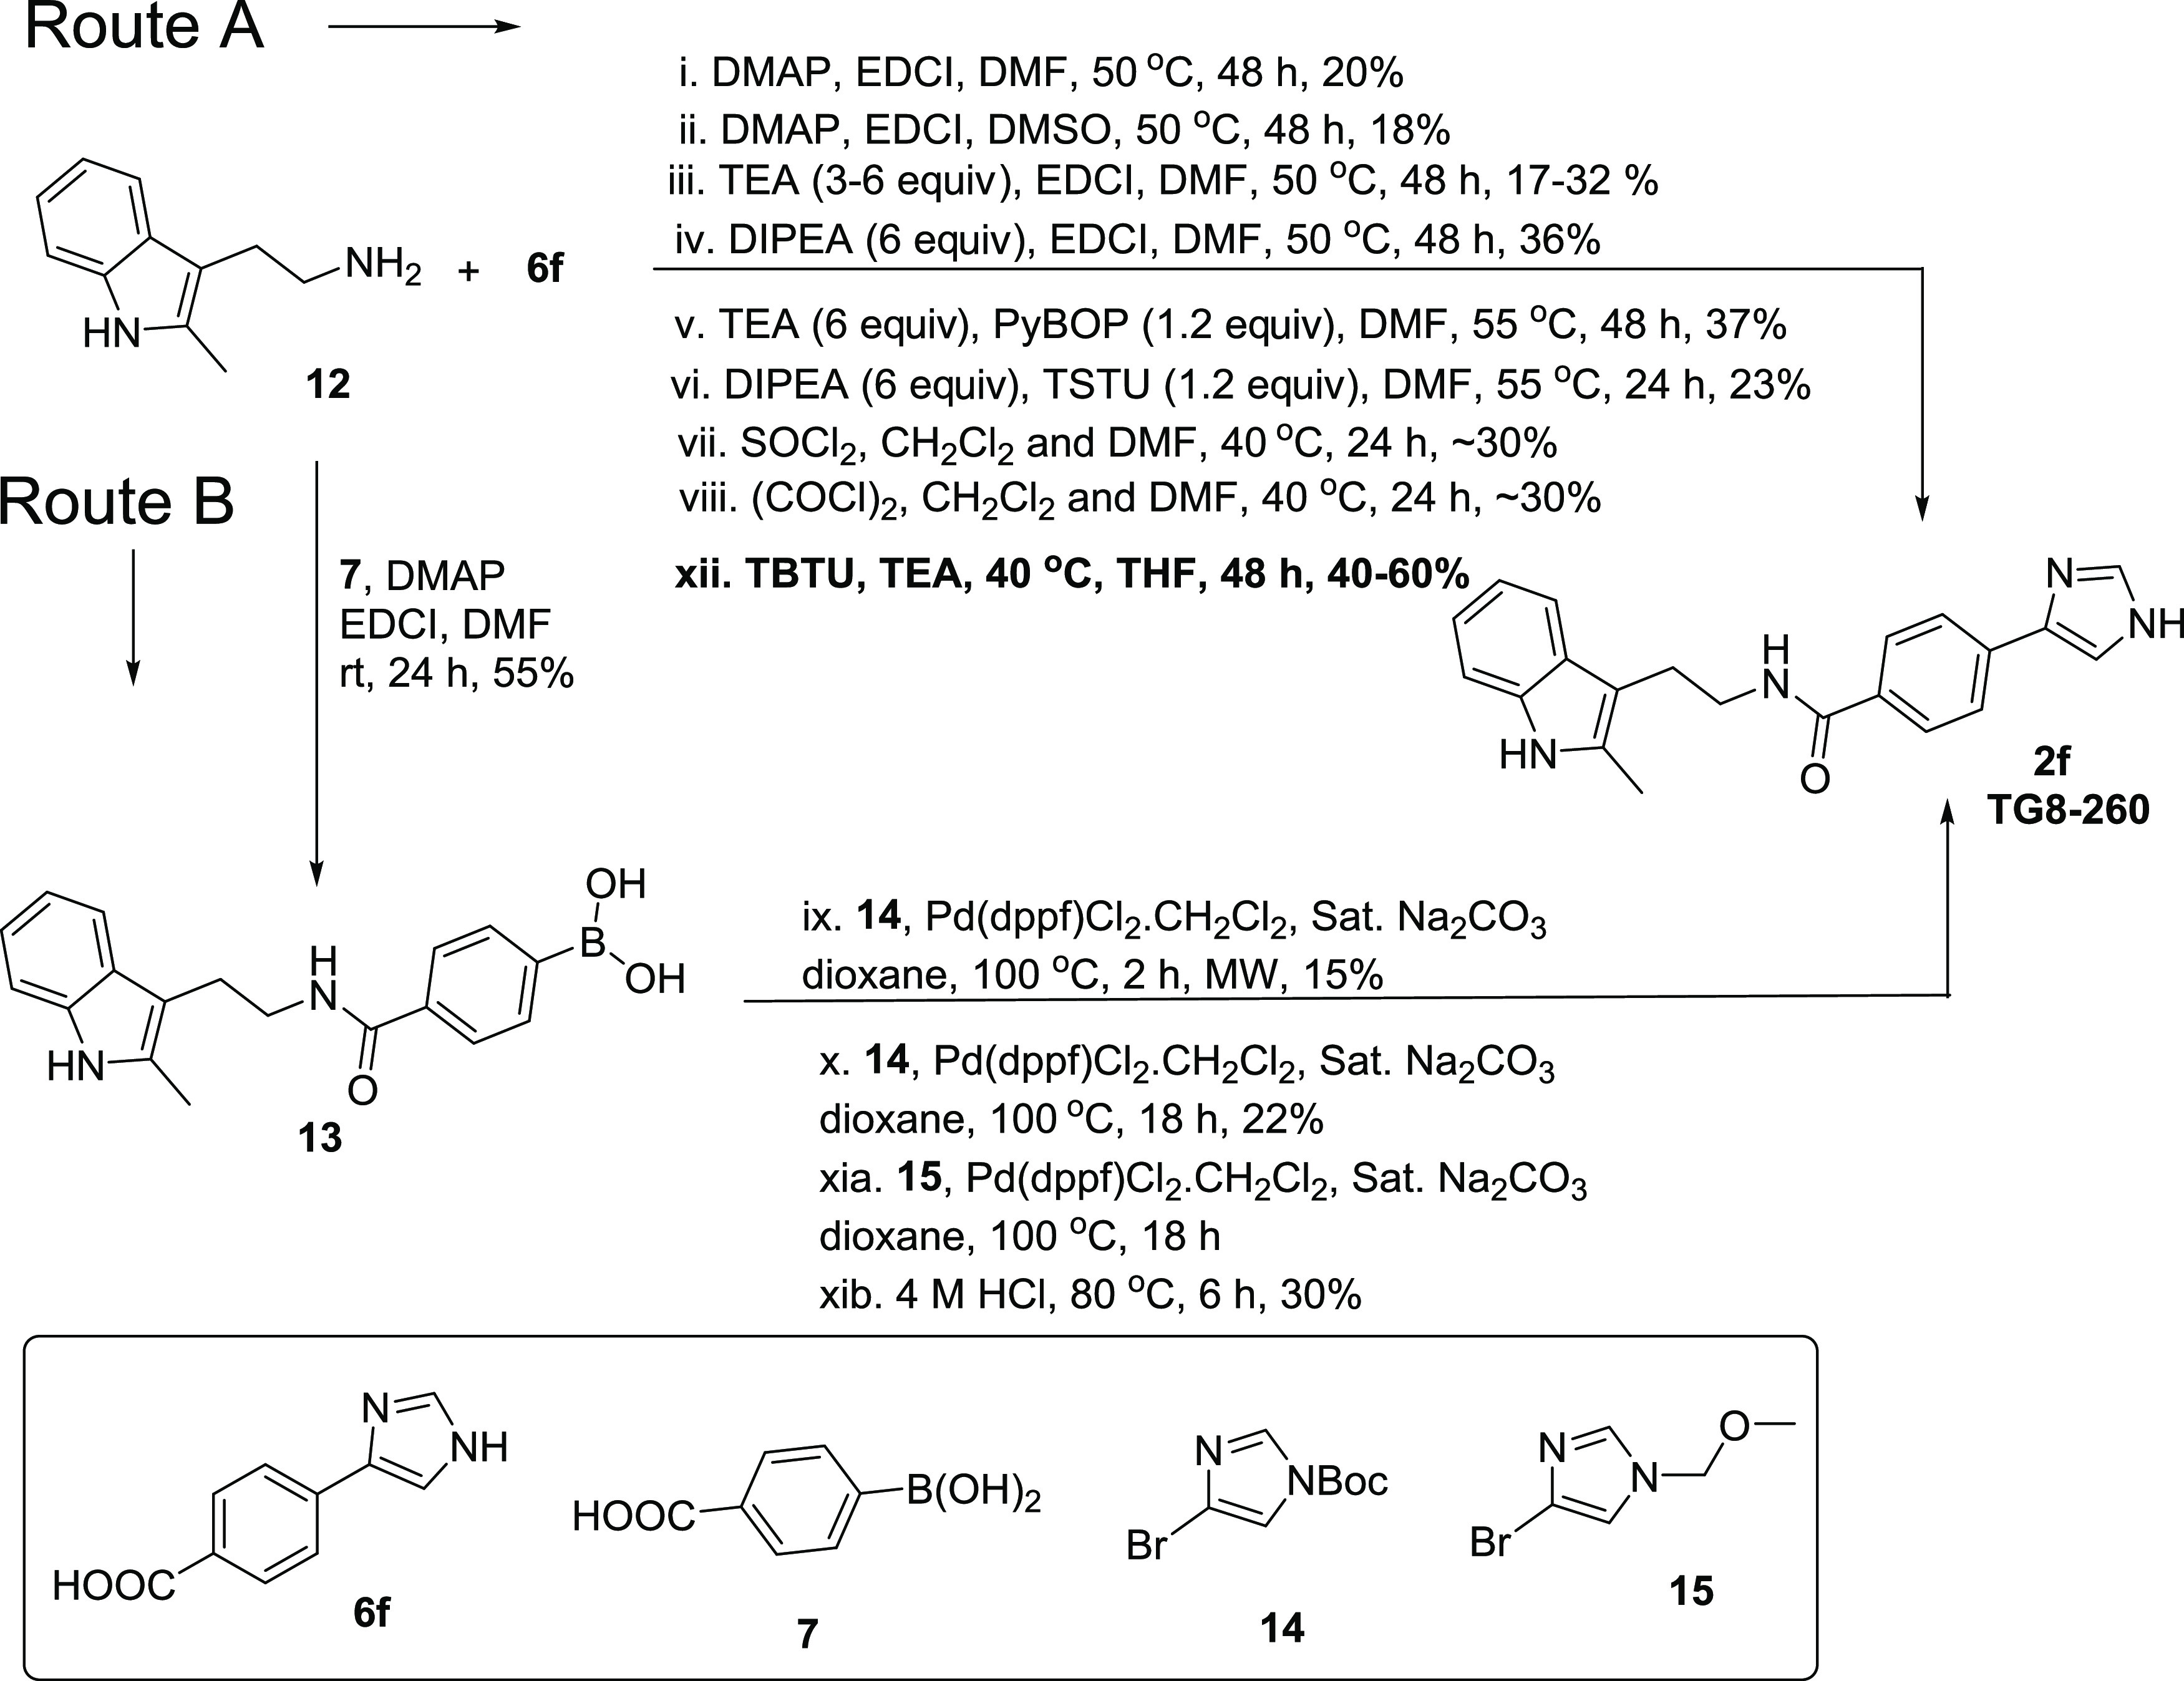
From the SAR studies (described below), we identified 2f (named TG8-260) as a potent and selective lead compound to investigate for ADME-PK, as well as in vitro and in vivo studies. As shown in Scheme 2, the initial synthetic method proceeded but with a low yield (15%) and presented challenges for large-scale material synthesis for ADME-PK and in vivo proof-of-concept evaluations. Thus, we explored various coreagents for the coupling of amine 12 and acid 6f. As shown in Scheme 3, Route A, the reaction of 6f with 12 in the presence of DMAP and EDCI on heating to 50 °C in DMSO or DMF did not increase the yield much (18–20%) from the original condition. However, the addition of triethylamine (3–6 equiv) as a base to the reaction of 6f with 12 in DMF at 50 °C increased the yield of 2f to 32%. Changing the base from triethylamine to diisopropylethylamine (DIPEA) furnished 2f in a 36% yield. Addition of PyBOP to the coupling reaction in the presence of triethylamine as a base in DMF at 55 °C did not increase the yield and gave product 2f in a 37% yield. Using DIPEA and TSTU reagent combination or prior conversion of acid to acid-chloride in situ by SOCl2 or COCl2 did not increase the yield, resulting in only ∼30%. Finally, the reaction of 12 with 6f using triethylamine and TBTU and in tetrahydrofuran at 40 °C for 48 h yielded 2f in 60% yield (for <1g scale reactions). However, when the reaction scale was increased to 3 and 12 g scales, the yield of TG8-260 (2f) dropped to 52 and 40%, respectively (Scheme 3).
Scheme 3. Exploration of Synthetic Methods for Multigram Scale Preparation of 2f (TG8-260).
Reagents and conditions are shown in the scheme.
We also explored an alternative route (B) with other conditions, as shown in Scheme 3. In this route, we first coupled starting material 12 with 4-boronobenzoic acid (7) in the presence of EDCI·HCl, DMAP at room temperature to afford boronic acid derivative 13 in a 55% yield. We then explored the coupling of 13 with tert-butyl 4-bromo-1H-imidazole-1-carboxylate (14) in the presence of Pd(dppf)Cl2·CH2Cl2 complex at 100 °C for 18 h. This condition afforded 2f in a 22% yield; heating the same reaction in a microwave oven for 2 h did not increase the yield (15% yield). To determine the influence of the t-butyloxycarbonyl (Boc) group in coupling between 13 and 14, we used 4-bromo-1-(methoxymethyl)-1H-imidazole (15) in the presence of Pd(dppf)Cl2·CH2Cl2 complex at 100 °C for 18 h, and subsequent deprotection of methoxymethyl (MOM) group afforded 2f in a 30% yield over two steps. All of these results suggest that the method xii in Route A involving TBTU and triethylamine in tetrahydrofuran is the method of choice for the synthesis of 2f (TG8-260) in good yield.
SAR Analysis on Novel Derivatives
Our current SAR studies are guided by our initial second-generation leads 1a–c (Figure 1), which indicate that the right-side ring is flexible for structural modification to retain EP2 potency and selectivity. Moreover, the left-side indole ring is also flexible within the isomeric indoles (1-indole or 3-indole) to maintain the potency of the scaffold. It is worth noting that compound 1c (TG8-69) is a promising lead candidate albeit with some weaknesses for preclinical development.36 Therefore, the goal was to identify novel leads better than 1c. Knowing that morpholine derivative (1b) underwent rapid metabolism in mouse liver microsomes (Table 1) and displayed poor PK properties, and the tetrazole derivative (1c) displayed low permeability and oral bioavailability,35,36 we continued to explore additional heterocyclic rings to replace either the morpholine or the tetrazole ring in 1b and 1c, respectively. Inspired by the physicochemical properties of imidazoles, pyrazoles, and thiazoles and their presence in a variety of biologically active small molecules,48−50 we synthesized and presented below 10 novel compounds comprising these rings. From this, 1-yl-imidazole derivative (2a) displayed similar potency as 1c. Addition of chlorine to the 1-yl-imidazole moiety (2b) trended towards decreasing the potency by 1.4-fold. We tested 2-yl-imidazole compound (2c), which showed similar potency to 1c. To block the −NH, we synthesized 1-methyl-2-yl-imidazole (2d), which showed a 1.8-fold decreased potency over 1c. However, a 1-methyl-4-yl-imidazole (2e) showed similar potency as 1c. Interestingly, N-desmethyl-4-yl-imidazole derivative (2f) showed a 3.6-fold enhanced potency to 1c. Further, we synthesized a 4-yl-pyrazole derivative (2g), which displayed about 12-fold more potency than 1c and about 3.4-fold more potency than 2f. Similarly, the introduction of a methyl group on pyrazole-NH reduced the potency by 5-fold (cf. 2gvs2h). We also synthesized a 4-chloro-1-yl-pyrazole derivative (2i), which showed a 1.4-fold more potency than 1c, but 2- to 8-fold less potency than the pyrazole derivatives, 2g or 2h, respectively. Finally, we synthesized a thiazole derivative 2j, which showed nearly the same potency as 1c.
We determined aqueous solubility for the above novel compounds in phosphate-buffered saline (PBS) at pH 7.4 maintaining 1% DMSO using the nephelometry method.51 Compounds 2c, 2f, and 2g showed >100 μM solubility and others showed <100 μM. We also tested several of these novel derivatives for stability in mouse liver microsomes to advance them for pharmacokinetic studies. Among these compounds, 2f displayed a half-life (T1/2) of 21 min in mouse liver microsomes and >60 min of half-life in human liver microsomes (Table 1). High EP2 potency, selectivity, aqueous solubility, and liver microsomal stability data prompted us to advance compound 2f (TG8-260) for further characterization toward preclinical studies as detailed below.
TG8-260 (2f) and Its Derivative TG8-242 (2c) Display a Competitive Mode of EP2 Antagonism
Using the cAMP-mediated TR-FRET-based functional EP2 assay,22,33,52 we tested TG8-260 at concentrations 0.1, 0.3, 1, and 3 μM in a C6-glioma cell line overexpressing human EP2 receptors and found that TG8-260 inhibited PGE2-induced EP2 receptor activation in a concentration-dependent manner (Figure 2A). The Schild regression analysis provided a mean KB value of 13.2 nM and a mean slope of 1.0 (n = 3) (Figure 2B). The Schild KB value represents the concentration required to cause a 2-fold rightward shift of EC50 of a full agonist (PGE2). A Schild slope of unity indicates that it is a competitive antagonist. We also tested a second compound 2c (TG8-242), which also displayed a dose–response antagonism of PGE2-induced cAMP assay with a Schild KB of 52 nM and a Schild slope of 1.1 (Supporting Information, Figure S1). It is worth noting that the external positive control (Pfizer compound) PF-04418948 displayed a very low potency in our assay (Schild KB = 147 nM, Schild slope 1.5) in comparison to our earlier lead compound 1c,36 although originally it was reported to be highly potent with a Schild KB of 1.8 nM.37 Therefore, we used our internal HTS hit (TG4-155) as a positive control, which showed a Schild KB of 1–2 nM in our EP2 assay. We then tested TG8-260 for potency against other structurally closest G-protein-coupled prostanoid receptors DP1, EP4, and IP using C6-glioma cells overexpressing each of these receptors and using the same cAMP-mediated TF-FRET assay. TG8-260 displayed KB values of 8, 45, and 10 μM for DP1, EP4, and IP receptors, respectively, indicating about >500-fold selectivity to EP2 versus these other G-coupled receptors (Figure 2C). Due to the lack of cell lines expressed with human EP1 and EP3 receptors in our laboratory, we separately tested TG8-260 in binding assays (at Eurofins-Cerep, CRO Laboratories) against EP1–EP3 receptors. As shown in Supporting Information Figure S2, TG8-260 (2f) did not show any significant inhibition of [H3]-PGE2 binding to EP1 and EP3 receptors at 10 μM concentration, but it showed an 82% inhibition against EP2 receptors at a low 1 μM concentration. Similarly, TG8-242 (2c) showed no inhibition of DP1, EP4, and IP receptors in cAMP assays when tested at a 10 μM concentration (not shown), indicating that its selectivity to EP2 receptors is at least 200-fold versus these receptors.
Figure 2.

Potency and selectivity of TG8-260 (2f). (A) TG8-260 inhibits PGE2-induced human EP2 receptor activation in a concentration-dependent manner. (B) Schild regression analysis indicates that TG8-260 is a competitive antagonist with a slope of 1. The average Schild KB of 13.2 nM was calculated from three independent experiments run in triplicate. (C) TG8-260 showed a >500-fold selectivity to EP2 versus other structurally closest G-coupled receptors DP1, EP4, and IP.
Pharmacokinetics of TG8-260 (2f)
Prompted by the potency, selectivity, and mouse liver microsomal stability data, we investigated the pharmacokinetics of TG8-260 (2f) in C57BL6 male mice. Following a single intravenous (iv) dose of 5 mg/kg, TG8-260 showed a modest clearance (∼19% of normal liver blood flow in mice: 90 mL/min/kg) and volume of distribution (∼1.8-fold higher than total body water: 0.7 L/kg) with a terminal elimination plasma half-life of 1.47 h (Figure 3A and Table 2). Likewise, a pharmacokinetic study by intraperitoneal (ip) injection (20 mg/kg dose) indicated that the compound had a brain-to-plasma ratio of 0.02 (0.5–4 h) and a plasma half-life of 2.82 h (Table 2). To facilitate the use of the compound in an acute brain injury rat model of status epilepticus,53 we conducted a pharmacokinetic study for TG8-260 in male Sprague-Dawley (SD) rats by a single intravenous injection of 5 mg/kg and a twice-daily dosing (B.I.D.) of 25 mg/kg by the oral (po) route. Similar to that in mice, following a single intravenous dose of 5 mg/kg in SD rats, TG8-260 showed modest clearance (∼27% of normal liver blood flow in mice: 55 mL/min/kg) and volume of distribution (∼2-fold higher than total body water: 0.7 L/kg) with a terminal elimination plasma half-life of 1.47 h (Figure 3A and Table 2). As shown in Figure 3B, the B.I.D. oral dosing study indicated a terminal plasma half-life of 2.14 h with a brain-to-plasma ratio in the range of 0.02–0.05 (at 2, 4, 8, and 10 h). The absolute oral bioavailability in rats (% F) for TG8-260 is 77.3% by the oral route and a bioavailability value of 52% by the ip route when compared with the iv administration in mice (Table 2).
Figure 3.

Pharmacokinetics of TG8-260. (A) Pharmacokinetics in male C57BL6 mice and Sprague-Dawley rats following a single intravenous (iv) injection. (B) Plasma concentrations of TG8-260 in adult Sprague-Dawley rats that received B.I.D. oral dose. The plasma levels of TG8-260 decreased as a function of time by iv dosing. Pharmacokinetics in rats via B.I.D. oral dosing achieved a 3-fold higher concentration until 24 above the Schild KB value shown in the inset. Pink arrows indicate the times of compound delivery. Plasma (ng/mL) and brain tissue concentrations (ng/g) were converted to nM for plotting and to correlate with the potency of the molecule; the density for brain tissues was assumed to be 1 for conversion.
Table 2. Mean Pharmacokinetic Parameters of TG8-260 (2f) Following Single-Dose Administration by iv, ip, and po Routes of Delivery to Male Mice and Ratsa.
| species | route | dose (mg/kg) | Tmax1 (Tmax2) (h) | Cmax1 (Cmax2) (μg/mL) | AUClast (h*μg/mL) | AUCinf (h*μg/mL) | T1/2 (h) | CL (mL/min/kg) | Vss (L/kg) | %F | B/P ratio |
|---|---|---|---|---|---|---|---|---|---|---|---|
| mouse | iv | 5 | 0.08 | 4.7 | 4.8 | NC | 1.47 | 16.8 | 1.29 | ND | |
| mouse | ip | 20 | 1.0 | 12.5 | 37.8 | 38 | 2.82 | 8.79 | 2.14 | 52 | 0.02 |
| rat | iv | 5 | 0.08 | 4.3 | 5.56 | NC | 1.71 | 14.8 | 1.37 | ND | |
| rat | po | 25 (BID = 50) | 0.5 (8.5) | 5.3 (5.9) | 43 | 43 | 2.14 | 9.65 | 1.79 | 77.3 | 0.02 |
Formulation of the dosing vehicle used for iv, ip, and po deliveries: 5% NMP, 5% Solutol-HS15, and 90% normal saline. Dose volume 5 mL/kg (iv), 10 mL/kg (ip and po), n = 3 mice/rats per time point. CL, total plasma clearance; Vss, volume of distribution at steady state; %F, bioavailability; B/P, brain-to-plasma ratio; Tmax, time taken to reach maximum plasma concentration; Cmax, highest plasma concentration; T1/2, half-life; ND, not determined; NC, not calculated; and B.I.D., two doses 8 h apart (see Figure 3).
To determine the cytotoxicity of the members of this set of new EP2 antagonists, we tested selected four compounds, 2c, 2g, 2j, and 2f (TG8-260), in parent C6-glioma cells. Compounds were incubated with various concentrations up to 50 μM, and the cell viability was evaluated using the CellTiter-Glo luminescence reagent. The results indicated that none of these compounds, including TG8-260, showed any cell toxicity up to 50 μM (Figure 4); a positive control compound, doxorubicin, showed an IC50 value of 100 nM in the same assay.
Figure 4.

Cell viability of novel EP2 compounds. Parent C6-glioma cells were incubated with varying concentrations of compounds for 48 h. Then, cell viability was determined by the CellTiter-Glo reagent by luminescence assay using the kit and protocol from Promega (Catalog-No#G7570).
In Vitro ADMET Properties of TG8-260
TG8-260 was submitted for a battery of ADMET assays in an initial evaluation of its potential for further development. The compound was determined to be a potent CYP inhibitor of five CYPs, namely, CYPs 2B6, 2C8, 2C19, 2D6, and 3A4 with IC50 values less than 1 μM, the exception being CYP1A2 where the IC50 value was >100 μM (Table 3). This potent inhibition activity against the CYPs is likely due to the affinity of the imidazole portion of the molecule to the P450 heme.54−56 It is worth indicating that compounds 2c and 2i did not show any significant inhibition of CYPs, 2D6 and 3A4, at a concentration of 3 μM (Table 3), suggesting that the free NH group in the imidazole ring might contribute to high CYP inhibition by TG8-260. In this particular ADME test, TG8-260 (2f) is worse than that of the previous lead candidate TG8-69 (1c), which only inhibited CYP2C8, >50% at 10 μM, but not other CYP450s.36 The inhibition activity of TG8-260 on multiple CYPs could create drug–drug interactions clinically. Therefore, depending on the therapeutic use, this adverse feature with this compound must be thoroughly evaluated.
Table 3. CYP Inhibition Activity of TG8-260 (2f) in Pooled Human Liver Microsomesa.
| CYP IC50 (μM) |
|||||||
|---|---|---|---|---|---|---|---|
| compound | 1A2 | 2B6 | 2C8 | 2C19 | 2D6 | 3A4 (M or T) | 3A4 (T) |
| TG8-260 (2f) | >100 | <0.046 | 0.2 | <0.046 | 0.09 | 0.7 | 0.9 |
| TG8-242 (2c) | ND | ND | ND | ND | >3b (0% at 3 μM) | >3 (18% at 3 μM) | ND |
| TG10-251(2i) | ND | ND | ND | ND | >3b (30% at 3 μM) | >3 (0% at 3 μM) | ND |
Studies were carried out at (CROs) AMRI Laboratories, Rochester, NY.
Studies were carried out at Sai-Life Laboratories (India). CYP3A substrates were midazolam (M) or testosterone (T, testosterone).
The in vitro mean binding of TG8-260 to plasma proteins across species (human, rat, mouse, dog, nonhuman primate (NHP)) was high, with binding in human plasma being the lowest at 95% (Table 4). The mean plasma protein binding value in mice was approximately 98%, and an in vitro brain-binding study in mouse revealed a value of 99.5% (data not shown). The fraction unbound (fu) value has ramifications for the determination of free drug concentrations in future PK studies across species. In this test, previous lead TG8-69 (1c) and TG8-260 have similar fractions unbound in the mouse plasma (Table 4).
Table 4. Mean (±Standard Deviation) Plasma Protein Binding of TG8-260 across Animal Speciesa.
| plasma protein binding, % |
brain protein binding, % | |||||
|---|---|---|---|---|---|---|
| compound | human | rat | mouse | dog | NHP | mouse |
| TG8-260 | 95.0 ± 0.1 | 98.4 ± 0.3 | 98.1 ± 0.3 | 96.7 ± 0.2 | 96.0 ± 0.5 | 99.5 |
| TG8-69 | ND | ND | 98.3 ± 0.2b | ND | ND | ND |
Equilibrium binding studies (n = 3) were done at AMRI Laboratories, Rochester, NY.
Studies (n = 3) are done at Sai-Life Sciences Ltd. (CRO), India.
We have determined the unbound fraction in the plasma and brain for TG8-260 from the pharmacokinetics study in mouse by intraperitoneal injection (single dose of 20 mg/kg). As shown in Supporting Information Table S1, TG8-260 displayed decent concentrations in plasma and brain tissues with a very low brain-to-plasma ratio. Based on these total concentrations, the calculated unbound concentration in the brain (2–3 nM) is significantly less than the Schild potency (13.2 nM) of the molecule. We project similarly low concentrations in the rat pharmacokinetics study based on the high rat plasma protein-bound data. Therefore, the anti-inflammatory actions we reported for this compound in the earlier pilocarpine-induced status epilepticus model were likely due to the anti-inflammatory action in the periphery rather than that in the brain.
An in vitro metabolic stability study was carried out in hepatic microsomes from human, rat, mouse, dog, and NHP (Table 5). The intrinsic clearance values (CLint) represent the intrinsic capacity of the liver microsomes to metabolize TG8-260 and demonstrated that human and NHP liver microsomes exhibited a lower propensity to metabolize the compound as compared to rodents and dogs. The hepatic extraction (EH) data, which are comparable across species, suggested that, in humans and NHP in vivo, values were low and that TG8-260 (2f) was likely to escape elimination during a single pass through the liver and further suggested that the clearance would be relatively independent of hepatic blood flow. On the other hand, in rodents and dogs, clearance of the compound from the liver was in the intermediate category and would be more likely to depend on hepatic blood flow, CLint, and the fraction unbound (fu). (Table 5). The overall disappearance of the compound from the incubations was further supported by the T1/2 values, which showed that TG8-260 (2f) remained detectably the longest in human hepatic microsomes (189 min) and the shortest in the rodents (18–19 min) with an intermediate value in dogs. However, it should be noted that the potent inhibition of cytochrome(s) P450 isoforms, which can differ across species, may play an important role in the intrinsic clearance (CLint) and the predicted in vivo hepatic clearance (ClH) values of the compound with consequences for the in vivo disposition of 2f. In turn, this may have ramifications for clinical drug–drug interactions. Whether the metabolism of the compound is quantitatively or qualitatively different across the species, both in vitro and in vivo, is not known at this time.
Table 5. Metabolic Stability of TG8-260 (2f) in Cross-Species Liver Microsomes.
| species | T1/2 (min) | CLinta (μL/min/mg) | ClHb (mL/min/kg body wt) | EHc (%) |
|---|---|---|---|---|
| mouse | 18d | 38 | 54 | 45 |
| rat | 19 | 36 | 32 | 48 |
| dog | 26 | 26 | 19 | 62 |
| NHP | 68 | 10 | 6.8 | 16 |
| human | 189d | 3.7 | 2.6 | 13 |
In vitro intrinsic clearance.
Predicted in vivo hepatic clearance.
Hepatic extraction ratio. Testosterone was used as a positive control in this assay. The hepatic clearance values (ClH) were calculated from Clint′, the fraction unbound (fu) in plasma and hepatic blood flow. Data are generated by AMRI, Rochester, NY.
The in vitro permeability of TG8-260 across Caco-2 cells was low and lower across MDR1-MDCK cells and similar to TG8-69 in an accepted model of brain barrier permeability and efflux transport. In both cell types, the efflux ratio was high and further studies showed that TG8-260 was a substrate for P-glycoprotein (PgP) but was not an inhibitor of the P-glycoprotein transporter (Tables 6 and 7). It has been shown that the penetration of the compound across the blood–brain barrier in vivo in mice and rats is poor, as shown by the brain-to-plasma ratio (see the Pharmacokinetics of TG8-260 section and Table 2).
Table 6. Assessment of TG8-260 (2f) as a PgP Substratea.
| Caco-2 |
MDR1-MDCK |
|||||||||
|---|---|---|---|---|---|---|---|---|---|---|
| compd. | direction | % recovery | Papp (10–6 cm/s) | efflux ratio | PgP substrate classification | direction | % recovery | Papp (10–6 cm/s) | efflux ratio | PgP substrate classification |
| TG8-260 | A to B | 72.5 | 3.85 | 14.6 | A to B | 58.0 | 0.55 | 71.2 | ||
| B to A | 80.1 | 56.2 | B to A | 73.6 | 39.1 | |||||
| TG8-260 + 1 μM valspodar | A to B | 72.3 | 7.13 | 7.67 | positive | A to B | 67.4 | 7.5 | 0.95 | positive |
| B to A | 82.6 | 54.7 | B to A | 82.5 | 7.0 | |||||
| TG8-69 | ND | ND | ND | ND | A to B | 0.12 | 0.3 | |||
| B to A | 0.41 | |||||||||
Studies are done at AMRI, Rochester, NY.
Table 7. Assessment of TG8-260 (2f) as PgP-Inhibitora.
| Caco-2 |
MDR1-MDCK |
|||||||||
|---|---|---|---|---|---|---|---|---|---|---|
| compd. | direction | % recovery | Papp (10–6 cm/s) | efflux ratio | PgP inhibition classification | direction | % recovery | Papp (10–6 cm/s) | efflux ratio | PgP-inhibitor classification |
| TG8-260 | A to B | 83.9 | 0.57 | 21.3 | A to B | 79.0 | 0.02 | 345 | ||
| B to A | 77.3 | 12.1 | B to A | 86.1 | 8.11 | |||||
| Digoxin + 10 μM TG8-260 | A to B | 76.3 | 0.68 | 15.2 | negative | A to B | 84.4 | 0.02 | 259 | negative |
| B to A | 84.6 | 10.3 | B to A | 75.4 | 7.34 | |||||
Studies are done at AMRI, Rochester, NY.
As a preliminary experiment to investigate cardiovascular parameters associated with TG8-260, the effect of the compound on the human potassium channel (hERG) using the tritiated [3H]-dofetilide binding assay was examined. The result showed that the binding was low (9% inhibition at 10 μM TG8-260). Moreover, when tested at 1, 3, and 10 μM concentrations to record the inhibition of tail-current in the hERG-CHO-K1 cell line using an automated patch-clamp assay, TG8-260 showed only 19% inhibition at 10 μM, suggesting that these activities on hERG assays may not translate into in vivo QTc prolongation, although this would need to be evaluated directly during Safety Pharmacology studies. The off-target profile has not been extensively examined but when tested against a series of 40 ion channels, transporters, receptors, and enzymes, 10 μM TG8-260 was found to displace radioligand binding at human 5HT2A and 5HT2B receptors (Table 8). This should be further explored in a functional assay to determine the consequences of this result, especially if TG8-280 acts as an agonist at the 5HT2B receptor.
Table 8. Off-Target Activity of TG8-260 (2f) at 10 μM against Selected Receptors, Enzymes, Ion Channels, and Transportersa.
| target | % inhibition at 10 μM | target | % inhibition at 10 μM | target | % inhibition at 10 μM |
|---|---|---|---|---|---|
| Adenosine A2A | 10 | Estrogen ERα | –17.7 | Monoamine Oxidase (MAO-A) (antagonist) | 15.7 |
| Adrenergic α1B | 39.4 | Progesterone PR-B | –0.5 | Opiate κ (OP2, KOP) | 18.5 |
| Adrenergic α1D | 17.2 | Cannabinoid CB1 | 22.3 | Opiate μ (OP3, MOP) | 7.8 |
| Adrenergic α2A | 9.1 | Histamine H1 | 0.3 | Serotonin 5-HT1B | 27.2 |
| Adrenergic α2C | –1.8 | Histamine H2 | –7.2 | Serotonin 5HT2A (antagonist) | 39.5 |
| Adrenergic β1 | 10.1 | Dopamine D1 | 14.4 | Serotonin 5HT2A (agonist) | 76.8 |
| Adrenergic β2 | 8.6 | Dopamine D2L | 11.4 | Serotonin 5HT2B (antagonist) | 80.9 |
| AR (agonist) | 0.2 | Transporter, Serotonin (SERT) | –12.3 | Serotonin 5HT2B (agonist) | 97.2 |
| Dopamine transporter (antagonist) | 0.2 | Norepinephrine transporter (antagonist) | –5.8 | Serotonin 5-HT4 | 7.3 |
| N-neuronal α4β2 (agonist) | 0.4 | N-neuronal α7 (antagonist) | –3.0 | hERG potassium channel | 9.3 |
| Cyclooxygenase-1 (COX-1) | -22 | PDE3A | 16.2 | PDE4A1A | –14.6 |
| Cyclooxygenase-2 (COX-2) | 19.4 | PDE3B | 11.1 | PDE4B1 | –7.0 |
| Monoamine Oxidase (MAO-B) (recombinant enzyme) | 33 | TP TXA2 (antagonist) | 30 | PDE4D2 | 8.2 |
Studies were done at Eurofins-Cerep, Inc. All of the targets used are from human samples. The binding inhibition is tested at 10 μM TG8-260 against an appropriate reference ligand that was used historically for each target at Eurofins-Cerep Laboratory, and the data are an average of two replicates. PDE, phosphodiesterase; TXA2, thromboxane-A2; and TP, prostanoid receptor TP.
The extensive ADME tests designed and conducted above were to evaluate potential hurdles to promote the compound TG8-260 for clinical use. Moreover, these ADME data should not interfere with any in vitro activity results from cellular models that were used to evaluate the potency and selectivity discussed above and anti-inflammatory actions (shown below). However, there are a few noteworthy observations here. The high plasma protein binding limits the compound availability in the brain or other tissues if needed. Although the permeability of the compound is relatively low (Table 6), we were able to observe micromolar concentrations in the plasma after oral dosing and ip injection (Table 2) in mice. The reason is not clear, but it might be due to the inhibition of several major drug-metabolizing CYP450 enzymes. Nonetheless, additional ADME work on the derivatives (e.g., 2c, 2i) is needed to identify compounds that are superior to TG8-69 and TG8-260, which will have requisite ADME data for clinical development. While these ADME studies are in progress, we have already tested the compound TG8-260 in vivo to ask whether it is efficacious in a pilocarpine-induced rat model of status epilepticus and found that it significantly reduces the brain hippocampal inflammation.53. We complete the characterization of this compound with in vitro anti-inflammatory effect in a cell culture model shown below.
Anti-Inflammatory Effects of TG8-260 (2f) In Vitro
We have shown that EP2 plays a proinflammatory role in vitro and in in vivo models of brain injury.22,57,58 Microglia are resident macrophages in the brain, and the BV2 cell line created from them has been shown to share several features of cultured microglia. We have further recreated the BV2 cell line stably overexpressing human EP2 receptors (named BV2-hEP2)18 and used this for screening of EP2 agonists and antagonists to record their inflammatory characteristics. Therefore, we investigated anti-inflammatory effects of TG8-260 in vitro using BV2-hEP2 cells. When BV2-hEP2 cells were treated with 100 ng/mL LPS, mRNA levels of several proinflammatory genes were induced within 2 h, including COX-2, IL-6, IL-1β, TNF (TNFα), and iNOS. The specific EP2 agonist ONO-AE1-259-01 at 30 nM further exacerbated the induction of COX-2, IL-1β, IL-6, and mEP2 (mouse EP2). Treatment with TG8-260 (1 μM) significantly antagonized the effects of the combination of LPS and ONO-AE1-259-1 on COX-2, IL-6, TNF, and mEP2 (Figure 5). Although a trend for antagonism by TG8-260 was observed for IL-1β, statistical significance was not attained. Moreover, it is worth noting that in in vitro cellular models, the activation of EP2 by an agonist downregulated TNF, suggesting that the in vivo observation that EP2 activation increased TNF levels was likely an indirect effect.17,22 Nonetheless, treatment with TG8-260 reversed the effect of an EP2 agonist on the TNF level in BV2-EP2 microglia cells (Figure 5). In a control experiment, incubation of the BV2-hEP2 cell line with TG8-260 (1 μM) in the presence or absence of LPS did not show a significant effect on the induction of inflammatory mediators (not shown).
Figure 5.

TG8-260 reverses the induction of inflammatory mediators in the BV2-hEP2 cell line. The mean fold change in mRNA expression of a small panel of inflammatory mediators in BV2-hEP2 cells upon treatment with lipopolysaccharide (LPS), ONO-AE1-259-01 (30 nM), and TG8-260 is shown. BV2-hEP2 were seeded at 200 000 cells/well and incubated overnight. The cultures were treated with vehicle, TG8-260, or ONO-AE1-259-01 only for 1 h and vehicle, TG8-260, or ONO-AE1-259-01 with LPS for 2 h. Analyte mRNAs were measured by quantitative real-time polymerase chain reaction (qRT-PCR). Although fold changes are shown in the figure, ΔΔCT values were used for statistical analysis as they were normally distributed. Differences in chemical treatment were analyzed by analysis of variance (ANOVA) with post hoc Holm–Sidak multiple comparison test. * = p < .05, *** = p < .001. The experiment was repeated with four independent cultures of different passages.
Conclusions
We identified a novel EP2 antagonist, 2f (TG8-260), with high potency and selectivity and excellent oral bioavailability in rats. Overall, this molecule is 3.6-fold more potent than previous peripherally restricted lead 1c (TG8-69), with better selectivity and human liver microsomal stability. It also showed relatively (better than the previous lead TG8-69) higher cell permeability but also a higher efflux ratio, indicating that it is a substrate for P-glycoprotein efflux pump. While it displayed requisite terminal half-life and oral bioavailability (77%) for use in animal models, its literal terminal half-life (2.14 h by oral) is not superior to TG8-69 for which mouse plasma oral half-life was 10.5 h and bioavailability was 14.5%. TG8-260 and three other selected compounds in the class do not show cytotoxicity up to 50 μM and have low [3H]-dofetilide binding, an indicator of low hERG inhibition. While the preparation of 1c (TG8-69) in large quantity was logistically challenging, we optimized the synthetic route for TG8-260 on the multigram scale and synthesized up to 40 g. We also demonstrated that this compound reversed the inflammatory gene modulation induced by EP2 activation in BV2-hEP2 cells. However, TG8-260 was a potent in vitro CYP inhibitor as well as exhibits differences in the hepatic extraction ratios and intrinsic clearance values across species albeit more reasonable in human liver microsomes. In addition, TG8-260 showed high plasma protein binding across all five species studied and was a PgP substrate; it also showed an off-target receptor activity against HT2A and HT2B targets at 10 μM. These parameters would need to be kept foremost as further PK, PK/PD, metabolism, and toxicology studies in rodents and second species proceed toward a regulatory milestone. Interestingly, although its literal brain-to-plasma ratio is very low (0.02), TG8-260 provided anti-inflammatory benefits in the acute brain injury model of status epilepticus, which was likely due to its peripheral actions based on the brain unbound fraction (ratio of free brain to free plasma = 0.006). Overall, the in vitro and in vivo data support the use of TG8-260 as a novel anti-inflammatory agent for the treatment of other peripheral inflammatory disease models.
Experimental Methods
General experimental procedures, sources of the other chemical reagents, and instruments and methods used for characterization were described in the Supporting Information.
4-(2-Bromoacetyl)benzoic Acid (11)
To a solution of 4-acetyl benzoic acid (10 g, 60.97 mmol, 1 equiv) in acetic acid (60 mL) was added dropwise bromine in acetic acid (9.75 g in 30 mL) and stirred at 70 °C for 1 h. The precipitated solid was filtered, dried, and taken to the next step (yield: 95%); 1H NMR (400 MHz, DMSO-d6): δ 13.40 (s, 1H), 8.25–7.89 (m, 4H), 5.12–4.83 (m, 2H); LC-MS (ESI): >97% purity at λ = 254 nm; MS m/z 242 [M – H]+.
4-(1H-Imidazol-4-yl)benzoic Acid (6f)
To compound 11 (14 g, 57.8 mmol, 1 equiv) was added formamide (15 mL) and heated to 175 °C for 5 h. The reaction mixture was cooled to room temperature, diluted with water (15 mL), and the solid was filtered. The solid was further washed with acetone (25 mL) followed by methanol (25 mL) and dried to get the required acid, 6f (yield: 59%); 1H NMR (400 MHz, DMSO-d6): δ 9.26 (d, J = 1.4 Hz, 1H), 8.31 (d, J = 1.4 Hz, 1H), 8.08–7.98 (m, 4H); LC-MS (ESI): >98% purity at λ = 254 nm; MS m/z 189 [M + H]+.
4-(1H-Imidazol-4-yl)-N-(2-(2-methyl-1H-indol-3-yl)ethyl)benzamide (2f, TG8-260)
Optimized Method
To a solution of compound 6f (3 g, 15.9 mmol, 1 equiv) in THF (30 mL) was added triethylamine (8.8 mL, 63.8 mmol, 4 equiv) followed by TBTU (5.1 g, 15.9 mmol, 1 equiv) and stirred for 30 min at 25 °C. Then, compound 12 (2.77g, 15.9 mmol, 1. equiv) was added and heated to 40 °C for 48 h. The reaction mixture was cooled, diluted with water (10 mL), and extracted with ethyl acetate (2 × 15 mL). The combined organic layer was dried over sodium sulfate, concentrated, and purified on silica gel chromatography using 6–7% of methanol in dichloromethane to afford the product (yield: 52%). 1H NMR (400 MHz, DMSO-d6): δ 12.27 (s, 1H), 10.73 (s, 1H), 8.59–8.50 (m, 1H), 7.89–7.79 (m, 4H), 7.78–7.70 (broad s, 2H), 7.49 (d, J = 7.6 Hz, 1H), 7.23 (d, J = 7.7 Hz, 1H), 7.01–6.89 (m, 2H), 3.46–3.35 (m, 2H), 2.89 (t, J = 7.3 Hz, 2H), 2.32 (d, J = 1.7 Hz, 3H); LC-MS (ESI): >95% purity at λ = 254 nm. MS m/z 345 [M + H]+; HPLC purity: 99.3%.
Please see the Supporting Information for synthetic methods for other intermediates and novel EP2 antagonists 2a–d and g–j.
Cell Culture
The rat C6-glioma (C6g) cells stably expressing human EP2, EP4, DP1, or IP receptors were created in the laboratory33,39,52 and grown in Dulbecco’s modified Eagle’s medium (DMEM) (Invitrogen) supplemented with 10% (v/v) fetal bovine serum (FBS) (Invitrogen), 100 U/mL penicillin, 100 μg/mL streptomycin (Invitrogen), and 0.5 μg/mL G418 (Invitrogen).
Cell-Based TR-FRET Assay
We recently described the details of the assay.33,39,52 The TR-FRET assay is performed as per the Cisbio Bioassay kit protocol. Briefly, the assay is based on the generation of a FRET signal upon the interaction of two molecules, an anti-cAMP antibody coupled to a FRET donor (Cryptate) and cAMP coupled to a FRET acceptor (d2). Endogenous cAMP produced by cells competes with labeled cAMP for binding to the cAMP antibody and thus reduces the FRET signal. Cells expressing EP2, EP4, DP1, or IP receptors were seeded into 384-well plates in 40 μL complete medium (4000 cells/well) and grown overnight. The medium was removed, and 10 μL Hanks’ buffered salt solution (HBSS) containing 20 μM rolipram was added into the wells to block phosphodiesterases. The cells were incubated at room temperature for 0.5 h and then treated with vehicle or test compound for 30 min before the addition of increasing concentrations of appropriate agonist: PGE2 for EP2 and EP4, BW245C for DP1, or iloprost for IP. The cells were incubated at room temperature for 40 min, then lysed in 10 μL lysis buffer containing the FRET acceptor cAMP-d2, and 1 min later, another 10 μL lysis buffer with anti-cAMP-Cryptate was added. After 1–2 h incubation at room temperature, the FRET signal was measured by an Envision 2103 Multilabel Plate Reader (PerkinElmer Life Sciences) with laser excitation at 337 nm and dual emissions at 665 and 590 nm for d2 and Cryptate (50 μs delay), respectively. The FRET signal was expressed as F665/F590 × 104. The data were analyzed and plotted using Origin 9.8 software.
Cytokine Induction Assay in BV2-hEP2 Microglia Cells
The details of the cell line and assay are described recently.18,39 Briefly, stable BV2-hEP2 cells were grown overnight on poly-d-lysine-coated 12-well plates at 200 000 cells per well in culture media. The cells were incubated with test compound 2f (TG8-260) (0.3 or 1 μM) for 1 h and EP2-selective agonist ONO-AE1-259-1 (30 nM) for an additional hour and subsequently LPS (100 ng/mL) for 2 h. Following incubation, media was removed from the wells and the cells were subjected to RNA extraction and purification using Trizol and the Zymo Research Quick-RNA miniprep kit according to the manufacturer’s protocol (Genesee Scientific). First-strand cDNA synthesis, qRT-PCR, and analysis were performed using the primers. Glyceraldehyde-3-phosphate dehydrogenase (GAPDH) was used as a single internal control for relative quantification to determine whether EP2 activation modulates the expression of inflammatory mediators in BV2-hEP2 microglia (Figure 5). PCR gene expression data are presented as the mean fold change of each gene of interest in the compound-treated groups compared to that of vehicle.
In Vitro ADMET Assays
All in vitro ADME assays in Tables 3–6 were performed at AMRI or Absorption Systems or Sai-Life (India) Laboratories.
CYP Inhibition Using Human Liver Microsomes
Pooled mixed-gender human donor microsomes (Lot# PLF) were obtained from Bioreclamation IVT (Baltimore, MD), and other reagents were obtained from commercial sources. TG8-260 was prepared as a 10 mM stock solution in acetonitrile. Eight CYP isoforms in human liver microsomes (1A2, 2C9, 2C19, 2D6, 2C8, 2B6, and 3A4) were tested for inhibition by the test compound using probe substrate-based assays. Two probe substrates, testosterone, and midazolam, were used for CYP 3A4. Eight serial dilutions (3-fold, 100–0.0457 μM final concentration) of TG8-260 stock solution were prepared before incubation. This dilution series was incubated at 37 °C in human liver microsomes diluted to 0.2–0.4 mg/mL in 0.05 M phosphate buffer at pH 7.4 along with an appropriate probe substrate for each respective isoform. The concentration of the probe substrate added was at or near the Km value for each CYP isoform. Reaction mixtures contained an NADPH-regenerating system (1.3 mM NADP+, 3 mM glucose-6-phosphate, 12 U/mL glucose-6-phosphate dehydrogenase, and 3 mM magnesium chloride). The final reaction volume was 0.20 mL, and the reaction was terminated by adding a 400 μL volume of ice-cold acetonitrile containing appropriate internal standard to the incubation. Incubation times were previously optimized at AMRI to ensure linear kinetics. Measurement of the inhibition of each CYP isoform was carried out by mass spectrometric detection of the CYP-specific metabolite of each probe substrate, using multiple reaction monitoring (MRM). The extent of inhibition was calculated by comparing metabolite formation in samples incubated with test compound versus control wells incubated with solvent, keeping the final organic content the same across all samples. IC50 values were calculated using nonlinear regression of the data to the four-parameter logistic model (dose–response equation) fit with XLFit 5.2 from IDBS Software (Emeryville, CA).
Plasma Protein Binding across Species
Pooled mixed-gender human donor plasma (Lot # HMN363245), Sprague-Dawley male rat plasma (Lot # RAT427414), CD-1 (ICR) male mouse plasma (Lot # MSE347255), male beagle dog plasma (Lot # BGL111729), and male cynomolgus monkey plasma (Lot # CYN183368) were obtained from Bioreclamation Inc. (Westbury, NY). Frozen plasma was thawed, and the pH of plasma and BupH phosphate-buffered saline was adjusted to 7.4 before dialysis. Into each well of a reusable Teflon 48-well base plate, a RED insert was placed open end up. Ten microliters (10 μL) of the test compound (0.1 mM in acetonitrile/water, 1:1 v/v) was added to 990 μL of plasma to achieve a 1 μM final concentration. The spiked plasma (200 μL) was added to the sample chamber, which is indicated by the red retainer ring (donor side). To the other side (receiver side), 350 μL of BupH phosphate-buffered saline (pH 7.4) was added. A buffer-to-buffer assay was also performed to measure equilibrium across the membrane in the absence of plasma protein. Propranolol was used as a positive control. All samples were prepared in triplicate. The RED device base plate was then sealed and placed in a shaking incubator set to maintain 37 °C and 200 rpm for 4 h.
After incubation, 100 μL of each sample was combined with an equal volume of either plasma or buffer to create a similar matrix for all samples. Blank buffer was added to plasma samples and vice versa. Samples from the incubation, along with the original compound-spiked plasma samples, were prepared for analysis in the same manner. Protein precipitation by the addition of two parts of ice-cold acetonitrile to one part of reaction volume was carried out. To ensure complete protein precipitation, samples were sealed and placed overnight at 4 °C. The next morning, samples were centrifuged at 3600 rpm for 15 min. The supernatants (70 μL) were supplemented with an equal volume of internal standard solution (0.15 μM verapamil in water) and subjected to LC/MS/MS analysis. The data reported are percent plasma protein binding (% PPB), which is obtained from the calculated fraction unbound (fu)
where R is the ratio of the peak area of the compound over the peak area of the internal standard by LC/MS/MS.
Metabolic Clearance in Liver Microsomes
TG8-260 (2f) was prepared as a 10 mM stock solution in DMSO. Mixed-gender pooled human microsomes (Lot-DTE), male Sprague-Dawley rat microsomes (Lot-DRI), male CD-1 mouse microsomes (Lot-WNA), and male beagle dog microsomes (Lot-ITC) were obtained from Bioreclamation IVT (Baltimore, MD). A mixture containing 50 mM potassium phosphate buffer pH 7.4 and 1 mg/mL liver microsomes was prewarmed for 10 min at 37 °C in a shaking water bath, followed by the addition of test compound. Reactions with cofactor were initiated by adding an NADPH-regenerating system to the incubation mixtures (final concentrations of 1.3 mM NADP+, 3.3 mM glucose-6-phosphate, and 0.4 U/mL glucose-6-phosphate dehydrogenase). The final volume of the reaction mixture was 800 μL, containing 1 mg/mL liver microsomes and 1 μM test compound. After 0, 5, 10, 15, 30, and 45 min of incubation, 100 μL of reaction mixtures was added to 150 μL of ice-cold acetonitrile in a designated well of a 96-well plate. The 96-well plate was placed on ice for 15 min, and samples were centrifuged (3600 rpm, 10 min, 4 °C) to precipitate the protein. The supernatants were diluted 1:1 (v/v) with water containing 0.015 μM verapamil (internal standard) in a 96-well shallow plate, which was sealed for liquid chromatography-mass spectrometry (LC-MS) analysis. All measurements were done in duplicate.
At each sample time, the residual compound remaining (%R) was determined from LC-MS peak areas by comparison to the zero-time point. Metabolic half-life (t1/2) and intrinsic clearance (CLint) values were calculated from the slope of the plot of ln(%R) vs time and the amount of microsomal protein present in the incubation. The percent remaining at 30 min was calculated by plugging the 30 min value into the slope equation generated from %R vs time linear plot. In vivo hepatic clearance CLH was calculated using the well-stirred liver model according to the following equation
where QH is the total liver blood flow, fu is the unbound fraction of the drug, and CLint′ is defined as follows: CLint = CLint × (mg microsomal protein/g of liver weight) × (g liver weight/kg of body weight). In the first approximation, used in this study, fu = 1. Hepatic extraction ratio EH was calculated using the following equation
PgP Substrate Assessment Using Caco-2 and MDR1-MDCK Monolayers
Caco-2 or MDR1-MDCK cell monolayers were grown to confluence on collagen-coated, microporous membranes in 12-well assay plates. The permeability assay buffer was Hanks’ balanced salt solution (HBSS) containing 10 mM HEPES and 15 mM glucose at a pH of 7.4. The buffer in the receiver chamber also contained 1% bovine serum albumin. The dosing solution concentration was 5 μM of the test article in the assay buffer ±1 μM valspodar. Cells were first preincubated for 30 min with HBSS containing ±1 μM valspodar. Cell monolayers were dosed on the apical side (A to B) or basolateral side (B to A) and incubated at 37 °C with 5% CO2 in a humidified incubator. Samples were taken from the donor and receiver chambers at 120 min. Each determination was performed in duplicate. The flux of lucifer yellow was also measured postexperimentally for each monolayer to ensure no damage was inflicted to the cell monolayers during the flux period. All samples were assayed by LC-MS/MS using electrospray ionization. The apparent permeability (Papp) and percent recovery were calculated as follows
| 1 |
| 2 |
where
dCr/dt is the slope of the cumulative receiver concentration versus time in μM s–1;
Vr is the volume of the receiver compartment in cm3;
Vd is the volume of the donor compartment in cm3;
A is the area of the insert (1.13 cm2 for 12-well);
CA is the average of the nominal dosing concentration and the measured 120 min donor concentration in μM;
CN is the nominal concentration of the dosing solution in μM;
Crfinal is the cumulative receiver concentration in μM at the end of the incubation period;
Cdfinal is the concentration of the donor in μM at the end of the incubation period.
Efflux ratio (ER) is defined as Papp (B to A)/Papp (A to B).
PgP Inhibition Assessment Using Caco-2 and MDR1-MDCK Monolayers
Cells and assay buffer were as described above. The dosing solution concentration was 10 μM of digoxin in the assay buffer ±10 μM TG8-260. Cells were first preincubated for 30 min with HBSS containing ±10 μM TG8-260. Cell monolayers were dosed on the apical side (A to B) or basolateral side (B to A) and incubated at 37 °C with 5% CO2 in a humidified incubator. Samples were taken from the donor and receiver chambers at 120 min. Each determination was performed in duplicate. The flux of lucifer yellow was also measured postexperimentally for each monolayer to ensure no damage was inflicted to the cell monolayers during the flux period. All samples were assayed by LC-MS/MS using electrospray ionization. Calculations were as above.
Pharmacokinetic Analysis
Healthy male C57BL/6 mice or SD rats (8–12 weeks old) weighing between 22 and 27 g (mice) or 200 and 300 g (rats) were administered TG8-260 (2f) by intravenous or intraperitoneal injections (bolus) into mice or by oral route to rats in a formulation with dose shown in Table 2. Blood samples (approximately 120 μL) were collected from retro-orbital plexus of three animals at times 0.08, 0.25, 0.5, 1, 2, 4, 8, 8.25, 8.5, 9, 10, 12, and 24 h. Samples were collected into labeled microtubes containing K2EDTA solution (20% K2EDTA solution) as an anticoagulant. Plasma was immediately harvested from the blood by centrifugation at 4000 rpm for 10 min at 4 ± 2 °C and stored below −70 °C until bioanalysis. Immediately after the collection of blood, brain samples were collected from three rats at each time point at 2, 4, 8, 10, and 24 h or three mice in the ip injection group. Brain samples were homogenized using ice-cold phosphate-buffered saline (pH 7.4) in a ratio of 2 (buffer):1 (brain), and homogenates were stored below −70 ± 10 °C until analysis. The total homogenate volume was three times the brain weight. Concentrations of TG8-260 (2f) in plasma and brain samples were determined by the fit-for-purpose LC-MS/MS method (Sai-Life, India). Phoenix WinNonlin (version 8.0) was used to analyze the pharmacokinetics parameters presented in Table 2. The data were plotted using Origin 9.8 software.
Acknowledgments
The authors thank Dr. Asheebo Rojas for his technical assistance. This work was supported by NIH/NIA grant U01 AG052460 (T.G.), NINDS grant R33 NS101167 (T.G.), and R01 NS097776 (R.D.). The authors also thank NIH Blueprint Neurotherapeutics Network (BPN)/NINDS Award Number UG3NS113879 (R.D. and T.G.) and AMRI for their support in conducting the in vitro ADMET screening under NIH Contract Number HHSN271201800001I and also thank ONO Pharmaceutical Co. (Osaka, Japan) for providing ONO-AE1-259-01.
Glossary
Abbreviations
- SE
status epilepticus
- AD
Alzheimer’s disease
- CNS
central nervous system
- PD
Parkinson’s disease
- COX-2
cyclooxygenase-2
- Pd(dppf)Cl2.DCM
[1,1′-bis(diphenylphosphino)ferrocene] dichloropalladium(II)
- LiOH
lithium hydroxide
- K3PO4
potassium phosphate
- CuI
copper iodide
- Cu(OAc)2
copper acetate
- EDCI·HCl
1-ethyl-3-(3-dimethylaminopropyl)carbodiimide·hydrochloride
- DMAP
N,N-dimethylamino pyridine
- SAR
structure–activity relationship
- DMF
N,N-dimethyl formamide
- DMSO
dimethyl sulfoxide
- DIPEA
diisopropylethyl amine
- PyBOP
(benzotriazol-1-yl-oxytripyrrolidinophosphonium hexafluorophosphate)
- TSTU
O-(N-succinimidyl)-N,N,N′,N′-tetramethyluronium tetrafluoroborate
- TBTU
N,N,N′,N′-tetramethyl-O-(benzotriazol-1-yl)uronium tetrafluoroborate
- SOCl2
thionyl chloride
- COCl2
oxalyl chloride
- MOM
methoxymethyl
- LPS
lipopolysaccharide
- IL-6
interleukin-6
- IL-1β
interleukin-1β
- TNF (TNFα)
tumor necrosis factor-α
- iNOS
inducible nitric oxide synthase
- mEP2
mouse prostaglandin-E2 receptor, EP2
- hEP2
human prostaglandin-E2 receptor EP2
- hERG
the human-ether-a-go-go-related gene
- ADMET
adsorption, distribution, metabolism, excretion, and toxicity
Supporting Information Available
The Supporting Information is available free of charge at https://pubs.acs.org/doi/10.1021/acsptsci.1c00255.
Experimental procedures, scanned NMR spectra of all of the new compounds and HPLC spectra of key compounds, and bioactivity data for other key compounds (PDF)
Author Contributions
T.G.designed the overall research. R.D., and R.F. participated in research design. T.G., R.A., S.M., and A.B. performed the research. T.G., A.B., R.F., and R.D. participated in data analysis. T.G., R.A., R.F., and R.D. wrote the manuscript, and others contributed to the writing or editing of the manuscript.
The authors declare the following competing financial interest(s): Authors T.G. and R.D. are the founders of, and have equity in Pyrefin Inc, which has licensed technology from Emory University in which T.G., R.D. and R.A. are inventors.
Supplementary Material
References
- Vezzani A.; French J.; Bartfai T.; Baram T. Z.. The role of inflammation in epilepsy. Nat Rev Neurol. 2011;7():31–40 10.1038/nrneurol.2010.178 [DOI] [PMC free article] [PubMed] [Google Scholar]
- Vezzani A.; Friedman A.; Dingledine R. J.. The role of inflammation in epileptogenesis. Neuropharmacology. 2013;69:16–24 10.1016/j.neuropharm.2012.04.004 [DOI] [PMC free article] [PubMed] [Google Scholar]
- Niesman I. R.; Schilling J. M.; Shapiro L. A.; Kellerhals S. E.; Bonds J. A.; Kleschevnikov A. M.; Cui W.; Voong A.; Krajewski S.; Ali S. S.; Roth D. M.; Patel H. H.; Patel P. M.; Head B. P.. Traumatic brain injury enhances neuroinflammation and lesion volume in caveolin deficient mice. J Neuroinflammation. 2014;11:39. 10.1186/1742-2094-11-39 [DOI] [PMC free article] [PubMed] [Google Scholar]
- Minghetti L. Role of inflammation in neurodegenerative diseases. Curr Opin Neurol. 2005, 18, 315–321. 10.1097/01.wco.0000169752.54191.97. [DOI] [PubMed] [Google Scholar]
- Hirsch E. C.; Vyas S.; Hunot S.. Neuroinflammation in Parkinson’s disease. Parkinsonism Relat. Disord. 2012;18 :S210–S212 10.1016/S1353-8020(11)70065-7 [DOI] [PubMed] [Google Scholar]
- Heneka M. T.; Carson M. J.; El Khoury J.; Landreth G. E.; Brosseron F.; Feinstein D. L.; Jacobs A. H.; Wyss-Coray T.; Vitorica J.; Ransohoff R. M.; Herrup K.; Frautschy S. A.; Finsen B.; Brown G. C.; Verkhratsky A.; Yamanaka K.; Koistinaho J.; Latz E.; Halle A.; Petzold G. C.; Town T.; Morgan D.; Shinohara M. L.; Perry V. H.; Holmes C.; Bazan N. G.; Brooks D. J.; Hunot S.; Joseph B.; Deigendesch N.; Garaschuk O.; Boddeke E.; Dinarello C. A.; Breitner J. C.; Cole G. M.; Golenbock D. T.; Kummer M. P.. Neuroinflammation in Alzheimer’s disease. Lancet Neurol. 2015;14():388–405 10.1016/S1474-4422(15)70016-5 [DOI] [PMC free article] [PubMed] [Google Scholar]
- McInnes I. B.; Schett G. The pathogenesis of rheumatoid arthritis. N. Engl. J. Med. 2011, 365, 2205–2219. 10.1056/NEJMra1004965. [DOI] [PubMed] [Google Scholar]
- Singh U. P.; Singh N. P.; Murphy E. A.; Price R. L.; Fayad R.; Nagarkatti M.; Nagarkatti P. S.. Chemokine and cytokine levels in inflammatory bowel disease patients. Cytokine. 2016;77:44–49 10.1016/j.cyto.2015.10.008 [DOI] [PMC free article] [PubMed] [Google Scholar]
- Wang Y.; Nicholes K.; Shih I. M.. The Origin and Pathogenesis of Endometriosis. Annu. Rev. Pathol. 2020;15:71–95 10.1146/annurev-pathmechdis-012419-032654 [DOI] [PMC free article] [PubMed] [Google Scholar]
- Coussens L. M.; Werb Z.. Inflammation and cancer. Nature. 2002;420():860–867 10.1038/nature01322 [DOI] [PMC free article] [PubMed] [Google Scholar]
- Shacter E.; Weitzman S. A. Chronic inflammation and cancer. Oncology 2002, 16, 217–226. 229; discussion 230-2. [PubMed] [Google Scholar]
- van Vliet E. A.; Aronica E.; Vezzani A.; Ravizza T.. Review: Neuroinflammatory pathways as treatment targets and biomarker candidates in epilepsy: emerging evidence from preclinical and clinical studies. Neuropathol. Appl. Neurobiol. 2018;44():91–111 10.1111/nan.12444 [DOI] [PubMed] [Google Scholar]
- Block M. L.; Zecca L.; Hong J. S.. Microglia-mediated neurotoxicity: uncovering the molecular mechanisms. Nat. Rev. Neurosci. 2007;8():57–69 10.1038/nrn2038 [DOI] [PubMed] [Google Scholar]
- Ganesh T.Prostanoid receptor EP2 as a therapeutic target. J. Med. Chem.. 2014;57():4454–4465 10.1021/jm401431x [DOI] [PMC free article] [PubMed] [Google Scholar]
- Jiang J.; Dingledine R.. Prostaglandin receptor EP2 in the crosshairs of anti-inflammation, anti-cancer, and neuroprotection. Trends Pharmacol. Sci. 2013;34():413–423 10.1016/j.tips.2013.05.003 [DOI] [PMC free article] [PubMed] [Google Scholar]
- Sluter M. N.; Hou R.; Li L.; Yasmen N.; Yu Y.; Liu J.; Jiang J.. EP2 Antagonists (2011-2021): A Decade’s Journey from Discovery to Therapeutics. J. Med. Chem.. 2021;64():11816–11836 10.1021/acs.jmedchem.1c00816 [DOI] [PMC free article] [PubMed] [Google Scholar]
- Quan Y.; Jiang J.; Dingledine R.. EP2 receptor signaling pathways regulate classical activation of microglia. J. Biol. Chem.. 2013;288():9293–9302 10.1074/jbc.M113.455816 [DOI] [PMC free article] [PubMed] [Google Scholar]
- Rojas A.; Banik A.; Chen D.; Flood K.; Ganesh T.; Dingledine R.. Novel Microglia Cell Line Expressing the Human EP2 Receptor. ACS Chem. Neurosci. 2019;10():4280–4292 10.1021/acschemneuro.9b00311 [DOI] [PubMed] [Google Scholar]
- Rojas A.; Ganesh T.; Wang W.; Wang J.; Dingledine R.. A rat model of organophosphate-induced status epilepticus and the beneficial effects of EP2 receptor inhibition. Neurobiol. Dis. 2020;133:104399 10.1016/j.nbd.2019.02.010 [DOI] [PMC free article] [PubMed] [Google Scholar]
- Varvel N. H.; Espinosa-Garcia C.; Hunter-Chang S.; Chen D.; Biegel A.; Hsieh A.; Blackmer-Raynolds L.; Ganesh T.; Dingledine R.. Peripheral Myeloid Cell EP2 Activation Contributes to the Deleterious Consequences of Status Epilepticus. J Neurosci. 2021;41():1105–1117 10.1523/JNEUROSCI.2040-20.2020 [DOI] [PMC free article] [PubMed] [Google Scholar]
- Rojas A.; Chen D.; Ganesh T.; Varvel N. H.; Dingledine R.. The COX-2/prostanoid signaling cascades in seizure disorders. Expert Opin. Ther. Targets. 2019;23():1–13 10.1080/14728222.2019.1554056 [DOI] [PMC free article] [PubMed] [Google Scholar]
- Jiang J.; Quan Y.; Ganesh T.; Pouliot W. A.; Dudek F. E.; Dingledine R. Inhibition of the prostaglandin receptor EP2 following status epilepticus reduces delayed mortality and brain inflammation. Proc. Natl. Acad. Sci. U.S.A. 2013, 110, 3591–3596. 10.1073/pnas.1218498110. [DOI] [PMC free article] [PubMed] [Google Scholar]
- Varvel N. H.; Jiang J.; Dingledine R.. Candidate drug targets for prevention or modification of epilepsy. Annu. Rev. Pharmacol. Toxicol. 2015;55:229–247 10.1146/annurev-pharmtox-010814-124607 [DOI] [PMC free article] [PubMed] [Google Scholar]
- Jiang J.; Yu Y.; Kinjo E. R.; Du Y.; Nguyen H. P.; Dingledine R.. Suppressing pro-inflammatory prostaglandin signaling attenuates excitotoxicity-associated neuronal inflammation and injury. Neuropharmacology. 2019;149:149–160 10.1016/j.neuropharm.2019.02.011 [DOI] [PMC free article] [PubMed] [Google Scholar]
- Nagib M. M.; Yu Y.; Jiang J.. Targeting prostaglandin receptor EP2 for adjunctive treatment of status epilepticus. Pharmacol. Ther. 2020;209:107504 10.1016/j.pharmthera.2020.107504 [DOI] [PMC free article] [PubMed] [Google Scholar]
- Qiu J.; Li Q.; Bell K. A.; Yao X.; Du Y.; Zhang E.; Yu J. J.; Yu Y.; Shi Z.; Jiang J.. Small-molecule inhibition of prostaglandin E receptor 2 impairs cyclooxygenase-associated malignant glioma growth. Br. J. Pharmacol. 2019;176():1680–1699 10.1111/bph.14622 [DOI] [PMC free article] [PubMed] [Google Scholar]
- Greaves E.; Horne A. W.; Jerina H.; Mikolajczak M.; Hilferty L.; Mitchell R.; Fleetwood-Walker S. M.; Saunders P. T. EP2 receptor antagonism reduces peripheral and central hyperalgesia in a preclinical mouse model of endometriosis. Sci. Rep. 2017, 7, 44169 10.1038/srep44169. [DOI] [PMC free article] [PubMed] [Google Scholar]
- Aoki T. F.J.; Fukuda M.; Bando K.; Shioi G.; Tsuji K.; Ollikainen E.; Nozaki K.; Laakkonen J.; Narumiya S. Prostaglandin E2-EP2-NF-kappaB signaling in macrophages as a potential therapeutic target for intracranial aneurysms. Sci. Signaling 2017, 10, eaah6037 10.1126/scisignal.aah6037. [DOI] [PubMed] [Google Scholar]
- Ignatowicz A. P. D.; Mula R.; Dingledine R.; Ganesh T.; Shashidharamurthy R. Prostaglandin E2 receptor (EP2): a novel target to attenuate excessive bone loss during autoimmune arthritis. J. Immunol. 2017, 198, 217–218. [Google Scholar]
- Jiang J. X.; Dingledine R.. Role of Prostaglandin Receptor EP2 in the Regulations of Cancer Cell Proliferation, Invasion, and Inflammation. J. Pharmacol. Exp. Ther. 2013;344():360–367 10.1124/jpet.112.200444 [DOI] [PMC free article] [PubMed] [Google Scholar]
- Jiang C.; Caskurlu A.; Ganesh T.; Dingledine R. Inhibition of the prostaglandin EP2 receptor prevents long-term cognitive impairment in a model of systemic inflammation. Brain, Behav., Immun. Health 2020, 8, 100132 10.1016/j.bbih.2020.100132. [DOI] [PMC free article] [PubMed] [Google Scholar]
- Ganesh T.; Jiang J.; Yang M. S.; Dingledine R.. Lead optimization studies of cinnamic amide EP2 antagonists. J. Med. Chem.. 2014;57():4173–4184 10.1021/jm5000672 [DOI] [PMC free article] [PubMed] [Google Scholar]
- Jiang J.; Ganesh T.; Du Y.; Quan Y.; Serrano G.; Qui M.; Speigel I.; Rojas A.; Lelutiu N.; Dingledine R.. Small molecule antagonist reveals seizure-induced mediation of neuronal injury by prostaglandin E2 receptor subtype EP2. Proc. Natl. Acad. Sci. U.S.A.. 2012;109():3149–3154 10.1073/pnas.1120195109 [DOI] [PMC free article] [PubMed] [Google Scholar]
- Ganesh T.; Jiang J.; Shashidharamurthy R.; Dingledine R.. Discovery and characterization of carbamothioylacrylamides as EP2 selective antagonists. ACS Med. Chem. Lett. 2013;4():616–621 10.1021/ml400112h [DOI] [PMC free article] [PubMed] [Google Scholar]
- Ganesh T.; Jiang J.; Dingledine R.. Development of second generation EP2 antagonists with high selectivity. Eur. J. Med. Chem.. 2014;82:521–535 10.1016/j.ejmech.2014.05.076 [DOI] [PMC free article] [PubMed] [Google Scholar]
- Ganesh T.; Banik A.; Dingledine R.; Wang W.; Amaradhi R.. Peripherally Restricted, Highly Potent, Selective, Aqueous-Soluble EP2 Antagonist with Anti-Inflammatory Properties. Mol. Pharmaceutics 2018;15():5809–5817 10.1021/acs.molpharmaceut.8b00764 [DOI] [PMC free article] [PubMed] [Google Scholar]
- af Forselles K. J.; Root J.; Clarke T.; Davey D.; Aughton K.; Dack K.; Pullen N.. In vitro and in vivo characterization of PF-04418948, a novel, potent and selective prostaglandin EP(2) receptor antagonist. Br. J. Pharmacol. 2011;164():1847–1856 10.1111/j.1476-5381.2011.01495.x [DOI] [PMC free article] [PubMed] [Google Scholar]
- Fox B. M.; Beck H. P.; Roveto P. M.; Kayser F.; Cheng Q.; Dou H.; Williamson T.; Treanor J.; Liu H.; Jin L.; Xu G.; Ma J.; Wang S.; Olson S. H.. A selective prostaglandin E2 receptor subtype 2 (EP2) antagonist increases the macrophage-mediated clearance of amyloid-beta plaques. J. Med. Chem.. 2015;58():5256–5273 10.1021/acs.jmedchem.5b00567 [DOI] [PubMed] [Google Scholar]
- Amaradhi R.; Banik A.; Mohammed S.; Patro V.; Rojas A.; Wang W.; Motati D. R.; Dingledine R.; Ganesh T.. Potent, Selective, Water Soluble, Brain-Permeable EP2 Receptor Antagonist for Use in Central Nervous System Disease Models. J. Med. Chem.. 2020;63():1032–1050 10.1021/acs.jmedchem.9b01218 [DOI] [PMC free article] [PubMed] [Google Scholar]
- Klapars A.; Huang X.; Buchwald S. L.. A general and efficient copper catalyst for the amidation of aryl halides. J. Am. Chem. Soc. 2002;124():7421–7428 10.1021/ja0260465 [DOI] [PubMed] [Google Scholar]
- Deng W.; Zhang C.; Liu M.; Zou Y.; Liu L.; Guo Q. X.. Mild and efficient CuI catalyzed coupling reactions of amides with bromides. Chin. J. Chem.. 2005;23():1241–1246 10.1002/cjoc.200591241 [DOI] [Google Scholar]
- Mallinger A.; Schiemann K.; Rink C.; Sejberg J.; Honey M. A.; Czodrowski P.; Stubbs M.; Poeschke O.; Busch M.; Schneider R.; Schwarz D.; Musil D.; Burke R.; Urbahns K.; Workman P.; Wienke D.; Clarke P. A.; Raynaud F. I.; Eccles S. A.; Esdar C.; Rohdich F.; Blagg J.. 2,8-Disubstituted-1,6-Naphthyridines and 4,6-Disubstituted-Isoquinolines with Potent, Selective Affinity for CDK8/19. ACS Med. Chem. Lett. 2016;7():573–578 10.1021/acsmedchemlett.6b00022 [DOI] [PMC free article] [PubMed] [Google Scholar]
- Bagal S. K.; Andrews M.; Bechle B. M.; Bian J.; Bilsland J.; Blakemore D. C.; Braganza J. F.; Bungay P. J.; Corbett M. S.; Cronin C. N.; Cui J. J.; Dias R.; Flanagan N. J.; Greasley S. E.; Grimley R.; James K.; Johnson E.; Kitching L.; Kraus M. L.; McAlpine I.; Nagata A.; Ninkovic S.; Omoto K.; Scales S.; Skerratt S. E.; Sun J.; Tran-Dube M.; Waldron G. J.; Wang F.; Warmus J. S.. Discovery of Potent, Selective, and Peripherally Restricted Pan-Trk Kinase Inhibitors for the Treatment of Pain. J. Med. Chem.. 2018;61():6779–6800 10.1021/acs.jmedchem.8b00633 [DOI] [PubMed] [Google Scholar]
- Wang F.; Jeon K. O.; Salovich J. M.; Macdonald J. D.; Alvarado J.; Gogliotti R. D.; Phan J.; Olejniczak E. T.; Sun Q.; Wang S.; Camper D.; Yuh J. P.; Shaw J. G.; Sai J.; Rossanese O. W.; Tansey W. P.; Stauffer S. R.; Fesik S. W.. Discovery of Potent 2-Aryl-6,7-dihydro-5 H-pyrrolo[1,2- a]imidazoles as WDR5-WIN-Site Inhibitors Using Fragment-Based Methods and Structure-Based Design. J. Med. Chem.. 2018;61():5623–5642 10.1021/acs.jmedchem.8b00375 [DOI] [PMC free article] [PubMed] [Google Scholar]
- Norbert K.-H. I. H.; Rainer W.; Heiner E.; Henri D.; Angelo C.; Annette S.-M.. Preparation of N-alkylphenylsulfonamides and related compounds as for the treatment of pain. Ger Offen, DE102006039003A1, 21 Feb 2008.
- Hiroyuki I. F. K.; Hideki I.; Shuji K.; Tomohiro K.; Hidenori A.. Sulfur heterocycle-condensed pyrimidinedione derivatives, prodrugs of them, JNK inhibitors containing them, and pharmaceuticals containing them. Jpn Kokai Tokkyo Koho, JP2004161716, 10 Jun 2004.
- Montgomery T. D.; Nibbs A. E.; Zhu Y.; Rawal V. H.. Rapid access to spirocyclized indolenines via palladium-catalyzed cascade reactions of tryptamine derivatives and propargyl carbonate. Org. Lett. 2014;16():3480–3483 10.1021/ol501409a [DOI] [PMC free article] [PubMed] [Google Scholar]
- Zhang L.; Peng X. M.; Damu G. L.; Geng R. X.; Zhou C. H.. Comprehensive review in current developments of imidazole-based medicinal chemistry. Med. Res. Rev. 2014;34():340–437 10.1002/med.21290 [DOI] [PubMed] [Google Scholar]
- Küçükgüzel Ş. G.; Senkardes S.. Recent advances in bioactive pyrazoles. Eur. J. Med. Chem.. 2015;97:786–815 10.1016/j.ejmech.2014.11.059 [DOI] [PubMed] [Google Scholar]
- Chhabria M. T.; Patel S.; Modi P.; Brahmkshatriya P. S.. Thiazole: A Review on Chemistry, Synthesis and Therapeutic Importance of its Derivatives. Curr. Top Med. Chem.. 2016;16():2841–2862 10.2174/1568026616666160506130731 [DOI] [PubMed] [Google Scholar]
- Bevan C. D.; Lloyd R. S. A high-throughput screening method for the determination of aqueous drug solubility using laser nephelometry in microtiter plates. Anal Chem. 2000, 72, 1781–1787. 10.1021/ac9912247. [DOI] [PubMed] [Google Scholar]
- Jiang J.; Ganesh T.; Du Y.; Thepchatri P.; Rojas A.; Lewis I.; Kurtkaya S.; Li L.; Qui M.; Serrano G.; Shaw R.; Sun A.; Dingledine R.. Neuroprotection by selective allosteric potentiators of the EP2 prostaglandin receptor. Proc. Natl. Acad. Sci. U.S.A.. 2010;107():2307–2312 10.1073/pnas.0909310107 [DOI] [PMC free article] [PubMed] [Google Scholar]
- Rojas A.; Amaradhi R.; Banik A.; Jiang C.; Abreu-Melon J.; Wang S.; Dingledine R.; Ganesh T. A Novel Second-Generation EP2 Receptor Antagonist Reduces Neuroinflammation and Gliosis After Status Epilepticus in Rats. Neurotherapeutics 2021, 18, 1207–1225. 10.1007/s13311-020-00969-5. [DOI] [PMC free article] [PubMed] [Google Scholar]
- Tang C.; Chiba M.; Nishime J.; Hochman J. H.; Chen I.; Williams T. M.; Lin J. H.. Comparison of imidazole- and 2-methyl imidazole-containing farnesyl-protein transferase inhibitors: interaction with and metabolism by rat hepatic cytochrome P450s. Drug Metab. Dispos. 2000;28():680–686 [PubMed] [Google Scholar]
- Chiba M.; Tang C.; Neway W. E.; Williams T. M.; Desolms S. J.; Dinsmore C. J.; Wai J. S.; Lin J. H.. P450 interaction with farnesyl-protein transferase inhibitors metabolic stability, inhibitory potency, and P450 binding spectra in human liver microsomes. Biochem. Pharmacol. 2001;62():773–776 10.1016/s0006-2952(01)00724-9 [DOI] [PubMed] [Google Scholar]
- Franklin M. R.; Constance J. E.. Comparative 1-substituted imidazole inhibition of cytochrome p450 isozyme-selective activities in human and mouse hepatic microsomes. Drug Metab. Rev. 2007;39():309–322 10.1080/03602530701498570 [DOI] [PubMed] [Google Scholar]
- Jiang J.; Yang M. S.; Quan Y.; Gueorguieva P.; Ganesh T.; Dingledine R.. Therapeutic window for cyclooxygenase-2 related anti-inflammatory therapy after status epilepticus. Neurobiol. Dis. 2015;76:126–136 10.1016/j.nbd.2014.12.032 [DOI] [PMC free article] [PubMed] [Google Scholar]
- Rojas A.; Ganesh T.; Lelutiu N.; Gueorguieva P.; Dingledine R.. Inhibition of the prostaglandin EP2 receptor is neuroprotective and accelerates functional recovery in a rat model of organophosphorus induced status epilepticus. Neuropharmacology. 2015;93:15–27 10.1016/j.neuropharm.2015.01.017 [DOI] [PMC free article] [PubMed] [Google Scholar]
Associated Data
This section collects any data citations, data availability statements, or supplementary materials included in this article.