

Abstract
Despite extensive analysis of pRB phosphorylation in vitro, how this modification influences development and homeostasis in vivo is unclear. Here, we show that homozygous Rb∆K4 and Rb∆K7 knock‐in mice, in which either four or all seven phosphorylation sites in the C‐terminal region of pRb, respectively, have been abolished by Ser/Thr‐to‐Ala substitutions, undergo normal embryogenesis and early development, notwithstanding suppressed phosphorylation of additional upstream sites. Whereas Rb∆K4 mice exhibit telomere attrition but no other abnormalities, Rb∆K7 mice are smaller and display additional hallmarks of premature aging including infertility, kyphosis, and diabetes, indicating an accumulative effect of blocking pRb phosphorylation. Diabetes in Rb∆K7 mice is insulin‐sensitive and associated with failure of quiescent pancreatic β‐cells to re‐enter the cell cycle in response to mitogens, resulting in induction of DNA damage response (DDR), senescence‐associated secretory phenotype (SASP), and reduced pancreatic islet mass and circulating insulin level. Pre‐treatment with the epigenetic regulator vitamin C reduces DDR, increases cell cycle re‐entry, improves islet morphology, and attenuates diabetes. These results have direct implications for cell cycle regulation, CDK‐inhibitor therapeutics, diabetes, and longevity.
Keywords: aging, diabetes, knock‐in mice, pRB, retinoblastoma, senescence, vitamin C
Subject Categories: Cell Cycle, Metabolism, Post-translational Modifications & Proteolysis
Abolishing cell‐cycle‐related hyperphosphorylation of the retinoblastoma tumor suppressor in vivo does not impede normal mammalian development, but blocks cell‐cycle reentry and triggers senescence of pancreatic beta‐cells.

Introduction
The retinoblastoma tumor suppressor, pRB, regulates diverse biological processes including cell cycle progression, survival, metabolism, and differentiation and is frequently lost in cancer (Dyson, 2016; Zacksenhaus et al, 2017; Dick et al, 2018; Kitajima et al, 2020). pRB exerts its effects by binding to and modulating the activity of multiple cellular proteins including members of the E2F family of transcription factors (Kent & Leone, 2019). When bound to E2F1‐3, pRB represses transcription by hindering their trans‐activation domains and by recruiting chromatin‐modifying enzymes. In cycling cells, E2F‐bound pRB transiently silences cell cycle genes by recruiting histone deacetylases (Harbour & Dean, 2000), whereas in differentiating cells, pRB engages histone methyltransferases and other histone modifiers that stably suppress cell cycle genes, establishing an epigenetic differentiation state that is more resistant to mitogenic signals (Narita et al, 2003; Ait‐Si‐Ali et al, 2004; Uchida, 2016).
A major form of regulation of pRB activity is phosphorylation, mediated by cyclin‐dependent kinases (CDKs): pRB is mono‐phosphorylated at single sites by type D cyclins‐CDK4/6 during most G1 phase of the cell cycle and then abruptly hyper‐phosphorylated on the remaining sites by E cyclins‐CDK2 at the restriction point, just prior to S phase (Narasimha et al, 2014). Hyper‐phosphorylated pRB dissociates from E2Fs, allowing transcriptional activation of genes required for G1‐to‐S transition and cell cycle progression.
The RB gene is often disrupted in certain cancers by mutations, deletions, or promoter silencing; in other cancers, RB is intact but the pRB protein is inactivated by hyper‐phosphorylation through amplification/activation of D type Cyclins‐CDK4/6 and E type Cyclins/CDK2 complexes (Koboldt et al, 2012; Nik‐Zainal et al, 2016). In the latter tumors, hyper‐phosphorylated pRB can be re‐activated by CDK4/6 inhibitory drugs such as palbociclib that improve survival outcome of cancer patients (Knudsen & Witkiewicz, 2017; Otto & Sicinski, 2017; Pernas et al, 2018; Turner et al, 2018; Roberts et al, 2020).
pRB phosphorylation is also implicated in tissue regeneration. The CDK4/6 inhibitor p16INK4A is induced in aging tissues including pancreatic islets in mice (Janzen et al, 2006; Krishnamurthy et al, 2006; Molofsky et al, 2006) and humans (Nielsen et al, 1999; Kanavaros et al, 2001; Chkhotua et al, 2003; Krishnamurthy et al, 2004; Liu et al, 2011; Aguayo‐Mazzucato et al, 2017) as well as in type 2 diabetes (T2D) (Kong et al, 2016). Other CDK inhibitors such as p21cip1 and p27Kip1 are induced by various genotoxic stresses to halt cell cycle progression in part by blocking pRB phosphorylation (Chicas et al, 2010; Chien et al, 2011; Kang et al, 2015; Georgakilas et al, 2017). These CDK inhibitors act not only through pRB but also through other targets (e.g., Kollmann et al, 2013; Klein et al, 2018; Zhang et al, 2018), and therefore the specific impact of blocking pRB phosphorylation on development and homeostasis, and whether the consequences of inhibiting pRB phosphorylation can be therapeutically mitigated are not known.
pRB has 14 CDK phospho‐acceptor sites that are clustered in the N terminus, spacer/linker region, and exon 23 at the C terminus (Lees et al, 1991; Buckley et al, 1993; Mittnacht, 1998; Fu et al, 2004) (Fig 1A). These phosphorylation sites can be classified into four groups on the basis of their effect on specific pRB‐protein interactions (Sanidas et al, 2019): S224‐S243‐T246, T350‐T367‐S601, S605‐S773‐S781‐S788, and S800‐S804‐T814‐T819 (mouse pRb numbering; Fig 1A). Phosphorylation of the exon 23 cluster triggers a conformation change that excludes E2F (Rubin, 2013) and destabilizes interaction with chromatin‐modifying enzymes, allowing G1‐to‐S cell cycle progression (Goodrich et al, 1991; Knudsen & Wang, 1996, 1997; Connell‐Crowley et al, 1997; Burkhart & Sage, 2008; Rubin, 2013; Narasimha et al, 2014; Dick et al, 2018; Sanidas et al, 2019). Substitutions of all seven sites lead to constitutive repression of E2F1‐regulated genes in over‐expression experiments in culture (Brown et al, 1999).
Figure 1. Rb∆K4 knock‐in mice develop normally but exhibit telomere attrition.

- Schematic structure of pRb, location of the 14 CDK sites, and the four Ser/Thr‐to‐Ala substitutions (denoted by *) in Rb∆K4 knock‐in mice in exon 23. Clustering of phosphorylation sites is as per Sanidas et al (2019), based on protein interaction profiles of monophosphorylated pRb species. N, N terminus; A‐B, pocket domain; L, spacer/linker; C, C terminus which includes exon 23.
- Western blot analysis of Rb∆K4 thymocytes with an antibody that recognizes both hyper‐phosphorylated (ppRb) and hypo‐phosphorylated pRb species.
- Representative flow cytometric profiles of thymocytes from 6‐week‐old Rb∆K4 and control mice for CD3‐, CD4‐ and CD8‐positive cell populations. Bottom, average of CD3, CD4, and CD8 single‐ and double‐positive cells in Rb∆K4 vs. control thymocytes showing no significant (n.s.) difference by Student’s t‐test. Bars represent mean ± SD (standard deviation); n = 6 biological replicates.
- Short telomeres in Rb∆K4 mice. Images of splenocyte metaphase spreads hybridized with the telomere repeat probe (pink). Note shorter telomeres in Rb∆K4 splenocytes (arrows). Bottom, quantitative analysis of 10 splenocyte metaphases from one pair of Rb∆K4 and control littermate; all five pairs are shown in Appendix Fig S2 (P < 0.001 by two‐tailed Mann–Whitney–Wilcoxon test).
Source data are available online for this figure.
To determine the role of pRb phosphorylation in vivo, we herein engineered knock‐in mice with Ser/Thr‐to‐Ala substitutions in the four most distal or all seven sites in the C terminus of endogenous Rb. Unexpectedly, homozygous Rb∆K4 and Rb∆K7 knock‐in mice developed normally during embryogenesis and early neonatal life. However, thereafter, Rb∆K7 but not Rb∆K4 mice exhibited various signs of accelerated aging including diabetes, which was associated with increased DNA damage response (DDR) and senescence, and reduced islet cell organization and size. This defect was attributed to inability of differentiated pancreatic Rb∆K7 β‐cells to re‐enter the cell cycle in response to mitogenic signals, pointing to a role for pRb phosphorylation in the G0‐to‐G1 transition. Strikingly, the epigenetic regulator vitamin C enhanced DNA demethylation and cell cycle re‐entry and attenuated the DDR and diabetes in Rb∆K7 mice. Thus, pRb status exerts a double‐edged sword effect; loss of this tumor suppressor enables cell proliferation/regeneration but also cancer, whereas activation of this tumor suppressor by inhibition of its phosphorylation suppresses cancer but also cell regeneration, thereby accelerating hallmarks of aging.
Results
Rb∆K4 knock‐in mice exhibit short telomeres but apparent normal development
To determine the effect of pRb phosphorylation in vivo, we first generated knock‐in mice in which the four most distal Serine/Threonine residues (S800, S804, T814, and T819) were substituted to Alanine, a related but unphosphorylatable amino acid (Figs 1A and EV1A–D). Homozygote RbK4/K4 mice (henceforth referred to as Rb∆K4) were obtained with normal Mendelian inheritance and appeared normal. Sequencing analysis confirmed the Ser/Thr‐to‐Ala substitutions introduced into the Rb locus in these mice. pRb migrates on SDS–PAGE gels as a hypo‐phosphorylated protein of ~110 KDa as well as slow‐migrating phosphorylated species. The slow migration and level of phosphorylation are inhibited by substitutions on Ser800/Ser804 in vitro (Knudsen & Wang, 1996; Brown et al, 1999). Consistent with this, lysates from Rb∆K4 thymocytes exhibited a single band of hypo‐phosphorylated pRb (Fig 1B).
Figure EV1. Schematic structure of the Rb locus and RbK4 and RbK7 targeting constructs.

- Schematic organization of the Rb locus around exon 23.
- Probes used to screen and verify ES cell clones by Southern blots. The 5’ and 3’ probes are outside the targeting vector; the neo probe is from the PGK.neo cassette. The 5’ XbaI fragment contains a repetitive sequence at the 5’ end; a unique probe was amplified from the 3’ portion of this fragment by PCR and used for Southern blot hybridization analysis (not shown).
- Schematic structure of the targeting vectors Rb∆K4.neo and Rb∆K7.neo with Ser/Thr‐to‐Ala substitutions in the 4 most distal or all 7 CDK sites in exon 23, respectively. A pgk.neo cassette surrounding by loxP sites was introduced into the EcoRV sites in intron 23.
Despite the blockade of phosphorylation of these important sites, homozygous Rb∆K4 mice were fertile, showed apparent normal myogenesis and T‐cell development, and displayed no obvious external or histo‐pathological defects (Fig 1C and Appendix Fig S1A).
The four most distal Ser/Thr sites in exon 23, which are substituted in Rb∆K4 mice, were shown to mediate interaction with LxCxE‐binding factors through E2F1‐dependent (e.g., HDAC1, SUV39H) and independent (SUV4‐20H) mechanisms. The latter interaction is critical for trimethylation of H4K20 and telomere maintenance (Benetti et al, 2007). Indeed, triple knockout fibroblasts with mutations in Rb and its two relatives, p107 and p130 (Rb−/−:p107−/−:p130−/−), exhibit abnormally long telomeres (Garcia‐Cao et al, 2002). To determine telomere length in Rb∆K4 mice, we backcrossed them six generations into C57BL/6 mice, commonly used to analyze telomere length (Snow et al, 2007). Metaphase spreads prepared from five pairs of splenocytes from 3‐ to 4‐month‐old mice revealed that telomeres in Rb∆K4 mice were significantly shorter compared to control littermates (Mann–Whitney–Wilcoxon test P < 0.001; Fig 1D; Appendix Fig S2A). GST‐SUV4‐20H1 and GST‐SUV4‐20H2 preferentially precipitated hypo‐phosphorylated, not hyper‐phosphorylated pRb species from wild‐type thymocytes (Appendix Fig S2B), thus supporting the idea that constitutive inhibition of H4K20 trimethylases by pRb∆K4 throughout the cell cycle underlies short telomeres in these mice (Discussion).
Rb∆K7 knock‐in mice also exhibit apparent normal embryogenesis and early neonatal growth
Although phosphorylation of single CDK4/6 sites in pRb can affect specific cellular functions in culture (Sanidas et al, 2019), there is clear evidence that inhibition of pRb phosphorylation on multiple sites has an accumulative effect on its transcriptional repression in vitro (Bremner et al, 1995; Brown et al, 1999). We therefore asked whether disruption of all seven phosphorylation sites in exon 23 would impact normal development and homeostasis (Figs 2A and EV1A–D). Surprisingly, like homozygote Rb∆K4 mice, RbK7/K7 knocked‐in mice (henceforth Rb∆K7) were obtained by interbreeding Rb∆K7/+ heterozygotes with the same Mendelian inheritance as Rb+/+ littermates (not shown).
Figure 2. Rb∆K7 knock‐in mice exhibit near‐normal embryogenesis and neonatal development.

- Schematic structure of pRb, location of 14 CDK sites and the seven Ser/Thr‐to‐Ala substitutions (denoted by *) in Rb∆K7 mice. Phosphorylation of upstream sites is indicated: arrow, phosphorylated; blocking line, not phosphorylated in Rb∆K7 thymocytes.
- BrdU immunohistochemistry analysis of sagittal sections of E13.5 Rb∆K7 and control littermate embryos. Arrows point to lateral ventricle and liver showing similar intensity of staining/cell proliferation.
- Left, representative flow cytometric analysis for CD3, CD4, and CD8, showing near normal T cell development in 10‐day‐old Rb∆K7 mice. Right, average of CD3, CD4, and CD8 single‐ and double‐positive cell populations in Rb∆K7 vs. control thymocytes with no significant difference (n.s.) by Student’s t‐test. Results are presented as mean ± SD, n = 4 biological replicates.
- Left, images showing apparent normal division of retinal progenitors in Rb∆K7 mice. Mice were labeled with BrdU for 2 h; retinal sections from indicated genotypes were stained with DAPI (blue), Ki67 (green), PH3 (red), or BrdU (red) to mark nuclei, all dividing cells, mitotic or S‐phase cells, respectively. Right, quantification of staining showing no significant difference among the genotypes. Bars denote mean ± SD; n = 3 biological replicates. Scale bar: 20 μm.
- Left, top, Western blot analysis of Rb∆K7 thymocytes with an antibody that recognizes both hyper‐phosphorylated (ppRb) and hypo‐phosphorylated pRb species. Right, phospho‐specific immunoblots showing absence of phosphorylation at upstream Thr350 and Ser601 or the substituted Ser773Ala site in Rb∆K7 thymocytes. Right, immuno‐precipitation (IP)‐Western blot analysis demonstrating phosphorylation of pRb∆K7 on Ser243/Thr246 (top) and Ser605 (bottom). n.s., non‐specific band.
- Phospho‐specific immunoblots showing absence of phosphorylation at upstream Thr350, and reduced but not complete loss of phosphorylation at Ser601 (arrow) in Rb∆K4 thymocytes.
Source data are available online for this figure.
BrdU incorporation analysis revealed robust cell proliferation in multiple Rb∆K7 embryonic tissues at comparable levels to those seen in control RbWT littermates (Fig 2B). Moreover, Rb∆K7 mice exhibited apparent normal myogenesis in vivo and in vitro, as well as early T‐cell development (Figs 2C; Appendix Fig S1B). As germline mutation in RB predisposes to retinoblastoma, we specifically analyzed the effect of Rb∆K7 on proliferation of retinal progenitors. Staining for Ki67 (dividing cells), BrdU incorporation (S‐phase cells), or Ser10 phosphorylated histone 3 (PH3, mitotic cells) revealed indistinguishable levels of progenitor cell proliferation in Rb∆K7 versus control retina (Fig 2D). Hematology and innate immunity were also apparently normal in Rb∆K7 mice (Appendix Figs S3 and S4). Thus, expression of hypo‐phosphorylated pRb∆K7 at endogenous levels does not attenuate cell proliferation in multiple tissues.
Phospho‐specific antibody analysis of lysates from proliferating Rb∆K7 thymocytes revealed that in addition to the substituted Serine/Threonine amino acids in exon 23 (e.g., Ser773), phosphorylation of upstream Thr350 and Ser601 sites was completely inhibited, while Ser243/Thr246 and Ser605 remained phosphorylated (Fig 2E). Interestingly, in Rb∆K4 thymocytes, Thr350 phosphorylation was also completely suppressed, whereas Ser601 phosphorylation was detectable at a low level (Fig 2F, arrowhead). Phospho‐antibodies for mouse Ser224‐ and Thr367‐pRb, the remaining two sites, are not currently available. Thus, phosphorylation of at least 9 of 14 CDK sites in pRb (seven sites in exon 23 plus Thr350 and Ser601) is not essential for embryogenesis or early neonatal growth.
Embryonic fibroblasts from Rb∆K7 knock‐in mice exhibit reduced sensitivity to CDK2 inhibitors and increased spontaneous senescence
One mechanism by which cells may escape cell cycle inhibition by pRb∆K7 could be through compensating phosphorylation by other kinases. To begin to address this possibility, we performed focused kinome screens (360 drugs) on mouse embryonic fibroblasts (MEFs) isolated from pRb∆K7 or control embryos. 32 drugs that showed some differential effects in the initial screen were subject to secondary screens, but no kinase inhibitor significantly suppressed the growth of Rb∆K7 over control littermate MEFs (Fig 3A). As p38‐MAPKα phosphorylates the N terminus of pRB (Gubern et al, 2016), we examined the effect of inhibitors of this kinase. However, three different inhibitors, SB‐203580 (Fig 3A), VX‐702, and SB‐202190 (Fig 3B), which target p38α or p38α plus p38β2, respectively, had no significant effects on Rb∆K7 relative to control MEFs. In addition, the CDK4/6 inhibitor palbociclib (PD‐0332991), and the checkpoint kinase CHK1 inhibitor, TCS‐2312, had no differential effect on Rb∆K7 versus normal cells.
Figure 3. Rb∆K7 MEFs exhibit enhanced resistance to CDK2 inhibitors and spontaneous senescence in vitro .

- Effects of selected kinase inhibitors with differential effects on Rb∆K7 vs. control MEFs from initial kinome screens. Average proliferation rate of untreated MEFs is shown on the right (white column). Arrows point to pan‐CDK‐ and CDK2/7/9‐inhibitors. Bars represent mean ± SD, n = 3 independent MEFs.
- Increased resistance of Rb∆K7 vs. control MEFs to CDK2 inhibition (P = 0.008 by two‐tailed unpaired Student’s t‐test). Effect of a pan CDK inhibitor was near significance (P = 0.07). Bars represent mean ± SD, n = 3 independent MEFs.
- Left, representative flow cytometric analysis with 7‐AAD and AnnexinV, showing a significant decrease in apoptosis in Rb∆K7 MEFs relative to control. Right, significant differences in average percentage of live (7‐AAD−:AnnexinV−) vs. apoptotic (7‐AAD+:AnnexinV+) cells. Bars represent mean ± SD; P value calculated by two‐tailed unpaired Student’s t‐test; n = 3 independent MEFs.
- Increased G1 phase in Rb∆K7 MEFs. Mean ± SD of propidium iodide flow cytometry analysis showing a significant increase in G1 and decrease in S phase in synchronized Rb∆K7 MEFs relative to control (n = 3 independent MEFs).
- Representative bright‐field images of multi‐passage MEFs showing immortalized control cells but large senescing Rb∆K7 cells (arrows, original magnification: 200×; n = 4–5).
- Representative images showing increased senescence in Rb∆K7 MEFs (arrows) determined by senescence‐associated β‐galactosidase assay (SA‐βGAL); original magnification: 200×; P = 0.0395 by two‐tailed unpaired Student’s t‐test, n = 4 technical replicates (see text).
Instead, Rb∆K7 MEFs appeared more resistant to CDK2 inhibition. Indeed, Rb∆K7 MEFs were significantly more resistant to GW8510 (P = 0.008) and showed a trend toward significant resistance to a pan‐CDK inhibitor, AT‐751, which targets CDK2, as well as CDK1, CDK4, CDK6, and CDK5 (P = 0.07; Fig 3B). The specific resistance of Rb∆K7 MEFs to CDK2 inhibitors is in stark contrast to the increased sensitivity of CyclinD1/D2/D3 triple‐mutant MEFs to CDK2 inhibition (Kozar et al, 2004). This uncovers a clear difference between CyclinD1/2/3 null cells, in which pRb can be phosphorylated (by CDK2), and Rb∆K7 cells in which phosphorylation of multiple CDK sites is blocked by Ser/Thr‐to‐Ala substitutions, rendering the cells resistant to CDK2 inhibition compared to control Rb+ cells.
Early passage Rb∆K7 MEFs exhibited a slight but significant increase in cell survival and a longer G1‐phase of the cell cycle (Fig 3C and D). Moreover, whereas control MEFs became readily immortalized after ~10 passages, Rb∆K7 MEFs underwent cell senescence and failed to spawn colonies of immortalized cells (Fig 3E). In accordance, Rb∆K7 MEFs at passage 9 showed stronger senescence‐associated β‐galactosidase (SA‐βGAL) staining than control MEFs (Fig 3F). Considering all SA‐βGAL positive‐stained cells (both low and high), 82% of Rb∆K7 MEFs were positive compared to 51.5% in control MEFs (n = 4, P = 0.039 by 2‐tailed Student t‐test). Thus, in accordance with its tumor‐suppressive function, Rb∆K7 MEFs showed modest but significantly reduced cell proliferation and apoptosis and increased cellular senescence.
Rb∆K7 mice exhibit severe diabetes and accelerated aging
Strikingly, as Rb∆K7 mice matured, they exhibited smaller size and various signs of premature aging. On average, Rb∆K7 male mice weighed 21% less than their littermates (Fig 4A). Males were infertile, with small testes and reduced number of matured sperm, indicating hyper‐sensitivity of meiosis to constitutive expression of hypo‐phosphorylated pRb (Fig 4B–D). At 8–11 months of age, Rb∆K7 mice became moribund with severe kyphosis (Fig 4E). Hair regrowth two weeks post‐plucking was delayed in Rb∆K7 mice compared to control littermates (Fig 4F). While hair follicles in control mice were in both telogenic (resting) and anagenic (growing) phases, hair follicles in Rb∆K7 mice were mostly in the telogen phase and expressed low levels of keratin 14 (a stem cell marker) and PCNA (a cell cycle marker) relative to control (Fig 4G–I).
Figure 4. Rb∆K7 adult mice display signs of premature aging and diabetes.

-
AReduced weight (in grams) of adult Rb∆K7 (n = 11) vs. control littermate (n = 17) males. Results are presented as mean ± SD; P values calculated by two‐tailed unpaired student’s t‐test.
-
B–DInfertility in Rb∆K7 males: (B) number of litters from breeding of homozygous Rb∆K7 (n = 4) or control wild‐type (n = 5) males with control wild‐type females. Bars represent mean ± SD; P values calculated by two‐tailed unpaired Student’s t‐test. (C) Representative images of testes from two Rb∆K7 mice compared with a control littermate. (D) Sections through seminiferous tubules. Arrows point to mature spermatids in control testes that are lacking in Rb∆K7 adult testes. Scale bar, 20 μm.
-
EKyphosis in Rb∆K7 mice. Top, images of an eight‐month‐old Rb∆K7 mouse with kyphosis (right) and control wild‐type littermate (left). Bottom, radiographs of these mice under anesthesia showing abnormal cervical curvature (arrows) in the Rb∆K7 knock‐in mouse.
-
F–IDelayed hair re‐growth in eight‐month‐old Rb∆K7 mice two weeks post‐hair plucking (F). (G) Abnormal skin histology in Rb∆K7 mice relative to control. FCL, subcutaneous fat cell layer, T, telogen; A, anagen. (H and I) Representative immunostaining for keratin 14 and PCNA showing reduced expression in Rb∆K7 hair follicles vs. controls. Scale bar, 50 μm.
-
JHyperglycemia in Rb∆K7 but not Rb∆K4 mice. Blood glucose in 10‐ to 12‐month‐old fasting Rb∆K7 (left, n = 11) or 18‐month‐old fasting Rb∆K4 (right, n = 15) mice versus control littermates (n = 6 and n = 8, respectively). Mean ± SD; P values by two‐tailed unpaired Student’s t‐test.
Most strikingly, adult Rb∆K7 mice developed severe diabetes, and all mice succumbed to the disease by one year of age (Fig 4J). Diabetes was observed within a shorter window of time in males than in females, and therefore, male mice were analyzed henceforward. Blood glucose levels in fasting 8‐ to 12‐month‐old Rb∆K7 males, but not in as old as 18‐month Rb∆K4 mice, was on average over 25 mM compared to 6–8 mM in wild‐type animals (n = 6 each, P = 1.8 × 10⁻⁵). Complete pathological analysis of six Rb∆K7 mice with severe diabetes revealed mostly normal histology of other tissues, with no evidence for gross abnormalities or cancer (not shown). Thus, systemic inhibition of pRb phosphorylation does not interfere with normal embryogenesis but attenuates cell proliferation and tissue regeneration and accelerates hallmarks of aging such as diabetes in adult mice as further described below.
Diabetes in Rb∆K7 mice is marked by reduced cell cycle re‐entry and reduplication of pancreatic β‐cells
Diabetes is caused by defects in glucose metabolism, which is controlled by pancreatic α‐ and β‐islet cells that secrete glucagon or insulin, respectively (Ashcroft & Rorsman, 2012; Talchai et al, 2012). Type 1 diabetes (T1D) is characterized by loss of β‐cells through autoimmune‐mediated destruction and cellular senescence (Thompson et al, 2019) and is insulin‐sensitive, whereas type 2 diabetes (T2D) is characterized by failure of tissues such as muscle and fat cells to absorb blood glucose in response to insulin, but also involves senescence and progressive loss of β‐cells (Kong et al, 2016; Aguayo‐Mazzucato et al, 2019).
To determine the mechanism underlying high serum glucose in Rb∆K7 knock‐in mice, hyperglycemic animals were injected with insulin. This led to a rapid decrease in blood glucose, indicating insulin responsiveness and type 1‐like diabetes (Fig 5A). Rb∆K7 mice were also unable to clear blood glucose as efficiently as control mice following exogenous glucose injection, and this deficiency became more severe with age (Fig 5B), suggesting a progressive degeneration of insulin‐producing pancreatic β‐cells. The primary defect was not in insulin secretion per se as revealed by Glucose‐Stimulated Insulin Secretion (GSIS) assays of young Rb∆K7 mice versus control littermates (Fig 5C). Instead, pancreatic islets progressively deteriorated, becoming ~3 fold smaller in 1‐year‐old Rb∆K7 mice compared to control littermates (Fig 5D, left, center; images below and Fig 6). Rb∆K7 islets were not only smaller but also disorganized, and insulin‐positive β‐cells were larger with aberrant morphology. Length of Rb∆K7 insulin+ β‐cells was on average 1.73‐fold greater than control cells (Fig 5D, right). In addition, whereas control wild‐type islets stained relatively uniformly for Insulin, pancreatic β‐cells from diabetic Rb∆K7 mice exhibited a mixture of intensely and weakly stained insulin+ β‐cells (Fig 5D, left). Finally, fasting circulating insulin levels in 6‐ to 10‐month‐old diabetic Rb∆K7 mice (17 mM average blood glucose compared with 3.2 mM in control mice, n = 8 each, P = 0.0001) was 1.5 fold lower than in control wild‐type littermates (0.13 vs. 0.2 ng/ml; P = 0.037, one‐sided t‐test; Fig 5E).
Figure 5. Diabetes in Rb∆K7 mice is associated with failure of pancreatic β‐cells to re‐enter the cell cycle.

- Insulin tolerance test (ITT) demonstrating that hyperglycemic Rb∆K7 mice are insulin‐sensitive. Blood glucose in fasting Rb∆K7 mice (n = 6) vs. control littermates (n = 6) following insulin injection. Error bars represent SD.
- Glucose tolerance test (GTT) demonstrating progressive defect in clearance of blood glucose in Rb∆K7 mice. 6–7 week (left) or 6‐month (right)‐old fasting Rb∆K7 mice and control littermates (n = 5–6 each per group) were injected with glucose, and blood glucose was determined at indicated intervals. Error bars represent SD.
- Glucose‐stimulated insulin secretion (GSIS) analysis demonstrating near‐normal insulin secretion in response to glucose injection in young Rb∆K7 mice. Serum insulin levels in 5‐ to 6‐week‐old fasting Rb∆K7 vs. control mice (n = 4 each) after glucose injection determined by ELISA. P values were calculated by two‐tailed unpaired Student’s t‐test. Bars represent mean ± SD.
- Rb∆K7 mice exhibit a progressive loss of pancreatic islet mass. Left to right, representative images of pancreatic islets of 1‐year‐old Rb∆K7 vs. control mice stained for insulin (green). Note the enlarged, irregular shape, and reduced number of pancreatic insulin+ β‐cells in Rb∆K7 islets; Ratio of β‐cell area to pancreatic area in 1‐month and 1‐year‐old Rb∆K7 vs. control mice determined by immunostaining for insulin followed by ImageJ analysis; relative length of pancreatic insulin+ β‐cells in 9‐month‐old Rb∆K7 islets (n = 5) vs. control (n = 4) using > 8 determination per biological replicate, normalized for control length. P values calculated by two‐tailed unpaired Student’s t‐test. Scale bar, 100 μm.
- Reduced levels of circulating insulin in fasting 6‐ to 10‐month‐old diabetic Rb∆K7 mice compared with control wild‐type littermates (0.13 vs. 0.2 ng/ml; n = 8 for each group). P value was calculated by one‐tailed unpaired Student’s t‐test. Bars represent mean ± SE. Average levels of blood glucose are indicated (17 mM in Rb∆K7 compared with 3.2 in control mice; P = 0.0001 by two‐tailed unpaired Student’s t‐test).
- Loss of pancreatic islet area in Rb∆K7 mice correlates with reduced proliferation and H3K36me3 histone marks, but not with increased cell death. TUNEL analysis showing apoptosis in 10‐day‐old Rb∆K7 islets is even lower than in control littermates. Arrow points to a rare apoptotic cell in control islet. Serine800/804 phosphorylation of pRb in β‐cells from 10‐day‐old control but not Rb∆K7 islets with a Ser‐to‐Ala substitution at this site. BrdU incorporation and PH3 staining showing reduced S‐phase and mitotic cells, respectively, in 2‐ and 3‐week‐old Rb∆K7 vs. control islets. Reduced H3K36me3 staining in pancreatic islets from 3‐week old Rb∆K7 mice compared to control littermates (n ≥ 3 for each experiment). Scale bar, 100 μm.
- Quantification of BrdU incorporation, PH3 and H3K36me3 staining shown in panel (F). Mean ± SD, P values calculated by two‐tailed unpaired Student’s t‐test.
- Reduced ability of Rb∆K7 β‐cell‐ to re‐enter the cell cycle in response to pregnancy (top) or mitogenic (bottom) signals. Top, cell proliferation in P14.5 pregnant Rb∆K7 islet β‐cell vs. control was determined by double immunostaining with BrdU and insulin (left); quantification (right). Results were normalized for the number of BrdU/Insulin‐positive cells in control islets. An independent experiment using ki67 to quantify cell cycle re‐entry is shown in Fig EV2A. Bottom, cell proliferation in Rb∆K7 β‐cell vs. control islets following Exendin4 treatment was determined by immunostaining for Ki67; results were normalized for the number of positive cells in control islets. Mean ± SD, P values by two‐tailed unpaired Student’s t‐test. Scale bar, 100 μm.
- Representative immunostaining showing induction of PDX1 (islet), SOX9 (pancreatic epithelium), and MCM4 (islet) expression in Rb∆K7 vs. control mice. See also Appendix Fig S5. Scale bar, 100 μm.
Figure 6. Diabetes in Rb∆K7 mice involves a DDR and senescence/SASP and is attenuated by vitamin C diet.
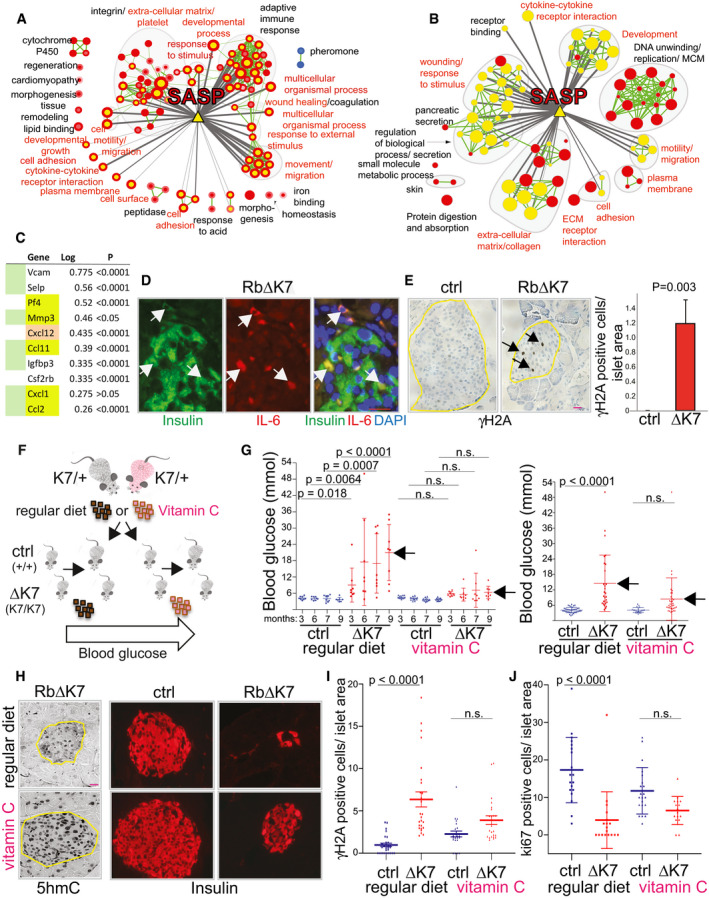
- Induction of SASP pathways in Rb∆K7 islet cells. Pathway analysis by GSEA comparing Rb∆K7 and control islets using expression data for all genes. Nodes (circles) represent pathways significance at FDR ≤ 0.01 with normalized enrichment scores of > 1.4; red indicates pathways enriched in up‐regulated genes in Rb∆K7 and blue indicates pathways enriched in control for array 1 (node center) and array 2 (node border). Green line width between nodes corresponds to the number of shared genes. Murine SASP genes (yellow triangle) are connected to enriched‐pathways (yellow node center) by gray lines; line thickness indicates significance level (proportional to log(P value), P < 0.05). Red font corresponds to pathways in common with the g:Profiler analysis in panel (B).
- g:Profiler analysis showing significantly enriched pathways (FDR < 0.05) using 228 genes that are significantly regulated in Rb∆K7 vs. control islets (> 2 fold; P < 0.05; see panel (A) for details). In panels (A) and (B), murine SASP genes (yellow triangle) are connected to enriched pathways (yellow node center) by gray lines when the gene overlap size estimated by a Fisher’s exact test is significant at P ≤ 0.05; line thickness is proportional to significance level. Red label font corresponds to pathways in common between the GSEA analysis (panel A) and the g:Profiler analysis (panel B).
- Fold induction (log) of SASP genes in Rb∆K7 vs. control littermates. Genes that overlap between the GSEA and G:profiler are highlighted in green. Yellow indicates genes that are transcriptionally regulated in epithelial SASP. Cxcl12, chemokine (C‐X‐C motif) ligand 12, has not been previously implicated in SASP in epithelial cells or fibroblasts, but is induced in Rb∆K7 islets. Log ratio is the difference between the mean of RbΔK7 samples and the mean of control samples of the log2 normalized values.
- Representative image of a pancreatic islet from a 9‐month‐old Rb∆K7 mouse stained for the SASP marker IL‐6 (red) and insulin (green). DAPI was used to mark nuclei (blue). Arrows point to IL‐6+, insulin+ pancreatic β‐cells. Scale bar, 20 μm. See Fig EV2B for wild‐type control, MMP‐2, and CXCL12 staining.
- Representative immunostaining for the DDR marker γ‐H2A in islets from 3‐week‐old Rb∆K7 and control mice (left); statistical analysis (right; n = 5 each). Arrows point to pancreatic γ‐H2A‐positive Rb∆K7 islet cells. Error bars represent SD; P value calculated by one‐way ANOVA, Tukey's multiple comparisons test. Scale bar, 100 μm.
- A schematic outline for the vitamin C experiment in vivo. RbK7/+ heterozygous mice fed on regular or vitamin C diet were intercrossed. Progenies were genotyped to identify Rb+/+ and Rb∆K7 male mice, continuously maintained on the same diet, and monitored for blood glucose.
- Vitamin C‐supplemental diet (1%) significantly delays diabetes in Rb∆K7 mice. Shown are two independent experiments with 8 mice per group at indicated time points (left), and 28 and 34 Rb∆K7 mice or 37 and 20 control littermates in each group fed on regular or vitamin C diet, respectively (right). Blood glucose was determined in fasting mice at indicated months (left) or at ~9 months (right). Bars denote mean ± SD. Adjusted P values were calculated using one‐way ANOVA, Tukey's multiple comparisons test.
- Vitamin C diet increases 5hmC expression and improves β‐cell morphology and islet size in Rb∆K7 mice. Scale bar, 100 μm.
- Vitamin C diet reduces the difference in γ‐H2A+ β‐cells in Rb∆K7 vs. control pancreatic islets relative to regular diet by 3.74 folds. Bars indicate mean ± SD. Adjusted P values by one‐way ANOVA, Tukey's multiple comparisons test.
- Vitamin C diet increases pancreatic islet cell cycle re‐entry during pregnancy of Rb∆K7 mice relative to control pregnant mice (no statistical difference, n.s.) or relative to pregnant Rb∆K7 vs. control mice fed on regular diet (P < 0.0001) by 3.8 folds. Bars represent mean ± SD. Adjusted P values by one‐way ANOVA, Tukey's multiple comparisons test.
Analysis of cell death ruled out apoptosis as the cause of pancreatic islet degeneration and reduced islet mass; there were very rare TUNEL+ apoptotic β‐cells in control islets and even less in Rb∆K7 mice (Fig 5F). β‐cells expand during embryogenesis and neonatal growth through proliferation of progenitor cells, and in adults through duplication of pre‐existing β‐cells (Dor et al, 2004; Nir et al, 2007; Teta et al, 2007; Smukler et al, 2011). Staining for phospho‐Serine 800/804‐pRb, a site that is substituted to alanine in Rb∆K7 mice, revealed positive β‐cells in control but not, as expected, knock‐in islets, indicating active regulation of pRb phosphorylation in dividing pancreatic β‐cells (Fig 5F). BrdU incorporation and phospho‐histone H3 staining showed significant reduction in cell division in pancreatic Rb∆K7 β‐cells at 2–3 weeks of age compared to control (Fig 5F and G). Decreased level of histone H3K36 trimethylation (H3K36me3) coincides with short life span (Pu et al, 2015) and reduced homologous recombination (HR) repair (Pai et al, 2017). Consistent with this, H3K36me3 expression was significantly reduced in Rb∆K7 islets compared to control littermates (Fig 5F and G).
To determine whether mature Rb∆K7 β‐cells could be stimulated to re‐enter the cell cycle in vivo, BrdU incorporation analysis or ki67 staining was performed during pregnancy, which triggers β‐cell proliferation (Rieck & Kaestner, 2010), or after injecting adult mice with Exendin‐4, a glucagon‐like peptide‐1, which stimulates glucose‐dependent insulin secretion and β‐cell proliferation (Xu et al, 1999). In both cases, β‐cells from control wild‐type mice re‐entered the cell cycle, whereas β‐cells from Rb∆K7 mice failed to reduplicate (Figs 5H and EV2A). Thus, the primary defect in Rb∆K7 islets can be attributed to a reduced capacity of pre‐existing, differentiated β‐cells to re‐enter the cell cycle and regenerate in response to mitogenic signals, leading to features of both TID (Thompson et al, 2019) and T2D (Kong et al, 2016). These results demonstrate a critical role for pRb phosphorylation during the transition of β‐cells from a quiescent/differentiated state back into the cell cycle (G0‐to‐G1) in response to mitogens in vivo.
Figure EV2. Reduced cell cycle re‐entry of Rb∆K7 β‐cells in response to pregnancy, and immunostaining of pancreatic islets from 9‐month‐old Rb∆K7 mice for the SASP markers IL‐6, MMP‐2 and CXCL12.

- Reduced ability of Rb∆K7 β‐cells to re‐enter the cell cycle in response to pregnancy as determined by immunostaining for the proliferation marker, Ki67. Shown are representative staining of islets from P14.5 pregnant Rb∆K7 and control females stained for Ki67. Related to Fig 5H.
- Representative images of pancreatic islets from 9‐month‐old Rb∆K7 mice, immuno‐stained for the SASP markers IL‐6 and MMP‐2 (red) plus insulin (green); or CXCL12 alone (red). DAPI was used to stain nuclei (blue). Arrows point to IL‐6+ or MMP‐2+, insulin+ or CXCL12+ pancreatic cells. Related to Fig 6D.
Pancreatic β‐cells in Rb∆K7 mice exhibit increased DDR and senescence
To examine the fate of pancreatic β‐cells in Rb∆K7 mice, we conducted global gene expression profiling on isolated pancreatic islets. Rb∆K7 islets are extremely fragile; using reduced collagenase concentrations and pooled islets from several Rb∆K7 mice, we were nonetheless able to extract sufficient amount of RNA for dual‐color agilent microarray analysis from 8 Rb∆K7 and 4 control mice in two independent experiments: 1 (10 weeks of age) and 2 (4 weeks). 241 genes were differentially (> 2 fold) and significantly (P < 0.05) expressed between Rb∆K7 and control islets (228 up; 13 down; Table EV1).
Most down‐regulated in Rb∆K7 islets were the islet regeneration genes Reg3b and Reg3g (Xiong et al, 2011). Among upregulated genes were Rad51 and Brca2, involved in DDR; GINS complex subunit 2 and MCM‐2, MCM‐4, and MCM‐5, involved in initiation of DNA replication, DNA replication licensing, and progression of the DNA replication fork; and aldehyde dehydrogenase family 1 (A1 and A3), TGFβ2, TGFβ3, and SOX9. Induction of some of these genes is likely in response to DNA replication stress (Byun et al, 2005; Drissi et al, 2015) and “transcriptional noise”, observed in aging pancreas (Enge et al, 2017), as well as compensatory mechanisms to diminished β‐cell proliferation in Rb∆K7 islets. Indeed, SOX9, which is required for bi‐ and multi‐potent pancreatic progenitors, initiation of endocrine differentiation during embryogenesis and maintenance of pancreatic ductal identity in adults (Seymour, 2014), was highly expressed as revealed by immuno‐staining in ductal epithelial but not islet cells in adult Rb∆K7 pancreas relative to control (Fig 5I; Appendix Fig S5A). MCM4, a DNA replication licensing factor, and PDX1, a transcription factor required for β‐cell maturation, were also elevated in pancreatic Rb∆K7 islets (Fig 5I; Appendix Fig S5B).
In contrast to E2F1−/− mice (Annicotte et al, 2009) but in accordance with normal insulin secretion in young Rb∆K7 mice (Fig 5C), no significant difference in expression of Kir6‐2, an inward‐rectifier potassium ion channel, was observed by microarray profiling or immunohistochemistry analysis between Rb∆K7 and control islets (Appendix Fig S5C). There was also no significant difference in expression of p16ink4a or its transcriptional regulator, Enhancer of zeste homologue 2 (Ezh2; Table EV1).
To identify signaling pathways that are deregulated in Rb∆K7 islets, we performed Gene Set Enrichment Analysis (GSEA) with the entire set of differentially regulated genes. Relative to control, Rb∆K7 islets exhibited elevated expression of pathways implicated in integrin/extra‐cellular matrix, adaptive immune response, wound healing, cell motility, migration, cytokine–cytokine receptor interaction, and cell adhesion (Fig 6A). Induction of similar pathways was observed by g:Profiler using only the 241 genes that were differentially expressed over 2 fold (P < 0.05) in Rb∆K7 versus control islets (Fig 6B). These pathways represent hallmarks of senescence‐associated secretory phenotype (SASP) in which senescent cells secrete inflammatory cytokines, other immune modulators and extracellular matrix‐degrading enzymes that impact both cancer and aging (Campisi, 2005; Coppe et al, 2008; Kuilman et al, 2008; Kirkland & Tchkonia, 2017).
In senescing mouse epithelial cells, SASP includes 37 proteins, 14 of which are regulated at the mRNA level (Coppe et al, 2010). Of these 37 SASP genes, 24 were present on our microarray chip including 6 of the 14 transcriptionally regulated mRNAs. Importantly, the majority of pathways that were significantly enriched in Rb∆K7 islets were connected to 19 of the 24 SASP genes (Fisher’s exact test P = 0.026; connections are marked by gray lines in Fig 6A and B). Moreover, of the 6 transcriptionally regulated SASP genes, 5 (Mmp3, PF4/Cxcl‐4, Cxcl‐1, Ccl‐2, and Ccl‐11) were upregulated in Rb∆K7 islets (Fig 6C). Four additional SASP genes (Vcam, Selp, Igfbp3, and Csf2rb), which are not transcriptionally regulated in epithelial SASP, as well as Cxcl12, were also upregulated in Rb∆K7 islets. To corroborate the SASP phenotype, we performed immuno‐fluorescent staining using antibodies for IL‐6 and MMP‐2, hallmarks of SASP that are also induced in mouse models of T1D and T2D (Aguayo‐Mazzucato et al, 2019; Thompson et al, 2019), as well as for Cxcl12, which is transcriptionally induced in Rb∆K7 islets (Fig 6C). In contrast to control wild‐type mice, many Rb∆K7 islet cells strongly expressed IL‐6, MMP2, and Cxcl12, demonstrating bona fide SASP (Figs 6D and EV2B).
Induction of SASP in Rb∆K7 islets was suggestive of DDR, which activates Ataxia telangiectasia mutated (ATM) and ATR (ATM and Rad3‐related) (Ciccia & Elledge, 2010; Schumacher et al, 2021). Consistent with this, the ATM substrate, histone H2AX, was robustly phosphorylated (γ‐H2A) in Rb∆K7 β‐cells compared with control littermates (Fig 6E). Consistent with senescence, double staining for γH2A and BrdU revealed that the γH2A+ β‐cells were non‐proliferating (i.e., BrdU‐negative; Appendix Fig S6A).
A pan‐anti‐phospho‐ATM/ATR‐substrate antibody, which detects phosphorylated ATM/ATR targets, revealed punctate staining in β‐cell nuclei in Rb∆K7 but not in control islets (Appendix Fig S6B). Rb∆K7 islets also showed increased Ser1981‐ATM expression as well as more intense staining for p53‐binding protein 1 (p53BP1), a factor that is recruited to the ATM complex to enhance DDR, and for trimethylated Histone 3 lysine 9 (H3K9me3), a marker of senescence‐associated foci in human cells (Appendix Fig S6C and D). No obvious differences were observed in expression of other DDR markers (H3K27me3, phosphoSer15‐p53, HP1‐γ; Appendix Fig S6E).
Vitamin C attenuates diabetes in Rb∆K7 mice
The aforementioned results suggest that constitutive expression of pRb∆K7 induces an irreversible terminal differentiation state, which, upon mitogenic signals, elicits DDR (γ‐H2A) and senescence (SASP markers) of pancreatic Rb∆K7 β‐cells. We therefore asked whether the epigenetic modulator, vitamin C, which facilitates induction of pluripotent stem cells (iPS) from adult cells, prevents p53‐induced replicative senescence, and exerts anti‐aging effects (Kim et al, 2008; Esteban et al, 2010), would ameliorate this defect.
To determine whether vitamin C would prevent diabetes when given before β‐cells permanently exit the cell cycle, heterozygote RbK7/+ breeders and their Rb+/+ and Rb∆K7 progenies were continuously fed on vitamin C‐supplemented diet (1%; Fig 6F). Under these conditions, Rb∆K7 mice fed on regular chow exhibited age‐dependent diabetes (Fig 6G, left). Remarkably and in stark contrast, Rb∆K7 mice exposed in utero and thereafter to vitamin C diet maintained near‐normal glucose level (n = 8 each; P < 0.0001 at 9 months by ANOVA). This was confirmed with a larger cohort, showing a dramatic reduction in serum glucose in ~9‐month Rb∆K7 mice continuously fed on vitamin C diet compared with same age Rb∆K7 mice fed on regular food (four groups, n > 30 per group; P < 0.0001 by ANOVA; Fig 6G, right). Notably, no therapeutic benefits were observed when weaned Rb∆K7 mice, in which pancreatic β‐cells are already post‐mitotic, were fed on vitamin C‐rich diet, indicating that vitamin C prevents but does not reverse diabetes.
One mechanism by which vitamin C diet could rescue diabetes in Rb∆K7 mice could involve the induction of phosphorylation of upstream sites such as Thr350, which are completely blocked in Rb∆K7 thymocytes (Fig 2E). To test for this, we immunoblotted lysates from Rb∆K7 and control thymocytes fed on normal vs. vitamin C diet and found that Thr350‐pRb∆K7 remained unphosphorylated under both conditions (Appendix Fig S6F). This suggests vitamin C does not attenuate diabetes by inactivating pRb∆K7 through phosphorylation of upstream sites. Alternatively, vitamin C could prevent diabetes through its activity as a cofactor for Fe(II) 2‐oxoglutarate dioxygenases such as Ten‐Eleven Translocation (TET) enzymes that demethylate DNA by converting 5‐methyl‐cytosine (5mC; repressive mark) to 5‐hydroxymethylcytosine (5hmC; transcriptionally active mark) (Blaschke et al, 2013; Chen et al, 2013; Cimmino et al, 2018). In accordance, pancreatic islets of vitamin C‐fed Rb∆K7 and control mice exhibited increased 5hmC expression compared with mice fed on regular diet (Fig 6H, left), demonstrating DNA demethylation in vivo.
Importantly, vitamin C‐fed Rb∆K7 mice had larger islets with an improved, normal‐like morphology of insulin‐positive β‐cells (Fig 6H, right). Moreover, while γ‐H2A+ β‐cells were significantly more widespread in islets from Rb∆K7 versus control mice when fed regular diet (6.4 fold; Fig 6E and I), there was a dramatic reduction in γ‐H2A+ β‐cells in Rb∆K7 islets relative to control in the vitamin C fed group (1.88 fold; Fig 6I). Likewise, whereas cell cycle re‐entry (measured by ki67 staining) was significantly lower in pancreatic islets of pregnant Rb∆K7 relative to control wild‐type mice fed on regular chow (P < 0.0001), cell cycle re‐entry increased in pregnant Rb∆K7 mice fed on vitamin C diet, leading to a non‐significant difference relative to control mice (P = 0.0993; Figs 6J and EV2A). Overall, after normalizing for control levels, there was a 3.8‐fold increase in Ki67+ cells in Rb∆K7 mice fed on vitamin C vs. Rb∆K7 mice fed on regular diet. Thus, attenuation of diabetes in Rb∆K7 mice by vitamin C coincides with a significant reduction in DDR and induction of cell cycle re‐entry of pancreatic β‐cells.
Ser243/Thr246‐ or Ser605‐phosphorylated pRb∆K7 is not bound to E2F1
To understand the mechanistic basis for its differential effect on different tissues, we next asked whether pRb∆K7 is constitutively bound to or dissociated from E2F1 when phosphorylated on upstream sites in proliferating cells (Fig 2E). Immuno‐precipitation of pRb or pRb∆K7 from thymocytes using anti‐pRb antibody followed by immunoblotting for E2F1 revealed strong interaction of both proteins with E2F1, confirming the functional activity of pRb∆K7 (Fig 7A, lanes 2–3, 11). Next, phosphorylated pRb species were immuno‐precipitated from proliferating Rb∆K7 or control thymocytes using phospho‐Ser243/Thr246‐pRb or phospho‐Ser605‐pRb antibodies, followed by immunoblotting for E2F1. In contrast to anti‐pRb antibodies, both pSer243/Thr246‐ and pSer605‐pRb antibodies failed to co‐precipitate E2F1 from either control or pRb∆K7 lysates (Fig 7A, lanes 7–10). Ser243/Thr246 and Ser605 phosphorylated pRb∆K7 are not bound to E2F1 likely because pRb∆K7 phosphorylation on these and other sites disrupts its interaction with E2F1, providing a plausible explanation for the apparent defect in G0‐to‐G1 transition in pancreatic and other differentiated cells, yet near‐normal proliferation and development of most tissues in Rb∆K7 embryos and newborn mice (Discussion).
Figure 7. Vitamin C reduces senescence induced by over‐expression of unphosphorylatable Rb allele in vitro .

- Both phosphorylated pRb and pRb∆K7 do not co‐precipitate with E2F1. Protein lysates from Rb∆K7 or control wild‐type thymocytes were immunoprecipitated with antibodies for pRb, for pSer243/Thr246‐pRb or for pSer605‐pRb, followed by immunoblotting for pRb or E2F1. Anti‐pRb antibody efficiently co‐immunoprecipitated E2F1 in control and Rb∆K7 cells (lanes 2–3, 11), whereas the two phospho‐pRb antibodies failed to co‐immunoprecipitate E2F1 in either cell (lanes 7–10).
- Left, top, effect of retrovirus‐mediated transduction of under‐phosphorylated Rb∆K11 (rRb∆K11) on Rb‐deficient mammary tumor cell proliferation as determined by MTT assay (n = 4–5 technical replicates). Left, bottom, quantification of SA‐βGAL in rRb∆K11‐transduced cells. Bars represent mean ± SD; P value calculated by two‐tailed unpaired Student’s t‐test. Right, representative images of SA‐βGAL staining showing robust senescence (arrows) in rRb∆K11‐transduced cells. Original magnification: 200×.
- Schematic diagram illustrating how unphosphorylatable Rb∆K11 allele or control wild‐type Rb DNA was introduced in vivo (top) or ex vivo (bottom) into retinal progenitors. i.v.c., in vitro culture.
- Suppression of retinal progenitor division in vivo (grey bars) and ex vivo (black bars) by Rb∆K11 and p16 but not by wild‐type pRb. Shown are quantification of BrdU+;GFP+ cells relative to all GFP+ cells in samples transfected with the indicated vectors (bars represent mean ± SD; ** denotes P < 0.01; ***P < 0.001 by one‐way ANOVA and Tukey’s multiple comparison analysis, n = 3 biological replicates).
- Representative images illustrating the effect of indicated plasmids. NBL: neuroblastic layer, GCL: ganglion cell layer; scale bar: 10 μm. Arrows point to yellow cells that are Green+ and BrdU+.
- Vitamin C reduces cellular senescence induced by retroviral‐mediated over‐expression of Rb∆K11. Top—images of SA‐βGAL staining in human diploid cells, IMR90, transduced with control or rRb∆K11 virus with or without vitamin C added at the time of infection. Arrows point to SA‐βGAL‐positive cells. Bottom left, quantification of SA‐βGAL staining (bars represent mean ± SEM; n = 4 biological replicates). P values by one‐way ANOVA, Tukey's multiple comparisons test. Bottom right, dot‐blot analysis with antibody for 5hmC on DNA extracted from IMR90 cells treated or not with vitamin C. Original magnification: 200×.
- A schematic model for the induction of DDR, senescence and diabetes in Rb∆K7 mice and the effect of vitamin C diet. Normal pancreatic β‐cells can re‐enter the cell cycle in response to mitogenic signals. In contrast, Rb∆K7 β‐cells display a repressive chromatin and stable differentiation state, which, in response to mitogenic signals, elicits a DDR, cellular senescence, and SASP, leading to gradual islet degeneration. We propose that the epigenetic modifier, vitamin C, prevents the establishment of a stable repressive state during differentiation of Rb∆K7 β‐cells, thus reduces DDR and senescence in response to mitogens, facilitating cell cycle re‐entry/regeneration and alleviating diabetes in Rb∆K7 mice. SC denotes senescent cell.
Source data are available online for this figure.
Rb∆K11 blocks proliferation in vivo and induces senescence in vitro that can be attenuated by vitamin C
To determine the effect of Thr246 and Ser605 within pRb∆K7 in vitro and in vivo, we used Rb∆K11 (Jiang & Zacksenhaus, 2002), with Ser/Thr‐to‐Ala substitutions in (i) all the 7 sites in exon 23; (ii) T350 and S601, which are not phosphorylated in Rb∆K7 mice; and (iii) T246 and S605, which are still phosphorylated in proliferating Rb∆K7 cells. Transduction of Rb‐deficient mammary tumor cells (Jiang et al, 2010) with a retrovirus vector encoding Rb∆K11, led to a strong inhibition of cell proliferation and induction of senescence as determined by SA‐βGAL staining (Fig 7B).
Next, we transfected retinal cells from P0 neonates or from E15.5 explants with GFP‐tagged Rb‐WT or Rb∆K11 vectors and determined the effect on cell proliferation two days later (Fig 7C). Over‐expression of Rbwt had no effect. In contrast, over‐expression of Rb∆K11 significantly reduced BrdU incorporation both in vivo and ex vivo to the same extent as over‐expression the CDK4/6 inhibitor p16INK4A (Fig 7D and E). As a positive control, transduction of cyclin D1 induced cell cycle re‐entry. Thus, while endogenous/physiological levels of Rb∆K7 and over‐expression of wild‐type pRb are well tolerated in certain cell types, over‐expression of Rb∆K11 with additional substitutions in Thr246 and Ser605 effectively suppresses cell cycle progression under identical conditions.
Finally, we asked whether senescence induced by over‐expression of Rb∆K11 could also be attenuated in vitro by vitamin C. For these studies, we used human diploid cells, IMR90, commonly employed to study cellular senescence (Serrano et al, 1997; Narita et al, 2003). Retroviral transduction of these cells with Rb∆K11 led to increased cellular senescence (Fig 7F). Addition of vitamin C at the time of retrovirus‐Rb∆K11 transduction significantly reduced senescence, and this was accompanied by increased 5hmC‐DNA modification. Collectively, these results demonstrate that vitamin C can reduce senescence induced by Rb∆K11 in vitro and attenuate the degeneration of pancreatic β‐cells and diabetes in Rb∆K7 mice in vivo (Fig 7G).
Discussion
Aging is instigated by diverse processes that promote cellular senescence and local inflammation, resulting in exhaustion of resident stem cells, tissue degeneration, and systemic organ failure (Rando & Chang, 2012; Lopez‐Otin et al, 2013; Imai & Guarente, 2014; Johnson & Imai, 2018). Inhibition of pRB phosphorylation in response to increased expression of CDK inhibitors such as p16ink4a and p21cip1 is viewed as a major landmark in the onset of tissue degeneration and aging (Janzen et al, 2006; Krishnamurthy et al, 2006; Molofsky et al, 2006). Indeed, pRb is depicted at the center of biological processes that dictate whether a cell undergoes proliferation, quiescence, or differentiation on the one hand, or cellular senescence on the other hand (Lopez‐Otin et al, 2013; Signer & Morrison, 2013; Gorgoulis et al, 2019; Amaya‐Montoya et al, 2020). However, so far, no experimental evidence directly links pRb phosphorylation to the control of homeostasis and aging in vivo. Here, we show for the first time that inhibition of pRb phosphorylation in knock‐in mice induces diabetes and other hallmarks of accelerated aging, thus establishing pRb phosphorylation as a central node that governs tissue regeneration and aging.
Using knock‐in mice with Ser/Thr‐to‐Ala substitutions in conserved CDK sites, we show that blocking endogenous pRb phosphorylation on all seven C‐terminal sites in exon 23 does not interfere with embryogenesis or early neonatal development in homozygous Rb∆K7 mice. However, in accordance with its tumor suppressor activity, Rb∆K7‐derived MEFs show reduced cell proliferation and enhanced replicative senescence in culture. As Rb∆K7 mice mature, they develop defects associated with reduced tissue regeneration: Males are infertile and both genders exhibit short telomeres, reduced hair regeneration, kyphosis, and diabetes. Diabetes in Rb∆K7 mice is insulin‐sensitive and associated with increased DDR and senescence, abnormal islet morphology, cellular disorganization, gradual loss of pancreatic β‐cells, and reduced islet mass. Interestingly, PDX‐1, which interferes with β‐cell function and insulin secretion (Nasteska et al, 2021), is intensely expressed in adult pancreatic Rb∆K7 β‐cells. Although insulin secretion is not the primary defect in young Rb∆K7 mice, high PDX‐1 expression and senescence of pancreatic islet cells in older Rb∆K7 mice point to a gradual defect not only in islet size and organization but also in β‐cell function. Indeed, diabetic Rb∆K7 mice exhibit reduced circulating insulin levels. We further show that pancreatic islet degeneration in these mice is due to failure of Rb∆K7 β‐cells to transition through the quiescent/G0‐to‐G1 phase and re‐enter the cell cycle in response to distinct mitogenic signals (pregnancy; exendin4).
Remarkably, we found that the epigenetic regulator vitamin C, provided in diet before pancreatic β‐cells exit the cell cycle, reduced the DDR, increased cell‐cycle re‐entry during pregnancy, and ameliorated diabetes in Rb∆K7 mice. Vitamin C also attenuated senescence induced by over‐expression of under‐phosphorylatable Rb∆K11 allele in cell culture. We propose that constitutive expression of pRb∆K7 establishes a stable pancreatic β‐cell differentiation that impedes re‐entry into the cell cycle in response to mitogenic cues (Fig 7G). When encountering mitogens, pRb∆K7 in β‐cells cannot be inactivated by phosphorylation, triggering a DDR that culminates in cellular senescence, SASP, and tissue aging. Vitamin C, in this view, preempts the permanent cell cycle exit imposed by pRb∆K7 and thereby the DDR, hypo‐proliferation, and cellular senescence induced by mitogenic signals in Rb∆K7 mice.
Tissue degeneration was exclusively observed in Rb∆K7, not in Rb∆K4 mice. In both mouse strains, Thr350 phosphorylation is completely blocked in proliferating thymocytes. In contrast, Ser601 phosphorylation is completely suppressed in proliferating Rb∆K7 thymocytes but slightly phosphorylated in Rb∆K4 cells. Additional differences, yet to be elucidated, in phosphorylation status and activity of these phospho‐pRb alleles likely account for the phenotypic differences in these two mouse strains. Interestingly, phosphorylation of Ser243/The246 and Ser605 (Ser249/The252 and Ser612 in humans) persists in proliferating Rb∆K7 thymocytes. These sites are phosphorylated by CDK4 and CDK2 (Zarkowska & Mittnacht, 1997), as well as by other kinases in response to stress signals. Ser249/The252 can be phosphorylated by p38 stress‐activated protein kinase (SAPK) (Gubern et al, 2016), whereas Ser612 by Chk1/2 (Inoue et al, 2007). We found no significant change in sensitivity of Rb∆K7 MEFs to p38α plus p38β2 inhibitors, but additional analysis is needed to define the role of this kinase family in Ser249/The252 phosphorylation in Rb∆K7 mice. pRb phosphorylation involves the docking of CyclinD‐CDK4/6 to an alpha‐Helix in its C terminus (downstream of exon 23) and mutation in this Helix blocks pRb phosphorylation (Topacio et al, 2019). Whether Rb∆K7 substitutions affect interaction with CyclinD‐CDK4/6 and which exact kinase (p38‐SAPK; Chk1/2, others) phosphorylates pRb∆K7 on Ser243/The246 and Ser605 await further investigation.
Insulin+ β‐cells are larger in Rb∆K7 compared to control mice, and increased cell size is observed in all pancreatic β‐cells, not only in IL‐6+ or MMP‐2+ senescent cells, pointing to an intrinsic role for pRb phosphorylation in cell size control. Both CDK4/6 and p38‐MAPK have been implicated in cell size homeostasis in vitro (Tan et al, 2021); Rb∆K7 mice provide a powerful tool to analyze cell size regulation in vivo.
The diabetic phenotype in Rb∆K7 mice resembles mouse models of some but not all upstream regulators of pRb phosphorylation. Thus, while CyclinD1 is essential for retinal and pregnancy‐induced mammary alveolar development (Sicinski et al, 1995) and CyclinD3 is needed for lymphocyte development (Sicinska et al, 2003), CyclinD2 is uniquely required for pancreatic β‐cell proliferation (Sicinski et al, 1996; Kushner et al, 2005). Likewise, whereas CDK2 is essential for meiosis but not mitosis (Berthet et al, 2003) and CDK6 is non‐essential, CDK4 is distinctively required for pancreatic β‐cell duplication (Rane et al, 1999). These results point to CyclinD2 and CDK4 as chief regulators of pRb phosphorylation in pancreatic β‐cells. However, the CyclinD2‐CDK4 complex controls G1‐to‐S progression, whereas our results implicate pRb phosphorylation in the transition of pancreatic β‐cells from a quiescent/differentiated state (G0) back to cycle (G1). Further analysis is therefore needed to determine the stage (G0‐to‐G1 or G‐to‐S transition) in which pRb phosphorylation is critical for pancreatic β‐cell regeneration, and the specific kinase that phosphorylates and inactivates pRb during β‐cell reduplication.
The cell cycle re‐entry defect and diabetes in Rb∆K7 adult mice are in sharp contrast to the apparent normal proliferation and development of Rb∆K7 embryos, suggesting that while certain adult quiescent/differentiated cells fail to phosphorylate and inactivate pRb∆K7, embryonic cells/stem cells can readily divide despite persistent pRb∆K7 expression. These differences may reflect the high CDK activity in embryonic stem cells as opposed to the low CDK activity in differentiated cells (Kareta et al, 2015), and/or the fact that in dividing cells, active pRb never establishes a stable, epigenetically repressed chromatin characteristic of differentiated cells.
We previously demonstrated that targeted deletion of Rb in islet progenitors leads to expansion of β‐cell mass (Cai et al, 2013). Together with results presented herein, β‐cells appear particularly sensitive to both the level of pRb and its phosphorylation status. Additional tissues including testis and skin exhibit specific defects in Rb∆K7 mice. Other tissues in Rb∆K7 mice may show regeneration defects only if directly challenged (e.g., by hepatectomy, muscle injury, or mammary epithelial transplantation) or if followed up for a longer period by suppressing the early onset of death from diabetes, for example by targeting the expression of an Rb‐shRNA transgene to islet progenitors. Notably, tumors were not detected in 1‐year‐old Rb∆K7 mice. This is in contrast to the paradoxical development of mammary tumors in MMTV‐Rb∆K transgenic mice at ~1.5 years of age (Jiang & Zacksenhaus, 2002), possibly as a result of inhibition of apoptosis or induction of pro‐tumorigenic senescence/SASP by constitutively active pRb∆K. Genetic rescuing of the diabetic defect or sequential transplantation assays may reveal pro‐tumorigenic effects of persistent pRb∆K7 expression on tumorigenesis.
Our observation that systemic inhibition of pRb phosphorylation leads to telomere attrition indicates that the impact of pRb∆K7 on tissue regeneration may be more complex than its negative regulation of cell proliferation. Telomere maintenance is crucial for aging; hyper‐long telomeres extend life span in mice (Munoz‐Lorente et al, 2019), while short telomeres predict mortality and aging‐related diseases (Blackburn et al, 2015), including pancreatic β‐cell destruction in late‐stage T2D (Guo et al, 2011). Thus, the effect of pRb∆K7 on telomere length alone may suffice to trigger replicative stress, senescence, and aging. However, short telomeres were observed in pRb∆K4 mice, which do not exhibit any aging defect or diabetes, indicating that telomere erosion alone may not account for the homeostasis defects in pRb∆K7 mice. Loss of all Rb family members (Rb, p107, and p130) has previously been shown to increase telomere length (Garcia‐Cao et al, 2002). Thus, both Rb family loss (Garcia‐Cao et al, 2002) and pRb activation (this study) impact telomere length, highlighting the importance of this tumor suppressor in controlling chromosomal ends. We attributed short telomeres in Rb∆K mice to its constitutive interaction with SUV4‐20H1 and SUV4‐20H2, which regulate telomere replication (Benetti et al, 2007). In addition, we previously demonstrated that pRB directly interacts with the RNA polymerase II CTD phosphatase SSU72 (St‐Pierre et al, 2005). SSU72 has recently been shown to function as a telomere replication terminator (Escandell et al, 2019), suggesting another mechanism by which pRb∆K7 may control telomere maintenance.
Vitamin C is an epigenetic regulator that can reprogram the chromatin by demethylating the DNA via TET enzymes (Blaschke et al, 2013; Chen et al, 2013; Cimmino et al, 2018). Vitamin C diet was shown to increase survival in mice, which synthesize this vitamin (Massie et al, 1984). Humans are completely dependent on external sources of vitamin C, and maintaining healthy vitamin C levels can protect against age‐related cognitive decline and Alzheimer’s disease (Harrison, 2012), mortality (Khaw et al, 2001), T1D (Ceriello et al, 2009, 2013), and T2D (Cunningham, 1998; Afkhami‐Ardekani & Shojaoddiny‐Ardekani, 2007; Mason et al, 2019). The underlying mechanism by which vitamin C exerts its effects is likely complex, involving epigenetic reprograming as well as other processes (oxidative stress, senescence, inflammation, etc.). Rb∆K7 mice provide a novel platform to assess potential new combinations of pro‐longevity supplements. Several agents such as senolytics that selectively eliminate senescent cells (Chang et al, 2016; Xu et al, 2018; Thompson et al, 2019), NAD+ precursors (Zhang et al, 2016), PI3K inhibitors (Johnson et al, 2013; Bitto et al, 2016), and aspirin (Pietrocola et al, 2018) have been demonstrated to reverse aging and/or extend life span in animal models. In particular, the senolytics ABT‐199 and ABT‐263, specific inhibitors BC‐L2 protein family, were shown to clear senescent cells and ameliorate T1D‐ and T2D‐like diseases in mice (Aguayo‐Mazzucato et al, 2019; Thompson et al, 2019). Future experiments will determine whether vitamin C, which prevents senescence, would synergize with ABT‐199, ABT‐263, or other senolytics, which eliminate senescent cells, to cure diabetes and extend life span of Rb∆K7 mice and other models of diabetes and aging.
The complex effect of blocking pRb phosphorylation, uncovered herein, should be taken into account whenever its activity is manipulated. CDK4/6 inhibitors, which block pRb phosphorylation, show efficacious clinical results for the treatment of RB proficient tumors such as ER+ breast cancer. Side effects associated with anti‐CDK4/6 therapy are not severe, yet, high doses of palbociclib induce pancreatic β‐cell failure in experimental young rats (Sacaan et al, 2017). Given our observation that vitamin C attenuates diabetes in Rb∆K7 mice, it would be important to determine whether concurrent vitamin C diet would diminish such adverse effects in conjunction with high‐dose anti‐CDK4/6 cancer therapy.
In summary, our results demonstrate that complete phosphorylation of endogenous pRb is not required for normal embryogenesis but is crucial for telomere maintenance, male fertility, and regeneration of several tissues, particularly pancreatic β‐cells. Thus, persistent expression of hypo‐phosphorylated, active pRB blocks cancer cell proliferation but also suppresses normal tissue regeneration, leading to accelerated aging. We show that diabetes in Rb∆K7 mice can be mitigated at least in part by vitamin C diet, suggesting that the deleterious effects of stress/aging‐induced inhibition of pRB phosphorylation may be amenable to prophylactic treatment.
Materials and Methods
Mouse analysis
Mouse experiments were conducted with approval of the University Health Network (UHN) Animal Care Committee. Heterozygous RbK4/+ and RbK7/+ knock‐in mice were generated by homologous recombination (Appendix) and identified initially by Southern blot hybridization and then genotyped by PCR of tailed DNA. Homozygous Rb∆K4 and Rb∆K7 were generated by crossing heterozygote mice. Mice were fed on normal diet (Harlan Laboratories Teklad, 7912) or 1% vitamin C‐supplemented pellet.
Telomere length analysis
Primary mouse splenocytes were isolated and activated with anti‐CD3 antibody (BD Biosciences) as described (Snow et al, 2007). The following day, the cultures were treated with 0.1 µg/ml Colcemid (Roche) for 5–6 h, swollen in 0.075 M KCl hypotonic buffer, fixed in a 3:1 volume of methanol‐acetic acid, and dropped onto slides. Quantitative fluorescence in situ hybridization (Q‐FISH) of activated splenocytes was performed as described previously (Blasco et al, 1997; Zijlmans et al, 1997). A Cy3‐labeled (CCCTAA)3 peptide nucleic acid (Applied Biosystems) was used as a probe. Chromosomes were counterstained with DAPI (4',6'‐diamidino‐2‐phenylindole). Telomere fluorescence signal intensities were quantified using TFL‐Telo Q‐FISH software (version 2.1.04.1217; BC Cancer Agency; Steven S. S. Poon and Peter M. Lansdorp). Telomere signal intensities were compiled from at least 10 metaphases (1,600 telomeres) for each sample. Each set of knock‐in and control littermates as well as C57Cl/6 mice was analyzed at the same time. For statistical analysis, we combined all the WT samples (5 mice, n = 8,044 chromosome ends) and all K4/K4 samples (5 mice, n = 8,038 chromosome ends) and performed two‐tailed Mann–Whitney U‐test; P‐value was < 0.001.
Histology, pathology, TUNEL, and immunohistochemistry
Adult mice were immersed in 10% paraffin and indicated tissues were processed for pathological analysis. For timed‐pregnancy, the morning of vaginal plug observation was considered E0.5. Embryos were fixed in fresh 4% paraformaldehyde in PBS at 4°C overnight, dehydrated, paraffin–embedded, and sectioned at 4µ. TUNEL analysis was performed as described (Jiang et al, 2000). Antibodies for IHC were used at 1:200 dilution: phospho‐pRb‐Ser807/811 antibodies (Cell signaling, #9308), phospho‐Rb‐Ser612 (Affinity Bioreagents #OPA1‐03891), RbpSer/Thr‐249/252 (BioSource #44‐584G), phospho‐Rb‐Ser773 (human Ser780; Cell Signaling), phospho‐Rb‐Ser788 (Cell Signaling, #9307), phospho‐Rb‐Ser795 (Cell Signaling, #9301), phospho‐Rb‐Ser‐605 (human Ser612; Cyclex, clone 3C11 Cat# CY‐M1013, and ABR Affinity Bioreagents Cat # OPA1‐03891), phospho‐Rb‐Ser601 (Cell signaling; #2181), phospho(Ser/Thr)‐ATM/ATR substrate (Cell Signaling #2851), phospho‐ATM (Rockland, #200‐301‐500), mouse E2F1 (Invitrogen #32‐1400), PDX1 (Millipore #AB3503), SOX9 (SantaCruz, sc‐166505), p53BP1 (Cell Signaling #4937), phospho‐Histone H2A.X(Ser139) (Cell Signaling #9718), phospho‐p53(Ser15) (Cell Signaling #9284), H3K9me3 (Millipore #07‐442), PH3(Ser10) (Cell Signaling #9701), HP1g (Abcam #ab10480), BrdU (Abcam #ab6326), monoclonal PCNA (Sigma), CyclinD1 (MedCorp. #RB‐9041), Ki67 (Biocare medical #CRM325); MCM4 (Cell signaling #12973), Kir6.2 abcam; #ab79171 IL‐6 Novus Biological (clone 1270; # NBP2‐44953, 1:80 dilution), CXCL12/SDF‐1 (clone 79018; # MAB350‐SP; 1:120); Insulin (Sigma, #I2018) was used at 1:1,000 dilution.
Kinase inhibitor screens
Robotic screens were performed at the SMART facility, Toronto, using a Biomek FX liquid handler equipped with a pintool for automated compound dispensing. Passage 4 MEFs were plated at 1,000 cells per well in 384 plates. Compounds, resuspended in DMSO as 1mM stock solutions, were added at a final concentration of 4uM. As a reference for 100% activity, each plate included 32 wells with cells treated with vehicle only; background was measured with media in the absence of cells. Cell viability for screens was determined by alamar blue and confirmed by 3‐(4,5‐dimethylthiazol‐2‐yl)‐2,5‐diphenyl‐tetrazolium bromide (MTT) assays in 96‐well plates, read at 570 nm.
Blood glucose and insulin analysis
Glucose tolerance, insulin tolerance and glucose‐stimulated insulin secretion tests were performed on overnight‐fasted (14–16 h) Rb∆K7, Rb∆K4 or control wild‐type male mice exactly as described (Liadis et al, 2005; Choi et al, 2010; Cai et al, 2013, 2014). For GTT and GSIS, mice were injected with a single dose of 1g glucose/kg bodyweight. For the ITT, mice received insulin at a dose of 1.5mM/1g body weight.
Retrovirus preparation, infection, and β‐galactosidase assay
1.5 × 10⁶ to 2.0 × 10⁶ phoenix cells were plated on 10 cm plates containing 10 ml of DMEM (+ 10% FBS and 1× PEST) and incubated overnight at 37°C and 5% CO2. The following day, 3 plasmids (pHelper, pVSV‐g, Rb pMXIE‐empty, or pMXIE‐RbΔK7) were mixed with TransIT‐LT1 in OPTI‐MEM, incubated at room temperature for 30 min and added to phoenix cells. The next day, media was replaced with 10 ml of virus‐harvesting media (DMEM + 30% FBS + 1× PEST). After 24 h, medium was collected in polypropylene tubes. 1.5 × 10⁶ tumor epithelial cells seeded onto 10 cm plates in 10 ml DMEM with 10% FBS and 1× PEST were cultured overnight and then infected with pMXIE‐empty or pMXIE‐RbΔK7 virus‐containing media (5 ml virus + 6 ml DMEM + polybrene, final conc. 8 ng/ml). For β‐galactosidase assay, 20,000 GFP‐positive cells were plated onto 6‐well plates containing DMEM (+ 10% FBS and 1× PEST) and allowed to grow for 4 days. After 4 days, media was removed, and cells were washed twice with PBS, fixed in 3% formaldehyde at room temperature for 4 min, and washed with PBS 3 times. Senescence‐associated β‐galactosidase assay solution was added to the plates and incubated at 37°C (without CO2) overnight in the dark.
Retrovirus injection and retinal analysis
Rb∆K7 or littermate mice were briefly anesthetized on ice and (1–2 μl) plasmid DNA (1.5 μg/μl) was injected into the sub‐retinal space through a small corneal incision as previously described (Chen et al, 2009). With tweezer electrodes placed over the eyes, the mice were immediately electroporated using a NEPA21 system (NEPAGENE, Chiba, Japan) with the following settings: voltage, 80 V; pulse length, 50 ms; pulse interval, 950 ms; number of pulses: 5. The eyes were harvested 2 days later (P2). For in vitro electroporation, the retinas were dissected from E15.5 mouse embryos and electroporated in a drop of plasmid DNA, placing the electrodes near the tissue. The embryonic retinas were cultured ex vivo on filters for 2 days. Prior to collecting all the retinas, mice were injected with BrdU (50 mg/kg) or culture media were supplemented with BrdU (1 μg/ml) for 2 h. Retinal tissue was fixed in 4% PFA overnight, dehydrated in 30% sucrose, frozen, cryo‐sectioned, and immunostained with the following antibodies: BrdU (1:500; Abcam Ab1893‐125), Ki67 (1:300; BD Pharmingen 550609), PH3 (1:500; Upstate 06‐570), GFP (1:1,000; Abcam Ab 6662) and counterstained with DAPI (200 ng/ml; Sigma), as described (Pacal & Bremner, 2012). Three E16.5 and P0 control/ Rb∆K7 retinas from three different litters were quantified and at least three different electroporated retinas. At least 400 GFP+ cells were scored for each indicated electroporated plasmid. Plasmids either contained GFP (retroviral control pMXIE‐IRES‐GFP and pMXIE‐IRES‐ wt (mouse) Rb and Rb∆K7 vectors) or they were mixed with a control pMXIE‐IRES‐GFP vector in 4:1 ratio (pECE‐p16INK4a, pECE‐Ccnd1). Statistical analysis was based on one‐way ANOVA followed by Tukey’s multiple comparison tests.
Pancreatic islet preparation and microarray analysis
Islets were isolated from mice as previously described (Liadis et al, 2005; Choi et al, 2010), using 3 ml of 3 mg/ml collagenase (Sigma‐Aldrich) injected into the common bile duct for pancreatic digestion, and islets were picked up under dissecting microscope in RPMI 1640 supplemented with 10% fetal bovine serum, 100 U/ml penicillin, and 100 µg/ml streptomycin, and frozen immediately. RNA was extracted using NucleoSpin® RNA II, Macherey‐Nagel and underwent PC and microarray analysis by Miltenyi Biotec. Briefly, 15 ng of each total RNA sample was used to produce Cy3(control samples)‐ and Cy5(experimental samples)‐labeled cRNA, the RNA samples were amplified and labeled using Agilent Low Input Quick Amp Labeling Kit (Agilent Technologies). Next, 300 ng of the corresponding Cy3‐ and Cy5‐labeled fragmented cRNA were combined and hybridized overnight (65°C) to Agilent Whole Mouse Genome Oligo Microarrays 8 × 60 K. Fluorescence signals of the hybridized Agilent Oligo Microarrays were detected using Agilent’s DNA microarray scanner (Agilent Technologies).
Bioinformatics analysis
Gene expression data were analyzed using GSEA with parameters set to 2,000 gene‐set permutations and gene‐sets size between 15 and 500. Genes were ranked using the normalized Cy5/Cy3_log10 ratios between Rb∆K7 (KI; Cy5) and wild‐type control (WT; Cy3). The gene‐sets included in the GSEA analyses were obtained from KEGG, MsigDB‐c2, NCI, Biocarta, IOB, Netpath, HumanCyc, Reactome and the Gene Ontology (GO) databases, updated September 2011 (http://baderlab.org/GeneSets). GSEA results were visualized by enrichment map (Merico et al, 2010) (Cytoscape, version 1.2 of Enrichment Map software) from array 1 and array 2 using enriched gene sets with a nominal P‐value < 0.001, FDR < 1% and overlap coefficient set of 0.5. Gene set enrichment analysis was also performed using a list of 228 genes that were up‐regulated more than 2 fold and with a P‐value equal or less than 0.05 (g:Profiler software; Reimand et al, 2011), using the options significant only, ordered query and Generic Enrichment Map output type). An enrichment map was generated using enriched gene sets with a P‐value < 0.05 and overlap coefficient set of 0.5. The “log ratio” represents the difference in expression between RbΔK7 and control gene expression. Thus, the array data were first normalized and then log2 transformed. Log ratio is the difference between the mean of RbΔK7 samples and the mean of control samples of the log2 normalized values for any given gene.
Data quantification
All studies were performed in three or more biological replicates as indicated. Results are presented as mean ± standard deviation (SD) and statistical tests (two‐tailed Mann–Whitney U‐test, two‐tailed unpaired Student’s t‐test, or one‐way ANOVA) used to generate error bars and P values are stated in each panel.
Additional Methods are available in the Appendix.
Author contributions
Zhe Jiang: Conceptualization; Formal analysis; Supervision; Validation; Investigation; Visualization; Methodology; Project administration; Co‐corresponding author. Huiqin Li: Data curation; Methodology. Stephanie A Schroer: Data curation; Methodology. Veronique Voisin: Software; Investigation. YoungJun Ju: Investigation. Marek Pacal: Investigation. Natalie Erdmann: Investigation. Wei Shi: Investigation. Philip E D Chung: Investigation. Tao Deng: Investigation. Nien‐Jung Chen: Investigation. Giovanni Ciavarra: Investigation. Alessandro Datti: Supervision; Investigation. Tak W Mak: Supervision. Lea Harrington: Supervision. Frederick A Dick: Resources; Supervision. Gary D Bader: Resources; Supervision. Rod Bremner: Supervision. Minna Woo: Supervision. Eldad Zacksenhaus: Conceptualization; Formal analysis; Supervision; Funding acquisition; Investigation; Project administration.
In addition to the CRediT author contributions listed above, the contributions in detail are:
ZJ and EZ conceived the project and wrote the manuscript with input from all the authors; ZJ, HL, SAS, VV, YJ, MP, NE, WS, PEDC, TD, N‐JC, GC, and EZ performed experiments/bioinformatic analysis and made the figures; ZJ, AD, TWM, LH, FAD, GDB, RB, MW, and EZ supervised the analysis and obtained research fund.
Disclosure statement and competing interests
The authors declare that they have no conflict of interest.
Supporting information
Appendix
Expanded View Figures PDF
Table EV1
Source Data for Expanded View and Appendix
Source Data for Figure 1
Source Data for Figure 2
Source Data for Figure 7
Acknowledgements
This work was supported by the Ontario Institute for Cancer Research through funding provided by the Government of Ontario and US NIH grants P41 RR031228 and GM103504 to GDB, by Canadian Institute for Health Research and the Krembil Foundation to RB, by Canadian Institute for Health Research to MW, and by the Cancer Research Society and Canadian Institute for Health Research to EZ.
The EMBO Journal (2022) 41: e106825.
Contributor Information
Zhe Jiang, Email: zhe.jiang@uhnresearch.ca.
Eldad Zacksenhaus, Email: eldad.zacksenhaus@utoronto.ca.
Data availability
Microarray data deposited in NCBI GEO Datasets: accession GSE180507.
References
- Afkhami‐Ardekani M, Shojaoddiny‐Ardekani A (2007) Effect of vitamin C on blood glucose, serum lipids & serum insulin in type 2 diabetes patients. Indian J Med Res 126: 471–474 [PubMed] [Google Scholar]
- Aguayo‐Mazzucato C, van Haaren M, Mruk M, Lee TB Jr, Crawford C, Hollister‐Lock J, Sullivan BA, Johnson JW, Ebrahimi A, Dreyfuss JM et al (2017) beta cell aging markers have heterogeneous distribution and are induced by insulin resistance. Cell Metab 25: 898–910 [DOI] [PMC free article] [PubMed] [Google Scholar]
- Aguayo‐Mazzucato C, Andle J, Lee TB Jr, Midha A, Talemal L, Chipashvili V, Hollister‐Lock J, van Deursen J, Weir G, Bonner‐Weir S (2019) Acceleration of beta cell aging determines diabetes and senolysis improves disease outcomes. Cell Metab 30: 129–142 [DOI] [PMC free article] [PubMed] [Google Scholar]
- Ait‐Si‐Ali S, Guasconi V, Fritsch L, Yahi H, Sekhri R, Naguibneva I, Robin P, Cabon F, Polesskaya A, Harel‐Bellan A (2004) A Suv39h‐dependent mechanism for silencing S‐phase genes in differentiating but not in cycling cells. EMBO J 23: 605–615 [DOI] [PMC free article] [PubMed] [Google Scholar]
- Amaya‐Montoya M, Perez‐Londono A, Guatibonza‐Garcia V, Vargas‐Villanueva A, Mendivil CO (2020) Cellular senescence as a therapeutic target for age‐related diseases: a review. Adv Ther 37: 1407–1424 [DOI] [PMC free article] [PubMed] [Google Scholar]
- Annicotte JS, Blanchet E, Chavey C, Iankova I, Costes S, Assou S, Teyssier J, Dalle S, Sardet C, Fajas L (2009) The CDK4‐pRB‐E2F1 pathway controls insulin secretion. Nat Cell Biol 11: 1017–1023 [DOI] [PMC free article] [PubMed] [Google Scholar]
- Ashcroft FM, Rorsman P (2012) Diabetes mellitus and the beta cell: the last ten years. Cell 148: 1160–1171 [DOI] [PMC free article] [PubMed] [Google Scholar]
- Benetti R, Gonzalo S, Jaco I, Schotta G, Klatt P, Jenuwein T, Blasco MA (2007) Suv4‐20h deficiency results in telomere elongation and derepression of telomere recombination. J Cell Biol 178: 925–936 [DOI] [PMC free article] [PubMed] [Google Scholar]
- Berthet C, Aleem E, Coppola V, Tessarollo L, Kaldis P (2003) Cdk2 knockout mice are viable. Curr Biol 13: 1775–1785 [DOI] [PubMed] [Google Scholar]
- Bitto A, Ito TK, Pineda VV, LeTexier NJ, Huang HZ, Sutlief E, Tung H, Vizzini N, Chen B, Smith K et al (2016) Transient rapamycin treatment can increase lifespan and healthspan in middle‐aged mice. eLife 5: e16351 [DOI] [PMC free article] [PubMed] [Google Scholar]
- Blackburn EH, Epel ES, Lin J (2015) Human telomere biology: a contributory and interactive factor in aging, disease risks, and protection. Science 350: 1193–1198 [DOI] [PubMed] [Google Scholar]
- Blaschke K, Ebata KT, Karimi MM, Zepeda‐Martinez JA, Goyal P, Mahapatra S, Tam A, Laird DJ, Hirst M, Rao A et al (2013) Vitamin C induces Tet‐dependent DNA demethylation and a blastocyst‐like state in ES cells. Nature 500: 222–226 [DOI] [PMC free article] [PubMed] [Google Scholar]
- Blasco MA, Lee HW, Hande MP, Samper E, Lansdorp PM, DePinho RA, Greider CW (1997) Telomere shortening and tumor formation by mouse cells lacking telomerase RNA. Cell 91: 25–34 [DOI] [PubMed] [Google Scholar]
- Bremner R, Cohen BL, Sopta M, Hamel PA, Ingles CJ, Gallie BL, Phillips RA (1995) Direct transcriptional repression by pRb and its reversal by specific cyclins. Mol Cell Biol 15: 3256–3265 [DOI] [PMC free article] [PubMed] [Google Scholar]
- Brown VD, Phillips RA, Gallie BL (1999) Cumulative effect of phosphorylation of pRB on regulation of E2F activity. Mol Cell Biol 19: 3246–3256 [DOI] [PMC free article] [PubMed] [Google Scholar]
- Buckley MF, Sweeney KJ, Hamilton JA, Sini RL, Manning DL, Nicholson RI, deFazio A, Watts CK, Musgrove EA, Sutherland RL (1993) Expression and amplification of cyclin genes in human breast cancer. Oncogene 8: 2127–2133 [PubMed] [Google Scholar]
- Burkhart DL, Sage J (2008) Cellular mechanisms of tumour suppression by the retinoblastoma gene. Nat Rev Cancer 8: 671–682 [DOI] [PMC free article] [PubMed] [Google Scholar]
- Byun TS, Pacek M, Yee MC, Walter JC, Cimprich KA (2005) Functional uncoupling of MCM helicase and DNA polymerase activities activates the ATR‐dependent checkpoint. Genes Dev 19: 1040–1052 [DOI] [PMC free article] [PubMed] [Google Scholar]
- Cai EP, Wu X, Schroer SA, Elia AJ, Nostro MC, Zacksenhaus E, Woo M (2013) Retinoblastoma tumor suppressor protein in pancreatic progenitors controls alpha‐ and beta‐cell fate. Proc Natl Acad Sci USA 110: 14723–14728 [DOI] [PMC free article] [PubMed] [Google Scholar]
- Cai EP, Luk CT, Wu X, Schroer SA, Shi SY, Sivasubramaniyam T, Brunt JJ, Zacksenhaus E, Woo M (2014) Rb and p107 are required for alpha cell survival, beta cell cycle control and glucagon‐like peptide‐1 action. Diabetologia 57: 2555–2565 [DOI] [PubMed] [Google Scholar]
- Campisi J (2005) Senescent cells, tumor suppression, and organismal aging: good citizens, bad neighbors. Cell 120: 513–522 [DOI] [PubMed] [Google Scholar]
- Ceriello A, Esposito K, Ihnat M, Thorpe J, Giugliano D (2009) Long‐term glycemic control influences the long‐lasting effect of hyperglycemia on endothelial function in type 1 diabetes. J Clin Endocrinol Metab 94: 2751–2756 [DOI] [PubMed] [Google Scholar]
- Ceriello A, Novials A, Ortega E, Canivell S, La Sala L, Pujadas G, Bucciarelli L, Rondinelli M, Genovese S (2013) Vitamin C further improves the protective effect of glucagon‐like peptide‐1 on acute hypoglycemia‐induced oxidative stress, inflammation, and endothelial dysfunction in type 1 diabetes. Diabetes Care 36: 4104–4108 [DOI] [PMC free article] [PubMed] [Google Scholar]
- Chang J, Wang Y, Shao L, Laberge R‐M, Demaria M, Campisi J, Janakiraman K, Sharpless NE, Ding S, Feng W et al (2016) Clearance of senescent cells by ABT263 rejuvenates aged hematopoietic stem cells in mice. Nat Med 22: 78–83 [DOI] [PMC free article] [PubMed] [Google Scholar]
- Chen D, Pacal M, Wenzel P, Knoepfler PS, Leone G, Bremner R (2009) Division and apoptosis of E2f‐deficient retinal progenitors. Nature 462: 925–929 [DOI] [PMC free article] [PubMed] [Google Scholar]
- Chen J, Guo L, Zhang L, Wu H, Yang J, Liu HE, Wang X, Hu X, Gu T, Zhou Z et al (2013) Vitamin C modulates TET1 function during somatic cell reprogramming. Nat Genet 45: 1504–1509 [DOI] [PubMed] [Google Scholar]
- Chicas A, Wang X, Zhang C, McCurrach M, Zhao Z, Mert O, Dickins RA, Narita M, Zhang M, Lowe SW (2010) Dissecting the unique role of the retinoblastoma tumor suppressor during cellular senescence. Cancer Cell 17: 376–387 [DOI] [PMC free article] [PubMed] [Google Scholar]
- Chien Y, Scuoppo C, Wang X, Fang X, Balgley B, Bolden JE, Premsrirut P, Luo W, Chicas A, Lee CS et al (2011) Control of the senescence‐associated secretory phenotype by NF‐kappaB promotes senescence and enhances chemosensitivity. Genes Dev 25: 2125–2136 [DOI] [PMC free article] [PubMed] [Google Scholar]
- Chkhotua AB, Gabusi E, Altimari A, D'Errico A, Yakubovich M, Vienken J, Stefoni S, Chieco P, Yussim A, Grigioni WF (2003) Increased expression of p16(INK4a) and p27(Kip1) cyclin‐dependent kinase inhibitor genes in aging human kidney and chronic allograft nephropathy. Am J Kidney Dis 41: 1303–1313 [DOI] [PubMed] [Google Scholar]
- Choi D, Schroer SA, Lu SY, Wang L, Wu X, Liu Y, Zhang Y, Gaisano HY, Wagner KU, Wu H et al (2010) Erythropoietin protects against diabetes through direct effects on pancreatic beta cells. J Exp Med 207: 2831–2842 [DOI] [PMC free article] [PubMed] [Google Scholar]
- Ciccia A, Elledge SJ (2010) The DNA damage response: making it safe to play with knives. Mol Cell 40: 179–204 [DOI] [PMC free article] [PubMed] [Google Scholar]
- Cimmino L, Neel BG, Aifantis I (2018) Vitamin C in stem cell reprogramming and cancer. Trends Cell Biol 28: 698–708 [DOI] [PMC free article] [PubMed] [Google Scholar]
- Connell‐Crowley L, Harper JW, Goodrich DW (1997) Cyclin D1/Cdk4 regulates retinoblastoma protein‐mediated cell cycle arrest by site‐specific phosphorylation. Mol Biol Cell 8: 287–301 [DOI] [PMC free article] [PubMed] [Google Scholar]
- Coppe JP, Patil CK, Rodier F, Sun Y, Munoz DP, Goldstein J, Nelson PS, Desprez PY, Campisi J (2008) Senescence‐associated secretory phenotypes reveal cell‐nonautonomous functions of oncogenic RAS and the p53 tumor suppressor. PLoS Biol 6: 2853–2868 [DOI] [PMC free article] [PubMed] [Google Scholar]
- Coppe JP, Patil CK, Rodier F, Krtolica A, Beausejour CM, Parrinello S, Hodgson JG, Chin K, Desprez PY, Campisi J (2010) A human‐like senescence‐associated secretory phenotype is conserved in mouse cells dependent on physiological oxygen. PLoS One 5: e9188 [DOI] [PMC free article] [PubMed] [Google Scholar]
- Cunningham JJ (1998) The glucose/insulin system and vitamin C: implications in insulin‐dependent diabetes mellitus. J Am Coll Nutr 17: 105–108 [DOI] [PubMed] [Google Scholar]
- Dick FA, Goodrich DW, Sage J, Dyson NJ (2018) Non‐canonical functions of the RB protein in cancer. Nat Rev Cancer 18: 442–451 [DOI] [PMC free article] [PubMed] [Google Scholar]
- Dor Y, Brown J, Martinez OI, Melton DA (2004) Adult pancreatic beta‐cells are formed by self‐duplication rather than stem‐cell differentiation. Nature 429: 41–46 [DOI] [PubMed] [Google Scholar]
- Drissi R, Dubois ML, Douziech M, Boisvert FM (2015) Quantitative proteomics reveals dynamic interactions of the minichromosome maintenance complex (MCM) in the cellular response to etoposide induced DNA damage. Mol Cell Proteomics 14: 2002–2013 [DOI] [PMC free article] [PubMed] [Google Scholar]
- Dyson NJ (2016) RB1: a prototype tumor suppressor and an enigma. Genes Dev 30: 1492–1502 [DOI] [PMC free article] [PubMed] [Google Scholar]
- Enge M, Arda HE, Mignardi M, Beausang J, Bottino R, Kim SK, Quake SR (2017) Single‐cell analysis of human pancreas reveals transcriptional signatures of aging and somatic mutation patterns. Cell 171: 321–330 [DOI] [PMC free article] [PubMed] [Google Scholar]
- Escandell JM, Carvalho ES, Gallo‐Fernandez M, Reis CC, Matmati S, Luis IM, Abreu IA, Coulon S, Ferreira MG (2019) Ssu72 phosphatase is a conserved telomere replication terminator. EMBO J 38: e100476 [DOI] [PMC free article] [PubMed] [Google Scholar]
- Esteban MA, Wang T, Qin B, Yang J, Qin D, Cai J, Li W, Weng Z, Chen J, Ni SU et al (2010) Vitamin C enhances the generation of mouse and human induced pluripotent stem cells. Cell Stem Cell 6: 71–79 [DOI] [PubMed] [Google Scholar]
- Fu M, Wang C, Li Z, Sakamaki T, Pestell RG (2004) Minireview: Cyclin D1: normal and abnormal functions. Endocrinology 145: 5439–5447 [DOI] [PubMed] [Google Scholar]
- Garcia‐Cao M, Gonzalo S, Dean D, Blasco MA (2002) A role for the Rb family of proteins in controlling telomere length. Nat Genet 32: 415–419 [DOI] [PubMed] [Google Scholar]
- Georgakilas AG, Martin OA, Bonner WM (2017) p21: a two‐faced genome guardian. Trends Mol Med 23: 310–319 [DOI] [PubMed] [Google Scholar]
- Goodrich DW, Wang NP, Qian YW, Lee EYHP, Lee WH (1991) The retinoblastoma gene product regulates progression through the G1 phase of the cell cycle. Cell 67: 293–302 [DOI] [PubMed] [Google Scholar]
- Gorgoulis V, Adams PD, Alimonti A, Bennett DC, Bischof O, Bishop C, Campisi J, Collado M, Evangelou K, Ferbeyre G et al (2019) Cellular senescence: defining a path forward. Cell 179: 813–827 [DOI] [PubMed] [Google Scholar]
- Gubern A, Joaquin M, Marquès M, Maseres P, Garcia‐Garcia J, Amat R, González‐Nuñez D, Oliva B, Real F, de Nadal E et al (2016) The N‐terminal phosphorylation of RB by p38 bypasses its inactivation by CDKs and prevents proliferation in cancer cells. Mol Cell 64: 25–36 [DOI] [PubMed] [Google Scholar]
- Guo N, Parry EM, Li LS, Kembou F, Lauder N, Hussain MA, Berggren PO, Armanios M (2011) Short telomeres compromise beta‐cell signaling and survival. PLoS One 6: e17858 [DOI] [PMC free article] [PubMed] [Google Scholar]
- Harbour JW, Dean DC (2000) Chromatin remodeling and Rb activity. Curr Opin Cell Biol 12: 685–689 [DOI] [PubMed] [Google Scholar]
- Harrison FE (2012) A critical review of vitamin C for the prevention of age‐related cognitive decline and Alzheimer's disease. J Alzheimers Dis 29: 711–726 [DOI] [PMC free article] [PubMed] [Google Scholar]
- Imai S, Guarente L (2014) NAD+ and sirtuins in aging and disease. Trends Cell Biol 24: 464–471 [DOI] [PMC free article] [PubMed] [Google Scholar]
- Inoue Y, Kitagawa M, Taya Y (2007) Phosphorylation of pRB at Ser612 by Chk1/2 leads to a complex between pRB and E2F–1 after DNA damage. EMBO J 26: 2083–2093 [DOI] [PMC free article] [PubMed] [Google Scholar]
- Janzen V, Forkert R, Fleming HE, Saito Y, Waring MT, Dombkowski DM, Cheng T, DePinho RA, Sharpless NE, Scadden DT (2006) Stem‐cell ageing modified by the cyclin‐dependent kinase inhibitor p16INK4a. Nature 443: 421–426 [DOI] [PubMed] [Google Scholar]
- Jiang Z, Liang P, Leng R, Guo Z, Liu Y, Liu X, Bubnic S, Keating A, Murray D, Goss P et al (2000) E2F1 and p53 are dispensable whereas p21Waf1/Cip1 cooperates with Rb to restrict endoreduplication and apoptosis during skeletal myogenesis. Dev Biol 227: 28–41 [DOI] [PubMed] [Google Scholar]
- Jiang Z, Zacksenhaus E (2002) Activation of retinoblastoma protein in mammary gland leads to ductal growth suppression, precocious differentiation, and adenocarcinoma. J Cell Biol 156: 185–198 [DOI] [PMC free article] [PubMed] [Google Scholar]
- Jiang Z, Deng T, Jones R, Li H, Herschkowitz JI, Liu JC, Weigman VJ, Tsao M‐S, Lane TF, Perou CM et al (2010) Rb deletion in mouse mammary progenitors induces luminal‐B or basal‐like/EMT tumor subtypes depending on p53 status. J Clin Invest 120: 3296–3309 [DOI] [PMC free article] [PubMed] [Google Scholar]
- Johnson SC, Yanos ME, Kayser E‐B, Quintana A, Sangesland M, Castanza A, Uhde L, Hui J, Wall VZ, Gagnidze A et al (2013) mTOR inhibition alleviates mitochondrial disease in a mouse model of Leigh syndrome. Science 342: 1524–1528 [DOI] [PMC free article] [PubMed] [Google Scholar]
- Johnson S, Imai SI (2018) NAD (+) biosynthesis, aging, and disease. F1000Res 7: 132 [DOI] [PMC free article] [PubMed] [Google Scholar]
- Kanavaros P, Stefanaki K, Rontogianni D, Papalazarou D, Sgantzos M, Arvanitis D, Vamvouka C, Gorgoulis V, Siatitsas I, Agnantis NJ et al (2001) Immunohistochemical expression of p53, p21/waf1, rb, p16, cyclin D1, p27, Ki67, cyclin A, cyclin B1, bcl2, bax and bak proteins and apoptotic index in normal thymus. Histol Histopathol 16: 1005–1012 [DOI] [PubMed] [Google Scholar]
- Kang C, Xu Q, Martin TD, Li MZ, Demaria M, Aron L, Lu T, Yankner BA, Campisi J, Elledge SJ (2015) The DNA damage response induces inflammation and senescence by inhibiting autophagy of GATA4. Science 349: aaa5612 [DOI] [PMC free article] [PubMed] [Google Scholar]
- Kareta MS, Sage J, Wernig M (2015) Crosstalk between stem cell and cell cycle machineries. Curr Opin Cell Biol 37: 68–74 [DOI] [PMC free article] [PubMed] [Google Scholar]
- Kent LN, Leone G (2019) The broken cycle: E2F dysfunction in cancer. Nat Rev Cancer 19: 326–338 [DOI] [PubMed] [Google Scholar]
- Khaw KT, Bingham S, Welch A, Luben R, Wareham N, Oakes S, Day N (2001) Relation between plasma ascorbic acid and mortality in men and women in EPIC‐Norfolk prospective study: a prospective population study. European Prospective Investigation into Cancer and Nutrition. Lancet 357: 657–663 [DOI] [PubMed] [Google Scholar]
- Kim JE, Jin DH, Lee SD, Hong SW, Shin JS, Lee SK, Jung DJ, Kang JS, Lee WJ (2008) Vitamin C inhibits p53‐induced replicative senescence through suppression of ROS production and p38 MAPK activity. Int J Mol Med 22: 651–655 [PubMed] [Google Scholar]
- Kirkland JL, Tchkonia T (2017) Cellular senescence: a translational perspective. EBioMedicine 21: 21–28 [DOI] [PMC free article] [PubMed] [Google Scholar]
- Kitajima S, Li F, Takahashi C (2020) Tumor milieu controlled by RB tumor suppressor. Int J Mol Sci 21: 2450 [DOI] [PMC free article] [PubMed] [Google Scholar]
- Klein ME, Kovatcheva M, Davis LE, Tap WD, Koff A (2018) CDK4/6 inhibitors: the mechanism of action may not be as simple as once thought. Cancer Cell 34: 9–20 [DOI] [PMC free article] [PubMed] [Google Scholar]
- Knudsen ES, Wang JY (1996) Differential regulation of retinoblastoma protein function by specific Cdk phosphorylation sites. J Biol Chem 271: 8313–8320 [DOI] [PubMed] [Google Scholar]
- Knudsen ES, Wang JY (1997) Dual mechanisms for the inhibition of E2F binding to RB by cyclin‐dependent kinase‐mediated RB phosphorylation. Mol Cell Biol 17: 5771–5783 [DOI] [PMC free article] [PubMed] [Google Scholar]
- Knudsen ES, Witkiewicz AK (2017) The strange case of CDK4/6 inhibitors: mechanisms, resistance, and combination strategies. Trends Cancer 3: 39–55 [DOI] [PMC free article] [PubMed] [Google Scholar]
- Koboldt DC, Fulton RS, McLellan MD, Schmidt H, Kalicki‐Veizer J, McMichael JF, Fulton LL, Dooling DJ, Ding L, Mardis ER et al (2012) Comprehensive molecular portraits of human breast tumours. Nature 490: 61–70 [DOI] [PMC free article] [PubMed] [Google Scholar]
- Kollmann K, Heller G, Schneckenleithner C, Warsch W, Scheicher R, Ott R, Schäfer M, Fajmann S, Schlederer M, Schiefer A‐I et al (2013) A kinase‐independent function of CDK6 links the cell cycle to tumor angiogenesis. Cancer Cell 24: 167–181 [DOI] [PMC free article] [PubMed] [Google Scholar]
- Kong Y, Sharma RB, Nwosu BU, Alonso LC (2016) Islet biology, the CDKN2A/B locus and type 2 diabetes risk. Diabetologia 59: 1579–1593 [DOI] [PMC free article] [PubMed] [Google Scholar]
- Kozar K, Ciemerych MA, Rebel VI, Shigematsu H, Zagozdzon A, Sicinska E, Geng Y, Yu Q, Bhattacharya S, Bronson RT et al (2004) Mouse development and cell proliferation in the absence of D‐cyclins. Cell 118: 477–491 [DOI] [PubMed] [Google Scholar]
- Krishnamurthy J, Torrice C, Ramsey MR, Kovalev GI, Al‐Regaiey K, Su L, Sharpless NE (2004) Ink4a/Arf expression is a biomarker of aging. J Clin Invest 114: 1299–1307 [DOI] [PMC free article] [PubMed] [Google Scholar]
- Krishnamurthy J, Ramsey MR, Ligon KL, Torrice C, Koh A, Bonner‐Weir S, Sharpless NE (2006) p16INK4a induces an age‐dependent decline in islet regenerative potential. Nature 443: 453–457 [DOI] [PubMed] [Google Scholar]
- Kuilman T, Michaloglou C, Vredeveld LC, Douma S, van Doorn R, Desmet CJ, Aarden LA, Mooi WJ, Peeper DS (2008) Oncogene‐induced senescence relayed by an interleukin‐dependent inflammatory network. Cell 133: 1019–1031 [DOI] [PubMed] [Google Scholar]
- Kushner JA, Ciemerych MA, Sicinska E, Wartschow LM, Teta M, Long SY, Sicinski P, White MF (2005) Cyclins D2 and D1 are essential for postnatal pancreatic beta‐cell growth. Mol Cell Biol 25: 3752–3762 [DOI] [PMC free article] [PubMed] [Google Scholar]
- Lees JA, Buchkovich KJ, Marshak DR, Anderson CW, Harlow E (1991) The retinoblastoma protein is phosphorylated on multiple sites by human cdc2. EMBO J 10: 4279–4290 [DOI] [PMC free article] [PubMed] [Google Scholar]
- Liadis N, Murakami K, Eweida M, Elford AR, Sheu L, Gaisano HY, Hakem R, Ohashi PS, Woo M (2005) Caspase‐3‐dependent beta‐cell apoptosis in the initiation of autoimmune diabetes mellitus. Mol Cell Biol 25: 3620–3629 [DOI] [PMC free article] [PubMed] [Google Scholar]
- Liu Y, Johnson SM, Fedoriw Y, Rogers AB, Yuan H, Krishnamurthy J, Sharpless NE (2011) Expression of p16(INK4a) prevents cancer and promotes aging in lymphocytes. Blood 117: 3257–3267 [DOI] [PMC free article] [PubMed] [Google Scholar]
- Lopez‐Otin C, Blasco MA, Partridge L, Serrano M, Kroemer G (2013) The hallmarks of aging. Cell 153: 1194–1217 [DOI] [PMC free article] [PubMed] [Google Scholar]
- Mason SA, Rasmussen B, van Loon LJC, Salmon J, Wadley GD (2019) Ascorbic acid supplementation improves postprandial glycaemic control and blood pressure in individuals with type 2 diabetes: Findings of a randomized cross‐over trial. Diabetes Obes Metab 21: 674–682 [DOI] [PubMed] [Google Scholar]
- Massie HR, Aiello VR, Doherty TJ (1984) Dietary vitamin C improves the survival of mice. Gerontology 30: 371–375 [DOI] [PubMed] [Google Scholar]
- Merico D, Isserlin R, Stueker O, Emili A, Bader GD (2010) Enrichment map: a network‐based method for gene‐set enrichment visualization and interpretation. PLoS One 5: e13984 [DOI] [PMC free article] [PubMed] [Google Scholar]
- Mittnacht S (1998) Control of pRB phosphorylation. Curr Opin Genet Dev 8: 21–27 [DOI] [PubMed] [Google Scholar]
- Molofsky AV, Slutsky SG, Joseph NM, He S, Pardal R, Krishnamurthy J, Sharpless NE, Morrison SJ (2006) Increasing p16INK4a expression decreases forebrain progenitors and neurogenesis during ageing. Nature 443: 448–452 [DOI] [PMC free article] [PubMed] [Google Scholar]
- Munoz‐Lorente MA, Cano‐Martin AC, Blasco MA (2019) Mice with hyper‐long telomeres show less metabolic aging and longer lifespans. Nat Commun 10: 4723 [DOI] [PMC free article] [PubMed] [Google Scholar]
- Narasimha AM, Kaulich M, Shapiro GS, Choi YJ, Sicinski P, Dowdy SF (2014) Cyclin D activates the Rb tumor suppressor by mono‐phosphorylation. eLife 3: e02872 [DOI] [PMC free article] [PubMed] [Google Scholar]
- Narita M, Nunez S, Heard E, Narita M, Lin AW, Hearn SA, Spector DL, Hannon GJ, Lowe SW (2003) Rb‐mediated heterochromatin formation and silencing of E2F target genes during cellular senescence. Cell 113: 703–716 [DOI] [PubMed] [Google Scholar]
- Nasteska D, Fine NHF, Ashford FB, Cuozzo F, Viloria K, Smith G, Dahir A, Dawson PWJ, Lai YC, Bastidas‐Ponce A et al (2021) PDX1(LOW) MAFA(LOW) beta‐cells contribute to islet function and insulin release. Nat Commun 12: 674 [DOI] [PMC free article] [PubMed] [Google Scholar]
- Nielsen GP, Stemmer‐Rachamimov AO, Shaw J, Roy JE, Koh J, Louis DN (1999) Immunohistochemical survey of p16INK4A expression in normal human adult and infant tissues. Lab Invest 79: 1137–1143 [PubMed] [Google Scholar]
- Nik‐Zainal S, Davies H, Staaf J, Ramakrishna M, Glodzik D, Zou X, Martincorena I, Alexandrov LB, Martin S, Wedge DC et al (2016) Landscape of somatic mutations in 560 breast cancer whole‐genome sequences. Nature 534: 47–54 [DOI] [PMC free article] [PubMed] [Google Scholar]
- Nir T, Melton DA, Dor Y (2007) Recovery from diabetes in mice by beta cell regeneration. J Clin Invest 117: 2553–2561 [DOI] [PMC free article] [PubMed] [Google Scholar]
- Otto T, Sicinski P (2017) Cell cycle proteins as promising targets in cancer therapy. Nat Rev Cancer 17: 93–115 [DOI] [PMC free article] [PubMed] [Google Scholar]
- Pacal M, Bremner R (2012) Mapping differentiation kinetics in the mouse retina reveals an extensive period of cell cycle protein expression in post‐mitotic newborn neurons. Dev Dyn 241: 1525–1544 [DOI] [PubMed] [Google Scholar]
- Pai C‐C, Kishkevich A, Deegan RS, Keszthelyi A, Folkes L, Kearsey SE, De León N, Soriano I, de Bruin RAM, Carr AM et al (2017) Set2 methyltransferase facilitates DNA replication and promotes genotoxic stress responses through MBF‐dependent transcription. Cell Rep 20: 2693–2705 [DOI] [PMC free article] [PubMed] [Google Scholar]
- Pernas S, Tolaney SM, Winer EP, Goel S (2018) CDK4/6 inhibition in breast cancer: current practice and future directions. Ther Adv Med Oncol 10: 1758835918786451 [DOI] [PMC free article] [PubMed] [Google Scholar]
- Pietrocola F, Castoldi F, Markaki M, Lachkar S, Chen G, Enot DP, Durand S, Bossut N, Tong M, Malik SA et al (2018) Aspirin recapitulates features of caloric restriction. Cell Rep 22: 2395–2407 [DOI] [PMC free article] [PubMed] [Google Scholar]
- Pu M, Ni Z, Wang M, Wang X, Wood JG, Helfand SL, Yu H, Lee SS (2015) Trimethylation of Lys36 on H3 restricts gene expression change during aging and impacts life span. Genes Dev 29: 718–731 [DOI] [PMC free article] [PubMed] [Google Scholar]
- Rando TA, Chang HY (2012) Aging, rejuvenation, and epigenetic reprogramming: resetting the aging clock. Cell 148: 46–57 [DOI] [PMC free article] [PubMed] [Google Scholar]
- Rane SG, Dubus P, Mettus RV, Galbreath EJ, Boden G, Reddy EP, Barbacid M (1999) Loss of Cdk4 expression causes insulin‐deficient diabetes and Cdk4 activation results in beta‐islet cell hyperplasia. Nat Genet 22: 44–52 [DOI] [PubMed] [Google Scholar]
- Reimand J, Arak T, Vilo J (2011) g:Profiler–a web server for functional interpretation of gene lists (2011 update). Nucleic Acids Res 39: W307–W315 [DOI] [PMC free article] [PubMed] [Google Scholar]
- Rieck S, Kaestner KH (2010) Expansion of beta‐cell mass in response to pregnancy. Trends Endocrinol Metab 21: 151–158 [DOI] [PMC free article] [PubMed] [Google Scholar]
- Roberts PJ, Kumarasamy V, Witkiewicz AK, Knudsen ES (2020) Chemotherapy and CDK4/6 inhibitors: unexpected bedfellows. Mol Cancer Ther 19: 1575–1588 [DOI] [PMC free article] [PubMed] [Google Scholar]
- Rubin SM (2013) Deciphering the retinoblastoma protein phosphorylation code. Trends Biochem Sci 38: 12–19 [DOI] [PMC free article] [PubMed] [Google Scholar]
- Sacaan AI, Thibault S, Hong M, Kondegowda NG, Nichols T, Li R, Rosselot C, Evering W, Fenutria R, Vitsky A et al (2017) CDK4/6 Inhibition on glucose and pancreatic beta cell homeostasis in young and aged rats. Mol Cancer Res 15: 1531–1541 [DOI] [PubMed] [Google Scholar]
- Sanidas I, Morris R, Fella KA, Rumde PH, Boukhali M, Tai EC, Ting DT, Lawrence MS, Haas W, Dyson NJ (2019) A code of mono‐phosphorylation modulates the function of RB. Mol Cell 73: 985–1000 [DOI] [PMC free article] [PubMed] [Google Scholar]
- Schumacher B, Pothof J, Vijg J, Hoeijmakers JHJ (2021) The central role of DNA damage in the ageing process. Nature 592: 695–703 [DOI] [PMC free article] [PubMed] [Google Scholar]
- Serrano M, Lin AW, McCurrach ME, Beach D, Lowe SW (1997) Oncogenic ras provokes premature cell senescence associated with accumulation of p53 and p16INK4a. Cell 88: 593–602 [DOI] [PubMed] [Google Scholar]
- Seymour PA (2014) Sox9: a master regulator of the pancreatic program. Rev Diabet Stud 11: 51–83 [DOI] [PMC free article] [PubMed] [Google Scholar]
- Sicinska E, Aifantis I, Le Cam L, Swat W, Borowski C, Yu Q, Ferrando AA, Levin SD, Geng Y, von Boehmer H et al (2003) Requirement for cyclin D3 in lymphocyte development and T cell leukemias. Cancer Cell 4: 451–461 [DOI] [PubMed] [Google Scholar]
- Sicinski P, Donaher JL, Parker SB, Li T, Fazeli A, Gardner H, Haslam SZ, Bronson RT, Elledge SJ, Weinberg RA (1995) Cyclin D1 provides a link between development and oncogenesis in the retina and breast. Cell 82: 621–630 [DOI] [PubMed] [Google Scholar]
- Sicinski P, Donaher JL, Geng Y, Parker SB, Gardner H, Park MY, Robker RL, Richards JS, McGinnis LK, Biggers JD et al (1996) Cyclin D2 is an FSH‐responsive gene involved in gonadal cell proliferation and oncogenesis. Nature 384: 470–474 [DOI] [PubMed] [Google Scholar]
- Signer RA, Morrison SJ (2013) Mechanisms that regulate stem cell aging and life span. Cell Stem Cell 12: 152–165 [DOI] [PMC free article] [PubMed] [Google Scholar]
- Smukler S, Arntfield M, Razavi R, Bikopoulos G, Karpowicz P, Seaberg R, Dai F, Lee S, Ahrens R, Fraser P et al (2011) The adult mouse and human pancreas contain rare multipotent stem cells that express insulin. Cell Stem Cell 8: 281–293 [DOI] [PubMed] [Google Scholar]
- Snow BE, Mateyak M, Paderova J, Wakeham A, Iorio C, Zakian V, Squire J, Harrington L (2007) Murine Pif1 interacts with telomerase and is dispensable for telomere function in vivo . Mol Cell Biol 27: 1017–1026 [DOI] [PMC free article] [PubMed] [Google Scholar]
- St‐Pierre B, Liu X, Kha LC, Zhu X, Ryan O, Jiang Z, Zacksenhaus E (2005) Conserved and specific functions of mammalian ssu72. Nucleic Acids Res 33: 464–477 [DOI] [PMC free article] [PubMed] [Google Scholar]
- Talchai C, Xuan S, Lin HV, Sussel L, Accili D (2012) Pancreatic beta cell dedifferentiation as a mechanism of diabetic beta cell failure. Cell 150: 1223–1234 [DOI] [PMC free article] [PubMed] [Google Scholar]
- Tan C, Ginzberg MB, Webster R, Iyengar S, Liu S, Papadopoli D, Concannon J, Wang Y, Auld DS, Jenkins JL et al (2021) Cell size homeostasis is maintained by CDK4‐dependent activation of p38 MAPK. Dev Cell 56: 1756–1769 [DOI] [PubMed] [Google Scholar]
- Teta M, Rankin MM, Long SY, Stein GM, Kushner JA (2007) Growth and regeneration of adult beta cells does not involve specialized progenitors. Dev Cell 12: 817–826 [DOI] [PubMed] [Google Scholar]
- Thompson PJ, Shah A, Ntranos V, Van Gool F, Atkinson M, Bhushan A (2019) Targeted elimination of senescent beta cells prevents type 1 diabetes. Cell Metab 29: 1045–1060 [DOI] [PubMed] [Google Scholar]
- Topacio BR, Zatulovskiy E, Cristea S, Xie S, Tambo CS, Rubin SM, Sage J, Koivomagi M, Skotheim JM (2019) Cyclin D‐Cdk 4,6 drives cell‐cycle progression via the retinoblastoma protein's C‐terminal helix. Mol Cell 74: 758–770 [DOI] [PMC free article] [PubMed] [Google Scholar]
- Turner NC, Slamon DJ, Ro J, Bondarenko I, Im S‐A, Masuda N, Colleoni M, DeMichele A, Loi S, Verma S et al (2018) Overall survival with palbociclib and fulvestrant in advanced breast cancer. N Engl J Med 379: 1926–1936 [DOI] [PubMed] [Google Scholar]
- Uchida C (2016) Roles of pRB in the regulation of nucleosome and chromatin structures. Biomed Res Int 2016: 5959721 [DOI] [PMC free article] [PubMed] [Google Scholar]
- Xiong X, Wang X, Li B, Chowdhury S, Lu Y, Srikant CB, Ning G, Liu JL (2011) Pancreatic islet‐specific overexpression of Reg3beta protein induced the expression of pro‐islet genes and protected the mice against streptozotocin‐induced diabetes mellitus. Am J Physiol Endocrinol Metab 300: E669–E680 [DOI] [PubMed] [Google Scholar]
- Xu G, Stoffers DA, Habener JF, Bonner‐Weir S (1999) Exendin‐4 stimulates both beta‐cell replication and neogenesis, resulting in increased beta‐cell mass and improved glucose tolerance in diabetic rats. Diabetes 48: 2270–2276 [DOI] [PubMed] [Google Scholar]
- Xu M, Pirtskhalava T, Farr JN, Weigand BM, Palmer AK, Weivoda MM, Inman CL, Ogrodnik MB, Hachfeld CM, Fraser DG et al (2018) Senolytics improve physical function and increase lifespan in old age. Nat Med 24: 1246–1256 [DOI] [PMC free article] [PubMed] [Google Scholar]
- Zacksenhaus E, Shrestha M, Liu JC, Vorobieva I, Chung PED, Ju Y, Nir U, Jiang Z (2017) Mitochondrial OXPHOS induced by RB1 deficiency in breast cancer: implications for anabolic metabolism, stemness, and metastasis. Trends Cancer 3: 768–779 [DOI] [PubMed] [Google Scholar]
- Zarkowska T, Mittnacht S (1997) Differential phosphorylation of the retinoblastoma protein by G1/S cyclin‐dependent kinases. J Biol Chem 272: 12738–12746 [DOI] [PubMed] [Google Scholar]
- Zhang H, Ryu D, Wu Y, Gariani K, Wang X, Luan P, D'Amico D, Ropelle ER, Lutolf MP, Aebersold R et al (2016) NAD(+) repletion improves mitochondrial and stem cell function and enhances life span in mice. Science 352: 1436–1443 [DOI] [PubMed] [Google Scholar]
- Zhang J, Bu X, Wang H, Zhu Y, Geng Y, Nihira NT, Tan Y, Ci Y, Wu F, Dai X et al (2018) Cyclin D‐CDK4 kinase destabilizes PD‐L1 via cullin 3‐SPOP to control cancer immune surveillance. Nature 553: 91–95 [DOI] [PMC free article] [PubMed] [Google Scholar]
- Zijlmans JM, Martens UM, Poon SS, Raap AK, Tanke HJ, Ward RK, Lansdorp PM (1997) Telomeres in the mouse have large inter‐chromosomal variations in the number of T2AG3 repeats. Proc Natl Acad Sci USA 94: 7423–7428 [DOI] [PMC free article] [PubMed] [Google Scholar]