

Abstract
One of the chief aims of modern biology is to understand the causes and mechanisms of morphological evolution. Multicellular animals display a stunning diversity of shapes and sizes of their bodies and individual suborganismal structures, much of it important to their survival. What is the most efficient way to study the evolution of morphological diversity? The old-new field of evolutionary developmental biology (evo-devo) can be particularly useful for understanding the origins of animal forms, as it aims to consolidate advances from disparate fields such as phylogenetics, genomics, morphometrics, cell biology, and developmental biology. We analyze the structure of some of the most successful recent evo-devo studies, which we see as having three distinct but highly interdependent components: (a) morphometrics, (b) identification of candidate mechanisms, and (c) functional experiments. Our case studies illustrate how multifarious evo-devo approaches taken within the three-winged evo-devo research program explain developmental mechanisms for morphological evolution across different phylogenetic scales.
Keywords: evolutionary developmental biology, morphometrics, morphological transition, comparative developmental analysis, functional analysis
INTRODUCTION
Multicellular animals occupy practically all available habitats on planet Earth, except for deep underground and the high atmosphere.Much of this success is due to continuous morphological radiation, which generated a remarkable variety of animal forms. Over the past 500 million years, members of different animal phyla have evolved dramatically different basic designs, called body plans, and a myriad of more subtle changes has affected the morphology of each and every body part. Developmental processes in every new generation also continuously and consistently reproduce this enormous diversity. Biologists have been curious about the relationship between evolutionary and developmental mechanisms for more than 200 years, and their fundamental mutual importance is readily appreciated: every new morphological change during evolution must involve alterations in developmental programming, and the entire developmental machinery is itself a product of evolution (Russell 1916). Thus, comprehensive understanding of any evolutionary process should ideally include detailed knowledge of the nature and scope of a morphological change (What happened?), the environmental and selective processes causing the change (Why it happened?) and the developmental genetic mechanisms that make it possible (How it happened?). Answers to the first and last questions are the major goals for the new discipline dubbed evolutionary developmental biology (evo-devo) that promises a more multidimensional appreciation of morphological evolution. The why question is best addressed in collaboration with ecological and environmental sciences, a joint effort sometimes called eco-evo-devo (Gilbert & Epel 2009). Evo-devo researchers are tackling many important evolutionary concepts and morphological transitions and already have generated enlightening case studies. In so doing, they have employed a variety of observational and experimental methods, which differ tremendously in levels of sophistication and efficacy. This review describes both the animal models studied and the methods employed to investigate developmental mechanisms for morphological evolution. Rather than attempting to comprehensively review all the literature in the field, our aim is to analyze the structure of representative case studies that, in our view, illustrate the methodology and components that a study in evolutionary developmental biology should have. To this purpose, this review is divided into three sections that represent what we see as major ingredients for studying animal morphological evolution: (a) morphometric analysis of evolutionary changes, (b) search for developmental genes/pathways involved in generating variation, and (c) functional tests to reveal how these genes/pathways operate. We introduce each section by providing a general overview of methods that illustrate our main points. We then focus on three major evo-devo models representing different phylogenetic scales: microevolution at the population level in stickleback fishes, meso-evolution in different species of Darwin’s finches, and macroevolution in various crustacean orders.
WHAT HAPPENED? MORPHOLOGICAL ANALYSIS OF EVOLUTIONARY CHANGE
Different animal species often have distinct morphological features that result from a combination of adaptation, neutral drift, and various physical and biological constraints. Such differences can be subtle in closely related species and more dramatic in species representing more divergent lineages. Almost invariably, to gain a better understanding of the mechanisms involved in generating such morphological differences, the first step is to develop methods that precisely quantify the nature of the morphological change in question. There are many approaches that can be used for this purpose, ranging from counting, recording presence or absence, and performing simple linear measurements of a phenotypic trait to more complex methods aided by a statistical framework, such as geometric morphometrics.
By using simple approaches, e.g., counting and comparing the number of body segments in arthropods and of vertebrae in vertebrates, many studies have described vast differences in these traits across many taxa. Segment number varies tremendously among arthropods; it ranges from less than 10 in some crustaceans (e.g., Branchiura, Maxillopoda) to more than 350 in millipedes (Geophilomorpha) (more than a 30-fold difference). Furthermore, it changes often during arthropod evolution and is a major contributor to unique body plans in arthropods from trilobites to insects (Damen 2004, Minelli & Bortoletto 1988, Peel 2004, Whittington 1997). Variation in vertebral number both at the species level and above is an important part of evolutionary history in vertebrate animals from fishes to reptiles, birds, and mammals (Kaliontzopoulou et al. 2007, Tester & Hiatt 1952). Even small changes in the number of vertebrae have been shown to be adaptive and heritable (Alho et al. 2011, McDowall 2003, Reimchen & Nelson 1987). Fossorial amphibians (Plethodontidae, Caudata) and especially snakes (Serpentes, Squamata) evolved dramatically higher numbers of vertebrae, in some cases up to 400, that allow for exceedingly flexible bodies (Hoffstetter & Gasc 1969, Lindell 1994, Parra-Olea & Wake 2001). These examples are important because body segments and vertebrae are highly modular, as they are produced through stereotypical and repetitive developmental processes (segmentation and somitogenesis, respectively). As a result, their numbers can be changed during evolution and facilitate the origin of unique body plans.
The simplest morphological measurement is recording the absence or loss of morphological structure(s). Particular features of animal morphology may not match even in closely related species; these range from subtle features, such as pigmentation spots or bristles on fruit fly wings and legs, to much more essential structures, such as mouthparts, which are lost in some adult beetles (Scarabaeidae), mayflies (Xylococcidae), and blowflies (Hemiptera) (Snodgrass 1993). Wings, which pterygote insects evolved over 200 Mya, were apparently lost multiple times in many insect orders, and some completely wingless orders exist, e.g., lice (Psocoptera, Siphunculata, Mallophaga) and fleas (Siphonaptera). Recent molecular phylogeny suggests that stick insects (Phasmatodea) lost both pairs of wings early in their evolution and then regained them multiple times, presumably because the wing development program was conserved in some fundamental form and then redeployed (Whiting et al. 2003). The recent example of wing reevolution in treehoppers (Membracidae, Hemiptera) is interesting because it reveals how a careful morphological analysis can help discover a major evolutionary innovation in an animal group that has been studied by many researchers previously (Prud’homme et al. 2011). All modern insects lack wings on the first thoracic (T1) segment; the activity of the homeotic HOX gene Scr suppressed formation of these structures for millions of years (Carroll 1995). In the treehopper Publilia modesta (Membracidae), the appendage program is no longer inhibited in the dorsal part of the prothorax, and although the resulting serial homologs of wings are not used for flight, these elaborate helmet (pronotum) structures are used for camouflage and display. Importantly, the morphological evidence for the wing origin of the T1 helmet included a combination of the adult and larval morphology of external and internal features, e.g., muscular articulation of the helmet with the body wall (Prud’homme et al. 2011).
Micro-Evo-Devo: Pelvic Fin Reduction in Three-Spined Sticklebacks
Most evolutionary studies of morphology report measurements of linear dimensions, such as length, width, and other similar parameters of the entire body and its parts. Such measurements processed with appropriate statistical tools can become a foundation for further studies, such as comparative developmental analyses, genetic screens, and/or functional tests. In the three-spined stickleback Gasterosteus aculeatus (Gasterosteidae, Actinopterygii), a well-studied morphological structure is the pelvic fin skeleton, which is present and functions in the ancestral anadromous forms to support spikelike hindfins but is highly reduced in the recently evolved freshwater populations (Shapiro et al. 2004) (Figure 1a–c). To understand variation in pelvic spines, they were measured from the distal tip to the point of articulation with the pelvis, pelvic girdles from the anterior to posterior tip, and the ascending branch from the dorsal tip to the point of articulation with the spine. Phenotypic measures were analyzed using raw pelvic measurements, measurements scaled to standard lengths of fish, or residuals of a regression of pelvic measurements on standard body length (Peichel et al. 2001, Shapiro et al. 2004). Interestingly, evolutionary changes in sticklebacks also have a modular nature, as different structures are affected relatively independently of each other during the marine to freshwater transition. In this review, sticklebacks serve as a primary illustration of morphological evolution at the population level.
Figure 1.
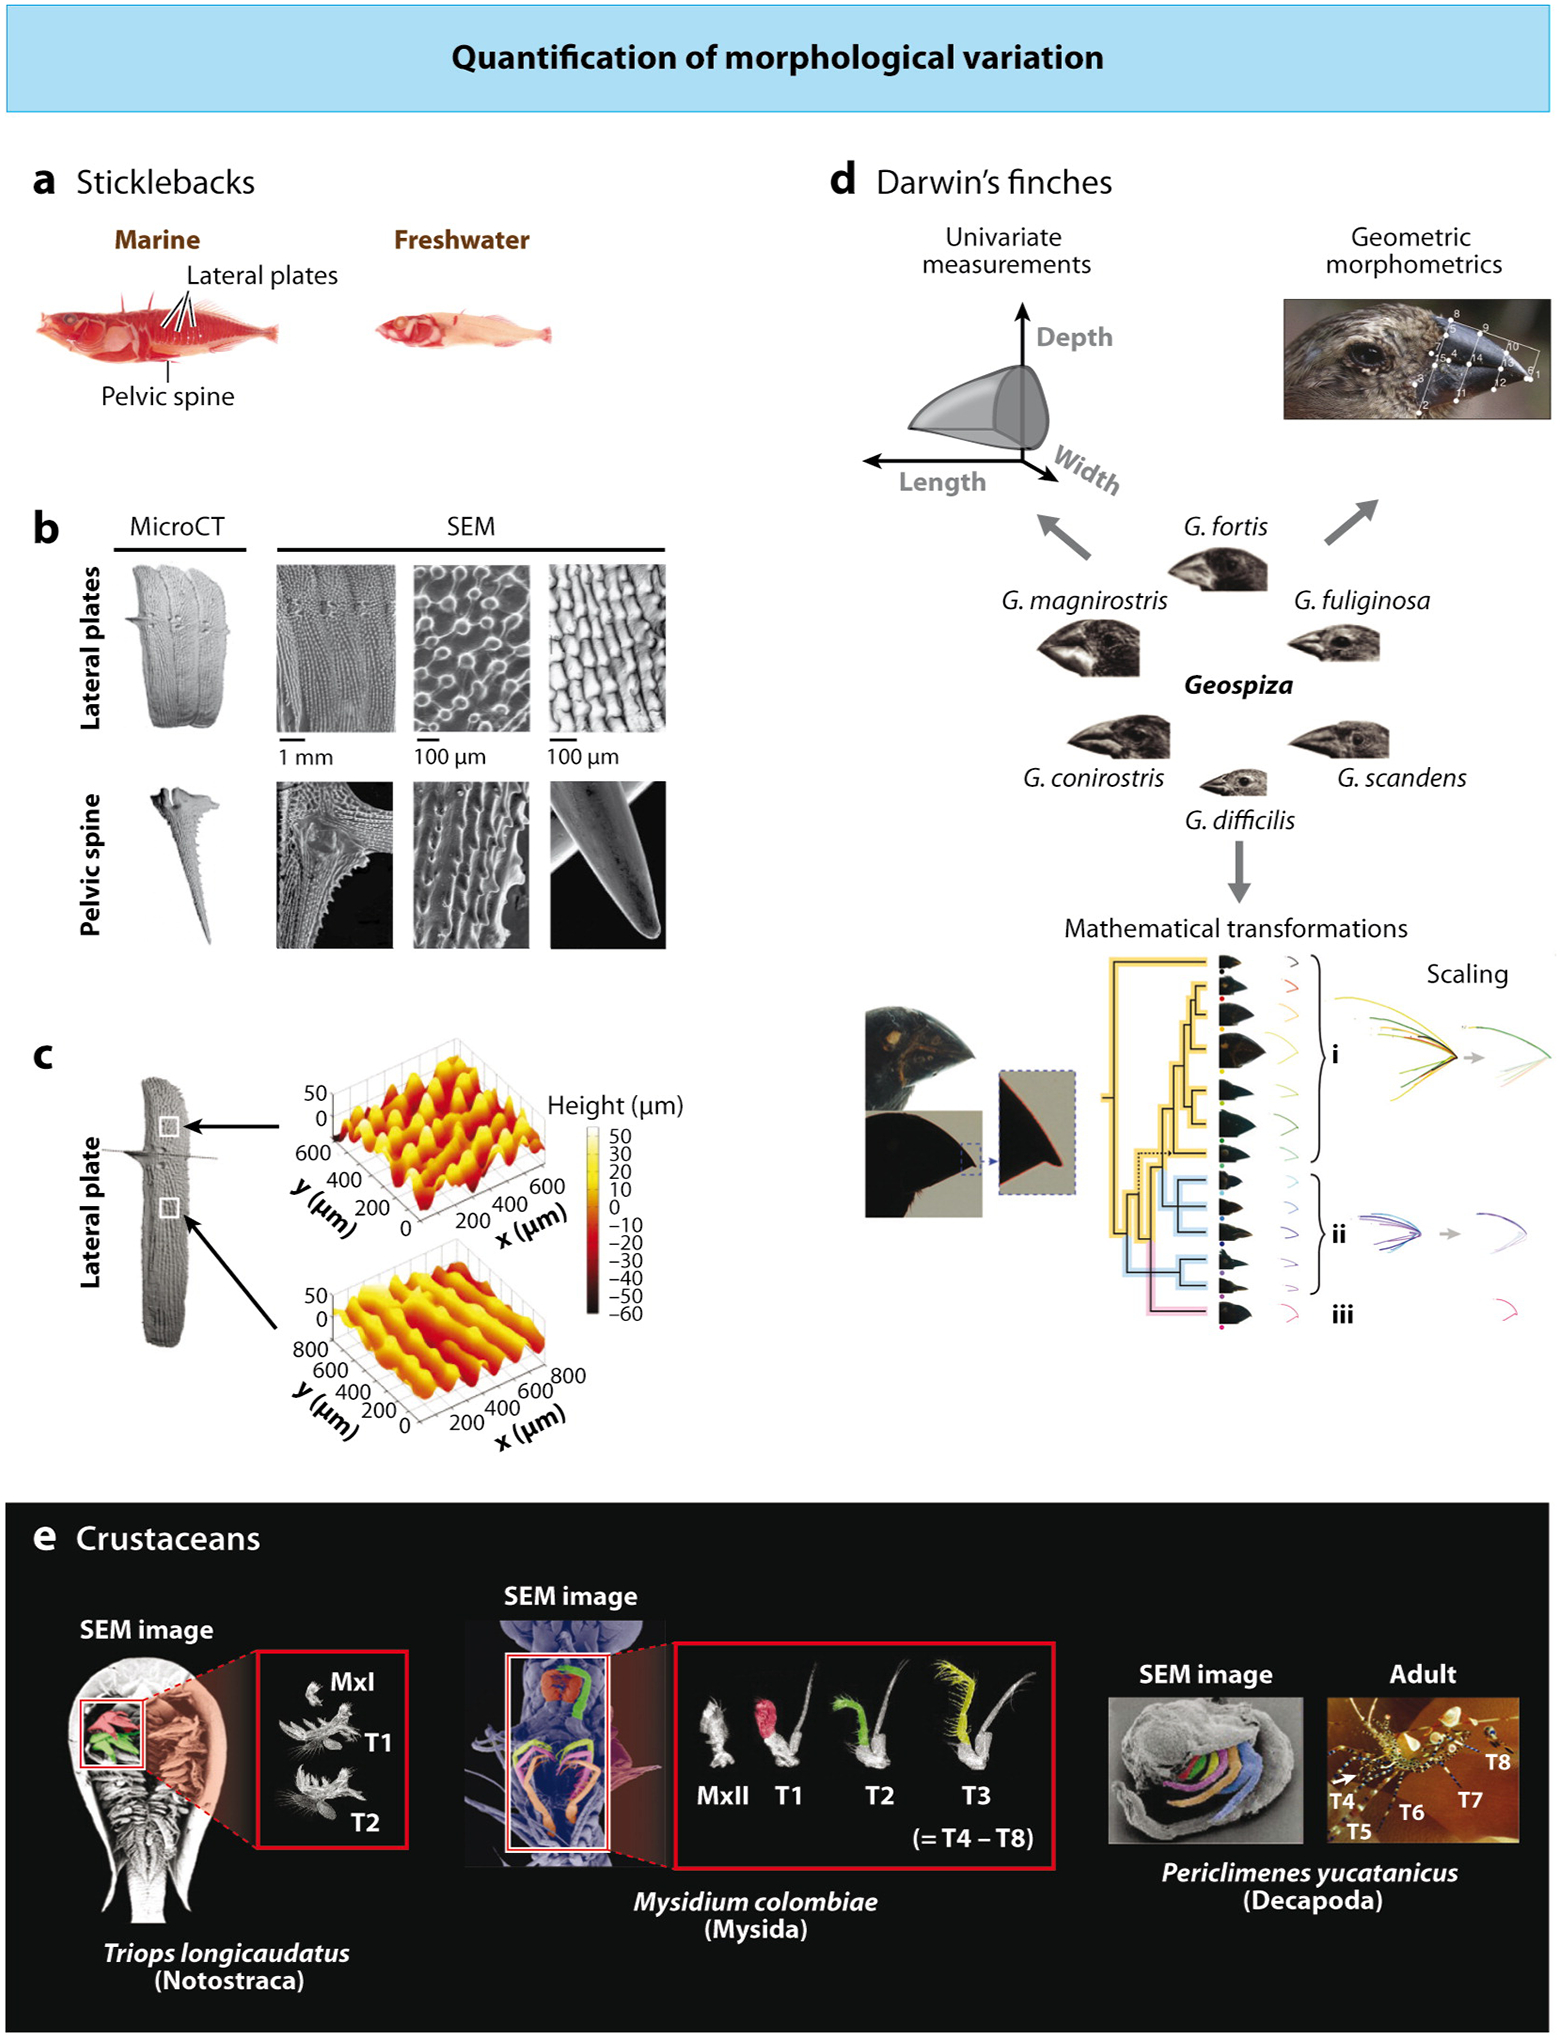
Researchers use different methods to quantify morphological variation across different phylogenetic scales. (a) Marine and freshwater populations of three-spined sticklebacks, Gasterosteus aculeatus, differ in morphological features of their skeletons, such as the presence of pelvic spines and lateral plates. Courtesy of Mike Shapiro. (b) Researchers have quantified different features of such structures using various methods, from simply scoring their presence/absence to measurements of bone surface microstructure and topography. Here, microCT (computerized tomography) scans and scanning electron microscopy (SEM) imaging reveal the detailed surface morphology and microstructure of the lateral plate and pelvic spines. (c) A technique dubbed surface profilometry can be used to measure the surface topography of an individual lateral plate. b and c reprinted with permission from Song et al. (2010) J. Struct. Biol. 171:318–31 © Elsevier. (d) Quantification of beak morphological variation in Darwin’s finches traditionally has been based on univariate measurements of beak length, depth, and width. Foster et al. (2008) used geometric morphometrics, a technique that examines geometric associations and relative arrangements between points (i.e., landmarks) in a given structure, and found that such analysis improved the classification of species on the basis of beak shape. Campàs et al. (2010) used a novel approach to determine whether mathematical transformations could quantify variation of beak shape. Beak profiles were digitized, and an algorithm was used to classify beak curvatures into groups on the basis of mathematical similarity. Within each group (i, ii, and iii), beak shapes differ only in scale along specific dimensions (i.e., depth and/or length) and can be shown using scaling transformations to be expressions of a single common shape. Reprinted with permission from Foster et al. (2008) © Wiley and from Campàs et al. (2010) © National Academy of Sciences. (e) Crustacean orders vary in the number of thoracic appendages that have been transformed into maxilliped pairs. In Triopslongicaudatus, a species with no maxillipeds, the thoracic appendages (T1, T2) have similar morphology and are distinct from appendages of gnathal segments. Here, we show a SEM image of Triops (4 days after hatching) with the T1 limb (red) and the T2 limb (green). All the thoracic appendages are used for swimming and have a similar morphology. The dissected limbs from Triops (3 days after hatching) show the morphological distinction between thoracic appendages (T1 and T2) and the appendage of the first gnathal appendage (MxI); the second gnathal appendage (MxII) is reduced in size even further. In Mysidium colombiae, a species with one pair of maxillipeds, the T1 limb acquired the gnathal-like morphology of maxillipeds. Here, a SEM image shows limbs from an adult mysid [second maxillary appendage, MxII; portions of the endopods of the first (T1, red), second (T2, green), and third (T3, yellow) thoracic appendages are shown; thoracic exopods are the long, right-most branches]. T3 to T8 have a similar morphology, but gnathal appendages (MxII shown) have a distinctly different morphology with prominent endites and reduction of more proximal limb elements. The T1 maxilliped endopod is similar to the gnathal appendages. The T2 limb has a “mosaic” endopod—the distal portion resembles a gnathal limb, and the proximal portion resembles a more posterior thoracic limb. The SEM image shows the relative position of limbs (T4, pink; T5, orange; endopods of T6–T8 and the left part of T2 have been removed). The T1 maxilliped is held adjacent to the gnathal appendages and is used for feeding, while the remaining thoracic limbs are locomotory. In Periclimenes, there is a marked reduction and modification of the three most anterior pairs of thoracic limbs, T1, T2, and T3 (red, green, and yellow, respectively; T4 is pink, T5 is orange, T6 is blue, and T7 and T8 are hidden medially in the SEM image). The adult illustrates the typical decapod morphology of five pairs of walking legs (T4–T8) and three pairs of maxillipeds (T1–T3); the arrowhead indicates the position of maxillipeds (only the T3 pair is clearly visible here). Parts of figure courtesy of Nipam Patel, other parts reprinted by permission from Averof & Patel (1997) Nature 388:682–86 © Macmillan Publishers Ltd.
Meso-Evo-Devo: Beak Shape Evolution in Darwin’s Finches
Interspecific morphological variation ideally should be studied in closely related species that display distinguishable morphological differences. Darwin’s finches (Thraupidae, Passeriformes) are one such group in which a single recent ancestor gave rise to fourteen morphologically distinct species that occupy ecological niches normally filled by representatives of multiple bird families (Bowman 1961). Some Darwin’s finches have bills similar to those of warblers, others of grosbeaks, thrushes, parrots, and woodpeckers, and this dramatic morphological radiation has become one of the key examples of adaptive evolution by natural selection (Bowman 1961, Grant & Grant 2008). Several congruent molecular phylogenies allow for meaningful species comparisons. In the monophyletic genus Geospiza, the most basal species, the sharp-billed ground finch Geospiza difficilis has a small symmetrical bill, whereas the more derived ground finches have deep and broad bills to crack hard seeds, and cactus finches have elongated and narrow bills for penetrating cactus flowers (Grant & Grant 2008). More recently, bill morphology in Darwin’s finches was analyzed using geometric morpho-metrics (Foster et al. 2008) (Figure 1d). Unlike traditional morphometrics, which is concerned with absolute measurements, landmark-based geometric morphometrics uses spatial information contained in the data as landmark coordinates, the discrete anatomical loci considered homologous in all individuals under analysis. Specific landmarks chosen for the geometric morphometric analysis of finch bill morphology included culmen (upper mandible) tip, gonys (lower mandible) tip, corner of mandibular rami, junction of the pars mandibularis, and the rostralmost point of the nares. A combination of landmarks and semi-landmarks (points on an outline determined by extrinsic criteria) allowed the researchers to achieve a better discrimination among species and revealed the quantitative contribution of relative size, position, and curvature of the upper and lower mandibles in each of the species (Foster et al. 2008). To understand the mathematical nature of the relationship among bill shapes, a novel method was applied that uses digitized outlines of bill shapes to reveal whether they could be collapsed using affine transformations, such as scaling or shear (Figure 1d) (Campàs et al.2010). In Darwin’s finches, scaling transformations classified the entire diversity of beak morphologies into three groups. These unique group shapes can belong either to a single species (vegetarian finch), to a group of species within a single genus (Geospiza), or even to species that reside in multiple genera (tree, Cocos Island, and warbler finches). Adding the more parameter-rich shear transformations allowed the researchers to account for the variation among group shapes and, therefore, for all of the differences in beak morphologies in Darwin’s finches (Campàs et al. 2010).
Macro-Evo-Devo: Appendage Transformation in Crustaceans
In most morphometric studies, orthologous or serially homologous structures are compared, e.g., legs compared with legs and mouthparts compared with mouthparts. Comparisons between disparate structures with unrelated functions, such as legs and mouthparts, are more difficult, as simple linear measurements are often not meaningful. However, precisely this needs to be done to study the effects of phylohomeosis, which occurs when one structure is transformed into the likeness of another structure during evolution. Such changes are recognized from detailed understanding of both morphology and (molecular) phylogeny, as it is important to identify the ancestral condition and to establish the directionality of the morphological change. During evolution of Malacostraca (higher Crustacea), the largest class of crustaceans, the boundary between segments with mouthparts and segments bearing limbs for locomotion is evolutionarily labile (Figure 1e). For example, members of the basal malacostracan order Leptostraca have mandibles and two pair of maxillae to process food, and all of the more posterior appendages are used for locomotion (Martin & Davis 2001). In the more derived orders Isopoda and Amphipoda, the appendages of the thoracic segment immediately posterior to the head transformed into auxiliary mouthparts called maxillipeds. Curiously, in some Isopoda such phylohomeotic transformation can be observed during embryonic development. For example, the T1 appendage starts very leg-like, but as development progresses it undergoes a series of dramatic morphological alterations, such as expansion of the basal portion, loss of the tip, and growth of branches, and eventually forms the lower lip of the isopod cephalon (Abzhanov & Kaufman 1999). Such cephalon expansion continues in members of Decapoda, which often have 3–4 maxillipeds, although these can differ in shape and function from the head mouthparts and from each other (Averof & Patel 1997). The mouthparts and locomotory appendages have distinctive overall shapes and specific features that can be used to estimate the degree of the transformation. For example, in the model crustacean Parhyale hawaiensis (Hyalidae, Amphipoda) several criteria are used to compare mouthparts, maxillipeds, and thoracic limbs: maxillipeds possess branches on the two most proximal segments, the basis and the ischium (which allow them to serve as jaws); lack coxal plates and gills; and have altered comblike bristle patterns (Liubicich et al. 2009). Morphological transitions of such magnitude can be studied without more meticulous linear measurements and quantitative modeling.
SEARCHING FOR CLUES: IDENTIFYING THE NATURE OF MORPHOLOGICAL VARIATION
Once the structure of morphological change is established, a variety of methods can be employed to pinpoint candidate developmental mechanisms responsible for promoting morphological differences. The most basic method for understanding the roles of developmental changes in morphological evolution is observing processes of embryogenesis using microscopy and histology. In some cases a significant insight can be made by carefully analyzing key stages and events of embryonic or postembryonic development. For example, females of the parasitic wasp Copidosoma floridanum (Encyrtidae, Hymenoptera) lay one or two eggs inside the egg of its host, the cabbage looper moth Trichoplusia ni. As the host egg develops into a caterpillar, each of the wasp eggs will develop into up to 2,000–3,000 embryos in the most extreme known form of polyembryonic development (Grbić et al. 1998). Investigation of C. floridanum embryonic development at the cellular level using confocal and scanning electron microscopy revealed three distinct phases: (a) early cleavage leading to a primary continuously dividing morula, (b) a proliferative phase involving further partitioning into thousands of morulae, and (c) formation and development of individual embryos into larvae. Although the early developmental program is a major departure from the typical insect embryogenesis, the late morphogenesis of polyembryonic wasps follows a pattern conserved in all insects with a typical long germband segmentation (Grbić et al. 1998). These morphological observations suggest that wasp embryonic development is a highly modular process in which early developmental events exhibit little constraint, unlike the much more conserved later phylotypic stages, during which the insect-specific body plan is constructed.
Although similar alterations have been reported at multiple hierarchical levels (e.g., appendages, organs, tissues, and cells), many recent evo-devo studies have focused on ultimately uncovering the specific changes that occur in the genes and/or developmental pathways generating such traits. To achieve this, recent studies have used two distinct types of approaches: the candidate gene approach and genome-wide screens. The candidate gene approach relies on specific a priori information, which is usually drawn from studies in traditional laboratory model systems (e.g., mouse, fruit fly, zebrafish), that narrows down the list of possible developmental factors to a selected set of optimal candidates. Thus, evo-devo researchers have been able to take advantage of the wealth of information that has accumulated after many decades of research on organisms amenable to genetic and developmental analysis and for which experiments aimed at uncovering the molecular basis of phenotypic traits (e.g., deletion screens, mutagenesis screens) have been extensively performed. In contrast to the candidate gene approach, genome-wide screens represent a less biased way to uncover agents responsible for explaining differences in a particular phenotype because they do not rely on any a priori information about the genetic and/or developmental nature of the morphological change. Methods such as quantitative trait loci (QTL) mapping, microarray screens, and the latest technologies for analyzing entire transcriptomes, such as RNA sequencing (RNAseq), provide a powerful starting point for discovering the genes/pathways responsible for morphological changes. The two approaches highlighted above are not mutually exclusive and can be combined to uncover more efficiently the molecular basis of morphological changes. Once researchers have clues as to which genes and/or developmental pathways could be responsible for underlying variation in a morphological trait, it is critical to perform a comparative developmental analysis using a variety of methods that range from histological, immunohistological (e.g., use of cross-reacting antibodies), and in situ hybridization (ISH) analyses of whole embryos and tissue sections to more quantitative approaches such as quantitative real-time polymerase chain reaction (qRT-PCR). A thorough comparative analysis is likely to provide hints as to which specific developmental processes have been altered to produce trait variation.
Comparative developmental analysis often effectively complements morphological descriptions. We described earlier how an investigation of pronotum helmet structures on the T1 segment of the treehopper P. modesta revealed wing-like structures with joint-like features in the developing helmet (Prud’homme et al. 2011). The authors reasoned that if wings and the helmet were serial homologs, then their development must depend on a shared genetic program. Development of T2/T3 wings relies on expression and activity of several transcription factors: nubbin (nub), homothorax (hth), and Distal-less (Dll). Cross-reacting antibodies detected expression of all of these genes in similar patterns in both developing wing and helmet tissues during nymphal stages. Expression of nub in particular is significant as its activity discriminates between wing and other appendage precursors. Formation of T1 wings in all other insects, such as the fruit fly Drosophila, is suppressed by a homeotic HOX gene, Sex combs reduced (Scr), which acts to inhibit expression of nub, among other genes. Curiously, in P. modesta, Scr is still widely expressed in the T1 helmet tissues, and its biochemical wing-inhibiting activity is comparable with that of its homolog from Drosophila (Prud’homme et al. 2011). Thus, evidence on the treehopper helmet morphology combined with comparative developmental analyses suggested a scenario for T1 wing reevolution in which inhibition of the wing development program has been released downstream of Scr.
Micro-Evo-Devo: Genetic Mapping in Three-Spined Sticklebacks
The loss of the pelvic fin skeleton in the three-spined stickleback G. aculeatus (Figure 1a) has been successfully examined by a combination of genetic and molecular techniques. The ability of the marine and freshwater forms to give viable and fertile offspring under laboratory conditions was used to create a genome-wide linkage map (Peichel et al. 2001, Shapiro et al. 2004). This allowed a formal QTL mapping analysis to be conducted to identify the genetic architecture (e.g., number, location, effect size) of many adaptive morphological traits that vary between the marine and freshwater forms, e.g., spine length, armor plate number, and gill rake number (Figure 2a). Genetic mapping revealed that pelvic reduction as a qualitative trait was controlled by one major (producing a near 3:1 Mendelian ratio) and four minor chromosome regions. Pitx1, one of the key candidate genes involved in limb development, mapped to the distal end of linkage group 7, the major chromosome region controlling most of the variation in pelvic size (Figure 2b). Sequencing of the entire Pitx1 coding region from both marine and benthic forms did not find any mutations that would alter the amino acid sequence of the gene (Shapiro et al. 2004). Tellingly, in fish embryos from the freshwater population, Pitx1 was expressed everywhere that it is expressed in marine forms (i.e., thymus, olfactory pits, sensory neuromasts, and caudal fin) except in cells at the site where the pelvic fin bud normally forms (Figure 2c). Further work identified a tissue-specific enhancer of pelvic expression that has been altered by deletions centered on this genomic region independently in multiple populations of pelvic-reduced fish that diverged over 10,000–15,000 years, a microevolutionary timeframe (Chan et al. 2010). What could be the functional significance of such subtle changes in the architecture of a single gene on the morphology of an adult fish?
Figure 2.

Several techniques can be used to find genes that may underlie morphological changes during development. (a) To determine the chromosome regions controlling pelvic reduction in three-spined sticklebacks (Gasterosteus aculeatus), Shapiro et al. (2004) crossed a marine individual with robust development of pelvic structures with a freshwater individual that had reduced pelvic spines. The progeny was scored for qualitative changes in pelvic features and genotyped with genetic markers. Courtesy of Mike Shapiro. (b) A marker located in the first intron of the Pitx1 gene mapped to the distal end of linkage group 7, in a position coinciding with the major region controlling pelvic reduction. The logarithm of odds (LOD) score compares the likelihood of obtaining the observed data if the marker and Pitx1 are linked to the likelihood of observing the same data by chance. High LOD scores suggest that there is linkage between the marker and the gene, whereas lower LOD scores indicate that linkage is less likely. Redrawn from Shapiro et al. (2004) © Macmillan Publishers Ltd. (c) Spatial patterns of Pitx1 expression (red arrowheads) during normal development of stickleback larvae were examined by whole-mount in situ hybridization. Pitx1 shows strong expression in the mouth, lower jaw, and developing pelvis of marine larvae. In freshwater larvae, Pitx1 expression is absent from the developing pelvic region but is present in the mouth and jaw. Reprinted by permission from Shapiro et al. (2004) © Macmillan Publishers Ltd. (d) To identify pathways involved in the evolution of long beaks, complementary DNA microarrays were used to compare the gene expression profiles of tissues that give rise to the upper beak of five species of genus Geospiza. (e) When candidates from the cluster of cactus finch morphology–specific genes were sequenced and screened to find those expressed at higher levels, Calmodulin (CaM) stood out as the best candidate. d,e Reprinted by permission from Abzhanov et al. (2006) © Macmillan Publishers Ltd. (f) A comparative in situ hybridization on embryos of Darwin’s finches confirmed that CaM was indeed expressed at detectably higher levels in common cactus finch (G. scandens) and large cactus finch (G. conirostris) than in similar-sized tissues of ground finches (G. fortis and G. magnirostris, respectively). (g) Studies in Drosophila and Mussuggested that Ultrabithorax (Ubx) and Abdominal-A (Abd-A) might cause the homeotic transformations seen in crustacean appendages. In Parhyale hawaiensis, a crustacean that has a single pair of maxillipeds, Ubx/Abd-A is expressed at lower levels in the second and third thoracic segments (T2 and T3) and appendages, is expressed at higher levels throughout the remaining thoracic segments and appendages (T4–T8), and is absent from the T1 segment and maxillipeds. Similarly, maxillipeds in other crustacean orders do not express Ubx/Abd-A. In contrast, more posterior trunk appendages that play a role in locomotion do express Ubx/Abd-A. Pictures from André Karwath (Drosophila) and George Shuklin (Mus). MxII, second maxillary appendage. (h) This phylogeny shows the distribution of the number of maxillipeds (numbers adjacent to the phylogeny) correlated with the expression of Ubx/Abd-A. Ubx/Abd-A expression data are represented by shading (dark gray indicates strong staining, light gray indicates weaker staining, white indicates no staining). g,h Reprinted by permission from Patel & Averof (1997) Nature 388:682–86 ©Macmillan Publishers Ltd.
Meso-Evo-Devo: Pecking at Candidate Genes in Darwin’s Finches
Darwin’s finches have diverged over a 1–2 million year span and produced 14 species in 5 genera, each with distinct and highly adaptive beak shapes and sizes (Grant & Grant 2008). To understand the developmental basis for such morphological variation in a group, which is not amenable to artificial breeding and direct genetic mapping, comparative analysis methods were employed, including the immunohistochemistry-based candidate gene approach, complementary DNA microarray screens, and qRT-PCR (Abzhanov et al. 2004, 2006; Mallarino et al. 2011). Several developmental candidate pathways were discovered using a combination of these approaches. First, in a candidate gene approach, ISH probes of many developmental genes were applied to cranial sections of embryos from six Geospiza species with three different beak shapes (Figure 1d). Bmp4 (Bone morphogenetic protein 4) was identified as a gene that is expressed at earlier stages and stronger levels in embryos of ground finch species with deeper and wider beaks (Abzhanov et al. 2004). Next, a microarray screen on transcripts expressed in embryonic beak primordia revealed that several genes were expressed with high specificity at high levels in the developing beaks of cactus finches, which have elongated and pointy shapes (Figure 2d,e) (Abzhanov et al. 2006). These candidates were further validated with ISH on cranial sections of Geospiza embryos from two different developmental stages. The second approach identified CaM (Calmodulin), a molecule involved in mediating Ca2+ signaling and the CaM-dependent signaling pathway, as candidate developmental regulators of the cactus finch beak morphology (Figure 2f). Transforming growth factor β type II receptor (TGFβIIR), β-catenin, and Dickkopf-3 (Dkk3), candidates from another recent microarray screen, were found recently to be differentially expressed in skeletal tissue at later embryonic stages during the formation of premaxillary beak bone, which becomes the most important structural and functional component of adult beak, especially in ground finches (Mallarino et al. 2011). Considering the strong correlations between such alterations of gene regulation and distinct beak shapes, is there a causal link?
Macro-Evo-Devo: Morphological Boundaries Versus Molecular Borders in Crustaceans
Leg-to-maxilliped transformations during evolution of malacostracan crustaceans are striking examples of natural homeosis (Figure 1e). The most obvious candidates for promoting such change are homeotic HOX genes (Figure 2g). HOX genes are a set of related homeobox transcription factors that regulate the identities of structures and entire body regions along the main anterior-posterior axis in metazoans. In most crustaceans, the head-trunk boundary coincides with the anterior expression border of two HOX genes, Ultrabithorax (Ubx) and Abdominal-A (Abd-A), as detected with a cross-reacting antibody (Figure 2h) (Abzhanov & Kaufman 2000, Averof & Patel 1997). Maxillipeds and their associated segments do not express either Ubx or Abd-A gene products, which suggests a dramatic shift of this border in lineages that evolved maxillipeds (Figure 2h). Curiously, similar Ubx/Abd-A expression pattern shifts appear to underlie the evolution of maxillipeds in copepods, which belong to another major group of crustaceans, class Maxillopoda (Figure 2h) (Averof & Patel 1997). In some species anterior trunk limbs display characters intermediate of feeding and locomotory appendages (e.g., in peracarid Mysidium columbiae), and Ubx/Abd-A expression is more mosaic in such cases (Figure 2h). In malacostracan crustaceans the HOX gene expressed in true mouthparts and in maxillipeds is a crustacean homolog of Scr (Figure 2h). In the isopod Porcellio scaber the leg-to-maxilliped phylohomeotic transformation is recapitulated during embryonic development (section “Appendage Transformation in Crustaceans” above); originally leg-like T1 appendages dramatically change their morphology and acquire characteristics used for feeding functions by the time of hatching (Abzhanov & Kaufman 1999). Interestingly, Ubx/Abd-A expression is never detected in T1 limbs, and morphological transformation coincides with accumulation of the Scr protein product, which suggests a causal relationship to both. One obvious hypothesis is that this dramatic example of macroevolutionary morphological change, the evolution of maxillipeds from locomotory limbs, was facilitated by specific changes in the regulation of otherwise highly conserved HOX genes such as Ubx, Abd-A, and Scr (Figure 2h).
HOW DOES IT WORK? FUNCTIONAL TESTS ON CANDIDATE GENES/PATHWAYS
When a morphological evolutionary change is found to correlate well with a particular modification in genetic circuitry and/or developmental programming, it is desirable to test the possible causative relevance with a functional experiment. The type of functional test used should depend on the biological question asked. For instance, regulatory alterations affecting specific stages of development should be performed at the relevant or earlier stages and should, ideally, directly target the gene(s) or pathway(s) under investigation. From a developmental genetics perspective, one should examine both the necessity and sufficiency of the developmental change to cause or facilitate the observed morphological variation. Here we give a brief overview of some of the key experimental procedures, from relatively simple to highly sophisticated, employed in several recent representative evo-devo case studies.
Simple physical manipulations of developing (embryonic or postembryonic) structures and tissues can be quite effective in revealing their normal fate and contribution, for example, experiments moving, removing, or ablating individual blastomeres or groups of blastomeres in early embryos combined with cell lineage analysis (Grbić et al. 1998). Embryos of the polyembryonic wasp C. floridanum, described in the previous section, develop clonally to produce large numbers of genetically identical offspring and two morphologically distinct castes: soldiers, with fighting mandibles and an elongate worm-like body, and reproductive individuals, with small mandibles and a more typical body shape. Up to a quarter of C. floridanum wasp embryos develop into soldier larvae, and the remaining embryos develop into reproductive larvae. Expression analysis of the C. floridanum homolog of the germ cell marker Vasa showed that the B4 (smallest) blastomere in four-cell-stage embryos, which develop into reproductive larvae, differentiates as a primordial germ cell (Donnell et al. 2004). Unlike the reproductive larvae, the soldier larvae do not have any cells expressing Vasa. When the B4 blastomere (but not B1–3 cells) was ablated with a highly precise Micropoint laser beam at the four-cell stage, all of the affected embryos developed into soldier caste larvae. This elegant experiment suggests that germ cells have an important and previously unrecognized role in sterile soldier caste formation in this unusual insect (Donnell et al. 2004).
The more advanced functional test techniques include applications of functional reagents, such as chemicals with antagonistic or agonistic properties, signaling peptides, chemokines, antibodies, morpholinos (chemically modified antisense oligomers that block mRNA function), small interfering RNAs (siRNAs) to induce gene-specific RNA interference, and small molecules. Reagents can be applied either to the entire embryo or with soaked organic beads that can be positioned directly adjacent to the developing target tissues for a more localized effect. Exactly this type of approach was used recently to probe the molecular mechanisms of left-right asymmetry in snails. Left-right asymmetry is found in many species of animals, such as vertebrates, in which it is regulated by signaling by Nodal, a member of the TGFβ superfamily that is expressed in the left lateral plate mesoderm (Hamada et al. 2002, Tabin 2006). The first nodal ortholog and its downstream target Pitx discovered outside of the deuterostomes were reported in snails (Mollusca). They subsequently became the main candidate regulators of the highly asymmetric snail body plan (Grande & Patel 2009). Both of these genes are expressed on the right side of the embryo in the dextral (right-handed) species Lottia gigantea (Lottiidae, Gastropoda) and on the left side in the sinistral (left-handed) species Biomphalaria glabrata (Planorbidae, Gastropoda). A chemical inhibitor, SB-431542, was used to investigate the function of Nodal signaling in snail development experimentally, as it specifically interferes with type I receptors Activin receptor-like kinase 4 (Alk4), Alk5, and Alk7, through which Nodal signals. Pharmacological inhibition of the Nodal pathway revealed that it acted upstream of Pitx (as in vertebrates/chordates), and many treated snail embryos developed straight tubular shells with no sign of the left- or right-handed coiling usually seen at later stages (Grande & Patel 2009). Thus, this functional experiment coupled with the concomitant analyses of nodal-Pitx expression domains and shell morphology in a molluskan embryo strongly suggests the involvement of the Nodal pathway in snail left–right asymmetry and that it might have been an ancestral feature of the Bilateria. An increasing number of recent evo-devo reports employ highly sophisticated molecular tools, such as plasmid-, transposon-, or virus-borne expression vectors, that allow for production of temporary or permanent transgenic individual cells, tissues, structures, and even whole embryos for functional analyses. Molecular vectors can facilitate both gain-of-function and loss-of-function experiments by delivering an appropriately modified molecular construct, such as modified versions of the target gene’s mRNA. Use of such tools often allows for more precise targeting and thus more accurate understanding of the developmental genetic mechanisms involved in morphological evolution. Some of the best examples of effective applications of modern molecular functional tools are found among the three case studies that here represent evolution at the micro-, meso-, and macroevolutionary levels.
Micro-Evo-Devo: Return of the Pelvic Fin in Three-Spined Sticklebacks
Fine-scale genetic mapping studies suggested that the three-spined stickleback, G. aculeatus, reduced its pelvic fin skeleton through regulatory mutations that deleted a small tissue-specific enhancer for pelvic expression in the noncoding region upstream of Pitx1 (Chan et al. 2010). To functionally determine whether regulatory regions of Pitx1 were responsible for generating the variation in pelvic structures, Chan and colleagues cloned subfragments of the Pitx1 intergenic region upstream of a basal promoter and an enhanced green fluorescent protein (EGFP) reporter (Figure 3a). A construct containing a 2.5-kb fragment from a marine, pelvic complete stickleback (SALR) drove expression of EGFP in the pelvic region of developing fish. Moreover, a smaller 501-bp subfragment also achieved the same effect. In sharp contrast, a 2.5-kb sequence from a freshwater stickleback (PAXB) did not drive EGFP expression in the pelvic region of the transgenic stickleback (Figure 3a). The authors reasoned that if changes in the Pitx1 regulatory region drove morphological changes, restoring pelvic expression of Pitx1 should rescue pelvic structures in the freshwater forms. The 2.5-kb region from a pelvic-complete population was combined with the Pitx1 minigene that was constructed from the coding exons of a pelvic reduced fish. The resulting construct was injected into fertilized eggs from a pelvic reduced fish, whose embryos normally fail to develop any pelvic spines and possess only a small vestigial remnant of the underlying pelvic girdle (Figure 3b) (Chan et al. 2010). Strikingly, the transgenic fry showed enhanced development of external pelvic spines when compared with control (uninjected) siblings, as revealed with Alizarin Red histological skeletal preparations (Figure 3b). A more careful analysis of the pelvic region revealed that adult transgenic fish developed prominent serrated spines articulating with an enlarged, complex pelvic girdle containing anterior, posterior, and ascending branch structures highly reminiscent of those in the marine forms (Chan et al. 2010). Therefore, these data provide direct functional evidence that a deletion disrupting a pelvic-specific enhancer regulatory element of the Pitx1 gene was a major determinant of pelvic evolutionary reduction in sticklebacks.
Figure 3.

Functional experiments allow researchers to validate hypotheses about mechanistic causes of morphological evolution. (a) To functionally test for regulatory functions in the Pitx1 intergenic region in three-spined sticklebacks (Gasterosteus aculeatus), several subfragments of Pitx1 were cloned upstream of a basal promoter and an enhanced green fluorescent protein (EGFP) reporter gene. A construct containing a 2.5-kb fragment from a marine, pelvic-complete stickleback (SALR) drove expression of EGFP in the developing pelvic region of transgenic sticklebacks. In contrast, a 2.5-kb sequence from a freshwater stickleback (PAXB) failed to drive EGFP expression. (b) The SALR region was placed upstream of a Pitx1 fragment originating from a pelvic reduced freshwater fish and injected into fertilized eggs of fish that do not develop pelvic spines. The transgenic individuals exhibited a marked development of external pelvic spines compared with uninjected siblings. a,b Reprinted by permission from Chan et al. (2010) © AAAS. (c) To test the effect of increasing Calmodulin (CaM)-dependent signaling in the developing beak, Abzhanov et al. (2006) cloned CA-CaMKII, a downstream effector of the CaM pathway, into the avian retroviral vector Avian Sarcoma Retrovirus (RCAS) and injected the construct into the developing beaks of chicken embryos. Reprinted by permission from Abzhanov et al. (2006) © Macmillan Publishers Ltd. (d) Embryos with activated CA-CaMKII had an increase in beak length, whereas beak depth and width were not affected. A probe against the RCAS virus revealed that the domain of infection resembles the expression of CaM in Geospiza (see Figure 2). In addition, probes against skeletal markers show that beak elongation occurs through an increase in the prenasal cartilage (labeled with ColII) at the expense of bone tissue (labeled with Runx2). (e) Small interfering RNA (siRNA) oligomers targeted against Ultrabithorax (Ubx) were injected into Parhyale embryos to downregulate the expression of this gene. Appendage identity is indicated by color: green for maxillipeds (T1), yellow for gnathopods (T2 and T3), and magenta for walking legs (T4–T8). In wild-type individuals, the first thoracic (T1) segment has one pair of maxillipeds (green), whereas the remaining thoracic appendages (T2–T8) lack these. In Ubx siRNA-injected animals, T1 appendages (green) are unaffected. However, their T2 appendages (light green) have additional branches (arrow) on the same limb segments as the maxillipeds, which demonstrates transformation of appendage identity. Reprinted by permission from Liubicich et al. (2009) © National Academy of Sciences. (f) Ubx misexpression in Parhyale results in various homeotic phenotypes (shown in cyan) such as antennal-to-T2/3 transformation; bilateral transformation of Mx2 to Mxp (Mxp/T1 appendages are shown in green for comparison); overgrowth of Mx2 and Mxp (dark and light cyan) and partial transformation toward thoracic legs compared with unaffected Mx2 (blue) and Mxp (green) on the contralateral side; and Mx2-to-leg, Mxp-to-leg, and T2/3-to-T4/5 transformations, compared with unaffected Mxp (green) and T2/3 (yellow) appendages on the contralateral side. Reprinted from Pavlopoulos et al. (2009) © National Academy of Sciences. Abbreviations: CA, constitutively active; Mx, maxillary appendages; Mxp, maxillipeds.
Meso-Evo-Devo: Growing Darwin’s Finch Beaks in Chick Embryos
Combined morphological and comparative developmental analyses on embryos of Geospiza Darwin’s finches with distinct beak shapes suggested that level and/or timing of expression of several regulatory genes have been altered (Abzhanov et al. 2004, 2006; Mallarino et al. 2011). Embryos of ground finches that as adults have significantly deeper, broader, and somewhat longer beaks as compared with the basal sharp-beaked finch G. difficilis show earlier and stronger expression of Bmp4 at early embryonic stages around the prenasal cartilage, the first beak skeletal element (Abzhanov et al. 2004). In later beak development, ground finch embryos upregulate expression of TGFβIIr, β-catenin, and Dkk3 in the developing premaxillary bone. To test whether such heterochronic and heterotopic changes in expression patterns were responsible for the observed morphological variation, functional assays were performed to mimic such changes. Vectors based on the replication-competent Avian Sarcoma Retrovirus (RCAS) that allow strong and stable tissue transgenesis were used on the chicken embryonic model system to upregulate or downregulate the relevant signaling pathways in developing chicken beaks (Figure 3c). Earlier and stronger misexpression of Bmp4 (as compared with normal chicken beak development) produced infected beaks that were on average approximately 2.5 times as wide and 1.5 times as deep as the uninfected control beaks (Abzhanov et al. 2004). The more massive Bmp4-infected beaks had a corresponding increase in the size of the skeletal core in a conspicuous parallel to the larger beak skeletons of the ground finches, especially the large ground finch. Likewise, upregulation of the CaM-dependent pathway in chicken embryos using a constitutively active version of CaM-dependent kinase II (RCAS::CA-CaMKII) led to a more than 12% beak elongation relative to control embryos, whereas the beak width and depth were not affected (Figure 3d) (Abzhanov et al. 2006). Finally, to mimic the broader and stronger expression patterns of TGFβIIr, β-catenin, and Dkk3 seen in the large and medium ground finches, infections were performed with each of a constitutively active version of the TGFβ type I receptor (RCAS::Alk5*), a dominant negative form of TGFβIIr (RCAS::TGFβrΔ), a construct driving expression of the stabilized version of β-catenin (RCAS::CA-β-catenin), and a construct carrying full-length Dkk3. All infections that upregulated the activities of the three candidate molecules led to a significant increase in both beak depth and length relative to the uninfected controls, whereas beak width remained relatively unchanged. Thus, these phenotypes were distinct from those caused by either RCAS:Bmp4 or RCAS::CA-CamKII (Mallarino et al. 2011). These experiments were important because they showed that both prenasal cartilage regulation and regulation of premaxillary bone are critical for explaining beak variation. Thus, a more comprehensive investigation of beak shapes in Darwin’s finches that included morphometric, comparative, and functional approaches revealed the two-tissue module program of beak development controlled by two independent regulatory networks and explained its potential to generate multidimensional variability.
Macro-Evo-Devo: How to Put a Foot in a Crustacean Mouth
Many members of Malacostraca transformed one or more pairs of their anterior trunk appendages, which were originally locomotory, into maxillipeds with feeding functions (Figure 1e) (Averof & Patel 1997). A remarkable correlation has been reported between the gene Ubx and the position and number of maxillipeds in crustaceans (Figure 1h). Both Ubx mRNA and protein expression were found throughout the locomotory legs, but no anterior expression boundary of the Hox expression was detected in the maxillipeds (Liubicich et al. 2009). Considering the function of HOX genes during development, it was hypothesized that shifting the HOX expression border produced significant morphological consequences. This potential mechanism for the evolution of crustacean appendage diversity was directly tested by altering the expression of Ubx in P. hawaiensis, a malacostracan that evolved a single pair of maxillipeds (Liubicich et al. 2009). More specifically, expression of Ubx was first removed from the developing walking legs, and then Ubx was misexpressed in the maxillipeds.
The potential role of Ubx in distinguishing between the maxillipeds and the thoracic walking legs in crustaceans was addressed by a functional experiment that relied on a strategy to knock down gene function (via reduction of translated product) during P. hawaiensis embryonic development using injection of siRNAs, a technique effective in several diverse animal taxa (Figure 3e) (Liubicich et al. 2009). Several chemically modified siRNA oligomers targeting nonconserved regions of Ubx in P. hawaiensis were used for injections into one-cell-stage–early embryos. These siRNA injections independently resulted in the transformation of T2 and T3 legs toward a T1-like maxilliped on the basis of multiple morphological criteria (Figure 3e). For example, only T1 appendages contain branches on the proximal limb segments, the basis and the ischium (these allow the T1 limbs to process food). In siRNAtreated animals, T2 and T3 appendages also develop with such branches on the basis and ischium. Moreover, the branches on transformed appendages have shapes and bristle patterns similar to those found on the maxillipeds (Figure 3e) (Liubicich et al. 2009). To complement these loss-of-function experiments with a reciprocal gain-of-function experiment, tools needed to be built for conditional misexpression of Ubx in embryos of P. hawaiensis. A 240-bp cis-regulatory element of the P. hawaiensis hsp70 gene was amplified from genomic DNA and cloned into the Minos plasmid to generate a heat-inducible transformation and expression vector (Pavlopoulos et al. 2009). Misexpression of ectopic Ubx in crustacean embryos upon heat shock resulted in homeotic transformations of anterior appendages toward more posterior thoracic fates, including maxilliped-to-leg transformations, thus proving the capacity of Ubx to control thoracic (locomotory) versus feeding identities (Figure 3f). Curiously, the second pair of the true mouthparts (maxilla 2) transformed into maxillipeds, which suggests that these auxiliary feeding appendages not only are specified in the absence of Ubx but also can develop in the presence of low/transient Ubx expression (Figure 3f) (Pavlopoulos et al. 2009). This result matched well with observations from other expression studies indicating that spatial and temporal modulation of Hox gene expression within a segment can generate appendages with intermediate morphologies (Averof & Patel 1997). Thus, a more gradual scenario of morphological evolution is favored in which stepwise changes in expression of Ubx (and presumably Scr) could generate the desired leg-to-mouthpart transformation via a variety of intermediate forms.
DISCUSSION: THE THREE INGREDIENTS OF EVO-DEVO
The recent explosion of studies that seek to discover developmental, genetic, and molecular mechanisms for morphological transitions and innovations have already produced several notable breakthroughs in our understanding of various evolutionary processes. These studies are extremely diverse, as they cover a wide variety of species from single-cell protozoans to complex metazoans such as arthropods and vertebrates. They focus on a broad set of morphological features, from cell-level to tissue-level to organismal-level characteristics, at vastly different phylogenetic scales, from examinations of changes that occurred at the levels of populations within a species and among closely related species to comparisons of distantly related lineages that diverged tens to hundreds of millions of years ago. Despite such an astonishing miscellany of projects, the same three common components are present in many of the most successful and productive evo-devo research programs: (a) morphometric analysis of a morphological change(s) that occurred during evolution, (b) comparative developmental and genetic approaches designed to identify the mechanisms promoting such morphological change(s), and (c) functional experiments aimed at showing the causative relationship between the observed morphological change(s) and the candidate developmental mechanism(s) (Figure 4). These common components are not presented here to suggest a chronological or hierarchical order. Often descriptive morphological observation precedes a comparative study at a more detailed level, and both of these often happen before functional experiments. However, once the new evo-devo model system becomes established, all three research components can progress simultaneously in a mutually beneficial way. For instance, functional results may call for a new round of more detailed comparative developmental analyses, which may, in turn, necessitate a more nuanced morphometric examination. Many of the major evodevo case studies (e.g., projects on sticklebacks, Darwin’s finches, malacostracan crustaceans) have followed such a trajectory.
Figure 4.

The tripartite structure of evolutionary developmental biology (evo-devo). (a) The first component is quantification of morphological variation using methods ranging from simply scoring the absence or presence of particular structures to 3D imaging and modeling. (b) The second component is identification of candidate genetic and developmental mechanisms using methods ranging from observations of the trait as it emerges in real time to quantitative trait locus (QTL) mapping to microarray and RNAseq screens. (c) The third component is functional assays of candidate causes to reveal the more causative relationships by methods ranging from physical manipulations to tissue and embryo transgenesis with molecular vectors.
All three of the major evo-devo research components benefit from continued improvements in methodology, techniques, and reagents. For example, morphometric measurements benefited tremendously from advances in 2D and 3D imaging and image processing technologies. Comparative methods gained from development of new detection reagents, such as cross-reacting antibodies, as well as from powerful screening tools, such as microarrays and RNAseq. Functional assays now employ a growing array of useful reagents that allow researchers to alter the functions of particular molecules and pathways.
Another important consideration when working out a strategy for a new or existing evo-devo project is to properly match all three components with the evolutionary question asked. The ultimate aim should not be to push every new nonmodel evo-devo species to the same degree of genetic and genomic detail. Rather, all three research components should be integrated to address the evolutionary question at hand at the right level and in the most meaningful way. For example, genetic mapping, as the study of the three-spined stickleback G. aculeatus demonstrates, can be informative about the exact mechanisms of morphological change because it seeks to identify relatively recent mutations and investigates their consequences at the population level. However, beyond the species level, such a quest for the exact causative mutational change(s) may be less insightful because of the developmental system drift that may occur at broader phylogenetic scales. Developmental systems drift theory suggests that even if the morphological trait, such as the shape of a particular skeletal structure, does not change over evolutionary time owing to stabilizing selective forces, the underlying molecular pathway specifying this trait can be altered without evolutionary penalty (Robinson 2011). Developmental system drift is detected as a degree of developmental dissimilarity between the two species in accomplishing the same morphological result (Wang & Sommer 2011). For instance, during embryogenesis in various species of Drosophila, the process of segmentation is established by the pair-rule even-skipped (eve) gene, which is expressed in seven transverse stripes that are required for the eventual 14 body segments (Ludwig & Kreitman 1995, Ludwig et al. 1998). However, the enhancer regulatory elements producing these otherwise highly conserved individual stripes of eve expression vary from species to species with regard to the composition and relative juxtaposition of transcription factor–binding sites within the enhancers (Ludwig et al. 2000). Many such regulatory DNA changes are believed to be complementary to or compensatory for the ongoing trans-regulatory changes outside of the enhancers. As a result, even when morphology does not change, the more distal developmental processes reshuffle constantly. Thus, finding and comparing connections between the original mutations and eventual morphology is likely to be even more complicated in species in which longer phylogenetic separation is combined with changes in morphology. This means that over greater phylogenetic distances, the more proximal mechanisms, e.g., the morphogenetic processes directly involved in controlling the shape and size of the skeletal element, are likely to be more informative about the morphological trait’s evolutionary history.
There is no doubt that evo-devo will continue to produce important new insights about the nature of morphological evolution. Its approaches will continue to draw strength from the overlapping interests and emerging principles of developmental genetics, evolutionary biology, molecular phylogenetics, morphometrics, and other disciplines. Evo-devo researchers will use increasingly more diverse and sophisticated methods to address evolutionary questions as this exciting synergistic endeavor expands in both scope and depth. We believe that understanding the fundamental structure of evo-devo research, some of which is outlined here, will facilitate fulfillment of the great promise Wilhelm Roux (1894, p. 40) made when he predicted more than a century ago that “in consequence of the intimate causal connections existing between the two, many of the conclusions drawn from the investigation of ontogeny will also throw light on phylogenetic processes.”
ACKNOWLEDGMENTS
We thank Cliff Tabin for his comments on the manuscript and Mike Shapiro and Nipam Patel for providing illustrations used in some of the figures. A.A. is supported in part by NIH 1R21DE021535-01.
Footnotes
DISCLOSURE STATEMENT
The authors are not aware of any affiliations, memberships, funding, or financial holdings that might be perceived as affecting the objectivity of this review.
LITERATURE CITED
- Abzhanov A, Kaufman TC. 1999. Novel regulation of the homeotic gene Scr associated with a crustacean leg-to-maxilliped appendage transformation. Development 126:1121–28 [DOI] [PubMed] [Google Scholar]
- Abzhanov A, Kaufman TC. 2000. Embryonic expression patterns of the Hox genes of the crayfish Procambarus clarkii (Crustacea, Decapoda). Evol. Dev 2:271–83 [DOI] [PubMed] [Google Scholar]
- Abzhanov A, Kuo WP, Hartmann C, Grant BR, Grant PR, Tabin CJ. 2006. The calmodulin pathway and evolution of elongated beak morphology in Darwin’s finches. Nature 442:563–67 [DOI] [PubMed] [Google Scholar]
- Abzhanov A, Protas M, Grant BR, Grant PR, Tabin CJ. 2004. Bmp4 and morphological variation of beaks in Darwin’s finches. Science 305:1462–65 [DOI] [PubMed] [Google Scholar]
- Alho JS, Leinonen T, Merilä J. 2011. Inheritance of vertebral numbers in the three-spined stickleback (Gasterosteus aculeatus). PLoS ONE 6:e195. [DOI] [PMC free article] [PubMed] [Google Scholar]
- Averof M, Patel NH. 1997. Crustacean appendage evolution associated with changes in Hox gene expression. Nature 388:682–86 [DOI] [PubMed] [Google Scholar]
- Bowman RI. 1961. Morphological Differentiation and Adaptation in the Galapagoś Finches, pp. 19–70. Berkeley:Univ. Calif. Press. 302 pp. [Google Scholar]
- Campàs O, Mallarino R, Herrel A, Abzhanov A, Brenner MP. 2010. Scaling and shear transformations capture beak shape variation in Darwin’s finches. Proc. Natl. Acad. Sci. USA 107:3356–60 [DOI] [PMC free article] [PubMed] [Google Scholar]
- Carroll SB, Weatherbee SD, Langeland JA. 1995. Homeotic genes and the regulation and evolution of insect wing number. Nature 375:58–61 [DOI] [PubMed] [Google Scholar]
- Chan YF, Marks ME, Jones FC, Villarreal G Jr, Shapiro MD, et al. 2010. Adaptive evolution of pelvic reduction in sticklebacks by recurrent deletion of a Pitx1 enhancer. Science 327:302–5 [DOI] [PMC free article] [PubMed] [Google Scholar]
- Damen WG. 2004. Arthropod segmentation: why centipedes are odd. Curr. Biol 14:R557–59 [DOI] [PubMed] [Google Scholar]
- Donnell DM, Corley LS, Chen G, Strand MR. 2004. Caste determination in a polyembryonic wasp involves inheritance of germ cells. Proc. Natl. Acad. Sci. USA 101:10095–100 [DOI] [PMC free article] [PubMed] [Google Scholar]
- Foster DJ, Podos J, Hendry AP. 2008. A geometric morphometric appraisal of beak shape in Darwin’s finches. J. Evol. Biol 21:263–75 [DOI] [PubMed] [Google Scholar]
- Gilbert SF, Epel D. 2009. Ecological Developmental Biology: Integrating Epigenetics, Medicine, and Evolution, pp. 269–95. Sunderland, MA: Sinauer. 480 pp. [Google Scholar]
- Grande C, Patel NH. 2009. Nodal signalling is involved in left-right asymmetry in snails. Nature 457:1007–11 [DOI] [PMC free article] [PubMed] [Google Scholar]
- Grant PR, Grant BR. 2008. How and Why Species Multiply: The Radiation of Darwin’s Finches, pp. 13–137. Princeton, NJ: Princeton Univ. Press. 218 pp. [Google Scholar]
- Grbić M, Nagy LM, Strand MR. 1998. Development of polyembryonic insects: a major departure from typical insect embryogenesis. Dev. Genes Evol 208:69–81 [DOI] [PubMed] [Google Scholar]
- Hamada H, Meno C, Watanabe D, Saijoh Y. 2002. Establishment of vertebrate left-right asymmetry. Nat. Rev. Genet 3:103–13 [DOI] [PubMed] [Google Scholar]
- Hoffstetter R, Gasc JP. 1969. Vertebrae and ribs of modern reptiles. In Biology of the Reptilia. Vol. 1: Morphology, ed. Gans C, pp. 201–310. London: Academic [Google Scholar]
- Kaliontzopoulou A, Carretero MA, Llorente GA. 2007. Multivariate and geometric morphometrics in the analysis of sexual dimorphism variation in Podarcis lizards. J. Morphol 268:152–65 [DOI] [PubMed] [Google Scholar]
- Lindell LE. 1994. The evolution of vertebral number and body size in snakes. Funct. Ecol 8:708–19 [Google Scholar]
- Liubicich DM, Serano JM, Pavlopoulos A, Kontarakis Z, Protas ME, et al. 2009. Knockdown of Parhyale Ultrabithorax recapitulates evolutionary changes in crustacean appendage morphology. Proc. Natl. Acad. Sci. USA 106:13892–96 [DOI] [PMC free article] [PubMed] [Google Scholar]
- Ludwig MZ, Bergman C, Patel NH, Kreitman M. 2000. Evidence for stabilizing selection in a eukaryotic enhancer element. Nature 403:564–67 [DOI] [PubMed] [Google Scholar]
- Ludwig MZ, Kreitman M. 1995. Evolutionary dynamics of the enhancer region of even-skipped in Drosophila. Mol. Biol. Evol 12:1002–11 [DOI] [PubMed] [Google Scholar]
- Ludwig MZ, Patel NH, Kreitman M. 1998. Functional analysis of eve stripe 2 enhancer evolution in Drosophila: rules governing conservation and change. Development 125:949–58 [DOI] [PubMed] [Google Scholar]
- Mallarino R, Grant PR, Grant BR, Herrel A, Kuo WP, Abzhanov A. 2011. Two developmental modules establish 3D beak-shape variation in Darwin’s finches. Proc. Natl. Acad. Sci. USA 108:4057–62 [DOI] [PMC free article] [PubMed] [Google Scholar]
- Martin JW, Davis GE. 2001. An Updated Classification of the Recent Crustacea Los Angeles, Calif.: Nat. Hist.Mus. Los Angeles Cty. 124 pp. [Google Scholar]
- McDowall RM. 2003. Variation in vertebral number in galaxiid fishes (Teleostei: Galaxiidae): a legacy of life history, latitude and length. Environ. Biol. Fishes 66:361–81 [Google Scholar]
- Minelli A, Bortoletto S. 1988. Myriapod metamerism and arthropod segmentation. Biol. J. Linn. Soc 33:323–43 [Google Scholar]
- Parra-Olea G, Wake DB. 2001. Extreme morphological and ecological homoplasy in tropical salamanders. Proc. Natl. Acad. Sci. USA 98:7888–91 [DOI] [PMC free article] [PubMed] [Google Scholar]
- Pavlopoulos A, Kontarakis Z, Liubicich DM, Serano JM, Akam M, et al. 2009. Probing the evolution of appendage specialization by Hox gene misexpression in an emerging model crustacean. Proc. Natl. Acad. Sci. USA 106:13897–902 [DOI] [PMC free article] [PubMed] [Google Scholar]
- Peel A 2004. The evolution of arthropod segmentation mechanisms. Dev. Biol 197:205–17 [DOI] [PubMed] [Google Scholar]
- Peichel CL, Nereng KS, Ohgi KA, Cole BL, Colosimo PF, et al. 2001. The genetic architecture of divergence between threespine stickleback species. Nature 414:901–5 [DOI] [PubMed] [Google Scholar]
- Prud’homme B, Minervino C, Hocine M, Cande JD, Aouane A, et al. 2011. Body plan innovation in treehoppers through the evolution of an extra wing-like appendage. Nature 473:83–86 [DOI] [PubMed] [Google Scholar]
- Reimchen RT, Nelson JS. 1987. Habitat and morphological correlates to vertebral number as shown in a teleost, Gasterosteus aculeatus. Copeia 4:868–74 [Google Scholar]
- Robinson R 2011. Different paths, same structure: “developmental systems drift” at work. PLoS Biol. 9:e1001113. [DOI] [PMC free article] [PubMed] [Google Scholar]
- Roux W 1894. Einleitung (Introduction). Archiv für Entwicklungsmechanik der Organismen 1:42. English translation reprinted in Maienschein JM, ed. 1986. Defining Biology Cambridge, MA: Harvard Univ. Press. pp. 107–148 [Google Scholar]
- Russell ES. 1916. Form and Function: A Contribution to the History of Animal Morphology, pp. 250–57. London: J. Murray. 383 pp. [Google Scholar]
- Shapiro MD, Marks ME, Peichel CL, Blackman BK, Nereng KS, et al. 2004. Genetic and developmental basis of evolutionary pelvic reduction in threespine sticklebacks. Nature 428:717–23 [DOI] [PubMed] [Google Scholar]
- Snodgrass RE. 1993. Principles of Insect Morphology, pp. 387–402. Ithaca: Cornell University Press. 667 pp. [Google Scholar]
- Song J, Reichert S, Kallai I, Gazit D, Wund M. 2010. Quantitative microstructural studies of the armor of the marine threespine stickleback (Gasterosteus acleatus). J. Struct. Biol 171:318–31 [DOI] [PubMed] [Google Scholar]
- Tabin CJ. 2006. The key to left-right asymmetry. Cell 127:27–32 [DOI] [PubMed] [Google Scholar]
- Tester AL, Hiatt RW. 1952. Variation in the Vertebral Number of the Anchovy (Stolephorus purpureus) in Hawaiian Waters Honolulu: Univ. Hawai’i Press [Google Scholar]
- Wang X, Sommer RJ. 2011. Antagonism of LIN-17/Frizzled and LIN-18/Ryk in nematode vulva nduction reveals evolutionary alterations in core developmental pathways. PLoS Biol 9:e1001110. [DOI] [PMC free article] [PubMed] [Google Scholar]
- Whiting MF, Bradler S, Maxwell T. 2003. Loss and recovery of wings in stick insects. Nature 421:264–67 [DOI] [PubMed] [Google Scholar]
- Whittington HB. 1997. Treatise on Invertebrate Paleontology Lawrence, KS: Geol. Soc. Am./Univ. Kans. [Google Scholar]