Abstract
Diffuse reverberation clutter often significantly degrades the visibility of abdominal structures. Reverberation clutter acts as a temporally stationary haze that originates from the multiple scattering within the subcutaneous layers and has a narrow spatial correlation length. We recently presented an adaptive beamforming technique, Lag-one Spatial Coherence Adaptive Normalization (LoSCAN), that can recover the contrast suppressed by incoherent noise. LoSCAN successfully suppressed reverberation clutter in numerous clinical examples. However, reverberation clutter is a three-dimensional phenomenon and can often exhibit a finite partial correlation between receive channels. Due to a strict noise-incoherence assumption, LoSCAN does not eliminate correlated reverberation clutter. This work presents a 2D matrix array-based LoSCAN method and evaluates matrix-LoSCAN based strategies to suppress partially correlated reverberation clutter. We validated the proposed matrix LoSCAN method using Field II simulations of a 64 × 64 symmetric 2D array. We show that a sub-aperture beamforming (SAB) method tuned to the direction of noise correlation is an effective method to enhance LoSCAN’s performance. We evaluated the efficacy of the proposed methods using fundamental and harmonic channel data acquired from the liver of two healthy volunteers using a 64 × 16 custom 2D array. Compared to azimuthal LoSCAN, the proposed approach increased the contrast by up to 5.5 dB and generalized contrast to noise ratio (gCNR) by up to 0.07. We also present analytic models to understand the impact of partially correlated reverberation clutter on LoSCAN images and explain the proposed methods’ mechanism of image quality improvement.
II. Introduction
Abdominal ultrasound images are often corrupted by a phenomenon known as clutter. Clutter is a temporally stable diffuse speckle-like texture that is most easily observed in hypoechoic targets such as blood vessels, amniotic fluid, bladder, and cysts [1, 2]. In numerous clinical scenarios, clutter reduces the visibility of diagnostically relevant targets, obscures target boundaries, and reduces confidence in measurements.
Clutter is generated by several mechanisms, including reverberation, phase aberration, and off-axis scattering [2, 3]. The reverberation of transmitted and reflected pulses within subcutaneous tissue layers is a dominant source of clutter in abdominal ultrasound [3, 4]. Reverberating pulses superimpose on the echo returning from deeper targets and act as temporally stationary and spatially incoherent additive noise. Although tissue-harmonic imaging and compression of fat layers reduce reverberation clutter, they are often inadequate, particularly in obese individuals. Ultrasound researchers have developed beamforming and signal processing techniques to reduce clutter. Minimum variance [5, 6], delay-multiply-and-sum (FDMAS) [7], generalized coherence factor [8], phase coherence imaging [9] are some beamforming approaches that seek to minimize off-axis clutter. These techniques were not explicitly designed to combat reverberation clutter and often suffer from dynamic range alteration [10] and artifacts [11]. Computationally-intensive model-based approaches were developed that remove off-axis and incoherent clutter [12, 13]. Ad-hoc techniques such as split-aperture correlation methods [14] and spatial frequency analysis [15] were studied to reduce reverberation clutter. More recently, machine learning models [16, 17] were applied to solve the reverberation clutter problem.
In the last several years, our group and others have utilized the spatial coherence of backscattered echo to analyze ultrasound signal quality. Spatial coherence, a metric of wavefront similarity, offers a unique space where the signals of interest and noise are well-separated. Initially developed for optical wavefields, the Van-Cittert Zernike (VCZ) theorem describes the spatial coherence of wavefronts originating from incoherent sources [18]. Mallart and Fink demonstrated that the spatial coherence of signals backscattered from a random target insonified by a focused beam is proportional to the auto-correlation of the transmitting aperture function and is only a function of the element-lag [19]. In the presence of reverberation clutter, the signal coherence substantially degrades within the first few lags [20]. This insight resulted in short-lag-spatial coherence (SLSC) imaging that displays the normalized integral of the spatial coherence curve over a short lag region as pixel brightness [21]. Although successful in numerous clinical scenarios [22–25], SLSC often fails to preserve backscatter gradients [22, 26] and speckle texture. To overcome these challenges, our group recently presented Lag-one Spatial Coherence Adaptive Normalization (LoSCAN), which directly weights the B-mode pixels to recover the contrast degraded by clutter while preserving backscatter variation and speckle texture [27]. In previous work, we established that the magnitude of incoherent clutter is accurately predicted by lag-one coherence (LOC), the nearest-element echo correlation [28]. LoSCAN estimates the amount of local contrast loss due to incoherent clutter using LOC measurements, thereby preserving the intrinsic backscatter contrast and speckle texture.
Diffuse reverberation clutter is generally modeled as incoherent in the aperture domain [16, 29]. There is, however, evidence that the clutter often remains partially correlated over a finite aperture distance. For example, using histologically derived abdominal models and non-linear full-wave simulations, Pinton et al. previously reported a diffraction-limited correlation length of 1.1 λ for pure reverberation clutter [20]. It is also well-known in general-acoustics that the spatial correlation of a perfectly diffuse field is a function of the wavelength [30]. Due to a strict noise incoherence assumption [28], LoSCAN remains insensitive to such correlated noise. Additionally, correlated clutter can also be expected along the elevational dimension. The existing LoSCAN model was not designed to remove such partially correlated multi-dimensional clutter.
The goal of this work is two-fold: to extend the LoSCAN framework to 2D matrix arrays and develop strategies to suppress partially correlated diffuse reverberation using matrix-array-based LoSCAN. We present a general expression of LoSCAN that recovers contrast using spatial correlation at an arbitrary lag of a 2D aperture and perform Field II [31] simulations of a 64 × 64 array to validate this formula. We explore the relative efficacy of two matrix-array-based strategies to suppress the partially correlated clutter. First, we evaluate the feasibility of estimating channel SNR, a critical step in LoSCAN, using an arbitrary lag higher than the noise correlation length. Second, we modify the effective element size through sub-aperture beamforming (SAB) to decrease the noise correlation. We experimentally demonstrate the effect of partially coherent clutter using in vivo acquisitions and evaluate the matrix LoSCAN approaches using simulations and experimental in vivo acquisitions using a 1024-element 2D array.
III. Methods
A. Theory
This section presents a matrix-array formulation of LoSCAN extending the prior work from our group [27]. In conventional delay-and-sum (DAS) beamforming, we display the magnitude of the beamsum envelope as image pixels. Spatially and temporally incoherent channel noise can reduce spatial contrast by increasing the beamsum magnitude in hypoechoic regions. LoSCAN seeks to estimate a pixel-wise weighting factor that compensates for this contrast loss and recovers the true backscatter contrast. This is accomplished by estimating the true signal power in the noise-corrupted beamsum signal. For an array with M elements, the beamsum signal power ΨS given by [27]
| (1) |
where SNRb is the beamsum SNR, ΨS+N is the power of the noisy beamsum signal. Since our goal is to display the true signal magnitude and ΨS+N is the square of the beamformer output, the square root of the SNR term on the right-hand side is our desired correction factor. Thus, our problem consists of estimating the beamsum SNR in each pixel.
Since the additive incoherent noise sources (spatial or temporal) originate in the channel domain, an estimation of beamsum SNR requires the channel signal SNR and the coherence properties of the echo signal itself. For fully coherent signals received by an M-element array, the beamsum SNR is M times that of channel SNR (for a power-based SNR definition). However, the backscatter echo signal is only partially coherent, resulting in a beamformer gain of less than M. For a 2D array with Mx-by-My elements, we can write the beamsum SNR as:
| (2) |
where Si1i2 and Ni1i2 are echo signal and incoherent noise, respectively, at an element with i1 azimuthal index and i2 elevational index. The noise terms are uncorrelated. Thus, by exchanging the order of expectation and summation, the above expression can be simplified to
| (3) |
Here, ψS and ψN are channel signal and channel noise powers, respectively and Mx and My are the number of elements along azimuth and elevation, respectively. RS (i1, i2; j1, j2) is the full spatial coherence matrix, describing the complex correlation between every possible element pair. It should be noted that RS, in this form, is different from the spatial coherence function predicted by the VCZ theorem, which is only a function of the lag of element pairs and not the individual elements. The factor ψS/ψN in the above expression is the channel SNR. Therefore, we can write
| (4) |
where the beamformer gain is given by:
| (5) |
Equation (4) shows that we need to estimate both the channel SNR and beamformer gain to estimate beamsum SNR. Both parameters can be estimated from the measured spatial coherence function. The spatial coherence of echo signals measured at two elements (i1, i2) and (j1, j2) of a matrix array is:
| (6) |
According to VCZ theorem, the spatial coherence of backscatter signals from random targets is only a function of receive element separation or lag [19]. We can therefore reduce the dimensions of the noisy coherence matrix and designate m and n as azimuthal and elavational lags, respectively, such that
Now, the noisy and noise-free coherence matrices can be expressed as functions of the lags:
| (7) |
Here, RS is the noise-free spatial coherence function. For a homogeneous speckle region with a rectangular transmit apertures, the expected coherence is a 2D triangular function [29]:
| (8) |
According to (7), channel SNR can be computed from the measured spatial coherence at any lag when the underlying speckle coherence is known a priori at that lag:
| (9) |
In previous work, Long et al. approximated the underlying speckle coherence between neighboring channels as unity [27, 28]. However, such approximation limited the use of spatial coherence to the first lag of a well-sampled array. In this work, we utilize the general expression of (9) along with the spatial coherence, RS+N(m, n), measured at an arbitrary lag (m,n). Since the noise-free coherence, RS(m, n), is unknown, we use the expected coherence of homogeneous speckle in (8).
Next, the dimensionality of the spatial coherence in (5) can be reduced to obtain an expression of beamformer gain (details shown in Appendix A):
| (10) |
The true speckle coherence RS in (10) can be replaced by a scaled version of measured coherence RS+N. Specifically, from (7) and (9), we obtain:
| (11) |
Separate lag indices were used to highlight that the true coherence RS and measured coherence RS+N at any arbitrary lag (m1, n1) are related through the scaling factor RS/RS+N derived from a fixed lag (m, n). We can obtain an estimate of beamformer gain as
| (12) |
where represents the three spatial coherence terms in (10) written with noisy spatial coherence RS+N with appropriate scaling using (11).
For large-channel count matrix arrays, full spatial coherence calculation is computationally intensive. We previously showed an alternative approach to estimate the beamformer gain using the coherence factor (CF) [27]. Here, we extend the strategy to 2D arrays. The coherence factor (CF) for a 2D array is given by [32]
| (13) |
which can be expressed as (details shown in Appendix B):
| (14) |
Comparing (10) and (14), we can re-write the CF expression as:
| (15) |
Comparing (12) and (15), we can obtain an estimate of G as:
| (16) |
We now have the two necessary parameters to estimate the beamsum SNR: channel SNR in (9) and beamformer gain in (16). The beamsum SNR is thus estimated as:
| (17) |
We can now use (1) and (17) to obtain an estimate of the beamsum signal power. Specifically, the SNR factor in (1) can be used to achieve an image correction factor that compensates for contrast loss due to incoherent clutter. This correction is given by:
| (18) |
This is our proposed matrix LoSCAN formulation. This expression is a function of the measured coherence at a fixed lag (m,n) and the coherence factor. This expression reduces to 1D LoSCAN formula [27] if we utilize a unity noise-free speckle coherence and perform scaling with azimuthal lag-one (m = 1, n = 0).
B. Normalization strategies
The matrix LoSCAN formula in (18) allows a general lag to compute the image weight. In this work, we have explored several approaches:
LoSCAN-x: This approach uses nearest element correlation along azimuthal direction (m = 1, n = 0). It is equivalent to the 1D array formulation. However, unlike 1D arrays, the elevation elements in 1.75D/2D arrays are not summed and all possible nearest azimuthal correlations are averaged (Fig. 1(a)).
LoSCAN-y: This approach uses nearest element correlation along elevation direction (m = 0, n = 1) (Fig. 1(b)).
Arbitrary Lag Spatial Coherence Adaptive Normalization (ALSCAN): This uses an arbitrary short lag (m, n) to compute the normalization weight (Fig. 1(c)). ALSCAN was evaluated for a number of a short lags listed in Table I.
SAB LoSCAN-x: We also studied a sub-aperture beamforming method where focused channel data were summed in non-overlapping rectangular blocks before coherence calculation. Table I lists the sub-aperture dimensions studied in this work. Each sub-aperture was assumed to represent a larger effective element. Correlation between azimuthally adjacent effective elements (m = 1, n = 0) was used in equation (18). A result of this operation is that data from longer lags are incorporated into the lag-one based correction. This method is termed SAB LoSCAN-x. For this method, the triangular speckle coherence model in (8) was downsampled at effective element positions and was used in (18) as an approximation of true coherence.
Fig. 1:
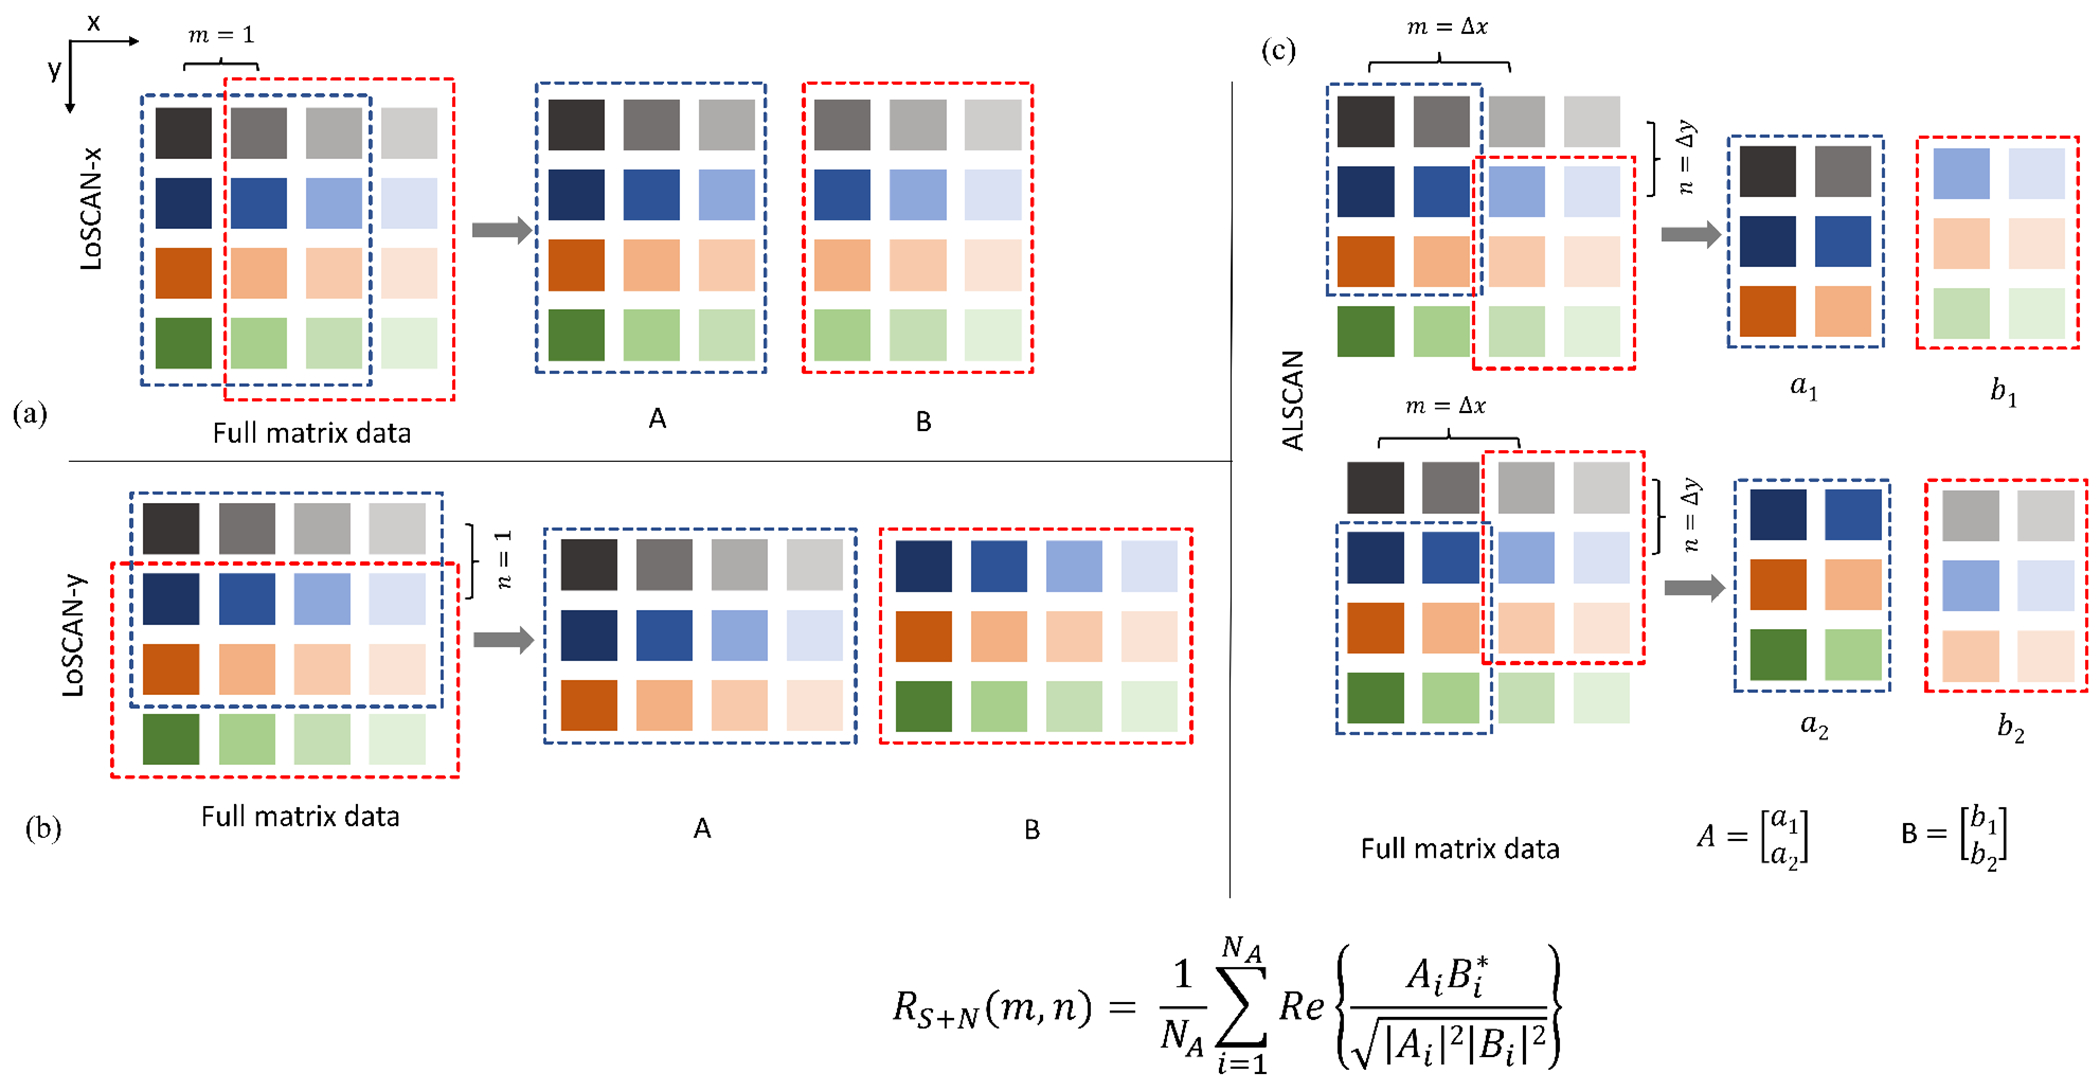
Three approaches to compute image normalization weight. (a) LoSCAN-x uses average signal correlation between all pairs of elements separated by a unity azimuthal lag whereas (b) LoSCAN-y uses all element pairs separated by a unity elevational lag. (c) ALSCAN is based on an arbitrary short lag that incorporates all element pairs separated by a lag (m,n).
TABLE I:
List of SAB configurations used with LoSCAN-x and lag configurations used with ALSCAN. Maximum lag or sub-aperture size along any dimension was restricted to 4. In experimental cases, maximum elevational lag or sub-aperture size was restricted to 2 due to limited aperture size.
| LoSCAN-x SABs | ALSCAN lags (m,n) | ||
|---|---|---|---|
|
| |||
| Simulation | Experiment | Simulation | Experiment |
|
| |||
| 1×1 (no SAB) | 1×1 | 1,0 (LoSCAN-x) | 1,0 |
| 2×1 | 2×1 | 0,1 (LoSCAN-y) | 0,1 |
| 4×1 | 4×1 | 2,0 | 2,0 |
| 1×2 | 1×2 | 0,2 | 0,2 |
| 1×4 | 2×2 | 1,1 | 1,1 |
| 2×2 | 4×2 | 2,2 | 2,2 |
| 4×4 | 3,3 | 4,2 | |
| 4,4 | |||
C. Field II Simulation
We used the Field II [31] to model a 64 × 64 array with a center frequency of 2.5 MHz and λ-pitch along both azimuth and elevation. Pulse-echo response was simulated for 50 azimuthal beams focused at 8 cm and arranged in a linear geometry. We simulated layer phantoms with layer boundary at x = 0 and spherical lesion phantoms of 1 cm diameter. Five different layers and lesions with intrinsic contrasts of −5dB, −10dB, −20dB, −30dB and −∞dB (anechoic) were simulated. Gaussian distributed random scatterers were simulated within a 40mm-by-40mm-by-20mm (x,y,z) volume with a density of 20 scatterers per resolution cell. After each transmit-receive event, the phantom was laterally translated by λ. For each phantom, we repeated the simulation with 5 unique realizations of random scatterers.
To mimic reverberation clutter observed in abdominal scans, we simulated two types of noise: spatially incoherent noise (ICN) and partially correlated noise (PCN) with a specified correlation length. We modeled an exponentially decaying noise spatial correlation [33, 34],
| (19) |
| (20) |
where τ is the full-width half-maximum (FWHM) of the correlation curve. The function C(m) was converted to a correlation matrix R, with defining the correlation of noise between x1 and x2 and elements. We generated a unity-variance gaussian random noise vector of X with M elements (ICN). Next, we performed a Cholesky factorization of R so that
| (21) |
and performed a weighted sum of X to obtain the desired M-channel PCN [33]:
| (22) |
For simplicity of analysis, partial noise correlation was applied only along the azimuth or elevation directions.
For both types of noise, we applied a bandpass filter centered at the transducer bandwidth, scaled the noise variance to mimic different channel signal-to-noise ratio (SNR) (−40 dB to +40 dB in steps of 5 dB) and then added the noise to the simulated channel data. The channel SNR was calculated relative to a homogeneous speckle region in focus.
D. Data acquisition
We acquired channel data using a custom matrix array (Vermon, Tours, France) with 1024 elements. The elements are organized in a flat 64 × 16 grid with a pitch of 0.65 mm and 1 mm along azimuth and elevation, with no transducer lens. The elements have a center frequency of 2.5 MHz with 60% fractional bandwidth. We used four externally synchronized Vantage-256 scanners (Verasonics, Inc., Kirkland, WA, USA) that enabled simultaneous access to all 1024 transmit/receive elements of this probe.
We used a phased-scan sequence for experimental acquisitions with focused beams along 60 radial lines within the central axial-azimuth plane. Each beam was spherically focused using all 1024 elements at an 8 cm radial distance from the transducer surface. The beams were transmitted at a 0.5 degree azimuthal angular spacing with the beam angle calculated from an apex located at 20mm behind the transducer [35]. At each location, we transmitted two sign-inverted pulses for pulse inversion (PI) harmonic imaging and two repeat pulses for temporal coherence measurements resulting in a total of 240 focused beams per frame. The transmit pulses were centered at 1.5 MHz to enable harmonic reception using a high gain portion of the bandwidth. The backscattered echo simultaneously captured by all 1024 elements was stored for offline post-processing. We performed trans-abdominal liver imaging in two healthy male volunteers, under the Institutional Review Board (IRB) protocols approved by the Duke University Medical Center.
E. Data processing
Channel data from individual transmit-receive events were focused using a dynamic receive beamformer without aperture growth. In vivo data were separated into fundamental and harmonic (PI summed) acquisitions followed by a bandpass filter with respective receive frequencies. Focused channel data were also summed within blocks of sub-apertures to yield various (Table I) sub-aperture beamforming configurations [29].
We computed spatial coherence using point-wise correlation of complex signals [36]. The coherence estimates were spatially averaged using a 5λ-by-5λ kernel for the linear scan simulations [27] and a 5λ-by-5 beams kernel for the in vivo phased scans. For in vivo data, we also estimated the temporal coherence by cross-correlating individual element signals from repeated transmits followed by averaging over spatial kernels and all elements.
F. Performance metrics
The contrast recovered by LoSCAN methods was measured using contrast ratio (CR) defined as
| (23) |
where μT and μB are the mean magnitude of uncompressed envelopes within the target and background, respectively.
For in vivo targets, we also evaluated generalized contrast-to-noise ratio (gCNR) [37]. The gCNR is immune to dynamic alterations [10] and provides a metric of lesion detectability defined based on the separability of histograms of two regions:
| (24) |
Here, pT (x) and pB (x) are the probability density functions of pixels inside the target and the background, respectively. For in vivo images, the target was drawn inside the gallbladder and the background was drawn in a homogeneous area of the liver.
IV. Results
Figure 2 shows the B-mode, LoSCAN-x, LoSCAN-y, and ALSCAN images of the simulated anechoic lesion and layer phantoms at 0dB channel SNR. The LoSCAN and ALSCAN images exhibit improved contrast compared to the B-mode images. Contrast improvement is visually more pronounced in layer phantom images than the lesion images. LoSCAN-x, LoSCAN-y, and ALSCAN images at different lags appear visually identical. Fig. 3 shows the contrast measured in (a) layer (b) and lesion phantoms of various intrinsic contrasts as a function of channel SNR. Due to the similarity among LoSCAN and ALSCAN methods at various lags, we only reported the LoSCAN-y measurements. B-mode and LoSCAN-y maintain intrinsic layer contrasts for −5 dB to −30 dB layers at high SNR levels. The −30 dB spherical lesion contrast was underestimated by 2.7 dB with both methods. For anechoic layers, both methods depicted a −48.5 dB contrast. With the increase in channel noise (lower SNR), both methods deviated from true contrast. However, LoSCAN offered an extra channel SNR margin before deviating from true contrast. For example, at the −30dB layer phantom, LoSCAN-y images exhibited 10% contrast degradation at an 11.6 dB lower channel SNR than B-mode. Contrast measured in anechoic phantoms using ALSCAN with various lags is reported in Fig. 3(c–d) at representative channel SNR levels. Variation in contrast measured with different lags was only noticeable in the layer phantom and at a high channel SNR level (20 dB). The maximum contrast difference among different lags was 1.1 dB.
Fig. 2:

B-mode, LoSCAN-x, LoSCAN-y and ALSCAN images of a simulated anechoic lesion (top row) and layer (bottom row) phantom. ALSCAN images were computed using various lags. Images correspond to a channel SNR of 0 dB (incoherent noise). Dotted regions were used in all quantitative analyses. Images are displayed with a 60-dB dynamic range.
Fig. 3:
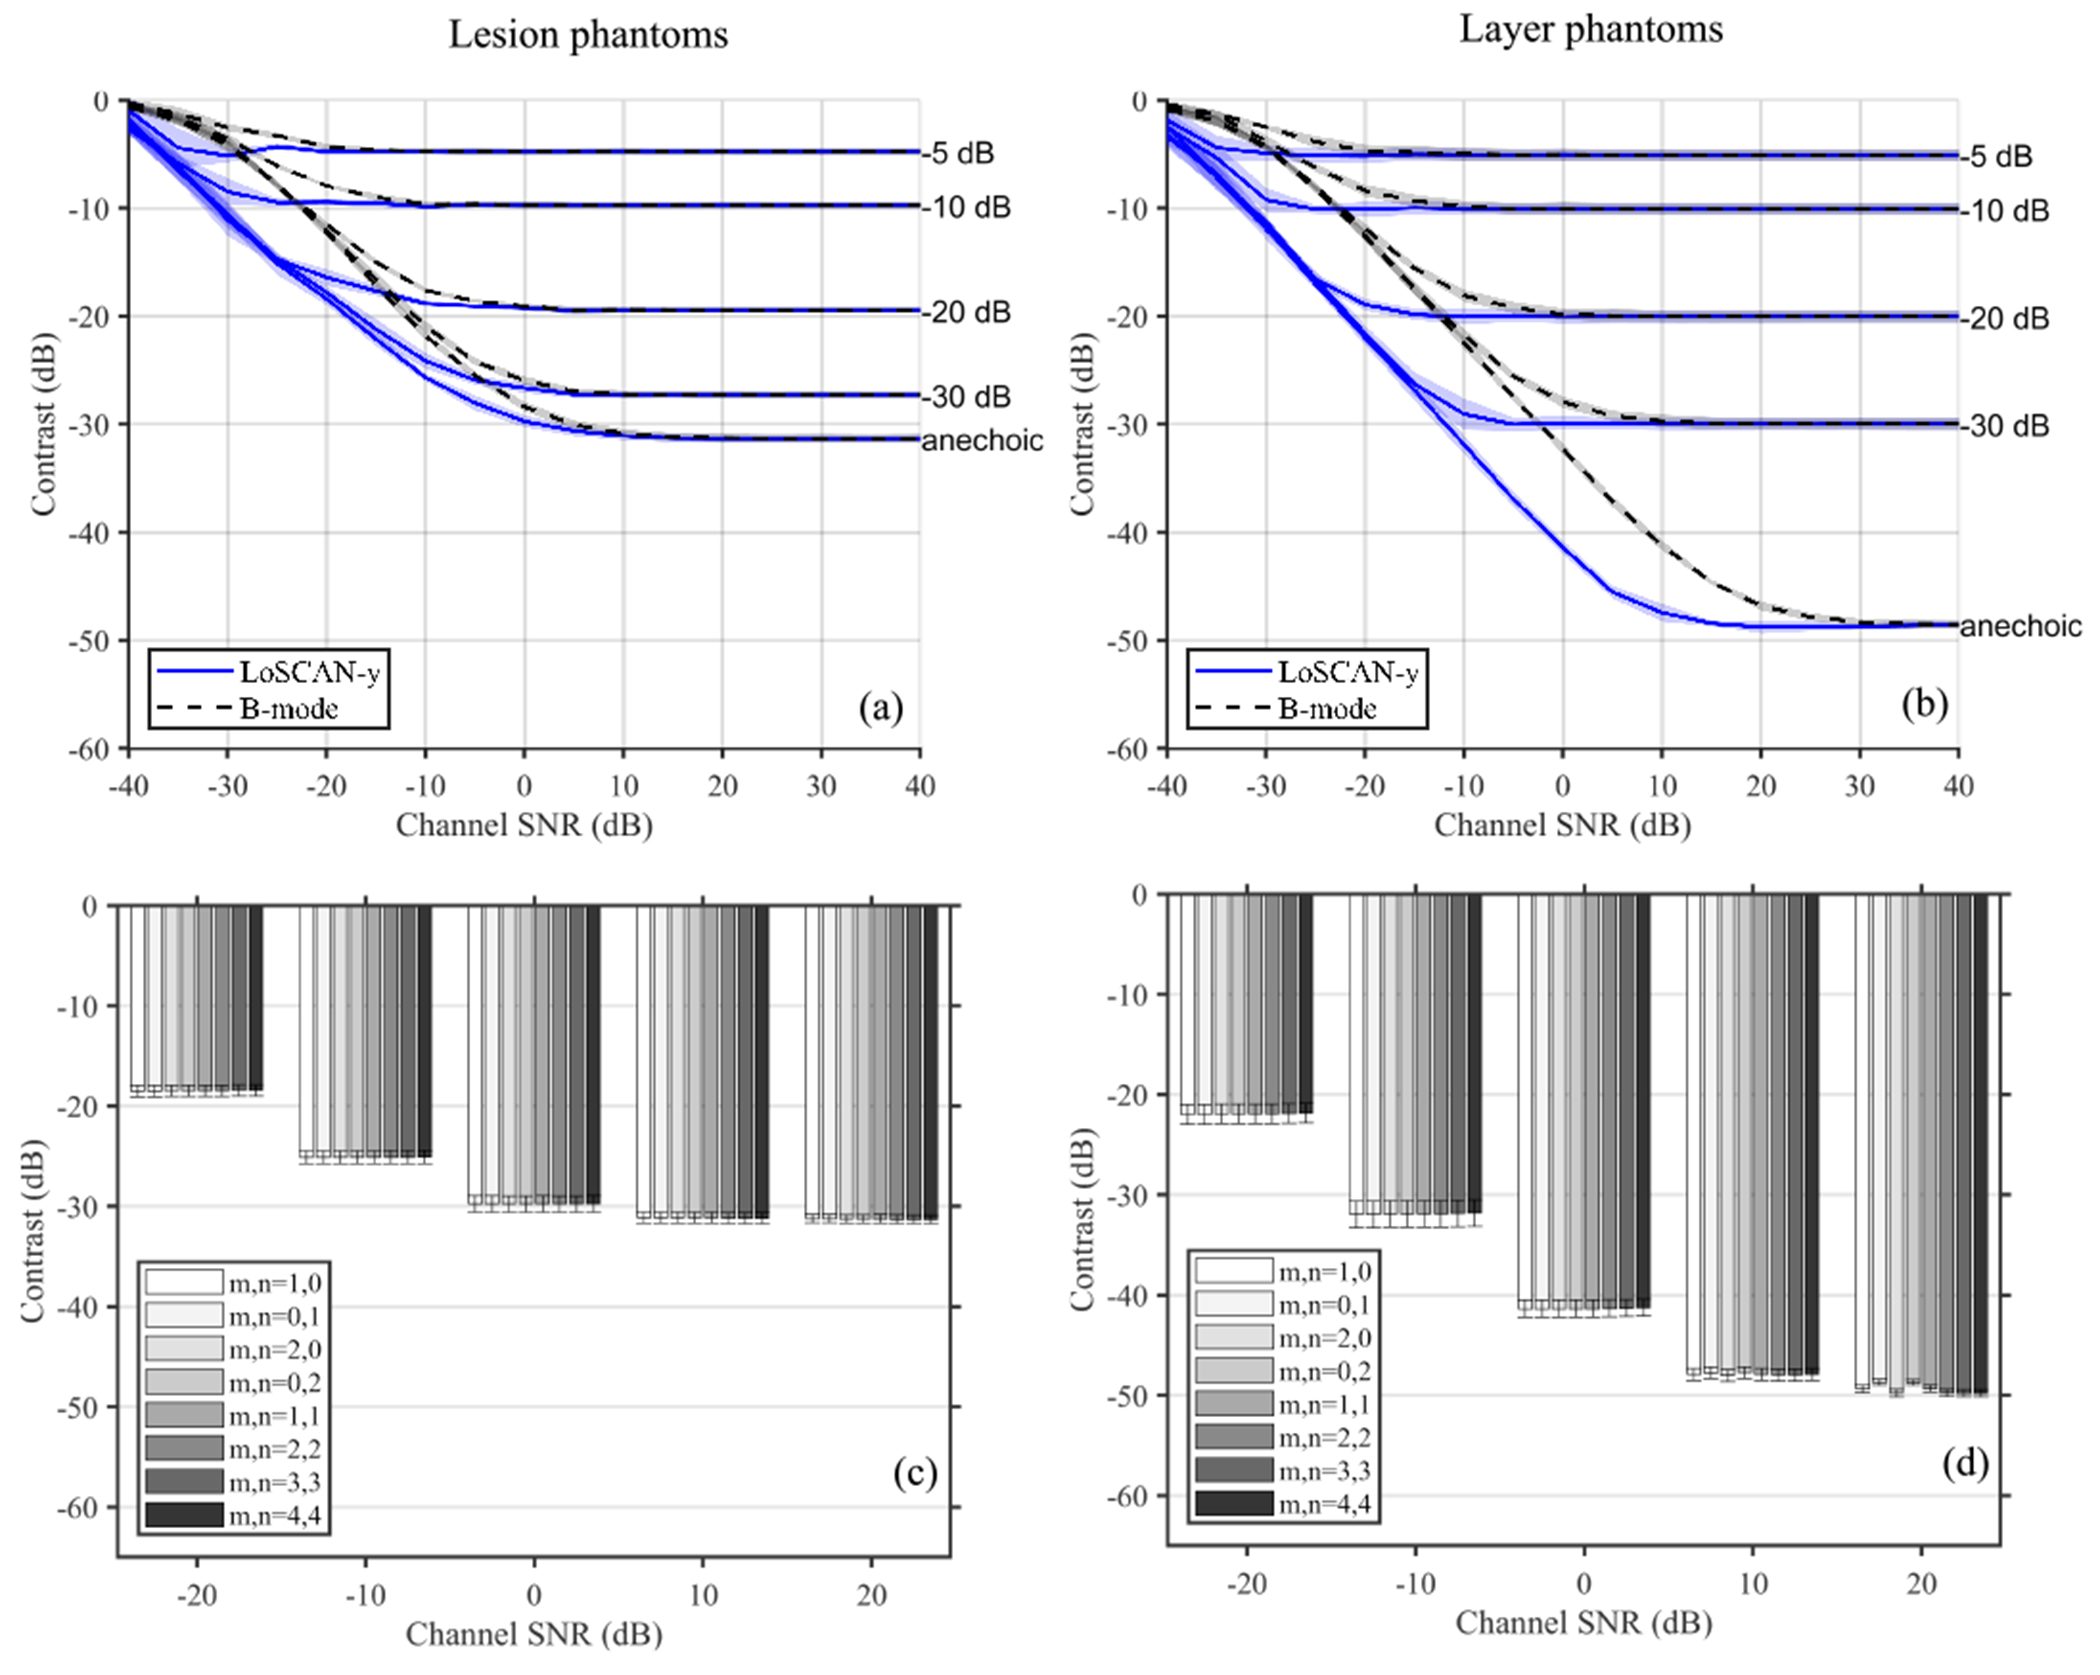
Contrast measured using LoSCAN-y and B-mode as a function of channel SNR (incoherent noise) for simulated targets with various intrinsic contrasts. Results are shown for (a) lesion and (b) layer targets. Contrast measured in anechoic (c) lesions and (d) layers using ALSCAN at selected channel SNR values. ALSCAN was performed using various lags (m,n). The ALSCAN cases with (m,n)=(1,0) and (0,1) are equivalent to LoSCAN-x and LoSCAN-y, respectively.
Figure 4(a) shows the modeled noise correlation (equation (19)) used in the following simulations. The impact of such additive PCN on the spatial coherence function is depicted in Fig. 4(b). Despite no increase in channel SNR, the lag-one coherence of echo from a homogeneous speckle target increased from 0.42 to 0.76 (Fig. 4(b)) when the noise correlation FWHM increased from 1λ to 3λ. The impact of additive PCN with short correlated length was concentrated within the first few samples of the overall coherence function. Figure 5 shows the impact of PCN on the contrast observed using B-mode and LoSCAN-x. For a fixed channel SNR, B-mode contrast decreased with increasing noise correlation length. However, the performance of LoSCAN deteriorated more dramatically than B-mode as a function of noise FWHM. The ability of LoSCAN to recover contrast became negligible when the noise FWHM was 2λ. For example, at 0dB channel SNR, the contrast recovered by LoSCAN-x was 7.2 dB and 1.4 dB at τ = 1λ and τ = 2λ, respectively.
Fig. 4:
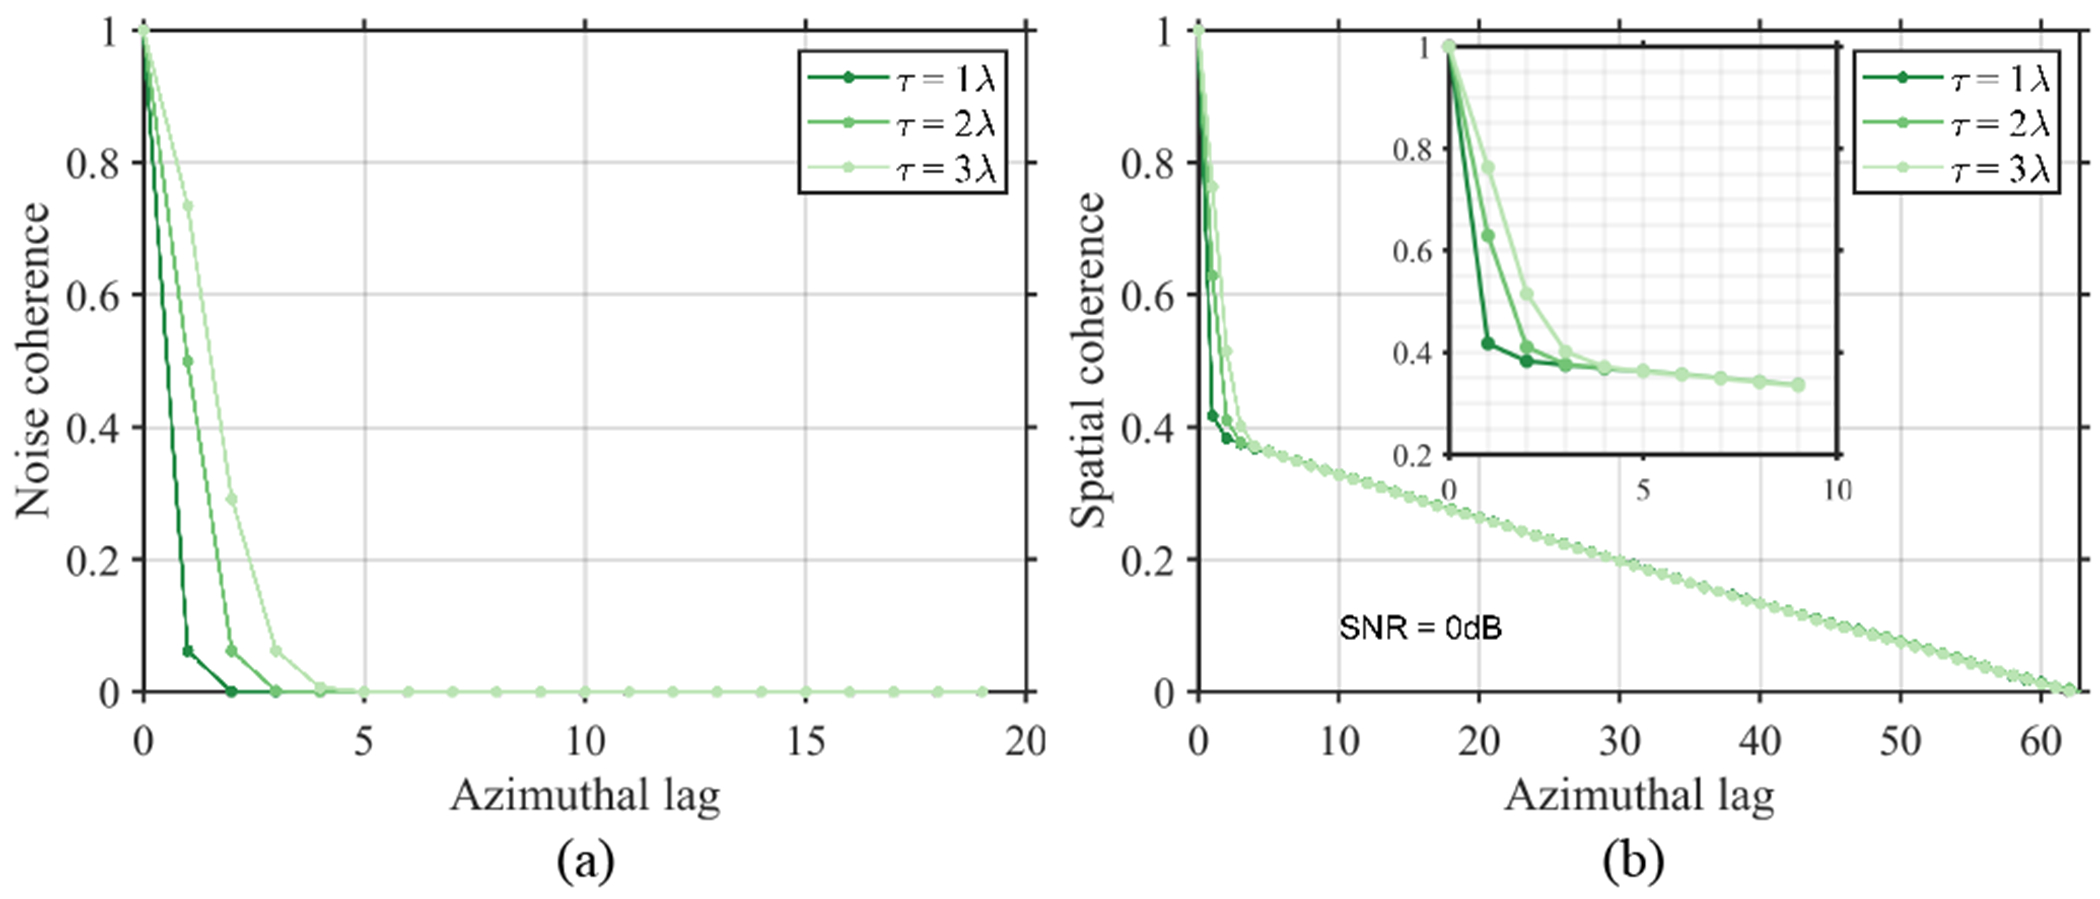
Spatial correlation of simulated PCN. (a) shows the modeled partial correlation using equation (19) for 1λ, 2λ and 3λ FWHM. (b) Measured spatial coherence of echo when the noise in (a) was added to a homogeneous speckle simulation data maintaining a 0dB channel SNR. Noise correlation was maintained only along the azimuth. Inset shows zoomed-in profiles at the short lag region.
Fig. 5:
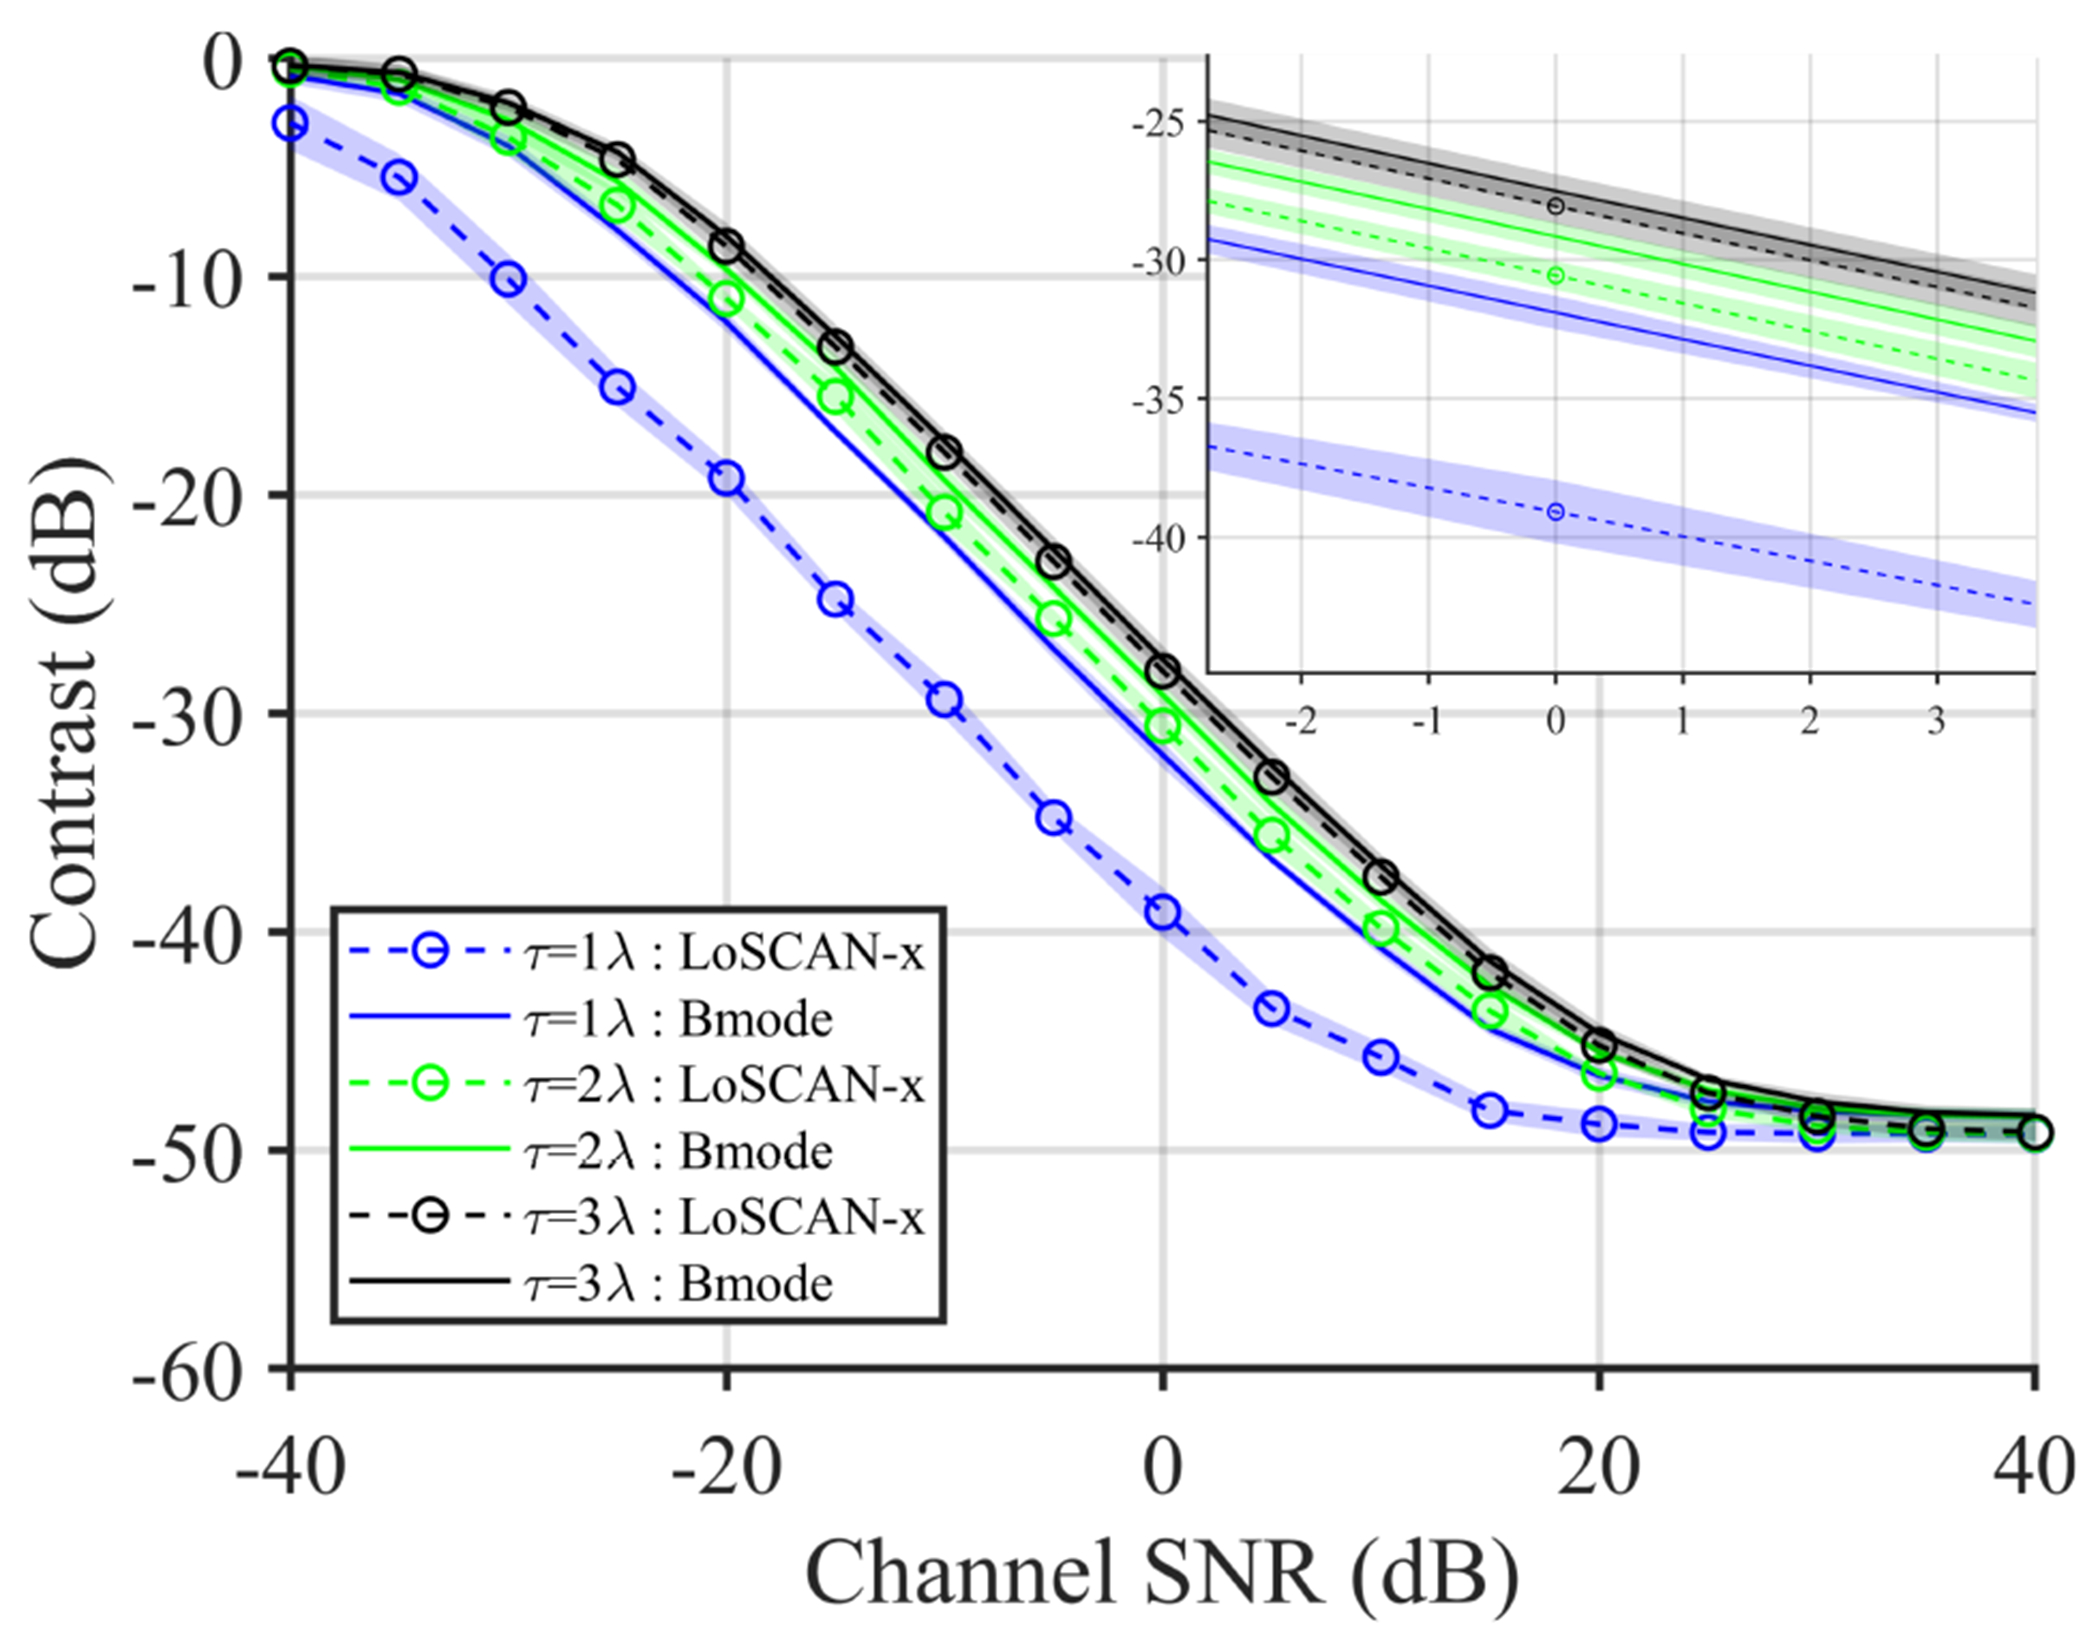
Impact of additive PCN on the contrast measured using B-mode and LoSCAN-x images. PCN was added to the simulated echo data of an anechoic layer maintaining various channel SNR and azimuthal noise correlation length (FWHM = 1 − 3λ). Inset shows zoomed-in profiles around 0dB.
Figure 6 shows the contrast in an anechoic layer phantom measured using SAB LoSCAN-x (a,b) and ALSCAN (c,d) in the presence of 0dB PCN. The noise was correlated either along the azimuth (a,c) or the elevation (b,d) dimension. At 2λ and 3λ noise FWHM, B-mode and LoSCAN-x produced similar contrast. Sub-aperture beamforming improved contrast compared to the no-SAB case when the sub-aperture blocks covered the direction of noise correlation. For example, in the case of azimuthal noise correlation, 4 × 1, 2 × 1, 4 × 4, and 2 × 2 SAB configurations produced higher contrast than 1 × 1 (no SAB), 1 × 2, and 1 × 4 configurations. On the other hand, with elevationally correlated noise, 1 × 4, 1 × 2, 4 × 4, and 2 × 2 SAB configurations produced higher contrast than 1 × 1, 2 × 1, and 4 × 1 configurations. At τ = 2λ, the maximum improvement in contrast over the no SAB case was 5.5 dB and 4.9 dB in (a) and (b), respectively. For ALSCAN, only marginal contrast gain (maximum 1.3 dB for τ = 2λ) was observed when using a lag other than (1,0) and (0,1) in (c) and (d), respectively.
Fig. 6:

Contrast measured in a simulated anechoic layer using SAB LoSCAN-x (a,b) and ALSCAN (c,d) in the presence of PCN. Noise correlation was along the azimuth in (a) and (c) and was along elevation in (b) and (d). Noise with FWHMs of 1λ, 2λ and 3λ was added to the channel data of a simulated anechoic layer maintaining 0dB channel SNR. LoSCAN-x measurements in (a),(b) are reported for various SAB configurations whereas the ALSCAN measurements in (c),(d) are reported for various lags.
Figure 7 shows the sensitivity of LoSCAN to various input parameters. The pixel-wise weight in LoSCAN (equation (18)) is a function of the spatial coherence at lag (m,n), the coherence factor (CF), and receive element count (M). The parameter M can be ignored when analyzing a fixed aperture configuration. However, to accommodate the interpretation of SAB results, the LoSCAN weight was parameterized by spatial coherence at (m,n) and CF.M (the product of CF and element count). This weight, expressed in the dB scale, directly reflects the expected contrast gain in a hypoechoic region. Figure 7(a) plots this weight as a function of CF.M and lag-one coherence (m, n = 1, 0). Regardless of the severity of channel noise level (LOC), the pixel weight remains relatively unaffected when the CF.M is overestimated. For example, if the CF.M estimate is 2, the difference in the weight produced by LOCs of 0.1 and 0.9 is only 2.4 dB.
Fig. 7:

Operational characteristics of LoSCAN. (a) shows the image normalization weight given by equation (18) as a function of CF.M and azimuthal LOC. (b)-(d) show the LoSCAN input parameters (LOC, CF and CF.M) measured in the anechoic region of a simulated layer phantom. The parameters were measured at 0dB channel SNR with ICN and azimuthal PCN with various FWHM. Measurements in (b)-(d) are reported for three SAB configurations and no-SAB (1 × 1).
The curves in Fig. 7(a) were used to explain the contrast recovery in the anechoic layer simulation. Figure 7(b) shows the LOC measured in the anechoic region. With ICN, the LOC values were significantly low (<0.1) and did not noticeably change with sub-aperture beamforming. The LOC increased as a function of noise FWHM, reflecting the correlation of the noise. SAB decreased the LOC estimates when the noise was partially correlated. For incoherent noise, the coherence factor (Fig. 7(c)) increased roughly as the factor of sub-aperture size. The CF also increased with noise correlation length. However, the difference in CF estimates between ICN and PCN decreased with sub-aperture beamforming. The impact of sub-aperture beamforming and correlated noise on CF.M is depicted in Fig. 7(d). For incoherent noise, the CF.M parameter was approximately 1. Consequently, the LoSCAN output was highly sensitive to channel SNR estimate (Fig. 7(a)). However, when the noise correlation increased to 2λ, the CF.M estimates increased above 2 and pushed the operating point of LoSCAN to the region where channel SNR has a relatively low impact on the overall pixel-weight. Larger SAB configurations produced CF.M values closer to those of ICN, which moved the LoSCAN’s operating points to the left in Fig. 7(a). With a corresponding low LOC estimate, SAB, therefore, produced improved contrast in PCN-corrupted images.
Fig. 8 shows the spatial coherence measured inside the gallbladder and liver of two healthy volunteers using a 64 × 16 elements transducer. In both subjects, the mean echo coherence inside gallbladder is less than 0.1 except at the first lag along the azimuthal dimension. This subtle partial coherence was not observed along the more coarsely sampled elevation dimension. Harmonic echos exhibited lower coherence at lag-one. However, the temporal coherence was also lower at the harmonic receive frequency. Azimuthal coherence measured inside the liver in fundamental mode exhibited a sharp drop in the vicinity of lag-one. For example, in subject 1, the difference between lag-one and lag-two azimuthal coherence was 0.28, while the maximum difference between lag-two and lag-ten azimuthal coherence was 0.09.
Fig. 8:
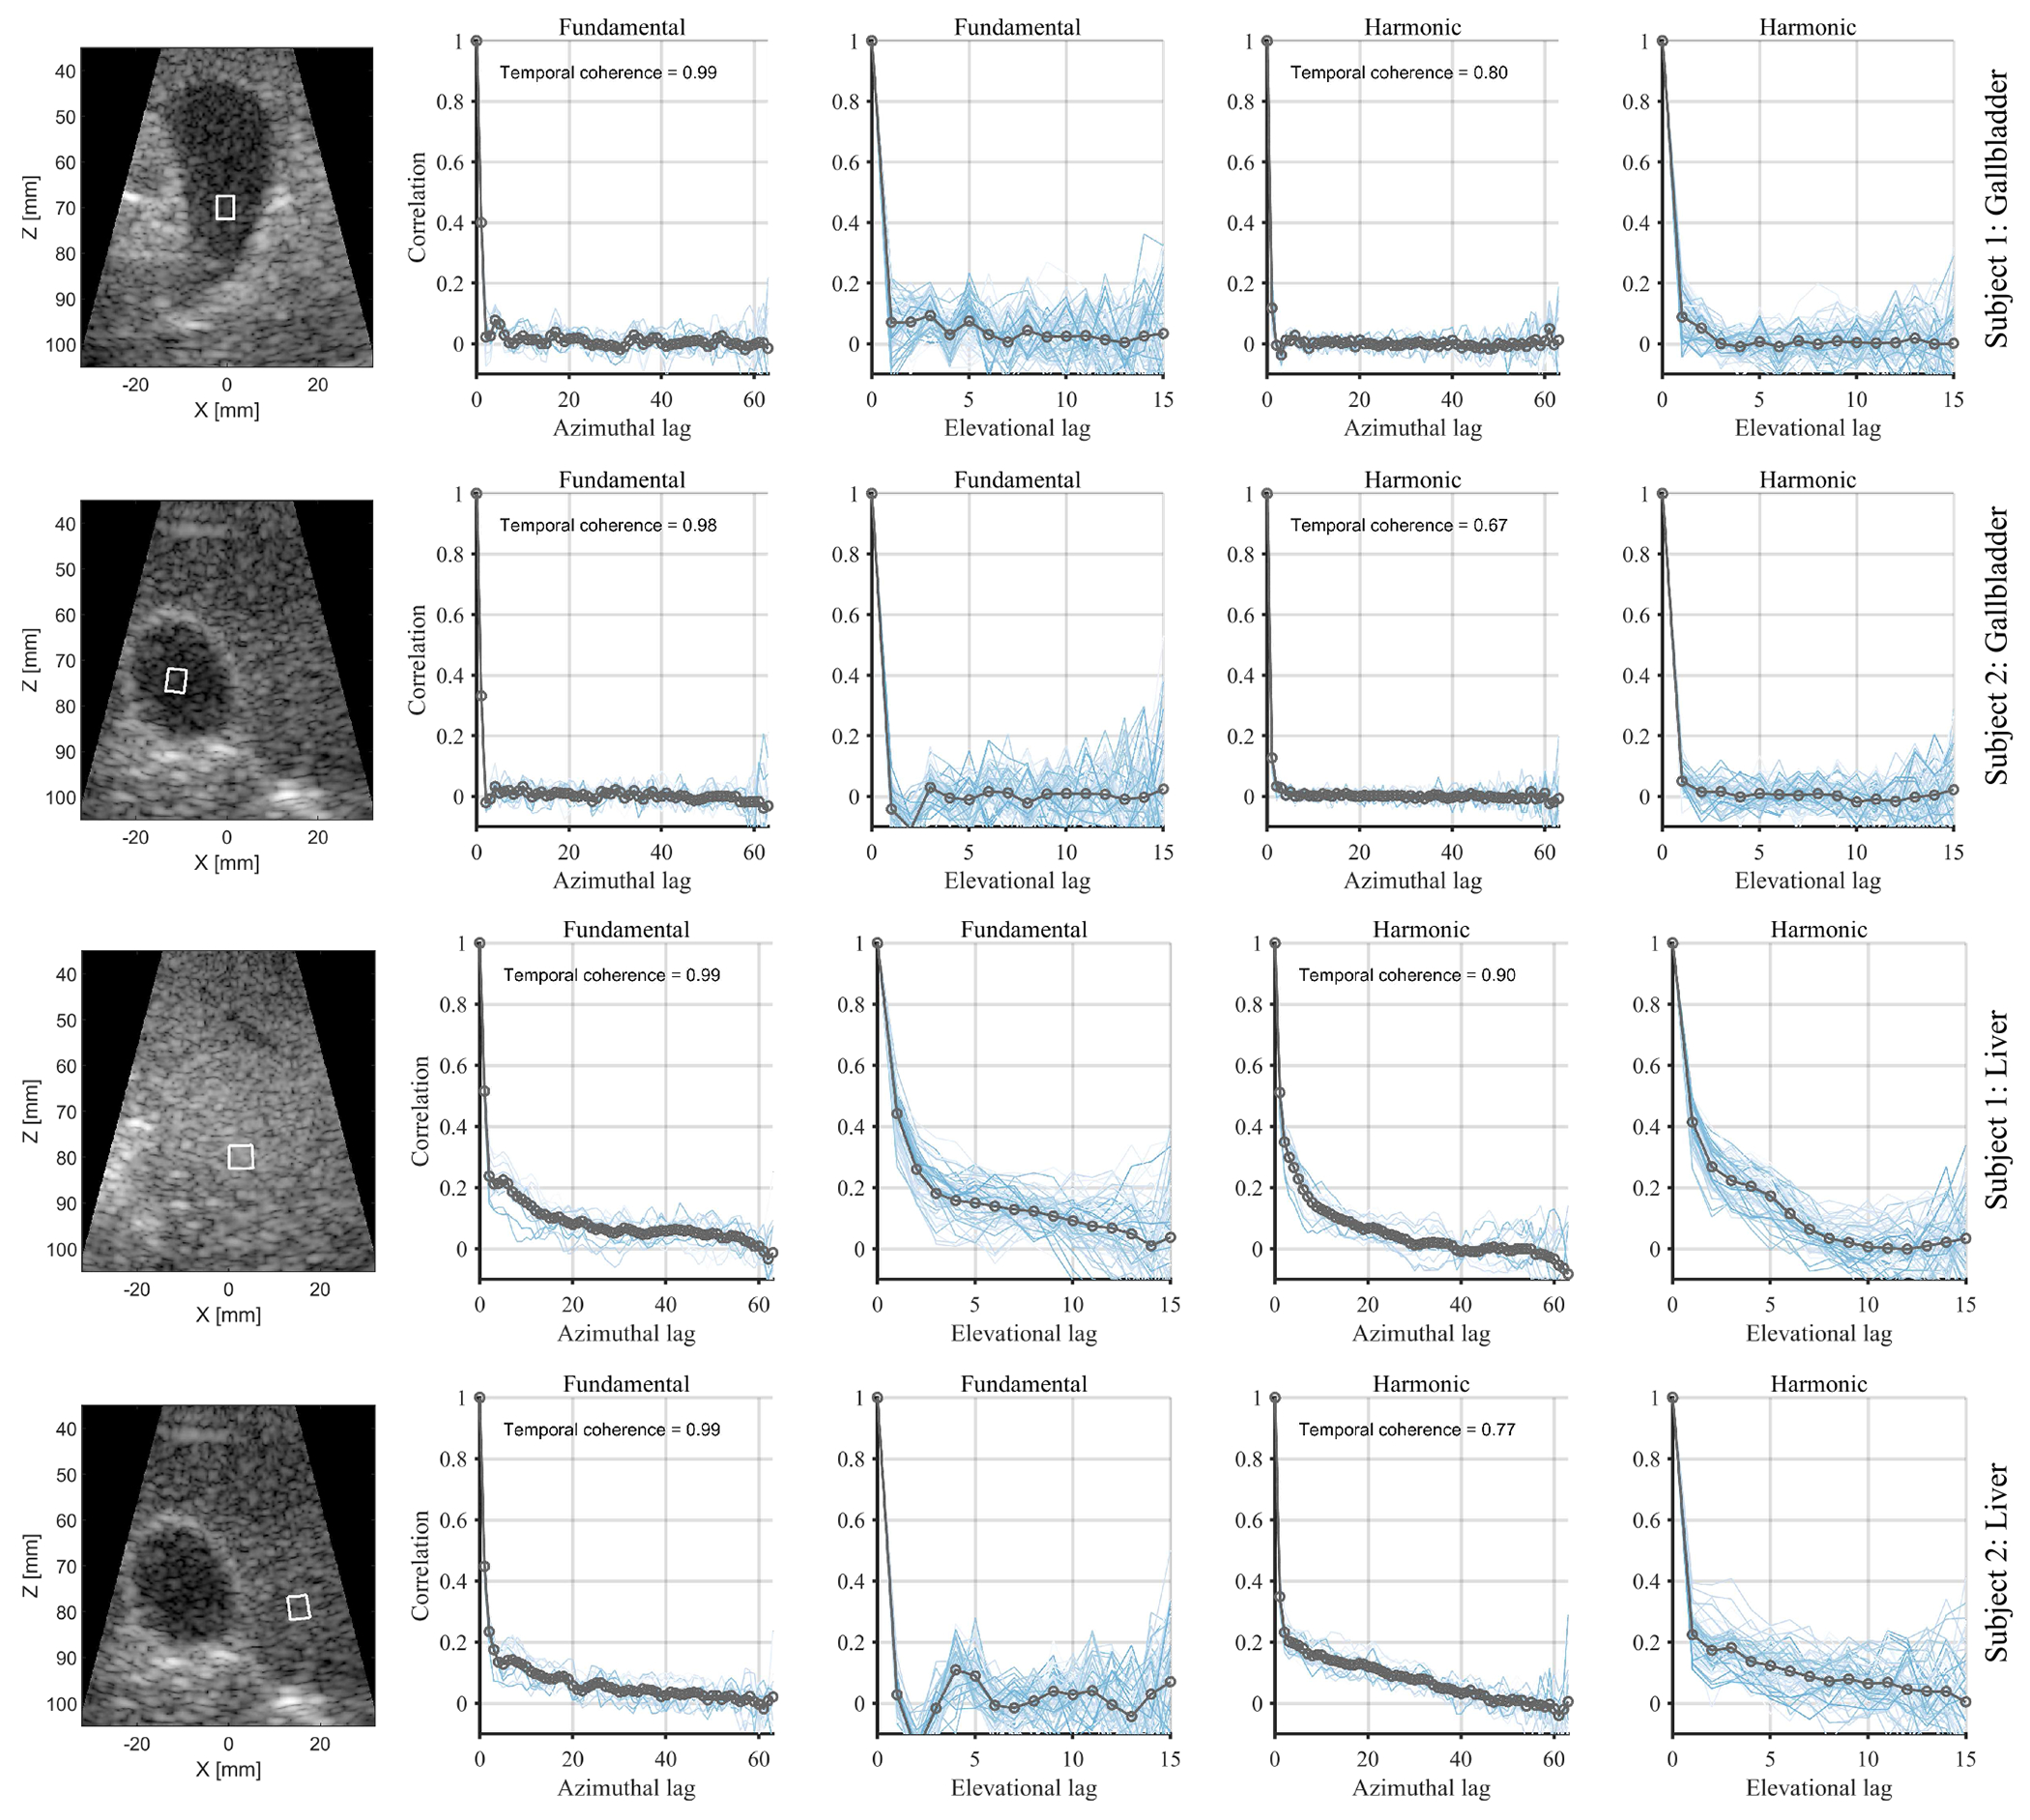
In vivo spatial coherence measurements inside the gallbladder and liver of two volunteers. The measurement kernels are shown in the B-mode images (left column) and had equivalent dimensions to those used in the LoSCAN and ALSCAN image formation. Fundamental and harmonic spatial coherence curves are displayed in columns 2-3 and columns 4-5, respectively. The blue lines in the coherence plots correspond to measurements along individual rows or columns of the 2D array, and the gray line is the mean coherence. Measurement kernels inside livers (rows 3-4) were placed at the focal depth. Both measurements in subject 2 (rows 2, 4) were performed within the same cross-section, while in subject 1, we measured liver coherence (row 3) at a different cross-section than the gallbladder (row 1) due to the absence of a large homogeneous area.
In vivo B-mode, LoSCAN and ALSCAN images are shown in Fig. 9. LoSCAN-y and ALSCAN method using the (4,2) lag improved the contrast of gallbladder compared to B-mode and LoSCAN-x. However, the contrast was most noticeably improved by LoSCAN-x with a 4 × 2 SAB. SAB configuration along the elevation dimension (1 × 2) did not visibly improve the clutter than the no SAB case.
Fig. 9:
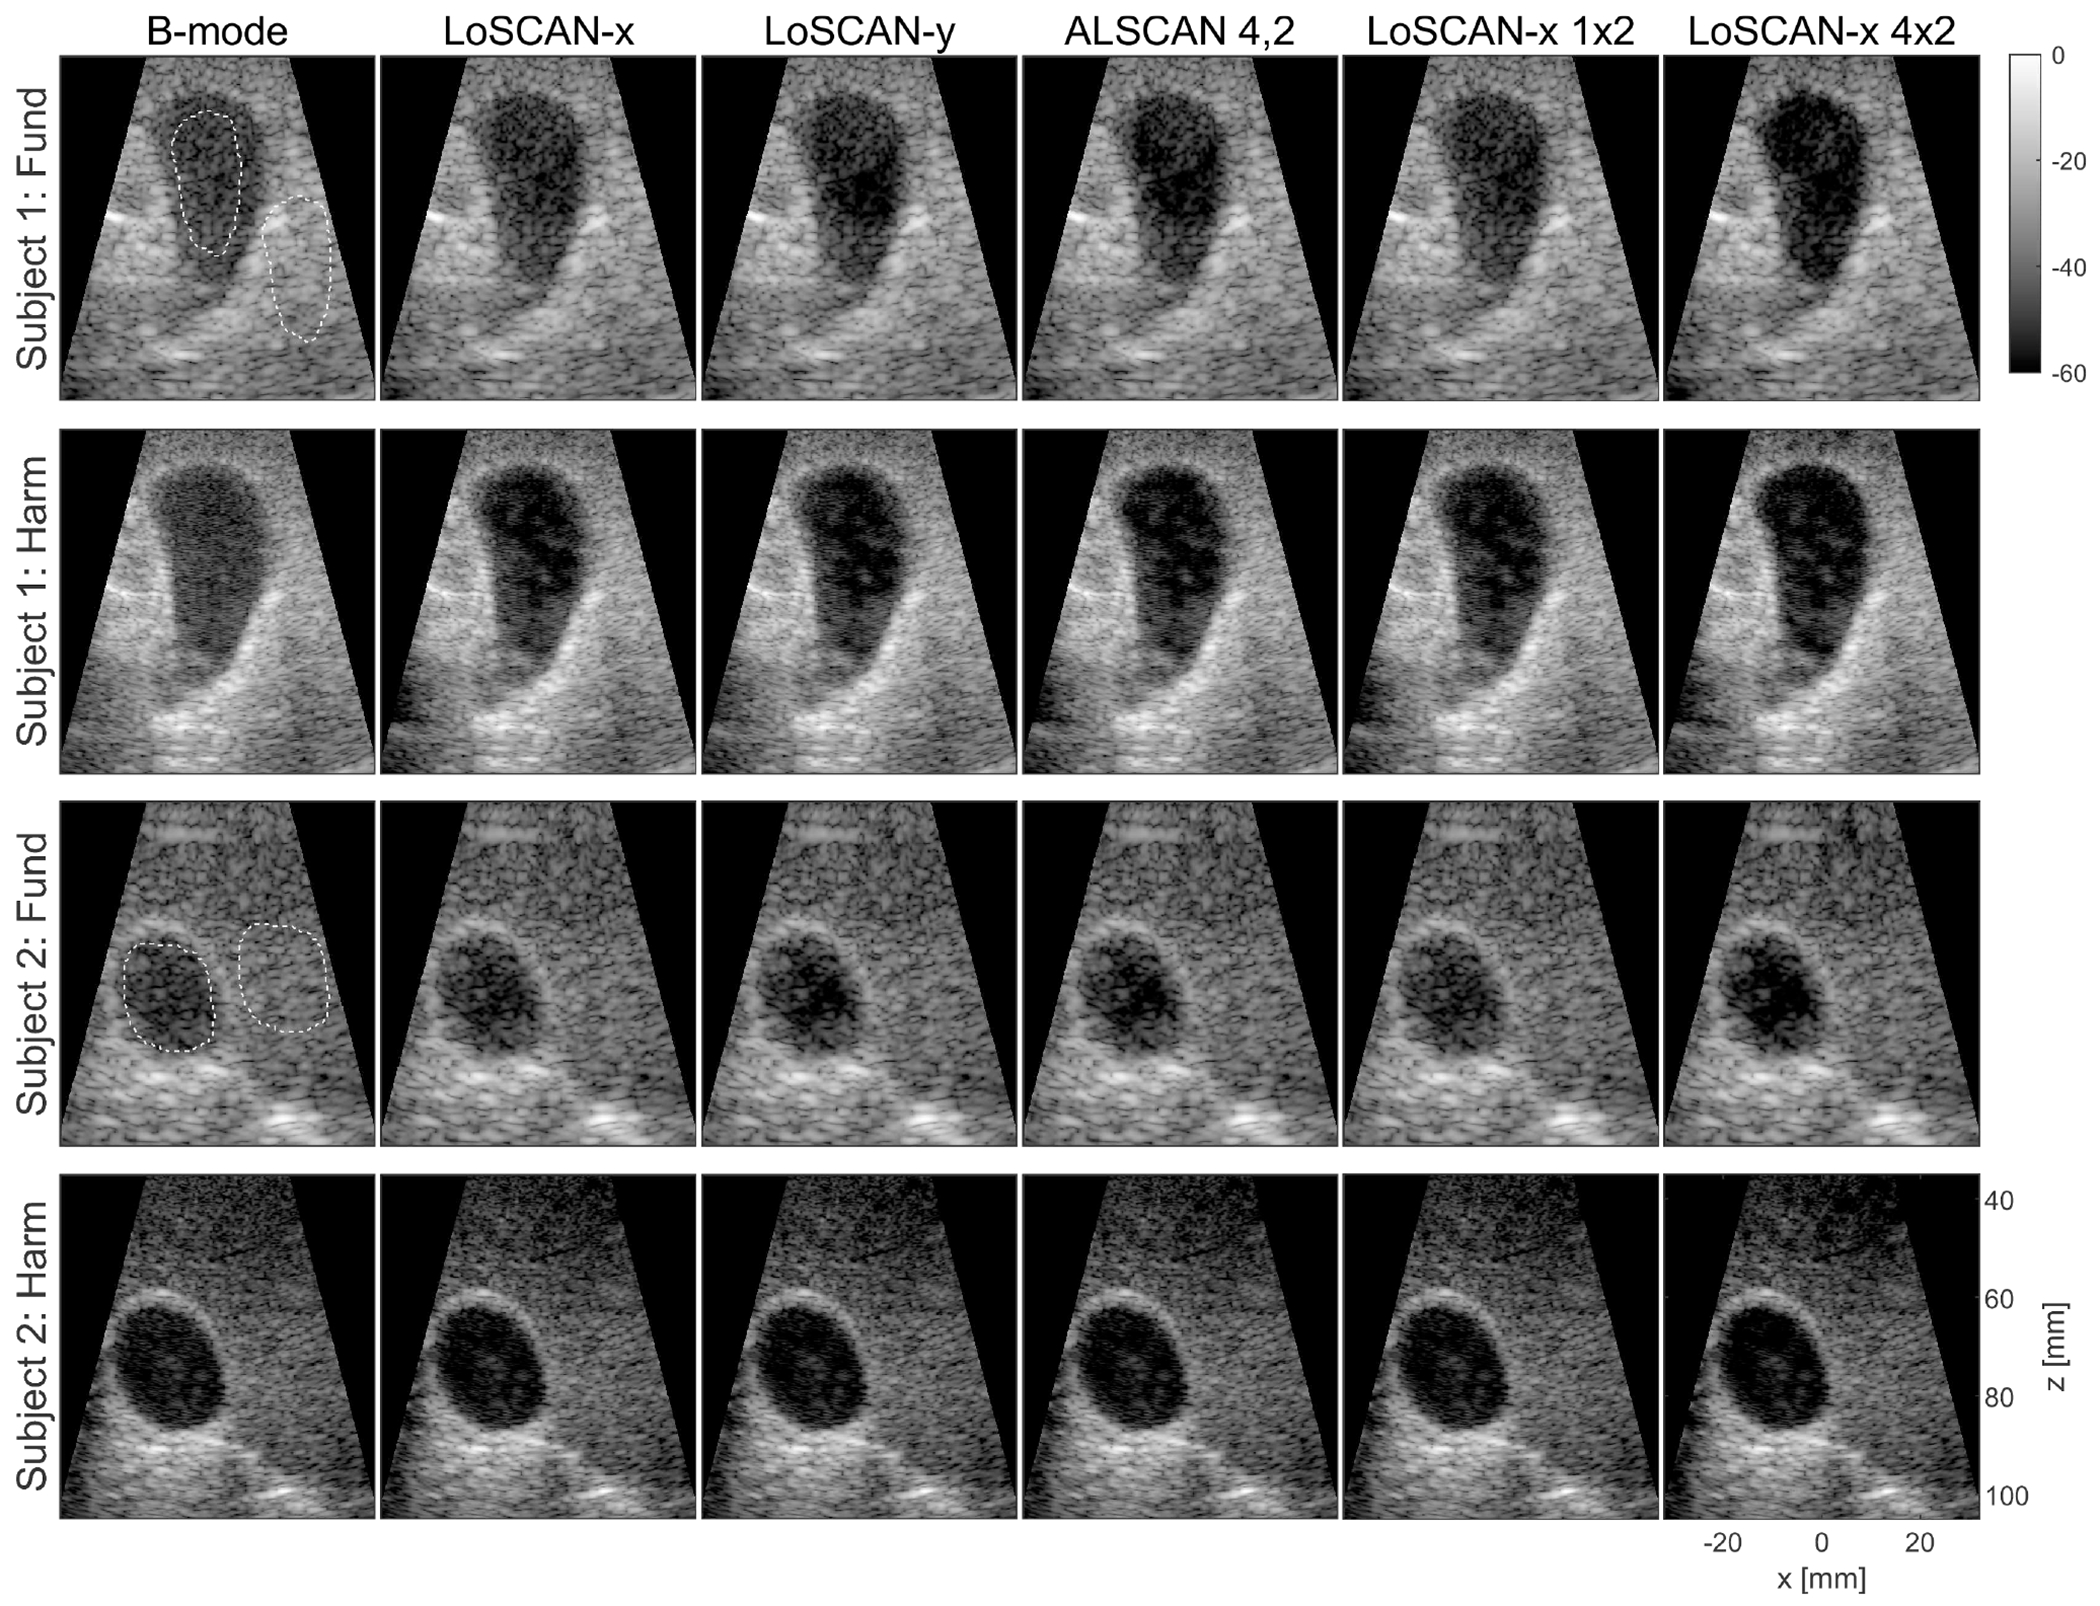
Fundamental and Harmonic B-mode, LoSCAN and ALSCAN images of the gallbladder in two volunteers obtained using a 64 × 16 matrix array. LoSCAN-x with two selected SAB configurations is displayed in columns 5-6. Dotted regions were used for computing image statistics. Images are displayed with a 60-dB dynamic range.
Contrast and gCNR measured from the in vivo acquisitions are shown in Fig. 10. In most acquisitions, LoSCAN-y produced marginally higher contrast and gCNR than LoSCAN-x. LoSCAN-y and the ALSCAN methods produced similar gCNR and contrast. SAB configurations that spanned along the azimuthal dimension resulted in higher contrast and gCNR in LoSCAN-x than the ALSCAN methods. SAB configuration that spanned only along the elevational direction performed poorly. Maximum contrast gain by the SAB LoSCAN-x over LoSCAN-x was 5.5 dB (subject 1) and 2.5 dB (subject 2) in fundamental mode and was 1.8 dB (subject 1) and 1.5 dB (subject 2) in harmonic mode. The maximum gCNR gain by the SAB methods over LoSCAN-x was 0.03 (subject 1) and 0.07 (subject 2) in fundamental mode and was 0.02 (subject 1) and 0.02 (subject 2) in the harmonic mode. When directly compared to B-mode, SAB LoSCAN-x offered a maximum contrast gain of 8.2 and 3.5dB in fundamental mode and 7.0 and 2.7 dB with harmonic in two subjects. The maximum gCNR gain compared to B-mode was 0.05 and 0.09 in fundamental mode and 0.06 and 0.03 with harmonic mode in two subjects.
Fig. 10:
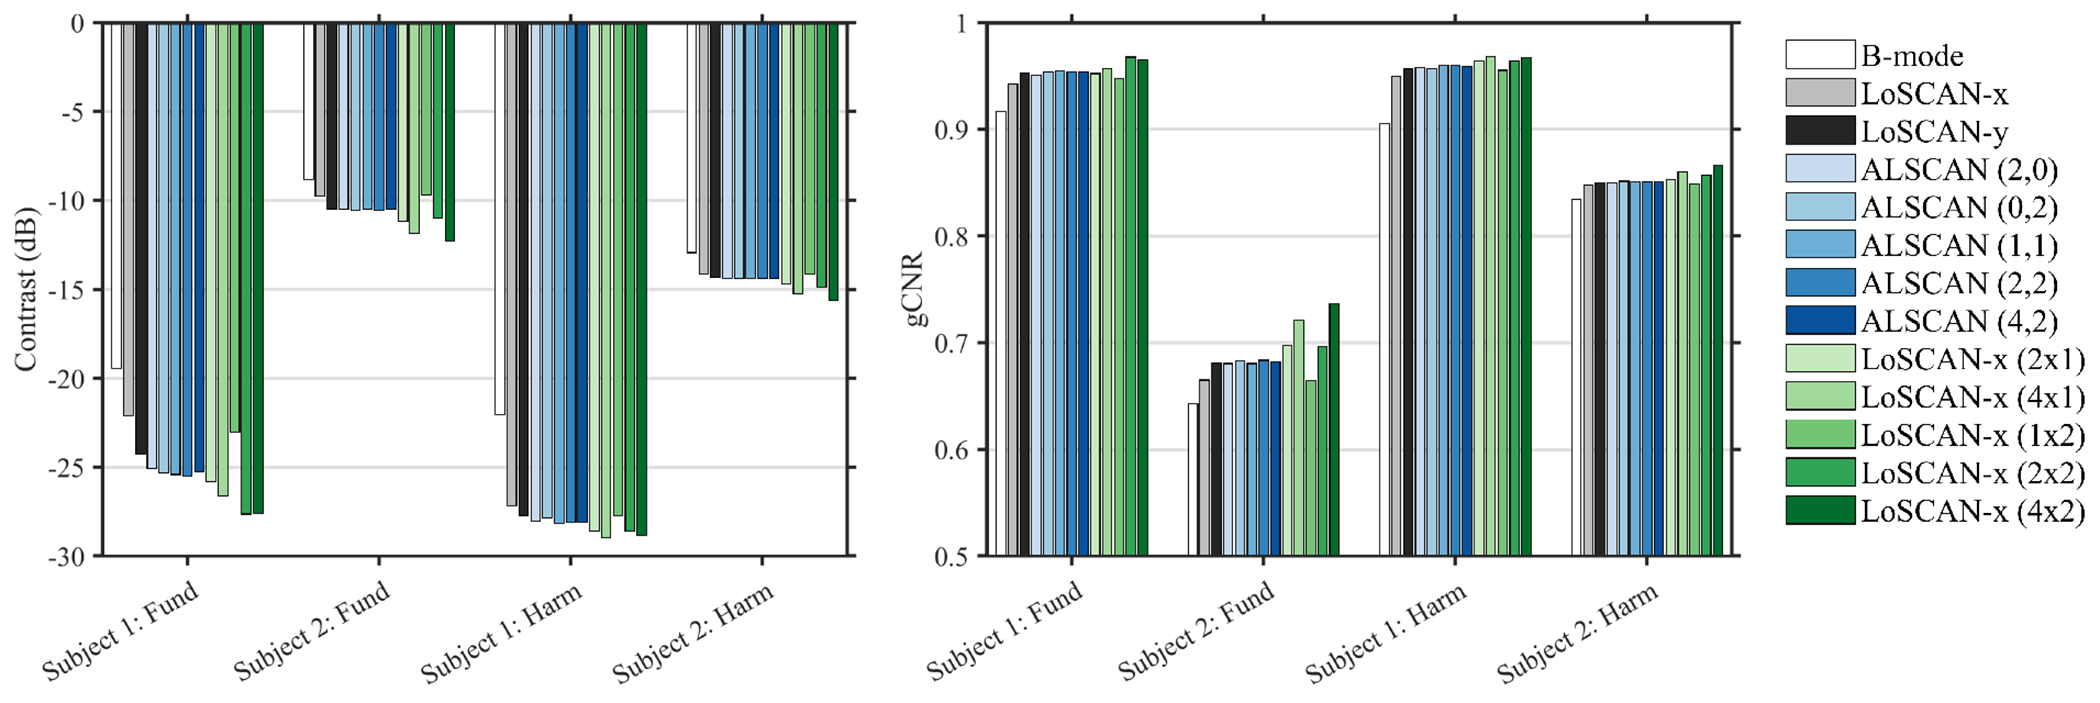
(a) Measured contrast and (b) gCNR in the fundamental and harmonic images from two volunteers. Results are shown for B-mode, LoSCAN-x, LoSCAN-y with various SAB configurations, and ALSCAN at various lags.
V. Discussion
In this work, we presented a matrix array-based implementation of LoSCAN and evaluated strategies to suppress partially correlated reverberation noise using matrix-based techniques. Using Field II simulations and in vivo measurements with an experimental system, we validated the proposed method. Key results are summarized below:
Contrast loss due to purely incoherent noise can be estimated from any arbitrary short-lag spatial correlation.
Performance of LoSCAN is severely limited when interchannel additive noise becomes partially correlated.
Sub-aperture beamforming before LoSCAN processing enhances contrast and improves LoSCAN’s performance in the presence of PCN.
For best performance, the SAB dimension should be matched to the direction and extent of underlying noise correlation.
The matrix LoSCAN formulation is similar to the original 1D LoSCAN with some key differences. Unlike the 1D version [27] that used lag-one coherence, channel SNR was estimated from an arbitrary short lag. The underlying speckle coherence at the short lag was estimated using a triangular model that may be inaccurate with significant backscatter heterogeneity. It is thus important to use short-lags regions to minimize such deviations. The alternative is to use a unity speckle coherence assumption at short lag [27] which may not be valid with SAB configurations and in 2D arrays with coarse sampling. Similar to Long et al. [27], the proposed matrix LoSCAN assumes that the channel noise is uncorrelated. Since partial noise correlation can not be separated from partial echo correlation, a PCN-compatible LoSCAN is non-trivial to derive.
Incoherent noise has a scaling effect on the spatial coherence function [38], and LoSCAN seeks to recover the image contrast by rescaling the coherence function using the LOC [27]. Simulations of a large 2D array demonstrate that this approach can be generalized to an arbitrary lag. LoSCAN-x, LoSCAN-y, and ALSCAN images obtained from non-neighboring lags produced similar contrasts in lesion and layer targets. In anechoic layer phantoms, where the underlying echo coherence deviated significantly from the triangular model, the higher lag versions produced a maximum of 1.1 dB variation in contrast. These results show that the higher-lag-based ALSCAN can be reliably used to recover contrast.
Partially correlated additive noise severely degrades LoSCAN’s clutter suppression ability. Simulations show that the contrast curves for B-mode and LoSCAN start to overlap for a noise FWHM of 2λ. The source of this degradation can be attributed to an overestimation of channel SNR and the coherence factor. The noise correlation adds to the overall measured correlation (Figs. 4(b),7(b)). Thus, in the presence of PCN, lag-one coherence overestimates the channel SNR. LoSCAN also requires an estimate of the beamformer gain, G, which is a function of the underlying target coherence. Since the target coherence is generally unknown, we estimate G from the CF. We have shown in the Appendix C that when the echo coherence is relatively low (hypoechoic regions), the noise coherence artificially increases the CF. Simulation measurements also corroborated this showing an increase in CF with increasing noise FWHM (Fig. 7(c)). Therefore, performance loss of LoSCAN due to PCN is a combined effect of channel SNR and coherence factor overestimation.
ALSCAN marginally improves PCN suppression by estimating channel SNR from a lag higher than the noise correlation length. However, the coherence factor remains unchanged in ALSCAN. The sensitivity analysis in Fig. 7(a) shows that the coherence factor often has a threshold impact on the overall image correction factor. Specifically, a CF.M larger than approximately two can render the LoSCAN largely insensitive to the channel SNR estimate (Fig. 7(a)). Therefore, when the channel noise is correlated, using a higher lag (ALSCAN) has a relatively minor impact on the final image contrast (Figs. 6(c)–(d)).
Sub-aperture beamforming was an effective approach to mitigate the PCN. The correlation of noise between two neighboring sub-apertures is the average correlation of each element from one sub-aperture to each element from the other sub-aperture [29]. Thus, when the SAB dimension is larger than the physical extent of the noise correlation, the noise between effective elements becomes uncorrelated. This mitigates the LOC/channel SNR overestimation problem (Fig. 7(b)). Additionally, based on the model shown in the Appendix C, when the noise correlation is reduced through SAB, the coherence factor estimates become similar to incoherent noise (also measured in simulation in Fig. 7(c)). Therefore, with appropriately sub-aperture beamformed data, the LoSCAN effectively operates within the noise incoherence assumption.
The simulations show that the SAB LoSCAN is most effective when the SAB configuration covers the direction of noise correlation (Figs. 6(a,b)). For optimum performance, the SAB size must be larger than the physical extent of noise correlation. It should be noted that the physical extent of the noise correlation is larger than its FWHM. It can be shown that the Gaussian correlation model in (19) substantially decays (<0.01) when m>2.58τ. Thus, for τ = 1, 2 and 3 λ, the noise remains correlated over a physical distance of 2.6, 5.1 and 7.7 λ, respectively. Figure 7(d) shows that the CF.M parameter and LOC due to PCN approached those of the ICN when the azimuthal sub-aperture size exceeded these numbers. Consequently, SAB configurations larger than the noise correlation extent are necessary to validate the incoherence assumption.
Due to the narrow coherence length of reverberation clutter, partial coherence measurement requires a highly sampled array. Within in vivo hypoechoic targets, the azimuthal spatial correlation was less than 0.1 for all lags except at lag-one, where it was 0.4 and 0.3 in two volunteers. In the elevation curves, such effects were not visible. We speculate that this can be attributed to a coarse sampling of the 2D spatial coherence function by large (1 mm) elevation elements. LoSCAN performed with a finely sampled array (such as λ/2 phased arrays) is likely more susceptible to PCN.
Fundamental B-mode images in the gallbladder exhibited a speckle-like texture indicating the presence of reverberation clutter. LoSCAN-x did not significantly enhance contrast compared to B-mode. LoSCAN-y and higher lag versions (ALSCAN) performed better than LoSCAN-x. This observation matches the spatial coherence measurements from Fig. 8. Of all lags, only the azimuthal lag exhibited significant noise correlation likely due to finer array sampling along this direction. LoSCAN-y and certain ALSCAN methods used lags higher than the noise correlation length to estimate the channel SNR. ALSCAN, however, was still limited by CF overestimation, as previously explained. With appropriately tuned SAB configurations, LoSCAN-x performed better than ALSCAN. The 1×2 SAB configuration performed the worst, indicating that SAB dimensions must be tuned to the noise correlation anisotropy. Contrast and gCNR measurements corroborated these visual observations. Harmonic images also exhibited similar, albeit less pronounced, results in gCNR and contrast statistics.
The source of partial coherence in reverberation clutter is not well-studied in the literature. Most studies generally modeled the reverberation clutter as purely incoherent. However, we observed in our ongoing studies that the diffuse reverberation in abdominal targets is often on the order of the wavelength. A study on the sources of partial correlation is beyond the scope of this work and will be conducted in the future. We anticipate that a frequency-dependent maximum correlation length can be established for diffuse reverberation, allowing a fixed sub-aperture beamforming configuration typically used in clinical 2D arrays.
A potential source of PCN is sidelobe-induced off-axis clutter which cannot be ruled out due to the limited size of the gallbladder. However, sidelobe clutter tends to have a longer correlation length than those observed in fig. 8 [39]. Additionally, a reverberation that occurs between far-field structures and subsequently propagates to the transducer may also exhibit partial correlation. Although we imaged deep abdominal targets, it is unclear whether any distant reverberation contributed to the observed PCN.
One unexpected result was the low elevational coherence measured inside the liver of subject 2 in fundamental mode. Although proximity to the liver capsule and bright out-of-plane targets would explain this, limited field-of-view and a lack of elevational beam steering prevented experimental validation.
The proposed approaches are computationally inexpensive. Similar to the original implementation [27], matrix LoSCAN requires correlation at a single lag and the coherence factor. Although we used a 1024-element array in this study, SAB-based approaches operated on downsampled aperture data (up to 8× downsampling). For example, with a 4 × 2 SAB configuration in our experimental array, coherence calculation had the same complexity as a 128-element array. Implemented on MATLAB and benchmarked on a 3.4 GHz Intel i7-3770 processor using 50 repeated executions, LoSCAN-x processing throughputs were 22.5 and 168.4 pixels/ms for no-SAB and 4 × 2 SAB data, respectively.
There are several limitations of our study. We only performed imaging in the X-Z plane rather than volumetric LoSCAN imaging. However, the results are readily applicable to any scan configurations. Binary layer phantoms simulated in this study are not frequently encountered in patients. However, these models provide a target that is uniform through depth with enough lateral extent to show both off-axis effects close to the boundary and avoid them further out. We have performed SAB on the receive focused data, which requires full channel-domain access. Manufacturers often perform SAB in the handle of matrix arrays to reduce channel count [40]. Jakovljevic et al. previously demonstrated that coherence imaging methods improve image quality with such pre-beamformed data [40]. However, the applicability of LoSCAN to pre-beamformed data remains to be studied. Another limitation is that we have utilized a simple model of partially correlated noise based on Cholesky decomposition. While a non-linear simulation [41] that appropriately models multipath reverberation would be more realistic, our model provides exact control over noise correlation length. We plan to perform a 3D fullwave simulation [42] in future work in conjunction with matrix LoSCAN. We also plan to evaluate the efficacy of matrix-based LoSCAN on a larger patient population.
VI. Conclusion
We presented a matrix array-based implementation of LoSCAN and evaluated 2D beamforming approaches to mitigate partially correlated reverberation clutter. The proposed matrix LoSCAN was able to recover contrast loss associated with incoherent noise using the spatial coherence at an arbitrary short lag. Among the two matrix-based approaches we studied, SAB LoSCAN was the most effective at suppressing partially correlated clutter. SAB LoSCAN produced optimum performance when the SAB configuration was matched to the direction and spatial extent of the noise correlation. In vivo measurements in the liver validated the clutter suppression ability of the proposed approaches.
VIII. Acknowledgement
The authors would like to thank Bofeng Zhang for assistance with the probe calibration and Courtney Trutna and Dr. David Bradway for assistance with the Verasonics systems.
This work was supported by National Institute of Health grants R01-EB026574 and R01-CA211602.
Biographies

Rifat Ahmed received B.Sc. degree in electrical and electronic engineering from the Islamic University of Technology, Gazipur, Bangladesh, in 2012, and M.S. and Ph.D. degrees in electrical engineering from the University of Rochester, Rochester, NY, USA, in 2017 and 2020. He is currently a Research Scientist at the Biomedical Engineering Department, Duke University, Durham, NC, USA. His current research interests are in adaptive beamforming and signal processing methods for improving ultrasound image quality.

Nick Bottenus received the B.S.E. degree in biomedical engineering and electrical and computer engineering and the Ph.D. degree in biomedical engineering from Duke University, Durham, NC, USA, in 2011 and 2017, respectively. From 2017-2019 he was a research scientist at Duke University. He is currently an Assistant Professor in the department of Mechanical Engineering at the University of Colorado Boulder. His research interests include developing methods for performing large aperture ultrasound imaging and improving image quality through beamforming.

James Long received the B.S. degree in bioengineering from Rice University, Houston, TX, USA, in 2017. He is currently pursuing the PhD. degree in biomedical engineering at Duke University, Durham, NC, USA. His current research interests include clinical applications of adaptive imaging and image quality characterization.

Gregg E. Trahey (S’83-M’85) received the B.G.S. and M.S. degrees from the University of Michigan, Ann Arbor, MI, USA, in 1975 and 1979, respectively, and the Ph.D. degree in biomedical engineering from Duke University, Durham, NC, USA, in 1985. He served in the Peace Corps from 1975 to 1978 and was a project engineer at the Emergency Care Research Institute in Plymouth Meeting, PA, USA, from 1980 to 1982. He currently is a Professor with the Department of Biomedical Engineering at Duke University and holds a secondary appointment with the Department of Radiology at the Duke University Medical Center. His current research interests include adaptive beamforming and acoustic radiation force imaging methods.
VII. Appendix
A. Beamformer gain in matrix arrays
In this section, we develop a closed-form expression of beamformer gain for matrix arrays in terms of the 2D spatial coherence function. The general expression for G is given by (5), which states that the beamformer gain is proportional to the sum of all possible spatial correlations measured in a matrix array. We can perform this sum by observing the symmetries in RS.
First, there are MxMy unity correlations at (0,0) lag. Next, within a given row, there are (Mx − 1) non-zero azimuthal lags, and a total of (Mx − m) element pairs that satisfies a given lag of m. Each element pair produces a forward and a backward correlation that are complex conjugates of each other. Thus, considering My rows in the array, the sum of all correlations with zero elevational lag is given by . Similarly, the sum of all correlations with zero azimuthal lag is given by . Finally, any diagonal lag with non-zero (m, n) can be selected along two directions (Fig. 1(c)). Thus, a total of 2(Mx − m)(My − n) element pairs satisfy a given lag of (m, n) , with each pair producing two complex conjugate correlations. Thus, the sum of correlations at non-zero row-column lags is . Combining all of these correlation sums, we obtain the beamformer gain expression of (10).
One can computationally verify that, regardless of array dimension, equation (10) yields G=M for a perfectly coherent target.
B. Coherence factor in matrix arrays
In this section, we express the coherence factor in terms of measured 2D spatial coherence functions. Eq (13) can be expanded as:
| (25) |
We can now sum the noisy coherence function using the analysis in the previous section and obtain the expression in (14).
C. Coherence factor for partially correlated additive noise
In this section, we derive an expression of the coherence factor of backscatter signals corrupted by additive PCN. We did not explicitly utilize these models in the proposed matrix LoSCAN formulation. However, we used these models to explain the performance of LoSCAN and SAB LoSCAN-x with PCN.
Without assuming noise incoherence and assuming mutually uncorrelated signal and noise, (13) can be rewritten as:
| (26) |
It is important to note that the channel SNR in this expression can not be estimated using (9), which is only valid for ICN. The dimensionality of echo and noise correlation matrices can be reduced using the summing techniques described in the previous sections. For example, the noise correlation function can be simplified as:
| (27) |
For the special case of azimuthally correlated noise, we obtain a simplified expression:
| (28) |
where P(m) is the 1D noise correlation function.
Several key results can be explained using this expression. First, the increase in CF within anechoic regions as a function of noise correlation length can be explained using (28). In the anechoic region, the echo coherence is very low and solely a contribution of off-axis scattering. Also, the channel SNR in hypoechoic regions is significantly lower than the nominal channel SNR, which was specified relative to the bright speckle region. Thus, we can ignore the first term of this expression for high contrast hypoechoic regions. Consequently, CF increases with any positive contributions from P(m) at m > 0. Second, due to negligible signal coherence, the effective channel SNR in the anechoic regions remains relatively unchanged after SAB. This explains why the CF increases as a factor of sub-aperture size (Fig. 7(c)) in the presence of ICN (third term equals zero). Finally, with sub-aperture beamforming, when the third term becomes negligible, the CF value approaches the incoherent case. This explains why SAB reduced the overestimation of CF in hypoechoic regions, which was critical to the improvement of LoSCAN.
Contributor Information
Rifat Ahmed, Department of Biomedical Engineering, Duke University, Durham, NC 27705, USA.
Nick Bottenus, Department of Mechanical Engineering, University of Colorado Boulder, Boulder, CO 80309, USA.
James Long, Department of Biomedical Engineering, Duke University, Durham, NC 27705, USA.
Gregg Trahey, Department of Biomedical Engineering, Duke University, Durham, NC 27705, USA, Department of Radiology, Duke University Medical Center, Durham, NC 27710, USA.
References
- [1].Lediju MA, Pihl MJ, Hsu SJ, Dahl JJ, Gallippi CM, and Trahey GE, “Magnitude, origins, and reduction of abdominal ultrasonic clutter,” in Proceedings - IEEE Ultrasonics Symposium, 2008, pp. 50–53. [Google Scholar]
- [2].Lediju MA, Pihl MJ, Dahl JJ, and Trahey GE, “Quantitative assessment of the magnitude, impact and spatial extent of ultrasonic clutter,” Ultrasonic Imaging, vol. 30, no. 3, pp. 151–168, 2008. [DOI] [PMC free article] [PubMed] [Google Scholar]
- [3].Pinton GF, Trahey GE, and Dahl JJ, “Sources of image degradation in fundamental and harmonic ultrasound imaging using nonlinear, full-wave simulations,” IEEE Transactions on Ultrasonics, Ferroelectrics, and Frequency Control, vol. 58, no. 4, pp. 754–765, 2011. [DOI] [PMC free article] [PubMed] [Google Scholar]
- [4].Dahl JJ and Sheth NM, “Reverberation clutter from subcutaneous tissue layers: Simulation and in vivo demonstrations,” Ultrasound in Medicine and Biology, vol. 40, no. 4, pp. 714–726, 2014. [DOI] [PMC free article] [PubMed] [Google Scholar]
- [5].Holfort IK, Gran F, and Jøensen JA, “Broadband minimum variance beamforming for ultrasound imaging,” IEEE Transactions on Ultrasonics, Ferroelectrics, and Frequency Control, vol. 56, no. 2, pp. 314–325, 2009. [DOI] [PubMed] [Google Scholar]
- [6].Synnevåg JF, Austeng A, and Holm S, “Benefits of minimum-variance beamforming in medical ultrasound imaging,” IEEE Transactions on Ultrasonics, Ferroelectrics, and Frequency Control, vol. 56, no. 9, pp. 1868–1879, 2009. [DOI] [PubMed] [Google Scholar]
- [7].Matrone G, Savoia AS, Caliano G, and Magenes G, “The delay multiply and sum beamforming algorithm in ultrasound B-mode medical imaging,” IEEE Transactions on Medical Imaging, vol. 34, no. 4, pp. 940–949, 2015. [DOI] [PubMed] [Google Scholar]
- [8].Li PC and Li ML, “Adaptive imaging using the generalized coherence factor,” IEEE Transactions on Ultrasonics, Ferroelectrics, and Frequency Control, vol. 50, no. 2, pp. 128–141, 2003. [DOI] [PubMed] [Google Scholar]
- [9].Camacho J, Parrilla M, and Fritsch C, “Phase coherence imaging,” IEEE Transactions on Ultrasonics, Ferroelectrics, and Frequency Control, vol. 56, no. 5, pp. 958–974, 2009. [DOI] [PubMed] [Google Scholar]
- [10].Rindal OMH, Austeng A, Fatemi A, and Rodriguez-Molares A, “The Effect of Dynamic Range Alterations in the Estimation of Contrast,” IEEE Transactions on Ultrasonics, Ferroelectrics, and Frequency Control, vol. 66, no. 7, pp. 1198–1208, 2019. [DOI] [PubMed] [Google Scholar]
- [11].Rindal OMH, Rodriguez-Molares A, and Austeng A, “The dark region artifact in adaptive ultrasound beamforming,” in IEEE International Ultrasonics Symposium, IUS, 2017. [Google Scholar]
- [12].Byram B, Dei K, Tierney J, and Dumont D, “A model and regularization scheme for ultrasonic beamforming clutter reduction,” IEEE Transactions on Ultrasonics, Ferroelectrics, and Frequency Control, vol. 62, no. 11, pp. 1913–1927, 2015. [DOI] [PMC free article] [PubMed] [Google Scholar]
- [13].Morgan MR, Trahey GE, and Walker WF, “Multi-covariate Imaging of Sub-resolution Targets,” IEEE Transactions on Medical Imaging, vol. 38, no. 7, pp. 1690–1700, 2019. [DOI] [PMC free article] [PubMed] [Google Scholar]
- [14].Shin J, Chen Y, Nguyen M, and Yen JT, “Robust ultrasonic reverberation clutter suppression using Multi-Apodization with Cross-correlation,” in IEEE International Ultrasonics Symposium, IUS, 2014, pp. 543–546. [Google Scholar]
- [15].Sjoerdsma M, Bouwmeester S, Houthuizen P, van de Vosse FN, and Lopata RGP, “A Spatial Near-Field Clutter Reduction Filter Preserving Tissue Speckle in Echocardiography,” IEEE Transactions on Ultrasonics, Ferroelectrics, and Frequency Control, pp. 1–1, 2020. [DOI] [PubMed] [Google Scholar]
- [16].Brickson LL, Hyun D, Jakovljevic M, and Dahl JJ, “Reverberation Noise Suppression in Ultrasound Channel Signals Using a 3D Fully Convolutional Neural Network,” IEEE Transactions on Medical Imaging, 2021. [DOI] [PMC free article] [PubMed] [Google Scholar]
- [17].Huang O, Long J, Long W, Pinton G, Trahey GE, and Palmeri ML, “UltraNet: Deep Learning Tools for Modeling Acoustic Wall Clutter,” in IEEE International Ultrasonics Symposium, IUS, vol. 2020-September, 2020. [Google Scholar]
- [18].Goodman JW, Statistical optics. New York, NY, USA, 1985. [Google Scholar]
- [19].Mallart R and Fink M, “The van Cittert-Zernike theorem in pulse echo measurements,” Journal of the Acoustical Society of America, vol. 90, no. 5, pp. 2718–2727, 1991. [Google Scholar]
- [20].Pinton G, Trahey G, and Dahl J, “Spatial coherence in human tissue: Implications for imaging and measurement,” IEEE Transactions on Ultrasonics, Ferroelectrics, and Frequency Control, vol. 61, no. 12, pp. 1976–1987, 2014. [DOI] [PMC free article] [PubMed] [Google Scholar]
- [21].Lediju MA, Trahey GE, Byram BC, and Dahl JJ, “Short-lag spatial coherence of backscattered echoes: Imaging characteristics,” IEEE Transactions on Ultrasonics, Ferroelectrics, and Frequency Control, vol. 58, no. 7, pp. 1377–1388, 2011. [DOI] [PMC free article] [PubMed] [Google Scholar]
- [22].Long W, Hyun D, Choudhury KR, Bradway D, McNally P, Boyd B, Ellestad S, and Trahey GE, “Clinical Utility of Fetal Short-Lag Spatial Coherence Imaging,” Ultrasound in Medicine and Biology, vol. 44, no. 4, pp. 794–806, 2018. [DOI] [PMC free article] [PubMed] [Google Scholar]
- [23].Hyun D, Crowley ALC, Lefevre M, Cleve J, Rosenberg J, and Dahl JJ, “Improved Visualization in Difficult-to-Image Stress Echocardiography Patients Using Real-Time Harmonic Spatial Coherence Imaging,” IEEE Transactions on Ultrasonics, Ferroelectrics, and Frequency Control, vol. 66, no. 3, pp. 433–441, 2019. [DOI] [PMC free article] [PubMed] [Google Scholar]
- [24].Jakovljevic M, Trahey GE, Nelson RC, and Dahl JJ, “In Vivo Application of Short-Lag Spatial Coherence Imaging in Human Liver,” Ultrasound in Medicine and Biology, vol. 39, no. 3, pp. 534–542, 2013. [DOI] [PMC free article] [PubMed] [Google Scholar]
- [25].Dahl JJ, Hyun D, Li Y, Jakovljevic M, Bell MA, Long WJ, Bottenus N, Kakkad V, and Trahey GE, “Coherence beamforming and its applications to the difficult-to-image patient,” in IEEE International Ultrasonics Symposium, IUS, 2017. [Google Scholar]
- [26].Dahl JJ, Hyun D, Lediju M, and Trahey GE, “Lesion detectability in diagnostic ultrasound with short-lag spatial coherence imaging,” Ultrasonic Imaging, vol. 33, no. 2, pp. 119–133, 2011. [DOI] [PMC free article] [PubMed] [Google Scholar]
- [27].Long W, Bottenus N, and Trahey GE, “Incoherent Clutter Suppression Using Lag-One Coherence,” IEEE Transactions on Ultrasonics, Ferroelectrics, and Frequency Control, vol. 67, no. 8, pp. 1544–1557, 2020. [DOI] [PMC free article] [PubMed] [Google Scholar]
- [28].—, “Lag-One Coherence as a Metric for Ultrasonic Image Quality,” IEEE Transactions on Ultrasonics, Ferroelectrics, and Frequency Control, vol. 65, no. 10, pp. 1768–1780, 2018. [DOI] [PMC free article] [PubMed] [Google Scholar]
- [29].Hyun D, Trahey G, Jakovljevic M, and Dahl J, “Short-lag spatial coherence imaging on matrix arrays, Part 1: Beamforming methods and simulation studies,” IEEE Transactions on Ultrasonics, Ferroelectrics, and Frequency Control, vol. 61, no. 7, pp. 1101–1112, 2014. [DOI] [PMC free article] [PubMed] [Google Scholar]
- [30].Cook RK, Waterhotjse RV, Berendt RD, Edelman S, and Thompson MC, “Measurement of Correlation Coefficients in Reverberant Sound Fields,” Journal of the Acoustical Society of America, vol. 27, no. 6, pp. 1072–1077, 1955. [Google Scholar]
- [31].Jensen JA and Jensen JA, “FIELD: A Program for Simulating Ultrasound Systems,” 10TH NORDICBALTIC CONFERENCE ON BIOMEDICAL IMAGING, VOL. 4, SUPPLEMENT 1, PART 1:351-353, vol. 34, pp. 351–353, 1996. [Google Scholar]
- [32].Mallart R and Fink M, “Adaptive focusing in scattering media through sound-speed inhomogeneities: The van Cittert Zernike approach and focusing criterion,” Journal of the Acoustical Society of America, vol. 96, no. 6, pp. 3721–3732, 1994. [Google Scholar]
- [33].Walker WF and Trahey GE, “Speckle coherence and implications for adaptive imaging,” The Journal of the Acoustical Society of America, vol. 101, no. 4, pp. 1847–1858, 1997. [DOI] [PubMed] [Google Scholar]
- [34].Long J, Long W, Bottenus N, and Trahey G, “Coherence-based quantification of acoustic clutter sources in medical ultrasound,” The Journal of the Acoustical Society of America, vol. 148, no. 2, pp. 1051–1062, 2020. [DOI] [PMC free article] [PubMed] [Google Scholar]
- [35].Bottenus N, “Recovery of the Complete Data Set from Focused Transmit Beams,” IEEE Transactions on Ultrasonics, Ferroelectrics, and Frequency Control, vol. 65, no. 1, pp. 30–38, 2018. [DOI] [PMC free article] [PubMed] [Google Scholar]
- [36].Hyun D, Crowley ALC, and Dahl JJ, “Efficient Strategies for Estimating the Spatial Coherence of Backscatter,” IEEE Transactions on Ultrasonics, Ferroelectrics, and Frequency Control, vol. 64, no. 3, pp. 500–513, 2017. [DOI] [PMC free article] [PubMed] [Google Scholar]
- [37].Rodriguez-Molares A, Rindal OMH, D’Hooge J, Masoy SE, Austeng A, Lediju Bell MA, and Torp H, “The Generalized Contrast-to-Noise Ratio: A Formal Definition for Lesion Detectability,” IEEE Transactions on Ultrasonics, Ferroelectrics, and Frequency Control, vol. 67, no. 4, pp. 745–759, 2020. [DOI] [PMC free article] [PubMed] [Google Scholar]
- [38].Bottenus NB and Trahey GE, “Equivalence of time and aperture domain additive noise in ultrasound coherence,” The Journal of the Acoustical Society of America, vol. 137, no. 1, pp. 132–138, 2015. [DOI] [PMC free article] [PubMed] [Google Scholar]
- [39].Morgan MR, Trahey GE, and Walker WF, “Speckle coherence of piecewise-stationary stochastic targets,” The Journal of the Acoustical Society of America, vol. 146, no. 3, pp. 1721–1731, 2019. [DOI] [PMC free article] [PubMed] [Google Scholar]
- [40].Jakovljevic M, Byram B, Hyun D, Dahl J, and Trahey G, “Short-lag spatial coherence imaging on matrix arrays, Part II: Phantom and in vivo experiments,” IEEE Transactions on Ultrasonics, Ferroelectrics, and Frequency Control, vol. 61, no. 7, pp. 1113–1122, 2014. [DOI] [PMC free article] [PubMed] [Google Scholar]
- [41].Pinton GF, Dahl J, Rosenzweig S, and Trahey GE, “A heterogeneous nonlinear attenuating full- wave model of ultrasound,” IEEE Transactions on Ultrasonics, Ferroelectrics, and Frequency Control, vol. 56, no. 3, pp. 474–488, 2009. [DOI] [PMC free article] [PubMed] [Google Scholar]
- [42].Pinton G, “Ultrasound imaging of the human body with three dimensional full-wave nonlinear acoustics. Part 1: simulations methods,” arXiv, 2020. [Google Scholar]


