

Abstract
Objective:
To propose a semi-automated method for pattern classification to predict individuals' stage of growth based on morphologic characteristics that are described in the modified cervical vertebral maturation (CVM) method of Baccetti et al.
Materials and Methods:
A total of 188 lateral cephalograms were collected, digitized, evaluated manually, and grouped into cervical stages by two expert examiners. Landmarks were located on each image and measured. Three pattern classifiers based on the Naïve Bayes algorithm were built and assessed using a software program. The classifier with the greatest accuracy according to the weighted kappa test was considered best.
Results:
The classifier showed a weighted kappa coefficient of 0.861 ± 0.020. If an adjacent estimated pre-stage or poststage value was taken to be acceptable, the classifier would show a weighted kappa coefficient of 0.992 ± 0.019.
Conclusion:
Results from this study show that the proposed semi-automated pattern classification method can help orthodontists identify the stage of CVM. However, additional studies are needed before this semi-automated classification method for CVM assessment can be implemented in clinical practice.
Keywords: Decision support systems, Clinical, Age determination by skeleton, Cervical vertebrae, Orthodontics
INTRODUCTION
It is crucial to know the stage of growth and development in orthodontic and facial orthopedic patients.1 Several methods used for skeletal bone age assessment have been described in the literature.2,3 One such method is the cervical vertebral maturation (CVM) assessment.1 In the CVM method, cervical stages (CSs) can be accessed on the lateral cephalograms that are routinely used in orthodontics. This prevents additional patient exposure to radiation for hand and wrist X-rays. These methods have shown high reliability in many studies.4–10
A variety of new methods for automatic bone age assessment (ABAA) have been proposed over recent years, with the aim of reducing the complexity and subjectivity and increasing the reliability of hand and wrist–based methods.11,12 ABAA using CVM has also been studied, as in the quantitative CVM (QCVM) method proposed by Chen et al.,13 although the stages in their study were correlated with hand and wrist skeletal maturity indicators (SMIs)—not with cervical stages.
This paper proposes a semi-automated method for pattern classification to predict CVM stage, based on the morphologic characteristics described in the modified CVM method.14
MATERIALS AND METHODS
For this study, 188 images from digital lateral cephalograms on 188 subjects (119 females and 69 males) were examined. All cephalograms were acquired between 2006 and 2008 and form part of the research database of the School of Dentistry at Universidade Paulista (UNIP). This investigation was based on the last modified version of the CVM method proposed by Baccetti et al.,14 which includes six cervical stages (CS): CS1–CS6. Three steps were required: data preparation, construction of classifiers, and statistical analysis. This study formed part of a research project approved by the Ethics Committee (institutional review board) of Universidade Federal de São Paulo (UNIFESP) (approval #1842/09).
Data Preparation
In this step, the anatomic area consisting of C2, C3, and C4 on each image was separated from the remaining patient information so that any influence on the examiner's assessment coming from other characteristics would be avoided. The first examiner (E1), a specialist in orthodontics and radiology with extensive experience with the modified CVM method,14 manually evaluated these images and grouped them according to CS.14 Then a second examiner (E2), a specialist in orthodontics, assessed the same set of images. Because of examiner E1's extensive experience, the cervical stages identified by this examiner were considered the gold standard for constructing classifiers in this study. A third examiner (E3) located landmarks (Figure 1) on the images using a specially developed software program. The coordinates of the landmarks were obtained and were used as the basis for calculating the measurements of interest14 as shown in Table 1.
Figure 1.
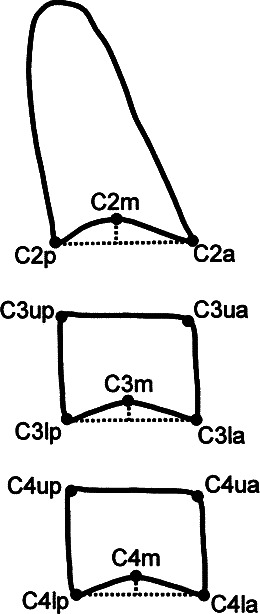
Landmarks in C2, C3, and C4. (Source: Reference 14.)
Table 1.
Measures of Interest Used in the CVM Method14

It should be noted that measurements C2Conc, C3Conc, and C4Conc were also calculated as ratios to eliminate the need for calibrations or conversions between units of measurement. Thus, a sample set consisting of the seven measurements obtained from each image, with labeling according to CS, was created.
Construction of Classifiers
In the construction step, the sample set was split into a training set and a testing set. The training set was subjected to a base classifier that extracted knowledge from this set of samples (ie, it recognized different patterns for each label). The result was a learned classifier that was used to classify new samples. Samples in the test set were submitted to the learned classifier for evaluation. Because these samples were also labeled, the inferred label given by the classifier could be compared with the real one.
The Naïve Bayes (NB) classifier15 was selected as the base classifier because of its intrinsic multiclass approach, which allows examples to be classified into more than two categories without changing the parameters. Based on Bayesian decision theory,16 NB uses the distribution of cervical stage frequencies provided in the training set as prior probabilities and uses the probability density function of each measurement in each cervical stage as posterior probabilities. Thus, when a new image is submitted, the learned classifier assigns it to the most likely cervical stage. Weka17 software was used to construct the NB classifier, with two parameters: useKernelEstimator and useSupervisedDiscretization. The first of these inspects attributes with a normal distribution and estimates a probability distribution for each attribute; the second parameter performs discretization of the values of each attribute, thereby transforming them into discrete intervals.
Thus, three classifiers with all possible combinations of these parameters were developed. For the first classifier, NB1 (naivebayes), both parameters were set as false (ie, the attributes had normal distribution and the values were not discretized). For the second classifier, NB2 (naivebayes-K), only the parameter useKernelEstimator was set as true (ie, the measurements of interest obtained did not have normal distribution). For the third classifier, NB3 (naivebayes-D), only the parameter useSupervisedDiscretization was set as true (ie, the values of each measurement of interest were discretized).
Statistical Analysis
The widely used 10-fold cross-validation method18 was used to test all classifiers. The accuracy rate and the accuracy rate with tolerance of an adjacent stage were obtained for each classifier tested. The degree of agreement between actual (gold standard) and estimated stages using each classifier was assessed by means of the quadratic weighted kappa test.19 The kappa test attempts to correct the degree of agreement by removing the count that may be attributed by chance. The quadratic weighted approach was used because the stages followed a cervical order in which CS1 < CS2 < CS3 < CS4 < CS5 < CS6, and a disagreement of one adjacent stage is different from a disagreement of two or more adjacent stages. Thus, a weighting scheme was modeled, ranging from 1 (for full agreement) to 0 (for full disagreement).
According to Landis and Koch,20 the degree of agreement ranges from 0 to 1 (Table 2). The best classifier was the one that showed the highest degree of agreement between actual and estimated stages.
Table 2.
Kappa Coefficient Interpretation20

Analyses using the quadratic weighted kappa test were performed to assess interexaminer agreement (1) between examiners E1 and E2; (2) between the selected classifier and examiner E1; and (3) between the selected classifier and examiner E2. Statistical analyses were performed using MedCalc for Windows, version 11.5.1.0 (MedCalc Software, Mariakerke, Belgium).
RESULTS
The analysis on the interexaminer agreement between E1 and E2 is shown in Table 3. This also presents the analysis on agreement between examiner E1 and classifier NB1, and between examiner E2 and classifier NB1. The level of agreement shown in Table 3 is evaluated in accordance with the Landis and Koch classification.20
Table 3.
Results of Analysis of Agreement Between Examiner E1 and E2, Examiner E1 and Classifier NB1, and Examiner E2 and Classifier NB1

Table 4 shows results from analyses on the classifiers. Among the stages that were misclassified, most were misclassified as an adjacent stage (ie, one stage before or after the actual stage). Table 5 shows the results from analyses on the classifiers, with such deviation taken into consideration.
Table 4.
Results of Analyses of Classifiers

Table 5.
Results of Analyses of Classifiers Considering a Deviation of One Stage

The classifier NB1 showed the best results, with a deviation of one adjacent stage taken into consideration, with a kappa coefficient of 0.992 ± 0.019 and an accuracy rate of 90.42%.
DISCUSSION
Interexaminer agreement between examiners E1 and E2 proved substantial20 as a result of the different experiences of the CVM method possessed by examiners E1 and E2. Agreement between examiner E1 and classifier NB1 proved to be almost perfect20 because the classifier NB1 was trained on the basis of examiner E1's evaluation. Agreement between examiner E2 and classifier NB1 proved substantial.20 No significant difference in agreement between examiners E1 and E2 or between examiner E2 and classifier NB1 was noted, suggesting that the classifier was able to reproduce the expert's performance.
The finding of an accuracy rate of 90.42% when a deviation of one adjacent stage was taken into consideration, with further support from the almost perfect agreement between actual and estimated classifications, indicates that the NB1 classifier can reproduce the expert's performance and predict the CVM stage. Similar results were reported by Niemeijer et al.21 They used an automated classifier based on the Tanner-Whitehouse21 method and found an accuracy rate of 97.2% when a deviation of one adjacent stage was taken into consideration.
Hassel and Farman6 noted that in some cases it may be difficult to differentiate between two adjacent stages of skeletal bone maturation, and that this may not be clinically relevant. Moreover, Gu and McNamara9 found that peak mandibular growth did not occur at a specific CS, but rather between stages CS3 and CS4 of the CVM method.
The software program that was specially developed for locating landmarks has proved valuable in orthodontics because it can store digitized radiographs, retain the coordinates of landmarks, and correlate measurements over the long term. It also can accurately reproduce this information at any time.
No similar studies have used pattern classification techniques based on the modified CVM method14 as described in the literature. The next step in this research study is to integrate the classifier into the landmark software. The new tool will be assessed, in terms of accuracy and practical use, by an expert in the modified CVM method. In addition, a study will be conducted to assess the effectiveness of this tool for training orthodontics students in the modified CVM method.
This same tool could be used to assess the quality of a radiology service by analyzing the agreement between assessments made by examiners and those estimated by the classifier. To make this possible, a validation study of the software program is planned in the future. Additional studies are needed before this method can be implemented in clinical practice.
CONCLUSION
Study results indicate that the proposed semi-automated classification method can help orthodontists identify the stage of CVM and can contribute toward greater diagnostic accuracy and better orthodontic treatment planning.
REFERENCES
- 1.Franchi L, Baccetti T, McNamara J. A., Jr Mandibular growth as related to cervical vertebral maturation and body height. Am J Orthod Dentofacial Orthop. 2000;118:335–340. doi: 10.1067/mod.2000.107009. [DOI] [PubMed] [Google Scholar]
- 2.Greulich W. W, Pyle S. I, editors. Radiographic Atlas of Skeletal Development of Hand Wrist 2nd ed. Stanford, Calif: Stanford University Press; 1971. [Google Scholar]
- 3.Tanner J. M, Healy M. J. R, Goldstein H, Cameron N, editors. Assessment of Skeletal Maturity and Prediction of Adult Height (TW3 Method) 3rd ed. London: WB Saunders; 2001. pp. 1–108. [Google Scholar]
- 4.Lamparski D. G. Skeletal Age Assessment Utilizing Cervical Vertebrae [dissertation] Pittsburgh, Pa: University of Pittsburgh, Faculty of the School of Dental Medicine; 1972. [Google Scholar]
- 5.Hellsing E. Cervical vertebral dimensions in 8, 11 and 15- year-old children. Acta Odontol. 1991;49:207–213. doi: 10.3109/00016359109005909. [DOI] [PubMed] [Google Scholar]
- 6.Hassel B, Farman A. G. Skeletal maturation evaluation using cervical vertebrae. Am J Orthod Dentofacial Orthop. 1995;107:58–66. doi: 10.1016/s0889-5406(95)70157-5. [DOI] [PubMed] [Google Scholar]
- 7.Sadowsky P. L. Craniofacial growth and the timing of treatment. Am J Orthod Dentofacial Orthop. 1998;113:19–23. doi: 10.1016/S0889-5406(98)70272-0. [DOI] [PubMed] [Google Scholar]
- 8.O'Reilly M. T, Yanniello G. J. Mandibular growth changes and maturation of cervical vertebrae: a longitudinal cephalometric study. Angle Orthod. 1998;58:179–184. doi: 10.1043/0003-3219(1988)058<0179:MGCAMO>2.0.CO;2. [DOI] [PubMed] [Google Scholar]
- 9.Gu Y, McNamara J. A., Jr Mandibular growth changes and cervical vertebral maturation. Angle Orthod. 2007;77:947–953. doi: 10.2319/071006-284.1. [DOI] [PubMed] [Google Scholar]
- 10.Malta L. A, Ortolani C. F, Faltin K. Quantification of cranial base growth during pubertal growth. J Orthod. 2009;36:229–235. doi: 10.1179/14653120723256. [DOI] [PubMed] [Google Scholar]
- 11.Liu J, Qi J, Liu Z, Ning Q, Luo X. Automatic bone age assessment based on intelligent algorithms and comparison with TW3 method. Comput Med Imaging Graph. 2008;32:678–684. doi: 10.1016/j.compmedimag.2008.08.005. [DOI] [PubMed] [Google Scholar]
- 12.Thodberg H. H, Kreiborg S, Juul A, Pedersen K. D. The BoneXpert method for automated determination of skeletal maturity. IEEE Trans Med Imaging. 2009;28:52–66. doi: 10.1109/TMI.2008.926067. [DOI] [PubMed] [Google Scholar]
- 13.Chen L. L, Xu T. M, Jiang J. H, Zhang X. Z, Lin J. X. Quantitative cervical vertebral maturation assessment in adolescents with normal occlusion: a mixed longitudinal study. Am J Orthod Dentofacial Orthop. 2008;134:720.e1–720.e7. doi: 10.1016/j.ajodo.2008.03.014. [DOI] [PubMed] [Google Scholar]
- 14.Baccetti T, Franchi L, McNamara J. A., Jr The cervical vertebral maturation (CVM) method for the assessment of optimal treatment timing in dentofacial orthopedics. Semin Orthod. 2005;11:119–129. [Google Scholar]
- 15.Gilthorpe M. S, Maddick I. H, Petrie A. Introduction to Bayesian modelling in dental research. Community Dent Health. 2000;17:218. [PubMed] [Google Scholar]
- 16.Theodoridis S, Koutroumbas K. Pattern Recognition 3rd ed. Orlando, Fla: Academic Press; 2006. [Google Scholar]
- 17.Hall M, Frank E, Holmes G, Pfahringer B, Reutemann P, Witten I. The WEKA data mining software: an update. SIGKDD Explorations. 2009;11 [Google Scholar]
- 18.Witten I. H, Frank E. Data Mining—Practical Machine Learning Tools and Techniques. San Francisco, Calif: Morgan Kaufmann Publishers; 2005. [Google Scholar]
- 19.Cohen J. Weighted kappa: nominal scale agreement with provision for scaled disagreement or partial credit. Psychol Bull. 1968;70:213–220. doi: 10.1037/h0026256. [DOI] [PubMed] [Google Scholar]
- 20.Landis J. R, Koch G. G. The measurement of observer agreement for categorical data. Biometrics. 1977;33:159–174. [PubMed] [Google Scholar]
- 21.Niemeijer M, Ginneken B. V, Maas C. A, Beek F. J. A, Viergever M. A. Assessing the skeletal age from a hand radiograph: automating the Tanner-Whitehouse method. Proc SPIE. 2003;5032 [Google Scholar]