Abstract
Objective.
Conventional neural signal analysis methods assume that features of interest are linear, time-invariant signals confined to well-delineated spectral bands. However, new evidence suggests that neural signals exhibit important non-stationary characteristics with ill-defined spectral distributions. These features pose a need for signal processing algorithms that can characterize temporal and spectral features of non-linear time series. This study compares the effectiveness of four algorithms in extracting neural information for use in decoding cortical signals: Fast Fourier Transform bandpass filtering (FFT), principal spectral component analysis (PSCA), wavelet analysis (WA), and empirical mode decomposition (EMD).
Approach.
Electrocorticographic signals were recorded from the motor and sensory cortex of two epileptic patients performing finger movements. Each signal processing algorithm was used to extract beta (10–30 Hz) and gamma (66–114 Hz) band power to detect thumb movement and decode finger flexions, respectively. Naïve-Bayes (NB), support vector machine (SVM), and linear discriminant analysis (LDA) classifiers using each signal were validated using leave-one-out cross-validation.
Main results.
Decoders using all four signal decompositions achieved above 90% average accuracy in finger movement detection using beta power. When decoding individual finger flexion using gamma, the PSCA NB classifiers achieved 78 ± 4% accuracy while FFT, WA, and EMD analysis achieved accuracies of 73 ± 8%, 68 ± 7%, and 62 ± 3% respectively, with similar results using SVM and LDA.
Significance.
These results illustrate the relative levels of useful information contributed by each decomposition method in the case of finger movement decoding, which can inform the development of effective neural decoding pipelines. Further analyses could compare performance using more specific non-sinusoidal features, such as transients and phase-amplitude coupling.
Keywords: electrocorticography, empirical mode decomposition, principal spectral component analysis, finger flexion decoding
1. Introduction
Conventional Fourier bandpass filtering uses deterministic frequency bands to extract signal information and assumes that neural signals can be represented as time-invariant sinusoids. However, recent studies suggest that neural oscillations possess broadband, power-law characteristics dispersed across the frequency domain and exhibit physiologically important non-stationary features [1, 2], including non-sinusoidal waveforms in cortical beta [3, 4].
Signal-processing tools that can capture both the spectral and temporal dynamics of neural signals may improve analysis of neural waveforms. For example, principal spectral component analysis (PSCA) uses singular value decomposition to capture spectral components that exhibit maximum variance during epochs of interest [5]. On the other hand, wavelet analysis (WA) and empirical mode decomposition (EMD) capture temporal variations in neural signals evoked by physiological activity. WA uses short-time wavelike oscillations to extract the temporal response [6], whereas EMD iteratively decomposes temporal patterns in the neural signal [7]. These three algorithms have the potential to capture spectral variations and non-stationary features of neural signals.
While previous works have individually evaluated the utility of these algorithms [8–10], this study is the first to directly compare the performance of all four decompositions. This study attempts to assess the additional information contributed by these techniques by measuring the performance of each technique within the context of finger decoding. We applied fast fourier transform bandpass filtering (FFT), PSCA, WA, and EMD to decode human ECoG signals during movement. Beta power extracted using each algorithm was used to train Naïve-Bayes (NB), support vector machine (SVM), and linear discriminant analysis (LDA) classifiers to detect thumb movement. Similar classifiers were also used to decode finger flexions using gamma power extracted by each algorithm. The performance of each classifier was then compared to gain insights on the quality of signal extraction. Our results reveal the relative performance of each approach in a direct comparison, offering insights on the development of neural decoding pipelines and warranting future studies that compare extraction of specific non-sinusoidal features, such as transient activity and phase-amplitude coupling.
2. Methods
All human procedures were carried out in accordance with protocols approved by the Institutional Review Board at the University of Michigan. Both subjects provided informed consent.
2.1. Hand movements
Two epileptic patients were asked to perform motions on the hand contralateral to the implanted electrodes by flexing fingers independently during eight-second movement trials. Each finger was flexed eight to twelve times in random order, with five seconds of rest between each flexion. For this analysis, we considered only the thumb, index, and little fingers. Finger positions were recorded at 1000 Hz using a DataGlove 5 Ultra (5DT) with a flex sensor on each finger.
2.2. Human ECoG signals
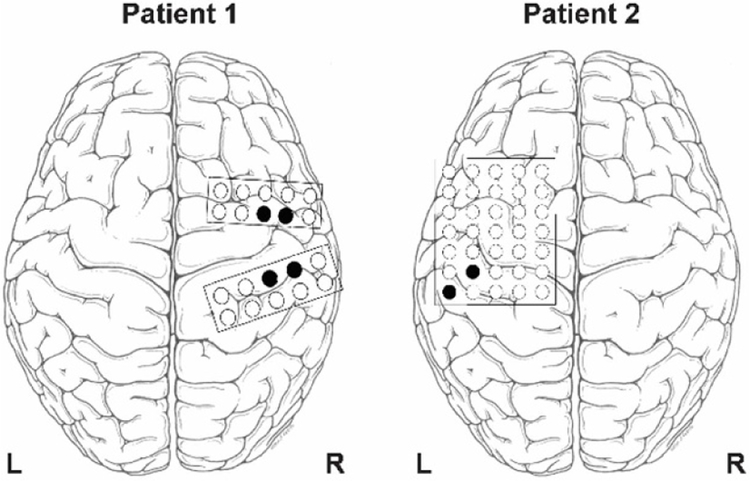
Electrocorticographic signals were recorded from the cortex of each patient, contralateral to the hand used to perform thumb and finger flexions. Signals were sampled at 30 kHz using a Neuroport signal processor (Blackrock Microsystems). The subjects had been implanted with clinical subdural ECoG grids (figure 1) for epilepsy treatment as previously described in [11]. Neural signals were subsampled to 10 kHz and common average referenced across each ECoG grid. Movement was defined as the 1-second period following movement onset, as measured by the DataGlove. Rest was defined as a time period over one second during which no movement was recorded. Three data sets were analyzed: one set of 27 trials from Patient 1 (P1a), a second set of 33 trials from Patient 1 performed on a separate day (P1b), and 29 trials from Patient 2 (P2).
Figure 1.
Electrode positions for the two subjects. Signals recorded from the black electrodes were used for analysis based on significant elevation in gamma power during finger flexion.
2.3. Fast Fourier Transform bandpass filtering (FFT)
Spectral analysis through FFT-based bandpass filtering assumes that fluctuations in activity can be characterized by sinusoids. Processing nonsinusoidal data with FFT may reveal non-existent harmonics, making it difficult to characterize cross-frequency coupling in neural signals [12]. Regardless, the simplicity of FFT makes it an ideal choice for many neural signal decoding tasks.
FFT of beta and gamma was performed using 8th order elliptic IIR bandpass filters with rectangular windows, implemented with MATLAB’s built-in designfilt function. The filter conditions were tested in previous studies and were shown to reliably decode hand posture and tactile responses in primate motor cortex [13]. Beta band cutoffs were 10 Hz and 30 Hz [14]; gamma cutoffs were 66 Hz and 114 Hz, to avoid 60 Hz harmonics [15].
2.4. Principal spectral component analysis (PSCA)
Principal component analysis is an adaptive processing algorithm that reduces the dimensionality of a dataset into predefined variables, known as principal components. PSCA is the application of this algorithm to a signal’s power spectral density [5]. Since this is a data-driven method, it can prove useful for decomposing the spectral data of complex neural signals. Previous work has used PSCA to accurately detect finger movement from cortical signals [10].
Power spectra with 1024 frequency points up to Nyquist frequency were computed using MATLAB’s pwelch function and normalized across trials. Principal component analysis was then applied to the normalized power spectra to obtain principal components and component scores. The first and second principal components were assumed to represent beta and gamma activity, respectively.
2.5. Wavelet analysis (WA)
Wavelet transforms provide temporally localized frequency analysis that can overcome the frequency-time resolution trade-offs exhibited by the short-time Fourier transform [16]. We utilized the widely-employed analytical Morlet wavelet [8] to construct a whole-signal scalogram between 5 Hz and 200 Hz with 1.95 Hz resolution. From this scalogram, we then extracted beta (10–30 Hz) and gamma (66–114 Hz) power by summing the squares of absolute coefficients in each frequency band.
2.6. Empirical mode decomposition (EMD)
EMD is a data processing tool introduced to process non-linear and non-stationary time series. The algorithm, developed by Huang et al, reduces a composite signal into a set of oscillatory time-series called intrinsic mode functions (IMFs) by iteratively subtracting the mean of the signal’s temporal envelope [7]. Prior work on analyzing neural recordings have identified significant non-sinusoidal characteristics, so we hypothesize that EMD can effectively isolate the characteristics by filtering the signal in a temporal fashion. Previous work has shown the utility of EMD in processing neural signals for many prediction tasks, including estimation of anesthetic depth, classification of epileptic seizures, and classification of finger flexion [9, 17, 18].
EMD was implemented using publicly available MATLAB code from Huang [19], with envelopes calculated using standard not-a-knot spline interpolation. We specified the algorithm to decompose neural signals to 9 IMFs, as subsequent IMFs did not contain any signal. EMD is an empirical approach, so beta and gamma bands were assigned based on the power spectral densities of each IMF. Based on spectral characteristics, we chose the 5th IMF to represent beta band and the 3rd IMF for gamma band for both patients.
2.7. Finger flexion analysis
Processed ECoG data from each of the four algorithms was used to train two sets of Naïve-Bayes classifiers. Extracted log power of beta was used to detect thumb movement. Extracted gamma was used to predict finger flexions of the thumb, index, and little finger, as beta power has been previously shown to produce poor finger decoding performance [13]. Decoder performance was measured using leave-one-out cross-validation. Analogous decoders using SVMs and LDA were also implemented to test for consistency across classifiers.
3. Results
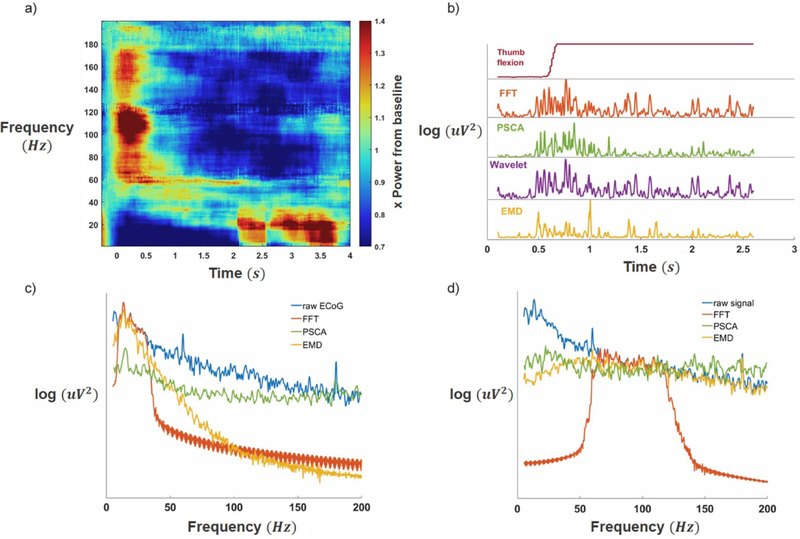
A subset of electrodes exhibited gamma band elevation during finger movement and were selected for analysis, as described in [13] (figure 1). Multi-taper spectral analysis using time-frequency tapers (taper dimension: 500 ms & 10 Hz) [20] shows gamma band synchrony and beta band depression during finger movement in a subset of electrodes (figure 2(a)). Gamma band elevation was significant (p < 0.05, 1-sided permutation test, false discovery rate corrected). Robust modulation of gamma power was observed on these electrodes during finger movement for all four algorithms (figure 2(b)). Each of the four algorithms extracted different representations of beta and gamma bands (figures 2(c) and (d)), with FFT producing the sharpest cut-offs.
Figure 2. Neural signal analysis scheme.
(a) Multi-taper spectral analysis: finger flexion begins at t = 0, leading to a significant elevation (p < 0.05, 1-sided permutation test, false discovery rate corrected) in the gamma band (66–144 Hz) and a suppression in the beta band (10–30 Hz) (b) Gamma power burst following thumb flexion from a representative electrode, as decoded by each of the four algorithms. (c) Spectral characteristics of beta. Note: wavelet power cannot be represented using classical power spectra. (d) Spectral characteristics of gamma. FFT produces sharp cut-off bands in both cases, whereas the other three algorithms produce more varied spectra.
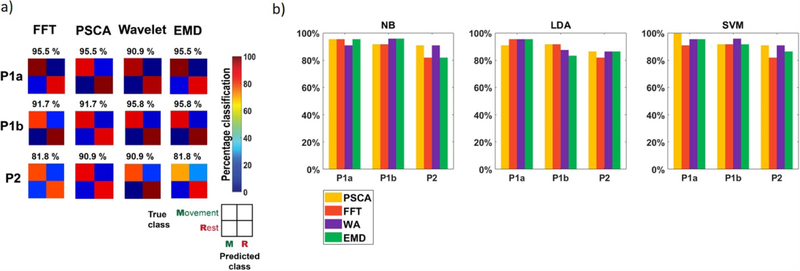
For all four signal processing methods, classification using beta band power achieved above-chance detection of thumb movement across all datasets (p < 10–3, binomial cumulative distribution test [21]) (figure 3). The McNemar test found no significant difference in performance between any of the four algorithms (p < 0.05).
Figure 3. Thumb movement detection using beta.
(a) Confusion matrices for Naïve-Bayes classifier results. Percentages above matrices indicate classification accuracies. All algorithms could predict thumb movement onsets above random chance (p < 10–3). Classification performance did not differ significantly between any of the four algorithms (p < 0.05, McNemar). (b) Comparison of beta accuracies based on classification method (NB = Naïve-Bayes, LDA = linear discriminant analysis, SVM = support vector machine). Classification performance is similar in all cases.
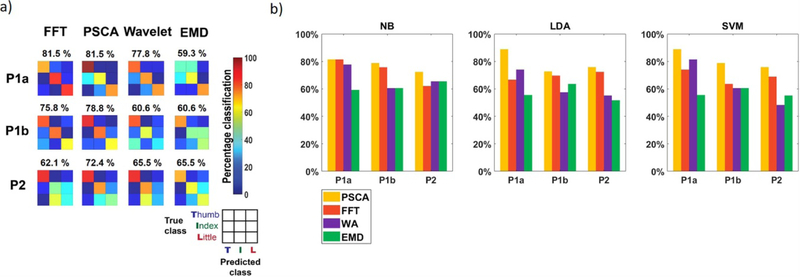
In decoding finger flexions using gamma band power, the classifier achieved above chance prediction accuracies for all four algorithms (p < 0.01) (figure 4). Averaging across all patient cases, the Naïve-Bayes decoder using PSCA-estimated gamma achieved an accuracy of 78% with a standard deviation of 4%. FFT (73 ± 8%), WA (68 ± 7%), and EMD (62 ± 3%) achieved lower decoding accuracies. For case P1a and P1b, the classification accuracies of PSCA and FFT were significantly greater than that of EMD (p < 0.05, McNemar test). Similar results were found when using SVM (FFT: 69 ± 4%; PSCA: 81 ± 6%; WA: 63 ± 14%; EMD: 57 ± 2%) and LDA decoders (FFT: 70 ± 2%; PSCA: 79 ± 7%; WA: 62 ± 8%; EMD: 57 ± 5%).
Figure 4. Finger flexion decoding using gamma.
(a) Confusion matrices for Naïve-Bayes classifier results. Percentage values above confusion matrices indicate classification accuracies. All algorithms could predict flexion above random chance (p < 0.01). Accuracies of PSCA and FFT are significantly greater than EMD in case P1a and P1b (p < 0.05, McNemar test). (b) Comparison of gamma accuracies based on classification method (NB = Naïve-Bayes, LDA = linear discriminant analysis, SVM = support vector machine). The hierarchy of performance between the four decomposition algorithms is comparable across all three classifier methods.
4. Discussion
This study reveals notable differences between the accuracies of human motor ECoG decoders using signals extracted by the fast Fourier transform (FFT), PSCA, WA, and EMD. While all algorithms classified finger flexions with an above random chance using extracted gamma, performance across algorithms varied significantly. Performance of beta-driven detection of thumb movement was similarly high across all algorithms.
Amongst the gamma representations used for finger decoding, PSCA estimates produced the most accurate classifications in nearly all cases. This finding supports the claim that neurophysiological signals are distributed over a broadband spectral distribution, rather than within clearly defined frequency bands. The adaptive nature of PSCA allows for active tuning of the processing pipeline for task-relevant signals, which could ensure reliable extraction of a wide variety of non-sinusoidal components. Other studies have demonstrated similar success with PSCA-extracted gamma in speech decoding [22, 23] and identification of visual stimuli [24, 25].
Conversely, WA and especially EMD-extracted gamma achieved markedly lower performance. Previous studies have shown utility in these algorithms’ ability to detect transients in neural signals [26–28]. However, these properties did not appear to have contributed significant additional information for extraction of gamma band power for motor decoding. The low performance of EMD, in particular, was notable in light of PSCA’s high performance and similar power spectra. This result is likely due to the algorithm’s tendency to behave as a series of dyadic filter banks when decomposing signals with flat power spectral densities [29], making it unsuitable for extraction of gamma band. As such, EMD and PSCA likely extracted qualitatively distinct signals, despite the wide spectral distribution of gamma observed with both algorithms. The findings here are supported by previous work showing similar accuracy for EMD-driven finger flexion classification [9]. In this analysis, we did not observe any mixing of spectral content in the resultant IMFs, precluding the need for noise assisted versions of EMD [30]. However, more sophisticated forms of EMD such as multivariate EMD, which have demonstrated success in predicting seizure onset [18], may warrant additional investigation.
Surprisingly, FFT estimates of control signals exhibited high performance, often on par with the much more sophisticated PSCA approach. This may be due, at least in part, to FFT’s long history of use in neural signal processing, which has functionally tuned conventional frequency cutoffs to physiologically relevant bands. The signal estimates from EMD, in comparison, were derived in a function and behavior-agnostic fashion, resulting in less-optimized outputs.
In contrast to the varied performance exhibited by each algorithm in gamma-driven decoders, classifiers using beta estimates from each decomposition seemed to perform equally well. This may be due to differences in the respective natures of beta and gamma oscillations. Although the causal relationship between recorded beta oscillations and behavior is still unclear, the occurrence of beta synchrony is known to signal specific states within the motor system [31]. In contrast, power in the more widely distributed gamma band correlates strongly with spiking activity and is thought to represent generalized neural local activity [32], representing a less precisely defined oscillatory phenomenon.
Since WA and EMD appear to provide accurate estimates of beta, they may prove valuable for examining temporal patterns of more spectrally focused low-frequency oscillations, such as alpha and beta. Calculations of phase-amplitude coupling and phase-locking value, for example, benefit significantly from EMD-derived signals over traditional bandpass filtering [33]. Recent studies have even suggested that some observed phase-amplitude coupling values may arise spuriously from non-sinusoidal features in the phase-carrier oscillation, a phenomena that may be suitable for extraction by EMD [3, 34, 35].
It should be noted that our comparisons were based on the performance of specific classifiers trained on a small sample of electrodes. While the simplicity of these models compared to other classifiers (K-nearest neighbors, neural networks, etc) make them a good start for prototyping decoding pipelines, the assumptions and characteristics of each classifier may influence performance. Likewise, individual variations in task-relevant neural signals may contribute meaningful variations in decomposition performance. Future studies involving larger datasets and comparisons of more sophisticated decoding algorithms are warranted.
5. Conclusion
In summary, this study compared the effectiveness of FFT, PSCA, WA, and EMD estimates of beta and gamma by training finger movement decoders using human cortical signals derived using each algorithm. We found that all four algorithms were equally accurate for prediction of finger movements using beta. In decoding finger flexions using gamma, PSCA and FFT produced the highest performance, while WA and EMD-extracted gamma resulted in lower performance. These results can inform the development of decoding pipelines in future studies that require extraction of a specific quality from human ECoG data.
References
- [1].Cole SR and Voytek B 2017. Brain oscillations and the importance of waveform shape Trends Cognit. Sci. 21 137–149 [DOI] [PubMed] [Google Scholar]
- [2].Miller KJ, Sorensen LB, Ojemann JG and den Nijs M 2009. Power-law scaling in the brain surface electric potential PLoS Comput. Biol. 5 e1000609. [DOI] [PMC free article] [PubMed] [Google Scholar]
- [3].Cole SR, van der Meij R, Peterson EJ, de Hemptinne C, Starr PA and Voytek B 2017. Nonsinusoidal beta oscillations reflect cortical pathophysiology in Parkinson’s disease J. Neurosci. 37 4830–40 [DOI] [PMC free article] [PubMed] [Google Scholar]
- [4].Manning JR, Jacobs J, Fried I and Kahana MJ 2009. Broadband shifts in local field potential power spectra are correlated with single-neuron spiking in humans J. Neurosci. 29 13613–20 [DOI] [PMC free article] [PubMed] [Google Scholar]
- [5].Jolliffe IT and Cadima J 2016. Principal component analysis: a review and recent developments Phil. Trans. R. Soc. A 374 20150202. [DOI] [PMC free article] [PubMed] [Google Scholar]
- [6].Mallat SG 1989. A theory for multiresolution signal decomposition: the wavelet representation IEEE Trans. Pattern Anal. Mach. Intell. 11 674–93 [Google Scholar]
- [7].Huang NE, Shen Z, Long SR, Wu MC, Shih HH, Zheng Q, Yen N-C, Tung CC and Liu HH 1998. The empirical mode decomposition and the Hilbert spectrum for nonlinear and non-stationary time series analysis Proc. R. Soc. A 454 903–95 [Google Scholar]
- [8].Zainuddin Z, Huong LK and Pauline O 2012. On the use of wavelet neural networks in the task of epileptic seizure detection from electroencephalography signals Procedia Comput. Sci. 11 149–59 [Google Scholar]
- [9].Hazrati MK and Hofmann UG 2012. Decoding finger movements from ECoG signals using empirical mode decomposition Biomed. Tech. 57 650–3 [Google Scholar]
- [10].Miller K, Zanos S, Fetz EE, den Nijs M and Ojemann JG 2009. Decoupling the cortical power spectrum reveals real-time representation of individual finger movements in humans J. Neurosci. 29 3132–7 [DOI] [PMC free article] [PubMed] [Google Scholar]
- [11].Irwin ZT et al. 2016. Enabling low-power, multi-modal neural interfaces through a common, low-bandwidth feature space IEEE Trans. Neural. Syst. Rehabil. Eng. 24 521–31 [DOI] [PubMed] [Google Scholar]
- [12].Kramer MA, Tort AB and Kopell NJ 2008. Sharp edge artifacts and spurious coupling in EEG frequency comodulation measures J. Neurosci. Methods 170 352–7 [DOI] [PubMed] [Google Scholar]
- [13].Chestek CA, Gilja V, Blabe CH, Foster BL, Shenoy KV, Parvizi J and Henderson JM 2013. Hand posture classification using electrocorticography signals in the gamma band over human sensorimotor brain areas J. Neural Eng. 10 026002. [DOI] [PMC free article] [PubMed] [Google Scholar]
- [14].Schmidt R, Herrojo M Ruiz, Kilavik BE, Lundqvist M, Starr PA and Aron AR 2019. Beta oscillations in working memory, executive control of movement and thought, and sensorimotor function J. Neurosci. 39 8231–8 [DOI] [PMC free article] [PubMed] [Google Scholar]
- [15].Schroeder KE, Irwin ZT, Bullard AJ, Thompson DE, Bentley JN, Stacey WC, Patil PG and Chestek CA 2017. Robust tactile sensory responses in finger area of primate motor cortex relevant to prosthetic control J. Neural Eng. 14 046016 [DOI] [PMC free article] [PubMed]
- [16].Cohen MX 2014. Analyzing Neural Time Series Data: Theory and Practice (Cambridge, MA: MIT press; ) [Google Scholar]
- [17].Huang J-R, Fan S-Z, Abbod M, Jen K-K, Wu J-F and and Shieh J-S 2013. Application of Multivariate empirical mode decomposition and sample entropy in EEG signals via artificial neural networks for interpreting depth of anesthesia Entropy 15 3325–9 [Google Scholar]
- [18].Cho D, Min B, Kim J and Lee B 2017. EEG-based prediction of epileptic seizures using phase synchronization elicited from noise-assisted multivariate empirical mode decomposition IEEE Trans. Neural. Syst. Rehabil. Eng. 25 1309–18 [DOI] [PubMed] [Google Scholar]
- [19].Research Center for Adaptive Data Analysis 2017. Hilbert Huang Transform MATLAB program (available from: http://rcada.ncu.edu.tw/research1.htm)
- [20].Percival DB and Walden AT 1993. Spectral Analysis for Physical Applications (Cambridge: Cambridge University Press; ) [Google Scholar]
- [21].Combrisson E and Jerbi K 2015. Exceeding chance level by chance: the caveat of theoretical chance levels in brain signal classification and statistical assessment of decoding accuracy J. Neurosci. Methods 250 126–36 [DOI] [PubMed] [Google Scholar]
- [22].Kellis S, Miller K, Thomson K, Brown R, House P and Greger B 2010. Decoding spoken words using local field potentials recorded from the cortical surface J. Neural Eng. 7 056007. [DOI] [PMC free article] [PubMed] [Google Scholar]
- [23].Miller KJ, Abel TJ, Hebb AO and Ojemann JG 2011. Rapid online language mapping with electrocorticography J. Neurosurg. Pediatrics 7 482–90 [DOI] [PMC free article] [PubMed] [Google Scholar]
- [24].Miller KJ et al. 2009. Detection of spontaneous class-specific visual stimuli with high temporal accuracy in human electrocorticography. 2009 Annual Int. Conf. of the IEEE Eng. Med. Biol. Soc. pp 6465–8 [DOI] [PubMed]
- [25].Miller K J et al. 2010. Dynamic modulation of local population activity by rhythm phase in human occipital cortex during a visual search task Front. Hum. Neurosci. 4 197. [DOI] [PMC free article] [PubMed] [Google Scholar]
- [26].Lopes-dos-santos V et al. 2017. Extracting information from the shape and spatial distribution of evoked potentials J. Neurosci. Methods 296 12–22 [DOI] [PMC free article] [PubMed] [Google Scholar]
- [27].Lopes-dos-santos V, Panzeri S, Kayser C, Diamond ME and Quian R Quiroga 2014. Extracting information in spike time patterns with wavelets and information theory J. Neurophysiol. 113 1015–33 [DOI] [PMC free article] [PubMed] [Google Scholar]
- [28].Pigorini A, Casali AG, Casarotto S, Ferrarelli F, Baselli G, Mariotti M, Massimini M and Rosanova M 2011. Time-frequency spectral analysis of TMS-evoked EEG oscillations by means of Hilbert-Huang transform J. Neurosci. Methods 198 236–45 [DOI] [PubMed] [Google Scholar]
- [29].Flandrin P, Rilling G and Goncalves P 2004. Empirical mode decomposition as a filter bank IEEE Signal Process. Lett. 11 112–4 [Google Scholar]
- [30].Yeh J-R, Shieh J-S and Huang NE 2010. Complementary ensemble empirical mode decomposition: A novel noise enhanced data analysis method Adv. Adapt. Data Anal. 2 135–56 [Google Scholar]
- [31].Khanna P and Carmena JM 2015. Neural oscillations: beta band activity across motor networks Curr. Opin. Neurobiol. 32 60–67 [DOI] [PubMed] [Google Scholar]
- [32].Rasch MJ, Gretton A, Murayama Y, Maass W and Logothetis NK 2008. Inferring spike trains from local field potentials J. Neurophysiol. 99 1461–76 [DOI] [PubMed] [Google Scholar]
- [33].Pittman-Polletta B, Hsieh W-H, Kaur S, Lo M-T and Hu K 2014. Detecting phase-amplitude coupling with high frequency resolution using adaptive decompositions J. Neurosci. Methods 226 15–32 [DOI] [PMC free article] [PubMed] [Google Scholar]
- [34].De Hemptinne C, Ryapolova-Webb ES, Air EL, Garcia PA, Miller KJ, Ojemann JG, Ostrem JL, Galifianakis NB and Starr PA 2013. Exaggerated phase–amplitude coupling in the primary motor cortex in Parkinson disease Proc. Natl Acad. Sci. 110 4780–5 [DOI] [PMC free article] [PubMed] [Google Scholar]
- [35].Cole SR and Voytek B 2019. Cycle-by-cycle analysis of neural oscillations J. Neurophysiol. 122 849–61 [DOI] [PubMed] [Google Scholar]


