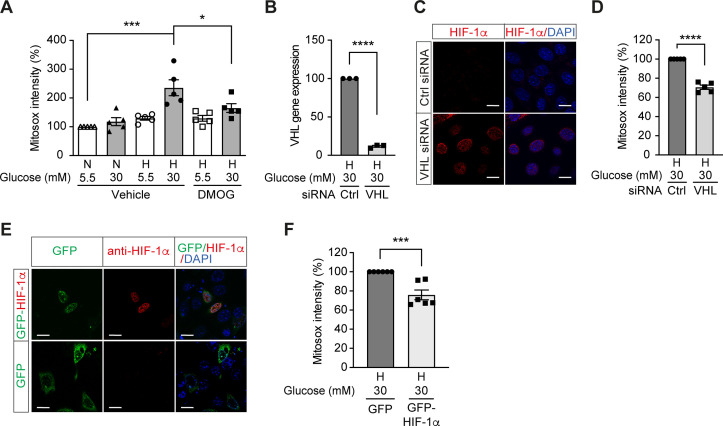
Figure 3. High glucose levels induce mitochondrial ROS overproduction in hypoxia, which can be rescued by promoting HIF-1 function.
(A) Mitochondrial ROS levels were measured as mitosox intensity in mIMCD-3 cells cultured in normal (5.5 mM) or high (30 mM) glucose media in normoxia (N) or hypoxia (H) for 24 hr in the presence of DMOG or vehicle (n = 5). (B–D) mIMCD-3 cells were transfected with von Hippel–Lindau tumour suppressor (VHL) or control (Ctrl) siRNA, and exposed to hypoxia (H) and 30 mM glucose for 24 hr. VHL gene expression (B, n = 3), endogenous HIF-1α expression (red) and DAPI staining (blue) (C) and mitochondrial ROS levels (D, n = 5) were assessed using quantitative RT-PCR, fluorescent immunocytochemistry and flow cytometry, respectively. (E and F) mIMCD-3 cells were transfected with plasmids encoding GFP or GFP-HIF-1α,and exposed to hypoxia and 30 mM glucose for 24 hr. (E) Expression of GFP and GFP-HIF-1α (green) were detected using confocal microscopy. The nuclear HIF-1α expression was confirmed by immucytochemistry using anti-HIF-1α antibody (red). Nuclei were stained blue with DAPI. (F) Mitochondrial ROS levels are shown (n = 6). The mitosox intensity of cells cultured under control conditions were considered as 100%. Data are shown as mean ± SEM. *, p < 0.05; ***, p < 0.001; ****, p < 0.0001 using one-way ANOVA followed by Bonferroni’s post hoc test (A), and unpaired two-sided Student t-test (B, D and F). This figure has two figure supplements. Source data are shown in Figure 3—source data 1. Scale bar: 50 μm.


