. 2022 Feb 15;11:e70714. doi: 10.7554/eLife.70714

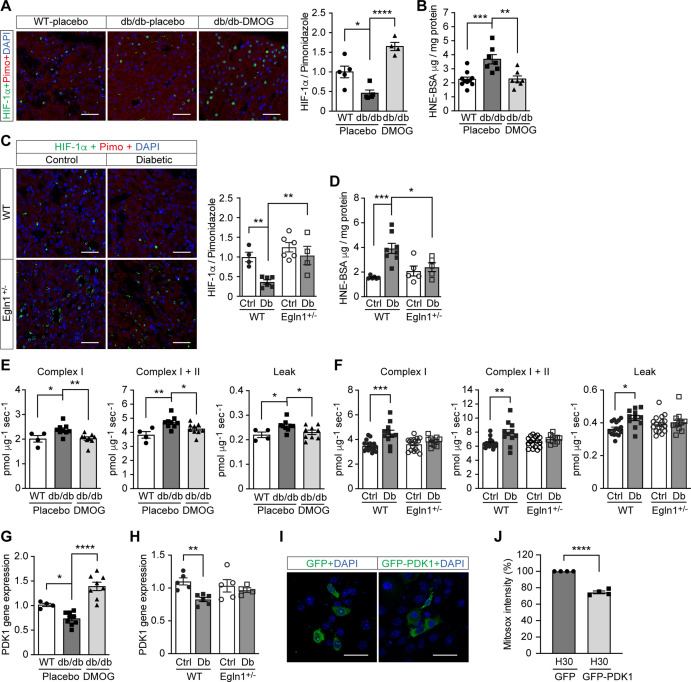
Figure 4. Promoting HIF-1 function attenuates renal ROS excess and mitochondrial respiration in mouse models of diabetes.

Kidneys were harvested from wild-type (WT) and Leprdb/db diabetic mice (db/db) that were treated with placebo (vehicle) or DMOG (A–B, E, G), and from non-diabetic control (Ctrl) or diabetic (Db) wild-type (WT) and Egln1+/- mice (C–D, F, H). (A and C) HIF-1α (green), pimonidazole (red, hypoxia marker) and DAPI (blue, nuclear staining) signals were detected by fluorescent immunohistochemistry, and relative HIF-1α expression levels were quantified (A, n = 4–5; C, n = 4–6). Scale bar: 100 μm. (B and D) Renal ROS levels were detected using the OxiSelect HNE adduct competitive ELISA kit (B, n = 7–10; D, n = 5–8). (E and F) Mitochondrial respiratory function was evaluated using high resolution respirometry (E, n = 4–9; F, n = 11–17). (G and H) PDK1 gene expression in kidneys (G, n = 4–9; H, n = 4–6). (I and J) mIMCD-3 cells were transfected with plasmids encoding GFP or GFP-PDK1,and exposed to hypoxia and 30 mM glucose (H30) for 24 hr. (I) Expression of GFP and GFP-HIF-1α (green) and nuclear DAPI staining (blue) were detected using confocal microscopy. Scale bar: 50 μm. (J) Mitochondrial ROS levels are shown (n = 4). Data are shown as mean ± SEM. *, p < 0.05; **, p < 0.01; ***, p < 0.001; ****, p < 0.0001 using one-way ANOVA (A, B, E, G) and two-way ANOVA (C, D, F, H) followed by multi-comparison post hoc tests, and unpaired two-sided Student t-test (J). This figure has three figure supplements. Source data are shown in Figure 4—source data 1.

Figure 4—source data 1. HIF-1α, ROS, and mitochondrial respiration levels in mouse kidneys and PDK1 gene expression and Mitosox intensity in mIMCD3 cells.

Figure 4.

Figure 4—figure supplement 1. Kidney in diabetes is more hypoxic.
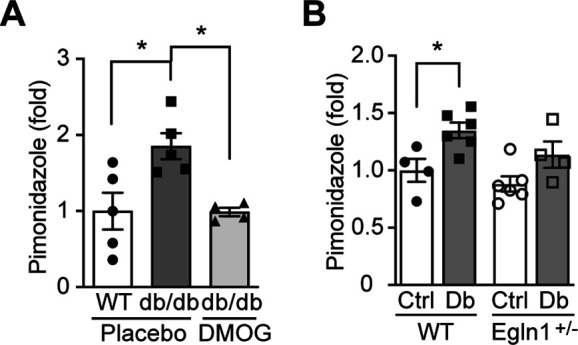
Figure 4—figure supplement 1.

Pimonidazole (60 mg/kg body weight) was i.p. administered to mice 90 min prior to tissue harvest from wild-type (WT) and Leprdb/db diabetic mice (db/db) that were treated with placebo (vehicle) or DMOG (A), and from non-diabetic control (Ctrl) or diabetic (Db) wild-type (WT) and Egln1+/- mice (B). Pimonidazole adducts were detected on kidney sections using fluorescent immunohistochemistry and fold induction of pimonidazole signal is shown. *, p < 0.05 using one-way ANOVA (A) and two-way ANOVA (B) followed by multi-comparison post hoc tests. Source data are shown in Figure 4—figure supplement 1—source data 1.
Figure 4—figure supplement 1—source data 1. Quantification of Pimonidazole immunofluorescent signal in mouse kidneys.
Figure 4—figure supplement 2. DMOG increases HIF-1 target gene expression in Leprdb/db mice without affecting blood glucose levels.

Figure 4—figure supplement 2.

Leprdb/db diabetic mice (db/db) were treated with placebo (vehicle) or DMOG (50 mg / kg) for 4 weeks. (A) There was no difference in blood glucose in Leprdb/db mice treated with placebo or DMOG (n = 7). (B) QPCR results demonstrate that DMOG increased the gene expression of HIF-1 target genes (n = 4–5). Data are shown as mean ± SEM. ns = not significant. **, p < 0.01; ****, p < 0.0001 analysed using unpaired two-sided Student’s t-test. Source data are shown in Figure 4—figure supplement 2—source data 1.
Figure 4—figure supplement 2—source data 1. Blood glucose and HIF-1 target gene expression levels in Leprdb/db mice.
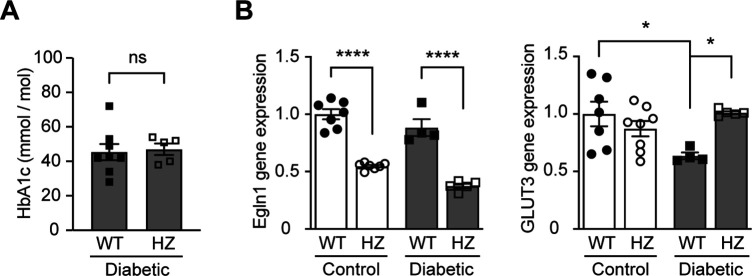
Figure 4—figure supplement 3. Egln1 haplodeficiency increases HIF-1 target gene expression in diabetic mice without affecting blood glucose levels.

Figure 4—figure supplement 3.

Egln1 haplodeficient (Egln1+/-, HZ) and corresponding Wild-type (WT) mice were induced diabetes using STZ. HbA1c (A) and gene expression (B) of Egln1 and HIF-1 target gene GLUT3 were assessed in non-diabetic control and diabetic WT and Egln1+/- mice (n = 4–8). Data are shown as mean ± SEM, and were analyzed using unpaired two-sided Student’s t-test (A) and two-way ANOVA followed by Bonferroni’s post hoc test (B). ns = not significant; *, p < 0.05; ****, p < 0.0001. Source data are shown in Figure 4—figure supplement 3—source data 1.
Figure 4—figure supplement 3—source data 1. HbA1c and gene expression levels in Egln1+/- and WT mice.