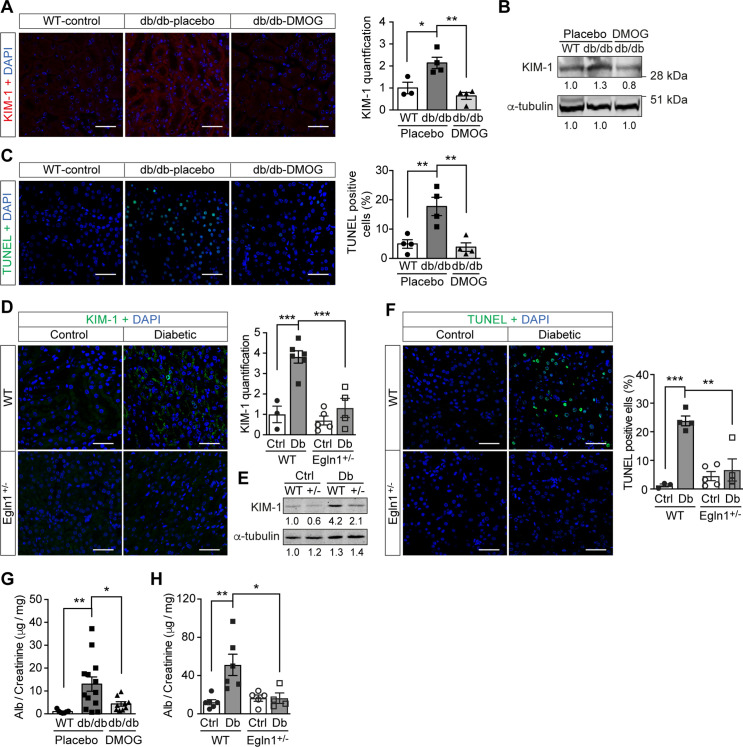
Figure 5. Promoting HIF-1 function reduces renal injury and ameliorates renal dysfunction in mouse models of diabetes.
Kidneys were harvested from wild-type (WT) and Leprdb/db diabetic mice (db/db) that were treated with placebo (vehicle) or DMOG (A–C, G), and from non-diabetic control (Ctrl) or diabetic (Db) wild-type (WT) and Egln1+/- (+/-) mice (D–F, H). (A and D) Representative images of KIM-1 (red or green) and DAPI (blue) in kidney that were analysed using fluorescent immunohistochemistry. Quantifications of KIM-1 fluoresent signal are shown in corresponding histogram (A, n = 3–4; D, n = 3–6). (B and E) Representative images of KIM-1 and α-tubulin analyzed by western blotting. (C and F) Apoptotic cells were detected using TUNEL staining, and the percentage of TUNEL-positive cells were quantified (C, n = 4; F: n = 3–5). (G and H) Albuminuria is presented as the ratio of albumin (Alb) to creatinine in mouse urine (G, n = 7–13; H, n = 4–6). Data are shown as mean ± SEM. *, p < 0.05; **, p < 0.01; ***, p < 0.001 analysed using one-way ANOVA (A, C), Brown-Forsythe and Welch ANOVA (G) and two-way ANOVA (D, F, H) followed by multi-comparison test. Source data are shown in Figure 5—source data 1. Scale bar: 100 μm.

