

Abstract
Lactate has been shown to be an important oxidative fuel. We aimed to quantify the total lactate oxidation rate (Rox) and its direct vs. indirect (glucose that is gluconeogenically derived from lactate and subsequently oxidized) components (mg·kg−1·min−1) during rest and exercise in humans. We also investigated the effects of endurance training, exercise intensity, and blood lactate concentration ([lactate]b) on direct and indirect lactate oxidation. Six untrained (UT) and six trained (T) men completed 60 min of constant load exercise at power outputs corresponding to their lactate threshold (LT). T subjects completed two additional 60-min sessions of constant load exercise at 10% below the LT workload (LT−10%), one of which included a lactate clamp (LC; LT−10%+LC). Rox was higher at LT in T [22.7 ± 2.9, 75% peak oxygen consumption (V̇o2peak)] compared with UT (13.4 ± 2.5, 68% V̇o2peak, P < 0.05). Increasing [lactate]b (LT−10%+LC, 67% V̇o2peak) significantly increased lactate Rox (27.9 ± 3.0) compared with its corresponding LT−10% control (15.9 ± 2.2, P < 0.05). Direct and indirect Rox increased significantly from rest to exercise, and their relative partitioning remained constant in all trials but differed between T and UT: direct oxidation comprised 75% of total lactate oxidation in UT and 90% in T, suggesting the presence of training-induced adaptations. Partitioning of total carbohydrate (CHO) use showed that subjects derived one-third of CHO energy from blood lactate, and exogenous lactate infusion increased lactate oxidation significantly, causing a glycogen-sparing effect in exercising muscle.
Keywords: lactate oxidation, gluconeogenesis, glucose, muscle glycogen, exercise, training, stable isotope tracers
lactate is now widely recognized as an important oxidative fuel (8, 12, 17, 27, 29, 32, 42, 58, 60) rather than a dead-end waste product of anaerobic metabolism. Under resting conditions, lactate uptake from the circulation occurs in various tissues, including but not exclusive to cardiac muscle (22, 41, 57, 80), skeletal muscle (8, 9, 21, 27, 33, 43, 68, 71, 72), and brain (51, 71) for oxidative metabolism, and liver and kidneys for gluconeogenesis (GNG) (7, 35, 52, 58, 66). Lactate has also been shown to contribute directly to glycogen synthesis in liver and indirectly in muscle (2-4, 14, 61). Previous measurements of lactate rates of disposal (Rd) and oxidation (Rox) in humans have used methods, including arterio-venous difference measurements (8, 19, 21, 77), infusion of isotope tracers (15, 41, 58–60, 64, 65, 76–78), and muscle biopsies (8, 19, 53), all of which have shown that during continuous exercise, most lactate disposal occurs via oxidation in working skeletal muscle. However, because lactate is the primary gluconeogenic precursor, availability of the presence of high levels of lactate in the circulation supports GNG and the production of glucose (7, 32, 35, 52, 58, 66), which may subsequently undergo oxidation.
When circulating lactate enters cells for oxidative disposal, the route is considered to be “direct oxidation” of blood lactate. Conversely, when lactate is converted to glucose through hepatic or renal GNG, subsequent oxidation of the lactate-derived glucose monomer can be considered as “indirect oxidation” of the precursor lactate. Most studies using the methodologies described above either do not discriminate between or lack the means to measure these two routes of lactate oxidation simultaneously. Thus the present investigation aimed to quantify the direct and indirect lactate Rox during rest and exercise in humans and to investigate the individual and combined effects of endurance training, exercise intensity, and blood lactate concentration ([lactate]b) on their relative partitioning.
We hypothesized that endurance training increases direct lactate oxidation during exercise, whether determined at a given relative exercise intensity, as assessed by peak oxygen consumption (%V̇o2peak), or at the lactate threshold (LT). Characterized as the onset of rapid blood lactate accumulation, the LT was selected as the target exercise intensity because of its association with endurance exercise performance and its widespread use in the management of endurance training (28, 62, 74, 82). Furthermore, exercise training has been shown to exert a profound effect on the LT through whole-body adaptations, including an enhanced capacity for lactate clearance (8, 10, 32, 59, 75, 81). To test our hypothesis of a training-induced enhancement of lactate clearance via oxidation, we studied endurance-trained (T) and untrained (UT) men exercising at LT, and we used indirect calorimetry and stable isotope tracers to determine glucose and lactate fluxes and lactate Rox. As well, we incorporated a lactate clamp (LC) component, involving exogenous infusion, to test the hypothesis that an increase in blood lactate availability would increase direct lactate oxidation, sparing the use of other carbohydrate (CHO) sources, specifically, muscle glycogen and blood glucose.
METHODS
This manuscript presents results from a large investigation of lactate and glucose metabolism during exercise at the LT. Many details of methodology are reported separately (35, 63) but are repeated here for the convenience of the reader.
Subjects.
Twelve healthy male subjects (six UT and six T), aged 19–33 yr, were recruited from the University of California, Berkeley, campus and the surrounding community by posted notices, word of mouth, and e-mail. UT subjects were healthy and recreationally active (V̇o2peak <50 ml·kg−1·min−1); T subjects were members of competitive cycling or triathlon teams, currently in the race phase of their training season (V̇o2peak >55 ml·kg−1·min−1). Subjects were included in the study if they had a body mass index ≥18 and <26 kg/m2, were nonsmokers, were diet and weight stable, had a forced expiratory volume in 1 s:forced vital capacity ratio >70%, and were injury/disease free, as determined by physical examination. This study was approved by the University of California, Berkeley, Committee for the Protection of Human Subjects (CPHS 2010-4-1300) and conformed to the standards set by the Declaration of Helsinki. All subjects gave written, informed consent before participation in the study.
Preliminary testing.
Exercise tests were performed on an electronically braked leg-cycle ergometer (Monark Ergomedic 839E; Monark Exercise AB, Vansbro, Sweden) and were conducted at least 1 wk apart. Following interviews and screening, subjects performed two graded exercise tests to determine V̇o2peak and LT. To determine V̇o2peak, as per the American College of Sports Medicine Guidelines (7th edition), exercise power output (PO) started at 75 or 120 W and was increased by 25 or 30 W for the UT and T groups, respectively, every 3 min until volitional fatigue. Expired respiratory gases were monitored continuously throughout the test via an open-circuit, automated, indirect calorimetry system (TrueOne metabolic system; ParvoMedics, Sandy, UT) that was calibrated using room air and a certified calibration gas. Finger pricks drawing 10 μl blood were conducted at the end of each stage to measure [lactate]b via portable lactate analyzers (Lactate Plus; Nova Biomedical, Waltham, MA) and to approximate the PO eliciting the LT.
To determine LT, a second graded exercise test started at 50 W below the approximated LT PO and increased by 10 W every 3 min until volitional exhaustion. At the end of every stage, 1 ml blood was drawn from a warmed “arterialized” hand vein for enzymatic analysis of [lactate]b, which increased slowly with exercise work rate until a certain PO. After this point, a rapid acceleration in blood lactate accumulation occurred. The LT was considered to be the last stage of the slow increase in [lactate]b before the rapid acceleration in lactate accumulation. This definition of the LT is termed by some as the second lactate turn point (47). For both graded exercise tests, heart rate was monitored continuously using a heart-rate monitor (Polar, Gays Mills, WI) and electrocardiography (Q750 ECG, Quinton Instrument Company, Seattle, WA); rating of perceived exertion (RPE) was recorded, according to the Borg scale (11); and blood pressure was measured at the middle of every stage by manual auscultation.
On a subsequent day, subjects performed 60 min of continuous exercise at the PO corresponding to their LT to ensure stabilization of [lactate]b over the entire duration of the exercise test. Every 10 min, finger pricks, drawing 10 μl blood, were conducted to measure [lactate]b, and heart rate and RPE were monitored.
Experimental design.
The study design consisted of four conditions using stable isotope tracers: one condition within the UT group and three conditions within the T group. UT subjects completed one isotope infusion trial, consisting of a 90-min rest period, followed by 60 min of continuous cycling at the LT. T subjects completed three isotope infusion trials, each consisting of a 90-min rest period, followed by 60 min of continuous leg-ergometer cycling under one of the following conditions: 1) PO eliciting the LT, 2) PO 10% below that eliciting the LT (LT−10%), and 3) LT−10% but with a LC (exogenous lactate infusion) to raise [lactate]b to the LT level (LT−10%+LC). The order of the last two conditions was randomized, and all exercise trials were conducted at least 1 wk apart. For the day before each trial, subjects were instructed to abstain from structured exercise or hard physical activity but to continue typical activities of daily living.
To evaluate the effects of training on metabolic responses, we compared UT and T groups exercising at the same [lactate]b but different absolute and relative intensities (UT-LT vs. T-LT); at the same relative intensity but different [lactate]b (UT-LT vs. T-LT−10%); and at the same relative intensity and [lactate]b (UT-LT vs. T-LT−10%+LC). Within the T group, we investigated the effects of exercise intensity given the same [lactate]b (LT vs. LT−10%+LC); the effects of [lactate]b given the same exercise intensity (LT−10% vs. LT−10%+LC); and the combined effects of [lactate]b and exercise intensity (LT vs. LT−10%).
Dietary controls.
Three-day diet records were collected before the study to record subjects' caloric intake and macronutrient composition (Diet Analysis Plus, version 6.1; ESHA Research, Salem, OR). Subjects also provided complete 24-h diet records of the day preceding each exercise session. Standardized diets (∼50% CHO, 30% fat, 20% protein) were given the day before each exercise trial, including dinner and an evening snack as the last meal. Diets, consisting of an average of 2,400 and 3,200 kcal for the UT and T groups, respectively, were individualized and determined for each participant considering a physical-activity level (54) of 1.25 for UT and 1.48 for T, according to the current Dietary Reference Intake guidelines of the Institute of Medicine for Estimated Energy Requirement. Subjects came to the laboratory overnight fasted, and exercise commenced 12 h after consuming the evening snack. No food or beverages were allowed except water (ad libitum) until the end of the exercise session.
Isotope tracer protocol.
Subjects reported to the laboratory on the morning of each isotope tracer trial, and expired respiratory gases were sampled for a measurement of background 13CO2 enrichment. A catheter was then placed into a warmed hand vein for arterialized blood sampling, and a background sample was collected. Through a second catheter placed in the antecubital vein of the contralateral arm, subjects received a primed, continuous infusion of [6,6-2H2]glucose (D2-glucose) and [3-13C]sodium-lactate (Sigma-Aldrich, St. Louis, MO). Isotopes were diluted in 0.9% sterile saline and were tested for pyrogenicity and sterility [School of Pharmacy, University of California, San Francisco (UCSF), CA] and passed through a 0.2-μm Millipore filter (Nalgene, Rochester, NY) before infusion. Priming boluses contained 250 mg D2-glucose, 57.5 mg [3-13C]sodium-lactate, and 136 mg [13C]sodium-bicarbonate (Isotec; Sigma-Aldrich). Glucose and lactate tracers were then infused continuously for the 90-min rest period via a calibrated pump (Baxter Colleague 3CX; Baxter, Deerfield, IL) at 2.0 mg/min for glucose and 2.5 mg/min for lactate in all trials, with the exception of the LT−10%+LC trial that had a resting infusion rate of 7.5 mg/min for lactate. The LT−10%+LC trial also included infusion of an unlabeled lactic acid-sodium hydroxide mixture to target a specific [lactate]b during the rest period (see LC procedure). At the start of all exercise trials, tracer infusion rates were increased to 8 mg/min for glucose and 11.25 mg/min for lactate for the UT group and 10 mg/min for glucose and 15 mg/min for lactate for the T group and continued for 60 min of exercise.
LC procedure.
In the LT−10%+LC trial, a LC procedure was performed, as described previously (65). An unlabeled lactate cocktail was prepared by mixing a 30% lactic acid solution (Sigma-Aldrich) in 2 N sodium hydroxide to a pH of 4.8 and subsequently tested for pyrogenicity and sterility at the UCSF School of Pharmacy. During the rest period, unlabeled lactate infusion began at 4.9 mg·kg−1·min−1 to raise [lactate]b to that obtained individually during the LT trial. Infusion rates were adjusted during rest and exercise to maintain the target [lactate]b, as determined by a portable lactate analyzer.
Blood and respiratory gas sampling.
Arterialized blood was drawn from a warmed hand vein for metabolite, isotopic enrichment (IE), and hormonal analyses at 0 (background), 60, 75, and 90 min of rest and 10, 20, 30, 40, 50, and 60 min of exercise. Hematocrit was also measured at each time point using a circular microcapillary tube reader (No. 2201; International Equipment, Needham Heights, MA). Blood for [glucose], [lactate], and IE determinations was deproteinized immediately with 8% perchloric acid, shaken, and placed on ice. All samples were centrifuged at 3,000 g for 18 min, and the supernatant was transferred to storage tubes and frozen at −80°C until analysis.
Respiratory gases were analyzed continuously via indirect calorimetry for 5 min before and coincident with blood sampling. These measurements were used for calculation of V̇o2, carbon dioxide production (V̇co2), respiratory exchange ratio (RER), and minute ventilation. Duplicate samples of expired air were collected in 10-ml evacuated containers for 13CO2 IE determinations. Careful attention was placed on flushing the line and sampling expired CO2 at the same time as blood was drawn for glucose and lactate IE. Heart rate, blood pressure, and RPE measurements were also recorded at the same frequency as blood and breath sampling.
Metabolite concentration and IE analyses.
Methods for the determination of [glucose] (35), [lactate] (63), and IEs have been described previously. Briefly, known amounts of uniformly labeled internal standards [U-13C]glucose and [U-13C]lactate were added to the supernatant samples, collected in 8% perchloric acid. Samples were then neutralized with 2 N KOH and transferred to ion exchange columns that were washed previously with double deionized water (ddH2O) through a cation resin (Analytical Grade 50W-X8, 50–100 mesh H+ resin; Bio-Rad Laboratories, Hercules, CA) and with ddH2O, followed by 2 N formic acid through an anion resin (Analytical Grade 1-X8, 100–200 mesh formate resin). Glucose was eluted first with ddH2O, followed by elution of lactate through the anion column with 2 N formic acid. Subsequent glucose analyses and kinetics data are reported separately (35).
Lactate IE was determined by GC-MS (GC model 6890 series and MS model 5973N; Agilent Technologies, Santa Clara, CA) of the N-propylamide heptafluorobutyrate derivative, where methane was used for selected ion monitoring of mass:charge ratios 328 (unlabeled lactate), 329 (mass+1 isotopomer, [3-13C]lactate), and 331 (mass+3 isotopomer, [U-13C]lactate internal standard). Whole [lactate]b was determined by abundance ratios of 328:331. Selected ion abundances were compared against external standard curves for calculation of concentration and IE.
Breath samples were analyzed via isotope ratio MS by Metabolic Solutions (Nashua, NH).
Calculations.
For calculations of Rox, data from the last 30 min of rest (i.e., 60, 75, and 90 min) and the last 20 min of steady-rate exercise (i.e., 40, 50, and 60 min) were used. Lactate rates of appearance (Ra), Rd, and metabolic clearance (MCR) are reported separately (63). Total lactate Rox (mg·kg−1·min−1) was calculated from expired CO2 and IECO2 (85)
| (1) |
| (2) |
where IECO2 is the excess IE of expired 13CO2; V̇co2 is in l/min; 90.08 is the molecular weight of [3-13C]lactate; F is the [3-13C]lactate infusion rate in mg·kg−1·min−1; k is the correction factor for the retention of CO2 in body pools, as determined previously (46) to be 0.83 at rest and 1.0 during exercise; and 22.4 is the molar volume of CO2, a nonideal gas under standard temperature and pressure conditions.
Calculations for the rate of GNG from lactate (Rgng; mg·kg−1·min−1) and glucose Rd (mg·kg−1·min−1) are reported separately (35). Indirect and direct Rox (both in mg·kg−1·min−1) and glucose Rox (mg·kg−1·min−1) were calculated
| (3) |
| (4) |
| (5) |
where c is relative glucose oxidation, as determined previously to be 0.25 at rest, 0.20 at rest with LC (65), and 0.80 during exercise, with and without LC (38, 39, 64, 65).
Because exogenous lactate infusion was not expected to affect lipid oxidation (23, 36), the overall CHO Rox (mg·kg−1·min−1) was derived from the equation of Consolazio et al. (26), assuming negligible contribution of protein oxidation
| (6) |
where V̇co2 and V̇o2 are in l/min; and m is the subject's body mass in kg. The muscle glycogen Rox (mg·kg−1·min−1) was calculated as the remaining CHO use after glucose and lactate
| (7) |
Because indirect lactate Rox is included in the measurement for glucose Rox, only direct lactate Rox was used for the determination of glycogen Rox. Lipid Rox (g/min) was also calculated from the equation of Consolazio et al. (26), assuming negligible contribution of protein oxidation
| (8) |
From oxidation values, we estimated further caloric expenditures (kcal/min) from lactate, glucose, muscle glycogen, and lipid using 4.2 and 9.5 for kilocalories, provided/gram of oxidized CHO and lipid, respectively.
Statistical analyses.
Significance of differences in subject characteristics between UT and T groups was analyzed using an unpaired Student's t-test. Differences in metabolic parameters between the UT and the three T conditions within rest and exercise were analyzed using a one-way ANOVA. Analyses within the T conditions were done with repeated measures. Post hoc analyses were made using Fisher's least significant difference multiple comparisons test. Differences from rest to exercise were analyzed using a paired Student's t-test. Statistical significance was set at α = 0.05, and values are represented as means ± SE.
RESULTS
Anthropometric and dietary data of UT and T subjects as well as cardioventilatory and hormonal responses to graded tests and isotope tracer trials are reported separately (35, 63). Glucose (35) and lactate (63) kinetics data, including Ra, Rd, and MCR, are also reported separately. Some previously presented results are repeated here for the convenience of the reader or when used for novel calculations.
IE of expired 13CO2.
IEs of expired 13CO2, presented as atom percent excess (APE) over time (Fig. 1), was significantly higher in the LT−10%+LC trial compared with the LT and LT−10% trials in the T group at rest (P < 0.05). Greater 13CO2 during the LC protocol was consistent with the increased lactate tracer infusion rates that were three times higher in the LC protocol during the rest period than those during the non-LC trials. During exercise, APE of expired 13CO2 in the LT−10%+LC trial was significantly higher compared with the T-LT trial (P < 0.05), despite equal [lactate]b (Table 1) and tracer infusion rates. During the transition from rest to exercise, the increase in tracer infusion rate closely matched the increase in metabolic rate, as a slight, although significant, increase in 13CO2 APE was observed in all trials (P < 0.05), except for the T-LT trial (P = 0.07), corroborating an increased flux and metabolism of endogenous lactate in T subjects exercising at the LT.
Fig. 1.

Atom percent excess (APE) of expired 13CO2 during rest and exercise. Values are means ± SE, n = 6, for untrained (UT) and trained (T) groups. ^Significantly different from rest within condition (P < 0.05); £significantly different from T lactate threshold (LT; P < 0.05); †significantly different from T-LT−10% (P < 0.05). LC, lactate clamp.
Table 1.
Workload, lactate concentration, and lactate disposal distribution during rest and exercise
| Rest |
Exercise |
|||||||
|---|---|---|---|---|---|---|---|---|
| Variable | Untrained LT | Trained LT | Trained LT−10% | Trained LT− 10%+LC | Untrained LT | Trained LT | Trained LT−10% | Trained LT− 10%+LC |
| Power output, W | 161 ± 4 | 259 ± 10* | 234 ± 9*† | 234 ± 9*† | ||||
| %V̇o2peak, % | 67.6 ± 1.3 | 74.8 ± 1.7* | 66.6 ± 1.4† | 67.9 ± 1.5† | ||||
| Lactate, mmol/l | 0.6 ± 0.1 | 1.3 ± 0.1 | 1.1 ± 0.1 | 4.4 ± 0.4*†‡ | 3.7 ± 0.4§ | 4.3 ± 0.2§ | 2.5 ± 0.5*†§ | 4.3 ± 0.3‡ |
| Lactate Rd, mg·kg−1·min−1 | 1.8 ± 0.1 | 2.6 ± 0.6 | 2.4 ± 0.5 | 6.6 ± 0.7*†‡ | 15.0 ± 2.8§ | 24.2 ± 2.8*§ | 18.1 ± 2.6§ | 28.4 ± 2.7*‡§ |
| %Lactate Rd to glucose via GNG | 50.4 ± 10.6 | 20.4 ± 4.7* | 22.6 ± 6.0* | 6.2 ± 1.4*†‡ | 25.7 ± 6.4§ | 8.5 ± 3.0*§ | 9.0 ± 1.7*§ | 15.9 ± 3.7§ |
| %Lactate Rd oxidized, total | 45.9 ± 1.8 | 45.8 ± 0.7 | 45.3 ± 2.3 | 23.7 ± 3.7*†‡ | 88.7 ± 0.9§ | 93.5 ± 1.2*§ | 88.7 ± 3.9§ | 97.6 ± 2.3*§ |
| %Lactate Rd to indirect oxidation | 12.6 ± 2.6 | 5.1 ± 1.2* | 5.0 ± 1.6* | 1.4 ± 0.3*†‡ | 20.5 ± 5.1§ | 6.8 ± 2.4* | 7.2 ± 1.3* | 12.7 ± 3.0§ |
| %Lactate Rd to direct oxidation | 33.3 ± 4.1 | 40.7 ± 1.4 | 40.3 ± 3.1 | 22.4 ± 3.6†‡ | 68.2 ± 4.9§ | 86.6 ± 2.1*§ | 81.5 ± 3.7*§ | 84.8 ± 3.7*§ |
Values are means ± se, n = 6, for untrained and trained groups. LT, lactate threshold; LC, lactate clamp; V̇o2peak, peak oxygen consumption; Rd, rate of disposal; GNG, gluconeogenesis.
Significantly different from untrained (P < 0.05);
significantly different from trained LT (P < 0.05);
significantly different from trained LT−10% (P < 0.05);
Lactate disposal and its partitioning between oxidation and GNG.
At rest, lactate Rd were not different across non-LC resting conditions in both UT and T groups (Table 1), whereas exogenous lactate infusion raised lactate Rd nearly threefold (63). In non-LC trials, the percentage of lactate Rd oxidized was ∼45% (Table 1). Within the T group, the increase in disposal with LC did not correspond to an increase in oxidation (Fig. 2), as the percentage of lactate Rd oxidized in the LT−10%+LC trial was only one-half of the percentage in the non-LC trials (Table 1; P < 0.05). During rest, 50.4 ± 10.6% of lactate Rd in the UT group supported glucose production, whereas in the non-LC trials of the T group, approximately 20–23% of lactate Rd appeared as glucose (Table 1; P < 0.05). Lactate conversion to glucose was only 6.2 ± 1.4% of lactate Rd in the LT−10%+LC trial, where [lactate]b was four times higher than in the non-LC conditions (P < 0.05).
Fig. 2.

Steady-state rates of lactate oxidation (Rox), partitioned into direct and indirect lactate oxidation in absolute (A) and relative (B) terms. Values are means ± SE, n = 6, for UT and T groups. ^Significantly different from rest within condition (P < 0.05); *significantly different from UT (P < 0.05); £significantly different from T-LT (P < 0.05); †significantly different from T-LT−10% (P < 0.05).
During the transition from rest to exercise, lactate Rd and percentage of lactate Rd oxidized significantly increased in all trials (Table 1; P < 0.05). During exercise at LT, lactate Rd was 60% greater (P < 0.05) in the T group (75% V̇o2peak) compared with the UT group (68% V̇o2peak), despite no significant difference in [lactate]b. When T subjects exercised at LT−10% (67% V̇o2peak), lactate Rd was not different than UT. However, lactate Rd increased by nearly 60% when exogenous lactate infusion raised [lactate]b to similar levels as in UT, exercising at the same relative work rate (P < 0.05). In both UT and T groups, exercising at ∼67% V̇o2peak, ∼89% of lactate Rd was oxidized, which was lower than the LT (93.5 ± 1.2%) and LT−10%+LC trials in T (97.6 ± 2.3%), although these differences were significant only compared with the UT group (P < 0.05). Similar to resting conditions, the UT group demonstrated a greater reliance on GNG for lactate removal during exercise, where 25.7 ± 6.4% of lactate Rd appeared as glucose. Only ∼9% of lactate Rd supported glucose production in the non-LC trials of the T group and 15.9 ± 3.7% in the LT−10%+LC trial.
Lactate oxidation and its partitioning between direct and indirect oxidation.
During rest, Rox were similar across all non-LC trials (Fig. 2A). Absolute partitioning of direct and indirect lactate Rox showed that exogenous lactate infusion during the rest period significantly increased direct and decreased indirect lactate Rox compared with those of the UT group (P < 0.05).
There was a significant increase in lactate Rox in the transition from rest to exercise in all four trials (Fig. 2A). Total lactate Rox was proportional to relative intensity during exercise, with the exception of the LT−10%+LC trial, where total lactate Rox was augmented by 75% during exercise (27.9 ± 3.0 mg·kg−1·min−1) compared with its corresponding LT−10% control (15.9 ± 2.2 mg·kg−1·min−1, P < 0.05). At LT, total lactate Rox was 70% higher in the T group (22.7 ± 2.9 mg·kg−1·min−1, 75% V̇o2peak) compared with the UT group (13.4 ± 2.5 mg·kg−1·min−1, 68% V̇o2peak, P < 0.05). During exercise, absolute direct Rox was significantly higher in the LT and LT−10%+LC trials of the T group compared with the other two trials (P < 0.05). Exogenous lactate infusion also significantly increased indirect Rox compared with the non-LC trials of the T group (P < 0.05).
Relative partitioning of direct and indirect lactate Rox (Fig. 2B) showed a significant training effect that increased direct lactate oxidation from ∼75% of total lactate Rox in the UT group to ∼90% in the T group non-LC trials (P < 0.05) during both rest and exercise. This relative partitioning was consistent regardless of activity level. At rest, LC did not alter direct and indirect lactate oxidation partitioning compared with the other T trials. During exercise, LC resulted in relative partitioning that was intermediate between the UT and non-LC T trials.
When represented as a percentage of lactate disposal, we estimated that at rest, 33–40% of lactate Rd underwent direct oxidation in UT and non-LC T trials (Table 1). This partition was decreased significantly by exogenous lactate infusion, where only 22.4 ± 3.6% of lactate Rd was oxidized directly in the LT−10%+LC trial. During the transition from rest to exercise, the percentage of lactate Rd oxidized directly more than doubled, increasing significantly to 68.2 ± 4.9% in UT and 82–87% in T trials (P < 0.05). Differences between groups regarding the indirect lactate oxidation proportion during exercise almost mirrored that of direct oxidation; i.e., 20.5 ± 5.1% of lactate Rd was oxidized indirectly in the UT group, exercising at LT, whereas 7–13% of lactate Rd was oxidized indirectly in the exercise trials of the T group.
Partitioning of CHO oxidation.
Determined by pulmonary gas exchange, total CHO Rox were slightly higher in the T group than that in the UT group during rest (Fig. 3A; P < 0.05). There was a significant increase in total CHO Rox in the transition from rest to exercise in all four trials (P < 0.05). Proportional to absolute workload during exercise, total CHO Rox in the T-LT trial was significantly higher than those in the other trials, and total CHO Rox in the T trials were higher than the UT trials (P < 0.05). Absolute partitioning of CHO Rox showed that glucose Rox was not different across trials, with the exception of LT−10%+LC, where exogenous lactate infusion increased glucose oxidation slightly compared with its corresponding LT−10% control (7.0 ± 0.7 mg·kg−1·min−1 vs. 6.0 ± 0.7 mg·kg−1·min−1, P < 0.05). Determined as the remaining CHO use next to glucose and direct lactate oxidation, muscle glycogen Rox was significantly higher (P < 0.05) during exercise in the T-LT (26.4 ± 3.7 mg·kg−1·min−1) and T-LT−10% (22.9 ± 1.7 mg·kg−1·min−1) trials compared with the UT-LT (14.2 ± 3.2 mg·kg−1·min−1) and T-LT−10%+LC (11.9 ± 2.3 mg·kg−1·min−1) trials.
Fig. 3.
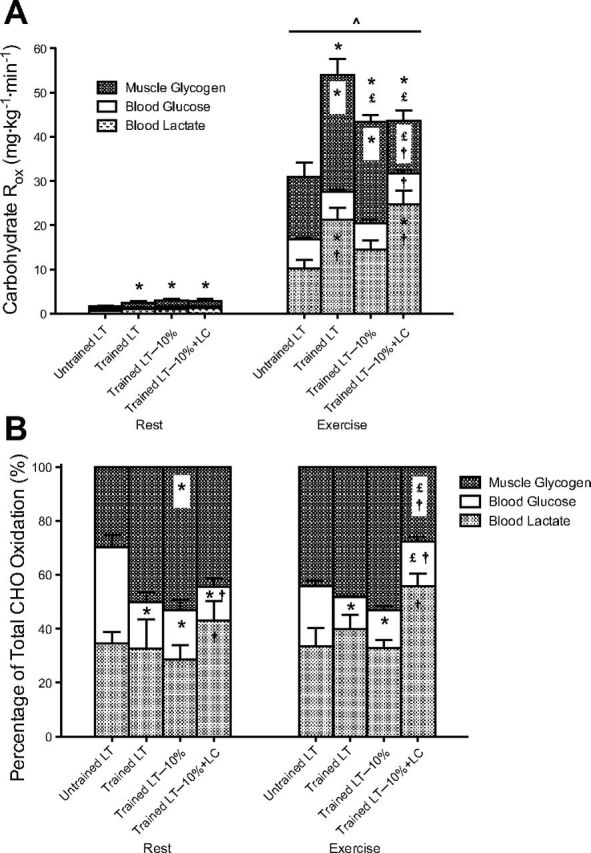
Steady-state carbohydrate (CHO) Rox, partitioned into lactate, glucose, and muscle glycogen oxidation in absolute (A) and relative (B) terms. Values are means ± SE, n = 6, for UT and T groups. ^Significantly different from rest within condition (P < 0.05); *significantly different from UT (P < 0.05); £significantly different from T-LT (P < 0.05); †significantly different from T-LT−10% (P < 0.05).
Relative partitioning of CHO oxidation (Fig. 3B) showed that the T group had a lower contribution from blood glucose to CHO metabolism compared with the UT group (∼17% vs. 36% at rest; ∼13% vs. 22% during exercise, P < 0.05). The provision of exogenous lactate in the LT−10%+LC trial decreased the reliance on blood glucose at rest (12.5 ± 3.3% vs. 18.2 ± 3.7%, P < 0.05) but increased glucose use during exercise at 67% V̇o2peak (16.4 ± 1.8% vs. 13.9 ± 1.7%, P < 0.05). The relative contribution of direct lactate oxidation to total CHO metabolism was augmented significantly as a result of LC during rest (43.0 ± 7.1% vs. 28.6 ± 5.3%, P < 0.05) and exercise (55.8 ± 4.7% vs. 32.9 ± 2.9%, P < 0.05) compared with its corresponding LT−10% control. Due to the combined increases in direct lactate and glucose oxidation in the exercise LT−10%+LC trial, relative muscle glycogen use was decreased significantly compared with the non-LC trials in the T group (P < 0.05).
Caloric expenditure from CHO and lipids.
Resting metabolic rate in both UT and T groups was 1.8 kcal/min (Table 2), where lipid accounted for approximately 47–69% of total caloric expenditure (not significantly across trials). During exercise, total caloric expenditure was proportional to absolute workload, but percentage of lipid contribution was inversely proportional to relative exercise intensity, accounting for ∼22% of total caloric expenditure in UT and T groups, exercising at 67% V̇o2peak. In the T-LT trial (75% V̇o2peak), lipid accounted for only 16% of total caloric expenditure, although these differences did not achieve significance.
Table 2.
Partitioning of caloric expenditure during rest and exercise
| Rest |
Exercise |
|||||||
|---|---|---|---|---|---|---|---|---|
| Variable | Untrained LT | Trained LT | Trained LT−10% | Trained LT−10%+LC | Untrained LT | Trained LT | Trained LT−10% | Trained LT−10%+LC |
| Total caloric expenditure, kcal/min | 1.80 ± 0.05 | 1.76 ± 0.09 | 1.79 ± 0.13 | 1.79 ± 0.14 | 13.63 ± 0.40* | 20.32 ± 1.01*† | 17.79 ± 0.85*†‡ | 17.76 ± 0.91*†‡ |
| Lactate, kcal/min | 0.21 ± 0.03, 11% | 0.40 ± 0.11, 22% | 0.27 ± 0.06, 16% | 0.43 ± 0.07, 24%†§ | 3.54 ± 0.72, 26%* | 6.79 ± 0.98, 33%*†§ | 4.60 ± 0.57, 26%* | 7.70 ± 0.74, 44%*†§ |
| Glucose, kcal/min | 0.18 ± 0.01, 10% | 0.15 ± 0.1, 9% | 0.18 ± 0.03, 10% | 0.12 ± 0.03, 6%†§ | 2.25 ± 0.21, 17%* | 2.04 ± 0.15, 10%* | 1.89 ± 0.19, 11%* | 2.24 ± 0.22, 13%*§ |
| Glycogen, kcal/min | 0.16 ± 0.06, 9% | 0.30 ± 0.12, 19% | 0.46 ± 0.07, 27%† | 0.36 ± 0.09, 22% | 4.77 ± 0.99, 34%* | 8.33 ± 1.07, 41%*† | 7.32 ± 0.56, 41%*† | 3.85 ± 0.84, 21%*‡§ |
| Lipid, kcal/min | 1.25 ± 0.09, 69% | 0.91 ± 0.13, 51% | 0.88 ± 0.17, 47% | 0.88 ± 0.17, 47% | 3.07 ± 0.41, 23%* | 3.15 ± 0.27, 16%* | 3.97 ± 0.43, 22%* | 3.96 ± 0.44, 22%* |
Values are means ± se, n = 6, for untrained and trained groups. Percentages are relative substrate contribution to total caloric expenditure. Statistical symbols are for absolute caloric expenditure values:
Significantly different from rest within condition (P < 0.05);
significantly different from untrained (P < 0.05);
significantly different from trained LT (P < 0.05);
significantly different from trained LT−10% (P < 0.05).
DISCUSSION
In this investigation, we examined the individual and combined effects of endurance training, exercise intensity, and [lactate]b on lactate Rox during exercise, at and just below the LT. Our main findings support the hypotheses that endurance training increases the capacity for lactate oxidation; in particular, the relative contribution of direct lactate oxidation to total lactate oxidation is increased, regardless of whether subjects are resting or exercising. During exercise, an increase in [lactate]b via exogenous infusion increases lactate oxidation substantially and glucose oxidation slightly, resulting in significant sparing of muscle glycogen during exercise compared with its corresponding control.
In Fig. 4, we summarize our view of the relationship between lactate and glucose turnover in the blood. Lactate appearance is shown to stem primarily from muscle glycogenolysis and to a lesser extent, glycolysis of blood glucose. Disposal of lactate includes GNG and direct oxidation, and muscle glycogen synthesis has a minor role. Lactate that enters GNG can support hepatic glycogen synthesis or glucose production, which is also dependent on hepatic glycogenolysis. Disposal of glucose includes oxidation and muscle or hepatic glycogen synthesis. A small portion of glucose disposal also re-enters the blood lactate pool. In this manuscript, we highlight the distinction between direct and indirect lactate oxidation, where the latter consists of lactate supporting glucose production and then undergoing oxidation as glucose.
Fig. 4.

A schematic showing the relationship between lactate and glucose turnover in the blood. Muscle glycogenolysis is the primary source of lactate appearance, followed by glycolysis of blood glucose. Lactate disposal includes direct oxidation, gluconeogenesis (GNG), and to a lesser extent, glycogen synthesis. Glucose appearance is dependent on hepatic glycogenolysis and GNG, and glucose disposal includes oxidation and glycogen synthesis. A small portion of glucose disposal also re-enters the lactate pool. Indirect lactate oxidation is the portion of lactate that undergoes conversion to glucose via GNG and subsequent oxidation.
Direct and indirect lactate oxidation.
Measurements of whole-body lactate oxidation have been reported previously in laboratory mammals (16, 31, 37, 52) and humans (15, 58–60, 64, 65, 76–78). However, to our knowledge, the present investigation is the first to provide estimates of direct and indirect partitioning of lactate oxidation in resting and exercising humans (Fig. 2). Whereas absolute direct and indirect Rox increase significantly from rest to exercise, their relative partitioning remains approximately constant, regardless of activity level within the UT and T groups. Direct oxidation remains the primary route of removal, comprising 75% of total lactate oxidation in the UT group and increasing up to 90% in the T group. Reciprocally, indirect lactate oxidation was significantly lower in T than in UT.
It is well established that splanchnic blood flow is inversely related to exercise intensity (1, 70), possibly limiting GNG at high exercise intensities (58, 83). In addition to local blood flow, [lactate]b determines precursor supply to the liver and therefore, GNG. Despite higher PO (LT and LT−10% trials) and/or lower [lactate]b (LT−10% trial), T subjects did not exhibit significantly different GNG rates than UT (35). This result indicates that endurance training has enhancing effects on GNG capacity (7, 35). Despite this training-attributed adaptation (i.e., similar GNG in T and UT during exercise at or close to LT), relative contribution of direct and indirect lactate oxidation was, respectively, higher and lower in T than in UT. These findings can be interpreted to mean that in T subjects, lactate is a preferred substrate over glucose (Fig. 3). Furthermore, the fact that a greater contribution of direct lactate oxidation was observed in the T group under resting conditions with and without LC suggests that blood flow distribution and precursor concentration were unlikely to have been major components in the preferential, direct use of lactate observed in the present investigation. Rather, there may be underlying training-induced adaptations that allow direct oxidation of lactate to occur, such as expansion of the apparatus described in the intercellular and intracellular lactate shuttles (12, 29). Indeed, endurance training has been shown to increase expression of sarcolemmal and mitochondrial monocarboxylate transporter (MCT)1 and sarcolemmal MCT4 (34), facilitating the uptake of circulating lactate and intramuscular lactate exchange and oxidation.
The intracellular lactate shuttle hypothesis (12) suggests that oxidation begins in the mitochondrial intermembrane space, where lactate is converted to pyruvate via a posited mitochondrial lactate oxidation complex (mLOC) of MCT1, lactate dehydrogenase (LDH), cytochrome oxidase (COx) (20), and CD147 (44, 45). Select colocalization of these putative mLOC components on the inner mitochondrial membrane has been shown using confocal laser-scanning microscopy in skeletal myocytes (44), cardiac myocytes (55), rat neurons (45), and other cells (84). Cellular locations of MCT1 and succinate dehydrogenase have also been reported to match (40), further linking MCT1 to the mitochondrial reticulum. Moreover, strong associations found among mitochondrial MCT1, CD147, LDH, and COx were not replicated by coprecipitation of complex I NADH dehydrogenase, suggesting a specific coupling with complex IV during mitochondrial electron transport (44). Most recently, a human biopsy study demonstrated that not only are skeletal muscle mitochondria capable of using lactate for mitochondrial respiration, but also, the conversion of lactate to pyruvate in the intermembrane space supports the existence of a functional mLOC (53). Therefore, as repeated muscle contraction during long-term training stimulates biogenesis of the mitochondrial reticulum, including a proportional increase in mitochondrial enzymes (5, 48–50, 56), the presence of a mLOC provides a plausible mechanism by which endurance training increases the capacity to clear and oxidize lactate directly, regardless of activity level.
Because increasing [lactate]b via a LC provides substrate for both oxidation and GNG, LC did not significantly alter the relative partitioning of direct and indirect lactate oxidation in overnight-fasted subjects under resting conditions. Conversely, during exercise at LT−10% (67% V̇o2peak), direct and indirect Rox were increased by 70% and 160%, respectively, with LC, suggesting that GNG may exhibit a greater reliance on substrate availability.
Lactate, glucose, and muscle glycogen oxidation.
Total CHO oxidation is the summed use of blood lactate, blood glucose, and muscle glycogen. In our estimates, total CHO oxidation increases proportionally to exercise workload (Fig. 3A). Interestingly, whereas exercise intensity plays little or no significant role in the partitioning of CHO use among blood lactate, blood glucose, and muscle glycogen, training status and [lactate]b have much greater impacts on this partitioning.
In the non-LC trials, UT and T groups obtain approximately 30–40% of CHO-derived energy from blood lactate at rest and during exercise (Fig. 3B). Since lactate production during exercise is predominantly a result of muscle glycogenolysis (73), the high lactate Rox observed during exercise in this study suggest that lactate is shuttled from glycolytic cells to oxidative cells, well-described as the cell–cell lactate shuttle (12, 13). Evidently, this exchange of CHO fuel across tissue beds plays a substantial role under resting conditions as well. Blood glucose is a minor source of CHO energy in the T group, comprising <20% of CHO oxidation at rest and <15% during exercise. Consistent with other training studies investigating glucose metabolism in humans (6, 18, 24, 38, 39, 65, 69, 86), the UT group exhibits significantly greater reliance on blood glucose turnover, comprising over 35% of CHO oxidation at rest and 22% during exercise. Glycogen storage capacity is known to be greater after training (30, 67, 79), thus providing a plausible explanation for the greater contribution to total CHO oxidation in the T group at rest. However, during exercise, muscle glycogen use contributes to approxiamtely 50–55% of CHO oxidation in UT and T groups in the non-LC trials. It is important to note that Rox of muscle glycogen in the present study are specific to stores oxidized directly within the same muscle. Whole-body muscle glycogen oxidation, including the secondary glycogen use via lactate production, circulation, and subsequent oxidation, may show a significant increase after training as well. However, further studies are required to quantify the shuttling of CHO fuel accurately from one tissue bed to another.
The effect of LC on blood glucose use is not well understood. Miller et al. (64) found that glucose Rox was unaffected at rest and depressed significantly, due to LC in UT individuals, exercising at 55% V̇o2peak. However, the present investigation found that estimated glucose Rox was depressed during rest and slightly, yet significantly, augmented during exercise at 67% V̇o2peak in highly trained individuals. It is plausible that the discrepancy in lactate and glucose interactions between studies may be due to differences in training state or exercise intensity—a question that warrants further investigation. Despite the differences in glucose metabolism, it is generally hypothesized that lactate oxidation is augmented by LC, likely by a concentration gradient-driven increase in facilitated diffusion across the plasma membrane. In this investigation, direct lactate oxidation has a tendency to increase at rest (P = 0.09) and is increased significantly during exercise (P < 0.05) when [lactate]b is raised due to LC. As a result of the above-mentioned increases in glucose and lactate Rox, a significant decrease in glycogen use within exercising muscle is observed during exercise at 67% V̇o2peak with LC (P < 0.05). This sparing of muscle glycogen is primarily due to the near-doubling of lactate oxidation when [lactate]b is increased by a similar proportion via exogenous infusion, suggesting that lactate may be a preferred fuel to delay depletion of glycogen stores within the exercising muscle.
Limitations.
In the present study, we infused a 13C-lactate tracer to measure lactate oxidation, and therefore, it was not possible to know glucose oxidation from simultaneous infusion of 13C-glucose. Instead, blood glucose Rox are derived from measured Rd and assumptions based on turnover studies previously conducted in humans using 13C-glucose tracer infusion and subsequent IEs of expired 13CO2. We assume that 25% of glucose Rd is oxidized at rest (20% during LC) (65) and 80% during exercise, with or without LC (38, 39, 64, 65). Because the percentages of glucose oxidation have been reproducible within and across studies in our laboratory and because our tracer-measured flux rates agree with results of others (24, 25), we consider our glucose Rox to be reasonable estimates within the physiological range. Similarly, muscle glycogen Rox are estimated to be the remaining CHO oxidation next to glucose and lactate and are therefore subject to similar constraints.
During the LT−10%+LC resting condition, infusion of unlabeled lactate significantly increases lactate Rd but not lactate-derived glucose production (35), indicating that the increase in lactate disposal may support hepatic glycogen synthesis at rest. Those observations suggest a possibility for preloading of a lactate tracer into hepatic glycogen during the 90-min rest period of the LT−10%+LC trial. If the LC procedure resulted in hepatic glycogen preloading, then our measurements of lactate-derived glucose production and as well, indirect Rox are overestimated during exercise. However, that error would further support our conclusion about a training-induced increase in direct vs. indirect lactate oxidation partitioning.
The infusion of exogenous lactate also introduces a CHO energy source in overnight-fasted subjects. On average, the LC procedure delivered 1.5 kcal/min during rest and 1.0 kcal/min during exercise. Although negligible during exercise, lactate infusion during rest may have altered the fasted state of the subjects. However, aside from the aforementioned effects on lactate and glucose oxidation, the infusion of exogenous lactate did not appear to affect total caloric expenditure or lipid use (Table 2).
Whereas we discuss the effects of endurance training, exercise intensity, and [lactate]b on lactate oxidation partitioning at and just below the LT, our study used a cross-sectional design of UT and T individuals. Since this study did not use a training intervention, the data are emphasized to represent observed differences between the UT and T populations.
Summary and conclusions.
We used stable isotope tracers and pulmonary gas-exchange measurements to determine whole-body partitioning of direct and indirect lactate oxidation in UT and T men during steady-state exercise, at and just below the LT. Additionally, we incorporated a LC component to examine the effect of exogenous lactate infusion on this partitioning. From these experiments, we conclude that endurance training and blood lactate availability provide optimal conditions for increasing direct lactate oxidation. In T individuals, the higher direct oxidative disposal of lactate, relative to its indirect oxidation, occurs both at rest and during exercise, suggesting training-induced adaptations on lactate oxidation that are independent of exercise parameters. From the standpoint of substrate use, the augmented capacity for direct lactate oxidation allows glycolytic tissues to support oxidative tissues by effectively redistributing carbohydrate fuel, as well as sparing glycogen within exercising muscle.
GRANTS
Support for this research was provided by the France-Berkeley Fund and a gift from CytoSport (Benicia, CA). L. A. Messonnier was a Fulbright fellow.
DISCLOSURES
G. A. Brooks has a financial interest in CytoSport; otherwise, the authors declare no conflict of interest.
AUTHOR CONTRIBUTIONS
Author contributions: C-A.W.E., L.A.M., and G.A.B. conception and design of research; C-A.W.E., L.A.M., J.A.F., and T.J.C. performed experiments; C-A.W.E., L.A.M., and M.A.H. analyzed data; C-A.W.E., L.A.M., M.A.H., and G.A.B. interpreted results of experiments; C-A.W.E. prepared figures; C-A.W.E., L.A.M., and G.A.B. drafted manuscript; C-A.W.E., L.A.M., J.A.F., M.A.H., T.J.C., and G.A.B. edited and revised manuscript; C-A.W.E., L.A.M., J.A.F., M.A.H., T.J.C., and G.A.B. approved final version of manuscript.
ACKNOWLEDGMENTS
We sincerely thank the subjects for their dedication and participation in this study. We also gratefully acknowledge the technical assistance of Yeon Park, R.N., and S. Britt Marett.
REFERENCES
- 1.Ahlborg G, Felig P. Lactate and glucose exchange across the forearm, legs, and splanchnic bed during and after prolonged leg exercise. J Clin Invest 69: 45–54, 1982. [DOI] [PMC free article] [PubMed] [Google Scholar]
- 2.Azevedo JL, Linderman JK, Lehman SL, Brooks GA. Training decreases muscle glycogen turnover during exercise. Eur J Appl Physiol Occup Physiol 78: 479–486, 1998. [DOI] [PubMed] [Google Scholar]
- 3.Bangsbo J, Gollnick PD, Graham TE, Saltin B. Substrates for muscle glycogen synthesis in recovery from intense exercise in man. J Physiol 434: 423–440, 1991. [DOI] [PMC free article] [PubMed] [Google Scholar]
- 4.Bangsbo J, Madsen K, Kiens B, Richter EA. Muscle glycogen synthesis in recovery from intense exercise in humans. Am J Physiol Endocrinol Metab 273: E416–E424, 1997. [DOI] [PubMed] [Google Scholar]
- 5.Barnard RJ, Peter JB. Effect of exercise on skeletal muscle. 3. Cytochrome changes. J Appl Physiol 31: 904–908, 1971. [DOI] [PubMed] [Google Scholar]
- 6.Bergman BC, Butterfield GE, Wolfel EE, Lopaschuk GD, Casazza GA, Horning MA, Brooks GA. Muscle net glucose uptake and glucose kinetics after endurance training in men. Am J Physiol Endocrinol Metab 277: E81–E92, 1999. [DOI] [PubMed] [Google Scholar]
- 7.Bergman BC, Horning MA, Casazza GA, Wolfel EE, Butterfield GE, Brooks GA. Endurance training increases gluconeogenesis during rest and exercise in men. Am J Physiol Endocrinol Metab 278: E244–E251, 2000. [DOI] [PubMed] [Google Scholar]
- 8.Bergman BC, Wolfel EE, Butterfield GE, Lopaschuk GD, Casazza GA, Horning MA, Brooks GA. Active muscle and whole body lactate kinetics after endurance training in men. J Appl Physiol 87: 1684–1696, 1999. [DOI] [PubMed] [Google Scholar]
- 9.Bertocci LA, Jones JG, Malloy CR, Victor RG, Thomas GD. Oxidation of lactate and acetate in rat skeletal muscle: analysis by 13C-nuclear magnetic resonance spectroscopy. J Appl Physiol 83: 32–39, 1997. [DOI] [PubMed] [Google Scholar]
- 10.Billat VL, Sirvent P, Py G, Koralsztein JP, Mercier J. The concept of maximal lactate steady state: a bridge between biochemistry, physiology and sport science. Sports Med 33: 407–426, 2003. [DOI] [PubMed] [Google Scholar]
- 11.Borg GA. Psychophysical bases of perceived exertion. Med Sci Sports Exerc 14: 377–381, 1982. [PubMed] [Google Scholar]
- 12.Brooks GA. Cell-cell and intracellular lactate shuttles. J Physiol 587: 5591–5600, 2009. [DOI] [PMC free article] [PubMed] [Google Scholar]
- 13.Brooks GA. The lactate shuttle during exercise and recovery. Med Sci Sports Exerc 18: 360–368, 1986. [DOI] [PubMed] [Google Scholar]
- 14.Brooks GA, Brauner KE, Cassens RG. Glycogen synthesis and metabolism of lactic acid after exercise. Am J Physiol 224: 1162–1166, 1973. [DOI] [PubMed] [Google Scholar]
- 15.Brooks GA, Butterfield GE, Wolfe RR, Groves BM, Mazzeo RS, Sutton JR, Wolfel EE, Reeves JT. Decreased reliance on lactate during exercise after acclimatization to 4,300 m. J Appl Physiol 71: 333–341, 1991. [DOI] [PubMed] [Google Scholar]
- 16.Brooks GA, Donovan CM, White TP. Estimation of anaerobic energy production and efficiency in rats during exercise. J Appl Physiol 56: 520–525, 1984. [DOI] [PubMed] [Google Scholar]
- 17.Brooks GA, Dubouchaud H, Brown M, Sicurello JP, Butz CE. Role of mitochondrial lactate dehydrogenase and lactate oxidation in the intracellular lactate shuttle. Proc Natl Acad Sci USA 96: 1129–1134, 1999. [DOI] [PMC free article] [PubMed] [Google Scholar]
- 18.Brooks GA, Trimmer JK. Glucose kinetics during high-intensity exercise and the crossover concept. J Appl Physiol 80: 1073–1075, 1996. [DOI] [PubMed] [Google Scholar]
- 19.Brooks GA, Wolfel EE, Butterfield GE, Cymerman A, Roberts AC, Mazzeo RS, Reeves JT. Poor relationship between arterial [lactate] and leg net release during exercise at 4,300 m altitude. Am J Physiol Regul Integr Comp Physiol 275: R1192–R1201, 1998. [DOI] [PubMed] [Google Scholar]
- 20.Burke LM, Angus DJ, Cox GR, Cummings NK, Febbraio MA, Gawthorn K, Hawley JA, Minehan M, Martin DT, Hargreaves M. Effect of fat adaptation and carbohydrate restoration on metabolism and performance during prolonged cycling. J Appl Physiol 89: 2413–2421, 2000. [DOI] [PubMed] [Google Scholar]
- 21.Catcheside PG, Scroop GC. Lactate kinetics in resting and exercising forearms during moderate-intensity supine leg exercise. J Appl Physiol 74: 435–443, 1993. [DOI] [PubMed] [Google Scholar]
- 22.Chatham JC, Des Rosiers C, Forder JR. Evidence of separate pathways for lactate uptake and release by the perfused rat heart. Am J Physiol Endocrinol Metab 281: E794–E802, 2001. [DOI] [PubMed] [Google Scholar]
- 23.Chioléro R, Mavrocordatos P, Burnier P, Cayeux MC, Schindler C, Jéquier E, Tappy L. Effects of infused sodium acetate, sodium lactate, and sodium beta-hydroxybutyrate on energy expenditure and substrate oxidation rates in lean humans. Am J Clin Nutr 58: 608–613, 1993. [DOI] [PubMed] [Google Scholar]
- 24.Coggan AR, Kohrt WM, Spina RJ, Bier DM, Holloszy JO. Endurance training decreases plasma glucose turnover and oxidation during moderate-intensity exercise in men. J Appl Physiol 68: 990–996, 1990. [DOI] [PubMed] [Google Scholar]
- 25.Coggan AR, Kohrt WM, Spina RJ, Kirwan JP, Bier DM, Holloszy JO. Plasma glucose kinetics during exercise in subjects with high and low lactate thresholds. J Appl Physiol 73: 1873–1880, 1992. [DOI] [PubMed] [Google Scholar]
- 26.Consolazio CF, Johnson RE, Pecora LJ. Physiological Measurements of Metabolic Functions in Man. New York: McGraw-Hill, 1963, p. 313–314. [Google Scholar]
- 27.Corsi A, Zatti M, Midrio M, Granata AL. In situ oxidation of lactate by skeletal muscle during intermittent exercise. FEBS Lett 11: 65–68, 1970. [DOI] [PubMed] [Google Scholar]
- 28.Coyle EF, Coggan AR, Hopper MK, Walters TJ. Determinants of endurance in well-trained cyclists. J Appl Physiol 64: 2622–2630, 1988. [DOI] [PubMed] [Google Scholar]
- 29.Cruz RS, de Aguiar RA, Turnes T, Penteado Dos Santos R, de Oliveira MF, Caputo F. Intracellular shuttle: the lactate aerobic metabolism. ScientificWorldJournal 2012: 420984, 2012. [DOI] [PMC free article] [PubMed] [Google Scholar]
- 30.De Bock K, Derave W, Eijnde BO, Hesselink MK, Koninckx E, Rose AJ, Schrauwen P, Bonen A, Richter EA, Hespel P. Effect of training in the fasted state on metabolic responses during exercise with carbohydrate intake. J Appl Physiol 104: 1045–1055, 2008. [DOI] [PubMed] [Google Scholar]
- 31.Depocas F, Minaire Y, Chatonnet J. Rates of formation and oxidation of lactic acid in dogs at rest and during moderate exercise. Can J Physiol Pharmacol 47: 603–610, 1969. [DOI] [PubMed] [Google Scholar]
- 32.Donovan CM, Brooks GA. Endurance training affects lactate clearance, not lactate production. Am J Physiol Endocrinol Metab 244: E83–E92, 1983. [DOI] [PubMed] [Google Scholar]
- 33.Donovan CM, Pagliassotti MJ. Quantitative assessment of pathways for lactate disposal in skeletal muscle fiber types. Med Sci Sports Exerc 32: 772–777, 2000. [DOI] [PubMed] [Google Scholar]
- 34.Dubouchaud H, Butterfield GE, Wolfel EE, Bergman BC, Brooks GA. Endurance training, expression, and physiology of LDH, MCT1, and MCT4 in human skeletal muscle. Am J Physiol Endocrinol Metab 278: E571–E579, 2000. [DOI] [PubMed] [Google Scholar]
- 35.Emhoff CA, Messonnier LA, Horning MA, Fattor JA, Carlson TJ, Brooks GA. Gluconeogenesis and hepatic glycogenolysis during exercise at the lactate threshold. J Appl Physiol 114: 297–306, 2013. [DOI] [PMC free article] [PubMed] [Google Scholar]
- 36.Ferrannini E, Natali A, Brandi LS, Bonadonna R, De Kreutzemberg SV, DelPrato S, Santoro D. Metabolic and thermogenic effects of lactate infusion in humans. Am J Physiol Endocrinol Metab 265: E504–E512, 1993. [DOI] [PubMed] [Google Scholar]
- 37.Freminet A, Bursaux E, Poyart CF. Effect of elevated lactataemia on the rates of lactate turnover and oxidation in rats. Pflugers Arch 346: 75–86, 1974. [DOI] [PubMed] [Google Scholar]
- 38.Friedlander AL, Casazza GA, Horning MA, Huie MJ, Brooks GA. Training-induced alterations of glucose flux in men. J Appl Physiol 82: 1360–1369, 1997. [DOI] [PubMed] [Google Scholar]
- 39.Friedlander AL, Casazza GA, Horning MA, Huie MJ, Piacentini MF, Trimmer JK, Brooks GA. Training-induced alterations of carbohydrate metabolism in women: women respond differently from men. J Appl Physiol 85: 1175–1186, 1998. [DOI] [PubMed] [Google Scholar]
- 40.Garcia CK, Goldstein JL, Pathak RK, Anderson RG, Brown MS. Molecular characterization of a membrane transporter for lactate, pyruvate, and other monocarboxylates: implications for the Cori cycle. Cell 76: 865–873, 1994. [DOI] [PubMed] [Google Scholar]
- 41.Gertz EW, Wisneski JA, Stanley WC, Neese RA. Myocardial substrate utilization during exercise in humans. Dual carbon-labeled carbohydrate isotope experiments. J Clin Invest 82: 2017–2025, 1988. [DOI] [PMC free article] [PubMed] [Google Scholar]
- 42.Gladden LB. A lactatic perspective on metabolism. Med Sci Sports Exerc 40: 477–485, 2008. [DOI] [PubMed] [Google Scholar]
- 43.Gladden LB. Net lactate uptake during progressive steady-level contractions in canine skeletal muscle. J Appl Physiol 71: 514–520, 1991. [DOI] [PubMed] [Google Scholar]
- 44.Hashimoto T, Hussien R, Brooks GA. Colocalization of MCT1, CD147, and LDH in mitochondrial inner membrane of L6 muscle cells: evidence of a mitochondrial lactate oxidation complex. Am J Physiol Endocrinol Metab 290: E1237–E1244, 2006. [DOI] [PubMed] [Google Scholar]
- 45.Hashimoto T, Hussien R, Cho HS, Kaufer D, Brooks GA. Evidence for the mitochondrial lactate oxidation complex in rat neurons: demonstration of an essential component of brain lactate shuttles. PLoS One 3: e2915, 2008. [DOI] [PMC free article] [PubMed] [Google Scholar]
- 46.Henderson GC, Fattor JA, Horning MA, Faghihnia N, Luke-Zeitoun M, Brooks GA. Retention of intravenously infused [13C]bicarbonate is transiently increased during recovery from hard exercise. J Appl Physiol 103: 1604–1612, 2007. [DOI] [PubMed] [Google Scholar]
- 47.Hofmann P, Pokan R, von Duvillard SP, Seibert FJ, Zweiker R, Schmid P. Heart rate performance curve during incremental cycle ergometer exercise in healthy young male subjects. Med Sci Sports Exerc 29: 762–768, 1997. [DOI] [PubMed] [Google Scholar]
- 48.Holloszy JO. Biochemical adaptations in muscle. Effects of exercise on mitochondrial oxygen uptake and respiratory enzyme activity in skeletal muscle. J Biol Chem 242: 2278–2282, 1967. [PubMed] [Google Scholar]
- 49.Hood DA. Invited review: contractile activity-induced mitochondrial biogenesis in skeletal muscle. J Appl Physiol 90: 1137–1157, 2001. [DOI] [PubMed] [Google Scholar]
- 50.Hoppeler H, Fluck M. Plasticity of skeletal muscle mitochondria: structure and function. Med Sci Sports Exerc 35: 95–104, 2003. [DOI] [PubMed] [Google Scholar]
- 51.Ide K, Schmalbruch IK, Quistorff B, Horn A, Secher NH. Lactate, glucose and O2 uptake in human brain during recovery from maximal exercise. J Physiol 522: 159–164, 2000. [DOI] [PMC free article] [PubMed] [Google Scholar]
- 52.Issekutz B, Shaw WA, Issekutz AC. Lactate metabolism in resting and exercising dogs. J Appl Physiol 40: 312–319, 1976. [DOI] [PubMed] [Google Scholar]
- 53.Jacobs RA, Meinild AK, Nordsborg NB, Lundby C. Lactate oxidation in human skeletal muscle mitochondria. Am J Physiol Endocrinol Metab 304: E686–E694, 2013. [DOI] [PubMed] [Google Scholar]
- 54.James AP, Lorraine M, Cullen D, Goodman C, Dawson B, Palmer TN, Fournier PA. Muscle glycogen supercompensation: absence of a gender-related difference. Eur J Appl Physiol 85: 533–538, 2001. [DOI] [PubMed] [Google Scholar]
- 55.Kirk P, Wilson MC, Heddle C, Brown MH, Barclay AN, Halestrap AP. CD147 is tightly associated with lactate transporters MCT1 and MCT4 and facilitates their cell surface expression. EMBO J 19: 3896–3904, 2000. [DOI] [PMC free article] [PubMed] [Google Scholar]
- 56.Kirkwood SP, Packer L, Brooks GA. Effects of endurance training on a mitochondrial reticulum in limb skeletal muscle. Arch Biochem Biophys 255: 80–88, 1987. [DOI] [PubMed] [Google Scholar]
- 57.Laughlin MR, Taylor J, Chesnick AS, DeGroot M, Balaban RS. Pyruvate and lactate metabolism in the in vivo dog heart. Am J Physiol Heart Circ Physiol 264: H2068–H2079, 1993. [DOI] [PubMed] [Google Scholar]
- 58.MacRae HH, Noakes TD, Dennis SC. Effects of endurance training on lactate removal by oxidation and gluconeogenesis during exercise. Pflugers Arch 430: 964–970, 1995. [DOI] [PubMed] [Google Scholar]
- 59.MacRae HS, Dennis SC, Bosch AN, Noakes TD. Effects of training on lactate production and removal during progressive exercise in humans. J Appl Physiol 72: 1649–1656, 1992. [DOI] [PubMed] [Google Scholar]
- 60.Mazzeo RS, Brooks GA, Schoeller DA, Budinger TF. Disposal of blood [1-13C]lactate in humans during rest and exercise. J Appl Physiol 60: 232–241, 1986. [DOI] [PubMed] [Google Scholar]
- 61.McLane JA, Holloszy JO. Glycogen synthesis from lactate in the three types of skeletal muscle. J Biol Chem 254: 6548–6553, 1979. [PubMed] [Google Scholar]
- 62.Messonnier L, Freund H, Bourdin M, Belli A, Lacour JR. Lactate exchange and removal abilities in rowing performance. Med Sci Sports Exerc 29: 396–401, 1997. [DOI] [PubMed] [Google Scholar]
- 63.Messonnier LA, Emhoff CA, Fattor JA, Horning MA, Carlson TJ, Brooks GA. Lactate kinetics at the lactate threshold in trained and untrained men. J Appl Physiol 114: 1593–1602, 2013. [DOI] [PMC free article] [PubMed] [Google Scholar]
- 64.Miller BF, Fattor JA, Jacobs KA, Horning MA, Navazio F, Lindinger MI, Brooks GA. Lactate and glucose interactions during rest and exercise in men: effect of exogenous lactate infusion. J Physiol 544: 963–975, 2002. [DOI] [PMC free article] [PubMed] [Google Scholar]
- 65.Miller BF, Fattor JA, Jacobs KA, Horning MA, Suh SH, Navazio F, Brooks GA. Metabolic and cardiorespiratory responses to “the lactate clamp”. Am J Physiol Endocrinol Metab 283: E889–E898, 2002. [DOI] [PubMed] [Google Scholar]
- 66.Nielsen HB, Febbraio MA, Ott P, Krustrup P, Secher NH. Hepatic lactate uptake versus leg lactate output during exercise in humans. J Appl Physiol 103: 1227–1233, 2007. [DOI] [PubMed] [Google Scholar]
- 67.Nybo L, Pedersen K, Christensen B, Aagaard P, Brandt N, Kiens B. Impact of carbohydrate supplementation during endurance training on glycogen storage and performance. Acta Physiol (Oxf) 197: 117–127, 2009. [DOI] [PubMed] [Google Scholar]
- 68.Pagliassotti MJ, Donovan CM. Role of cell type in net lactate removal by skeletal muscle. Am J Physiol Endocrinol Metab 258: E635–E642, 1990. [DOI] [PubMed] [Google Scholar]
- 69.Phillips SM, Green HJ, Tarnopolsky MA, Heigenhauser GF, Hill RE, Grant SM. Effects of training duration on substrate turnover and oxidation during exercise. J Appl Physiol 81: 2182–2191, 1996. [DOI] [PubMed] [Google Scholar]
- 70.Rowell LB, Blackmon JR, Bruce RA. Indocyanine green clearance and estimated hepatic blood flow during mild to maximal exercise in upright man. J Clin Invest 43: 1677–1690, 1964. [DOI] [PMC free article] [PubMed] [Google Scholar]
- 71.Schurr A. Lactate: a major and crucial player in normal function of both muscle and brain. J Physiol 586: 2665–2666, 2008. [DOI] [PMC free article] [PubMed] [Google Scholar]
- 72.Shiota M, Golden S, Katz J. Lactate metabolism in the perfused rat hindlimb. Biochem J 222: 281–292, 1984. [DOI] [PMC free article] [PubMed] [Google Scholar]
- 73.Shulman RG, Rothman DL. The “glycogen shunt” in exercising muscle: a role for glycogen in muscle energetics and fatigue. Proc Natl Acad Sci USA 98: 457–461, 2001. [DOI] [PMC free article] [PubMed] [Google Scholar]
- 74.Sjödin B, Jacobs I. Onset of blood lactate accumulation and marathon running performance. Int J Sports Med 2: 23–26, 1981. [DOI] [PubMed] [Google Scholar]
- 75.Sjödin B, Thorstensson A, Frith K, Karlsson J. Effect of physical training on LDH activity and LDH isozyme pattern in human skeletal muscle. Acta Physiol Scand 97: 150–157, 1976. [DOI] [PubMed] [Google Scholar]
- 76.Stanley WC, Gertz EW, Wisneski JA, Morris DL, Neese RA, Brooks GA. Systemic lactate kinetics during graded exercise in man. Am J Physiol Endocrinol Metab 249: E595–E602, 1985. [DOI] [PubMed] [Google Scholar]
- 77.Stanley WC, Gertz EW, Wisneski JA, Neese RA, Morris DL, Brooks GA. Lactate extraction during net lactate release in legs of humans during exercise. J Appl Physiol 60: 1116–1120, 1986. [DOI] [PubMed] [Google Scholar]
- 78.Stanley WC, Wisneski JA, Gertz EW, Neese RA, Brooks GA. Glucose and lactate interrelations during moderate-intensity exercise in humans. Metabolism 37: 850–858, 1988. [DOI] [PubMed] [Google Scholar]
- 79.Stannard SR, Buckley AJ, Edge JA, Thompson MW. Adaptations to skeletal muscle with endurance exercise training in the acutely fed versus overnight-fasted state. J Sci Med Sport 13: 465–469, 2010. [DOI] [PubMed] [Google Scholar]
- 80.Sumegi B, Podanyi B, Forgo P, Kover KE. Metabolism of [3-13C]pyruvate and [3-13C]propionate in normal and ischaemic rat heart in vivo: 1H- and 13C-NMR studies. Biochem J 312: 75–81, 1995. [DOI] [PMC free article] [PubMed] [Google Scholar]
- 81.Tanaka K. Lactate-related factors as a critical determinant of endurance. Ann Physiol Anthropol 9: 191–202, 1990. [DOI] [PubMed] [Google Scholar]
- 82.Tanaka K, Matsuura Y. Marathon performance, anaerobic threshold, and onset of blood lactate accumulation. J Appl Physiol 57: 640–643, 1984. [DOI] [PubMed] [Google Scholar]
- 83.Trimmer JK, Schwarz JM, Casazza GA, Horning MA, Rodriguez N, Brooks GA. Measurement of gluconeogenesis in exercising men by mass isotopomer distribution analysis. J Appl Physiol 93: 233–241, 2002. [DOI] [PubMed] [Google Scholar]
- 84.Wenzel U, Schoberl K, Lohner K, Daniel H. Activation of mitochondrial lactate uptake by flavone induces apoptosis in human colon cancer cells. J Cell Physiol 202: 379–390, 2005. [DOI] [PubMed] [Google Scholar]
- 85.Wolfe R. Radioactive and Stable Isotope Tracers in Biomedicine: Principles and Practice of Kinetic Analysis. New York: Wiley-Liss, 1992. [Google Scholar]
- 86.Zarins ZA, Johnson ML, Faghihnia N, Horning MA, Wallis GA, Fattor JA, Brooks GA. Training improves the response in glucose flux to exercise in postmenopausal women. J Appl Physiol 107: 90–97, 2009. [DOI] [PMC free article] [PubMed] [Google Scholar]