Abstract
Optimization of cocontraction of antagonistic muscles around the ankle joint has been shown to involve plastic changes in spinal and cortical neural circuitries. Such changes may explain the ability of elite ballet dancers to maintain a steady balance during various ballet postures. Here we investigated whether short-term cocontraction training in ballet dancers and nondancers leads to changes in the coupling between antagonistic ankle motor units. Eleven ballet dancers and 10 nondancers were recruited for the study. Prior to training, ballet dancers and nondancers showed an equal amount of coherence in the 15- to 35-Hz frequency band and short-term synchronization between antagonistic tibialis anterior and soleus motor units. The ballet dancers tended to be better at maintaining a stable cocontraction of the antagonistic muscles, but this difference was not significant (P = 0.09). Following 27 min of cocontraction training, the nondancers improved their performance significantly, whereas no significant improvement was observed for the ballet dancers. The nondancers showed a significant increase in 15- to 35-Hz coherence following the training, whereas the ballet dancers did not show a significant change. A group of control subjects (n = 4), who performed cocontraction of the antagonistic muscles for an equal amount of time, but without any requirement to improve their performance, showed no change in coherence. We suggest that improved ability to maintain a stable cocontraction around the ankle joint is accompanied by short-term plastic changes in the neural drive to the involved muscles, but that such changes are not necessary for maintained high-level performance.
when we move, neuronal mechanisms in the spinal cord help to automatically adjust the activity level of agonists, synergists, and antagonists to meet the requirements of the task (22). To prevent unwanted activation of antagonist muscles, the spinal motoneurons innervating antagonist muscles are thus inhibited by reciprocal Ia inhibitory interneurons, and the sensory feedback to these motoneurons is efficiently depressed by presynaptic inhibition during most movements (3). These are mechanisms which are efficiently regulated by supraspinal centers (22). During many tasks it is, however, necessary that opposing antagonist muscles are activated simultaneously. This is, for instance, the case when it is necessary to stabilize a joint to maintain balance. In this case, the simultaneous activity in the two antagonist muscle groups increases the stiffness to a much higher extent than what can be achieved by separate activation of the muscles (20). Cocontraction around the ankle joint occurs during balancing tasks such as standing on one leg, balancing on an unstable platform, or walking on a narrow beam (18). To achieve a stable cocontraction of antagonist muscles around the ankle joint, it has been shown that reciprocal inhibition is efficiently removed, so that the two antagonistic motoneuronal pools may be simultaneously activated unhindered by the reciprocal inhibition between them (18). Also, the stretch reflexes in both antagonistic muscle groups are efficiently suppressed by presynaptic inhibition of Ia afferents, which further ensures the stability of the muscle activity (19). Details of this muscle activity have been analyzed by recording single motor unit activities in the antagonistic muscles during cocontraction (17). These experiments have shown that some antagonistic motor units have a tendency to discharge within a few milliseconds of each other. This short-term synchronization suggests that some antagonistic motor units, similar to what has been shown for agonist and synergist motor units (2), are driven by branches from common last-order neurons. Other antagonistic motor units, however, showed the opposite: a tendency not to discharge within a few milliseconds of each other, suggesting some inhibitory coupling between them - possibly reciprocal inhibition which has not been fully removed. On the assumption that the excitatory coupling between the motor units originate from corticospinal neurons, Hansen et al. (12) used coherence analysis to investigate coupling between EEG and electromyogram (EMG) recordings during cocontraction (12). When subjects felt in control of the cocontraction and maintained a steady well-balanced cocontraction, coupling between EEG and the EMG activity in the antagonistic muscles was found in the 15- to 35-Hz frequency band as well as between the EMG of the antagonistic muscles. This was related to short-term synchrony in the time-domain. In contrast, when subjects felt less in control of the cocontraction, antagonist motor units were desynchronized in the time-domain, and coherence around 10 Hz was observed. Based on this, Hansen et al. (12) suggested that two different activation patterns were involved in the activation of the antagonistic muscles: one characterized by a stable cocontraction with synchronized discharges of the antagonist motoneurons coming from common last-order neurons discharging in the 15- to 35-Hz frequency band and another one characterized by a more fluctuating cocontraction where the motoneurons discharge out of phase with each other at intervals of around 100 ms, leading to the observed 10-Hz coherence.
Based on this, it would be reasonable to assume that improved ability to perform a stable cocontraction through training would involve a strengthening of the first system at the cost of the second. Cocontraction has indeed been shown to be trainable and to be accompanied by significant changes in coherence between EEG and EMG, suggesting plastic changes in the corticospinal drive to the muscles (24). The observation that ballet dancers have smaller H-reflexes and stretch reflexes than other subjects has also been interpreted as a training-induced effect related to the frequent need of stabilizing the ankle joint through cocontraction around the ankle joint in many ballet postures (14, 16). This was supported by Perez et al. (24), who also observed reduced H-reflexes in their short-term cocontraction training study. The observation of Ushiyama et al. (27) that ballet dancers show less corticomuscular coherence than nondancers may also be seen as a training-induced adaptation in the dancers.
On this background, it was the purpose of the present study to investigate whether short-term training of antagonistic cocontraction would lead to larger coherence in the β-band between antagonistic ankle motor units. To address the issue of whether long-term training has similar effects, ballet dancers from the Royal Danish Ballet were compared with nondancers.
METHODS
Experiments were performed on 11 dancers from The Royal Danish Ballet (6 women) aged 23 ± 4 (means ± SD) and 10 untrained healthy subjects (nondancers; 6 women) of similar age (24 ± 4). All subjects gave their written, informed consent to the experimental procedures, which were approved by the ethics committee for the Capitol Region of Denmark. The study was performed in accordance with the Declaration of Helsinki.
Experimental Protocol
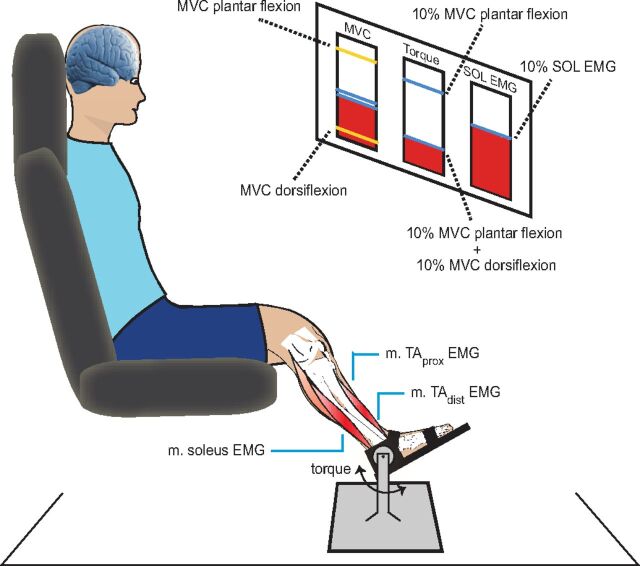
The subjects were seated in an armchair with the examined leg semiflexed in the hip (120°), the knee flexed to 160°, and the ankle in 110° plantar flexion. The left foot was firmly attached to a force pedal using adjustable straps (Fig. 1). The torque exerted on the foot plate was measured with a strain gauge.
Fig. 1.
Setup. The subject was seated in an armchair with the examined leg semiflexed in the hip (120°), the knee flexed to 160°, and the ankle in 110° plantar flexion. At the beginning of each experiment, the maximal plantar and dorsiflexion voluntary contraction strength (MVC) was measured. The torque was displayed as a moving vertical bar on the monitor (left column). For the cocontraction task, subjects were first instructed to plantar flex their foot to 10% of MVC (upper blue line displayed in the middle column on the monitor). The amount of rectified and smoothed soleus (SOL) electromyogram (EMG) produced by this contraction was displayed in the right column on the monitor (blue line). While keeping this level of soleus EMG, the subjects were asked to cocontract the tibialis anterior (TA) to produce a dorsiflexion to 10% of MVC (lower blue line in middle column). The y-axis in each column was set to ensure optimal feedback for the subject. Each subject performed 10 sets of 3-min cocontraction separated by 2-min rest periods. TAprox, proximal part of TA; TAdist, distal part of TA; m., musculus.
At the beginning of each experiment, subjects were instructed to perform a maximal plantar flexion contraction (1–2 s) to measure their maximal voluntary contraction strength (MVC). Subjects were verbally encouraged to produce maximal torque. The torque was displayed as a moving vertical bar on the monitor (left column, Fig. 1). At least three trials were performed, separated by 30-s rest periods, and the peak torque was used as the plantar flexion MVC. Subsequently, the same procedure was used to measure the dorsiflexion MVC.
Cocontraction task.
Subjects were then instructed to plantar flex the foot to 10% of MVC. The amount of rectified and smoothed (200-ms time constant) soleus EMG produced by this contraction was displayed in the right column on the monitor (Fig. 1). While keeping this level of soleus EMG, the subjects were asked to cocontract the tibialis anterior (TA) to produce a dorsiflexion to 10% of MVC (middle column, Fig. 1) and to keep this level of contraction. TA EMG activity was monitored throughout the trials to ensure that the average TA muscle activity was constant and that activity in other muscles did not contribute to the torque.
In each training set, the subjects were to keep this cocontraction as steady as possible for 3 min. The training consisted of a total of 10 sets of 3 min with 2 min of rest in between the sets.
Surface EMG Recordings
EMG activity was recorded from the distal part of TA (TAdist), the proximal part of TA (TAprox), and soleus by nonpolarizable bipolar electrodes (diameter 0.5 cm; Blue Sensor, Ambu, Ølstykke, Denmark) placed over the respective muscles with an interelectrode distance of 2 cm. For the TA recordings, the electrode pairs were placed over the muscle with a separation of at least 10 cm to minimize the risk of cross-talk between the recordings (cf. Ref. 11). The signals were amplified (2,000–5,000×) using custom-built EMG amplifiers, filtered (band-pass, 5 Hz to 1 kHz), sampled at 5 kHz, and stored on a personal computer for offline analysis (CED 1401+ with Spike 2.611 software; Cambridge Electronics Design, Cambridge, UK).
Cocontraction Performance
The ability of the subjects to perform a stable cocontraction was analyzed offline using the Spike 2 software described earlier. In each training set, the performance measure was calculated as the root mean square (RMS) deflection of the torque line from the target torque from 0 to 180 s (the full 3-min training set). A low value therefore indicates good performance (close to the target) and a high value poor performance (far away from the target).
Coherence Analysis
Time and frequency domain analysis of the data was undertaken using the methods described in detail in previous publications (5, 10). The standard practice of full wave rectification of surface EMG signals was adopted. This approach has been shown to maximize the information regarding timing of motor unit action potentials whilst suppressing information regarding waveform shape (8, 15). As a precursor to understanding population analysis of the data, the two rectified EMG signals were normalized to have unit variance (9). Rectified and normalized EMG signals are assumed to be realizations of stationary zero mean time series, denoted by x and y. The result of analysis of individual records generated estimates of the autospectra of the two EMGs [fxx(λ), fyy(λ)], and their cross-spectra [fxy(λ)]. We then estimated three functions that characterize the signals' correlation structure: coherence, Rxy(λ) 2; phase, Φxy(λ); and cumulant density, qxy(u). Coherence estimates are bounded measures of association defined over the range of [0, 1]; cumulant density estimates are not bounded, and phase is defined over the range [−π, +π].
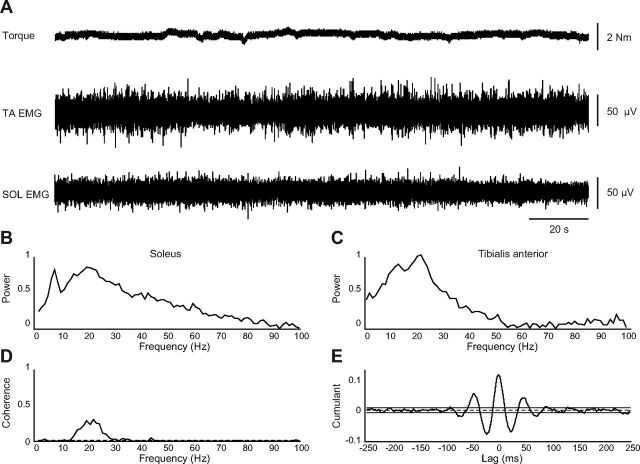
Pooled coherence estimates, like individual coherence estimates, provide a normative measure of linear association on a scale from 0 to 1 (9). The interpretation of pooled estimates is similar to those for individual records, except any interference relates to the population as a whole (5). In addition, the pooled coherence framework contains a χ2 extended difference of coherence test (see Ref. 1). For the present data, coherence estimates provide a measure of the fraction of the activity in one surface EMG signal that can be predicted by the activity in the second surface EMG signal. The reference signal was EMG from soleus, and the response signal was EMG from TAdist. In this way, coherence estimates quantify the strength and range of frequencies of common rhythmic synaptic inputs distributed across the motoneuron pool (4, 5, 7, 26). The timing relations between the EMG signals are estimated from the phase. The cumulant density provides an unbounded time-domain representation of the correlation structure analogous to the cross-correlogram. The significance of the individual coherence and cumulant density estimates are assessed by inclusion of an upper 95% confidence limit in coherence plots, and upper and lower 95% confidence limits in cumulant density plots (see example in Fig. 2), based on the assumption of statistical independence. For details see Halliday et al. (10). The intramuscular coherence between the two sets of TA EMG electrodes (TAdist and TAprox) was analyzed in the same way described earlier, but with TAprox EMG as the reference signal and TAdist EMG as the response signal.
Fig. 2.
Example of coherence between SOL and TA EMG in a ballet dancers' training set 10. A: torque and raw TA and SOL EMG during the 3-min cocontraction task. B and C: autospectra (0–100 Hz) of the SOL and TA EMG electrodes, respectively. D: coherence at frequencies between 1 and 100 Hz calculated between SOL and TA rectified EMGs. The dashed horizontal line denotes the upper 95% confidence level. E: cumulant density (range ± 250 ms) associated with the coherence. The horizontal dashed line shows the expected value of zero for uncorrelated EMG signals. The continuous horizontal lines indicate upper and lower 95% confidence intervals.
Estimates of pooled coherence were used to summarize the correlation structure in the early, middle, and late phase of training, respectively, in each group of subjects. Estimates of pooled coherence provide a single parameter describing the correlation structure, as a function of frequency, within the records in a single population, where the total number of records to be used equates to the number of subjects and training sets in each phase of training. We also characterized changes in the correlation structure between the different phases of training in each training group and between the two subject populations through the χ2 extended difference of coherence test on the two populations to be compared (see Ref. 5).
Pooling of data sets.
Several subjects had difficulty to keep the level of soleus EMG while producing the 10% MVC dorsiflexion in the first set, so it was necessary to instruct the subjects to focus more on maintaining the correct soleus EMG level. The first set was therefore seen as a “practice set” and not included in further analysis. Furthermore, we decided to remove sets without TA or soleus EMG; i.e., the subject did not perform the task correctly. To overcome the problem of missing data and to reduce variability, we pooled the data of Set 2–4, Set 5–7, and Set 8–10 to compare the amount of coherence and cocontraction performance in the early, middle, and late phase of training, respectively. In two ballet dancers and two nondancers, all data files showed either no TA or no soleus EMG. These subjects were therefore removed from the analysis.
Nontraining control group.
To ensure that any change in coherence and/or short-term synchrony was related to the training rather than a nonspecific time effect, recordings were also made in four control subjects who performed a nontraining control task where the only instruction was to activate both the soleus and TA muscle without receiving feedback about the level of EMG or the strength of contraction. It was investigated if changes in the amount of peak coherence changed in this group from Set 2–4 to Set 5–7 and Set 8–10.
Statistics
Changes in cocontraction performance and changes in peak coherence with training were tested using two-way repeated measures (RM) ANOVA with factors “training group” and “training set.” Bonferroni correction was used for multiple comparisons. The data were normalized to baseline values if the data did not follow a normal distribution.
The extended χ2 test was used to calculate difference of coherence as previously described. For comparison of individual peak coherence data and cocontraction performance, we used Pearson product-moment correlations. Statistical significance was given for P values smaller than 0.05. Data are presented as means ± standard error unless reported otherwise.
RESULTS
The maximal level of contraction was similar for both groups. Plantar flexion MVC was 124.5 ± 33.9 Nm and 123.6 ± 58.8 Nm (P = 0.97), and dorsiflexion MVC was 53.3 ± 14.0 Nm and 55.2 ± 18.0 Nm (P = 0.82) for the nondancers and ballet dancers, respectively.
Cocontraction Performance
Figure 3 shows the raw (A) and normalized (B) cocontraction performance in the nondancer and ballet dancer group. The two-way RM ANOVA on the normalized data demonstrated a significant effect of training group (P = 0.005), no significant effect of training set (P = 0.13), but a significant interaction between training group and training set (P = 0.007). Post hoc tests showed that the nondancers significantly increased their performance by 22% in Set 5–7 (P = 0.009) and Set 8–10 (P = 0.01) compared with Set 2–4. No significant changes in performance occurred with training in ballet dancers (P = 0.63–1.0). The post hoc tests also revealed a significant difference between the amount of improvement between groups in Set 5–7 (P = 0.003) and Set 8–10 (P < 0.001, Fig. 3B).
Fig. 3.
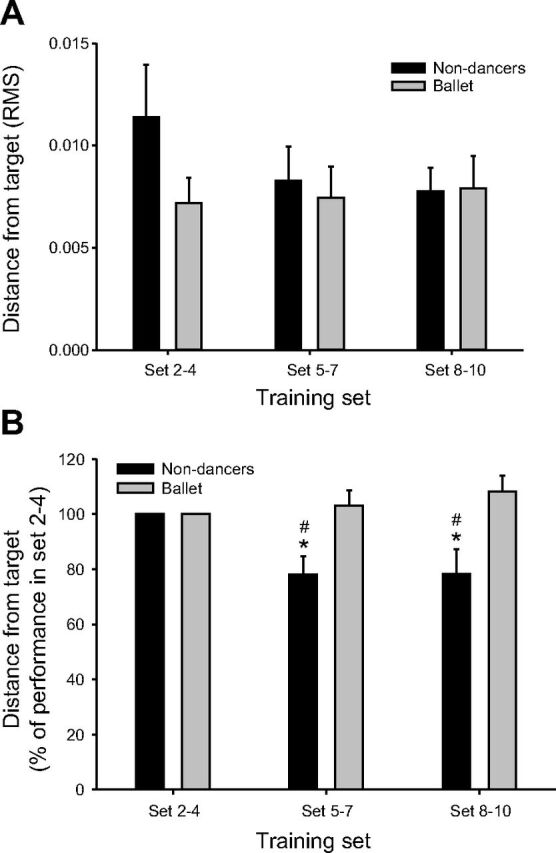
A: cocontraction performance in the early (Set 2–4), middle (Set 5–7), and late (Set 8–10) phase of cocontraction training in nondancers and ballet dancers. Performance was measured as the root mean square (RMS) deflection of the torque line from the target torque. B: like in A, but here the cocontraction performance is presented as a percentage of the performance in Set 2–4 to show the relative changes in each group. *Significantly different from Set 2–4. #Significant difference between groups.
Because the statistics were performed on the normalized data, it was not possible to evaluate whether there was a difference between groups at baseline (Set 2–4). We, therefore, performed a t-test on the raw cocontraction data. On average, the ballet dancers were 37% closer to target than the nondancers in the early phase (Set 2–4) of the cocontraction training (0.0072 ± 0.0013 vs. 0.0114 ± 0.0026 RMS, Fig. 3A), but this difference was not significant (P = 0.09).
Coherence Between Soleus and TA
Figure 4A shows the amount of peak coherence in nondancers and ballet dancers. The two-way RM ANOVA on the normalized data revealed a significant effect of cocontraction training on peak coherence in the 15- to 35-Hz frequency range between soleus and TA EMG (P = 0.001), but no effect of training group (P = 0.12) and no significant interaction between training set and training group (P = 0.4). Because there was a main effect of cocontraction training, we wanted to explore whether this effect was evident in the nondancer group where we had observed an improved performance, especially between Set 2–4 and Set 5–7. We, therefore, performed a one-way RM ANOVA for each group separately to test this hypothesis. The analysis showed a main effect of training on coherence in the nondancers (P = 0.01) and that peak coherence was significantly increased in Set 5–7 (P = 0.032) and in Set 8–10 compared with Set 2–4 (P = 0.016), but not between Set 5–7 and Set 8–10 (P = 1.0; Fig. 4A). In the ballet dancers, the one-way RM ANOVA showed a tendency, but no significant main effect of training on coherence (P = 0.076). As for the cocontraction performance, we performed a t-test on the raw coherence data to investigate whether there was a difference between groups at baseline (Set 2–4). However, the amount of coherence in the nondancers was similar to that in the ballet dancers (0.09 ± 0.02 vs. 0.10 ± 0.03; P = 0.73; Fig. 4A).
Fig. 4.
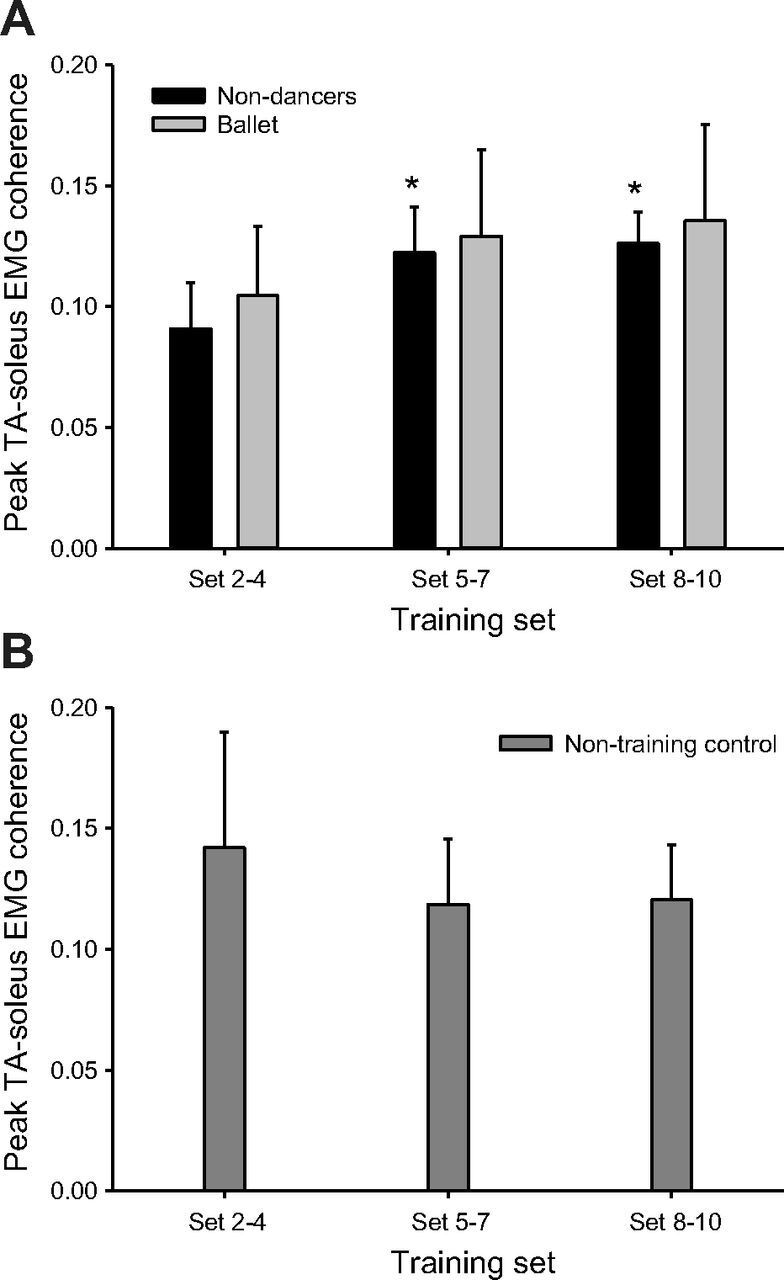
Average intermuscular peak 15- to 35-Hz coherence between soleus and TA EMG in Set 2–4, Set 5–7 and Set 8–10 in nondancers and ballet dancers (A) and in nontraining control subjects (B). *Significantly different from Set 2–4.
We did not observe any changes in peak coherence in the nontraining control group (Fig. 4B).
In all dancers and nondancers, central peaks were observed in the cumulant density function both before and after training.
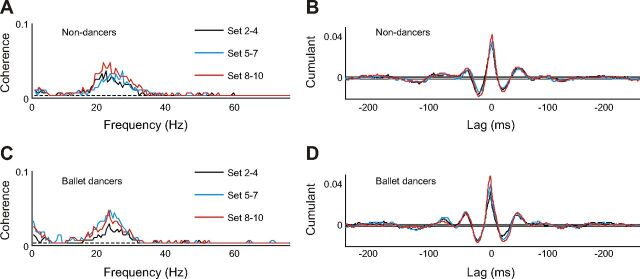
Figure 5 shows pooled soleus-TA EMG coherence estimates and cumulant density plots from the ballet and nondancers in the different phases of training. It is evident that coherence increases from Set 2–4 to Set 5–7 and Set 8–10 in the nondancers (Fig. 5A), which confirms the individual peak coherence results. An extended χ2 test of the pooled coherence analysis confirmed that there was an increase in peak coherence in the 15- to 35-Hz frequency range between soleus and TA EMG following training.
Fig. 5.
Pooled intermuscular coherence (A and C) and cumulant density associated with the coherence (B and D) between soleus and TA EMG from Set 2–4, Set 5–7, and Set 8–10 in nondancers (A and B, respectively) and ballet dancers (C and D, respectively).
In the ballet group, an increase in coherence was also observed (Fig. 5C), but this did not reach a statistically significant level in the extended χ2 test of the pooled coherence. In both dancers and nondancers, the central peaks in the cumulant density appeared to increase with training (Fig. 5, B and D).
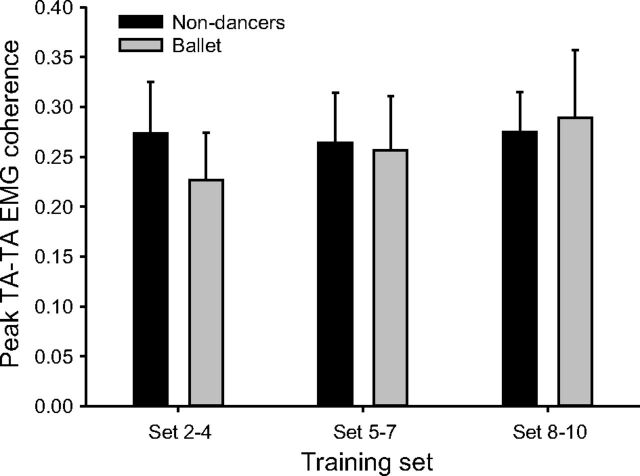
To investigate whether the coherence changes with cocontraction training were specific to soleus and TA or a generalized phenomenon, we also looked at intramuscular coherence between the two sets of TA EMG electrodes (TAdist and TAprox). As shown in Fig. 6, there were no significant changes in TA-TA coherence with training in any of the groups (P = 0.136).
Fig. 6.
Average intramuscular peak 15- to 35-Hz coherence between TAprox and TAdist EMG in Set 2–4, Set 5–7, and Set 8–10 in nondancers and ballet dancers.
Finally, as the nondancers significantly improved their cocontraction performance and significantly increased peak coherence between soleus and TA, we tested whether these changes might be correlated. There was a tendency for a negative correlation (more coherence accompanied by better performance) when looking at the relative changes in both variables from Set 2–4 to Set 5–7 in the nondancers (r = −0.64; P = 0.09). This was also where we saw the biggest changes in both variables (Figs. 3 and 4). The relative changes from Set 2–4 to Set 8–10 (r = −0.48; P = 0.23) were not significantly correlated.
DISCUSSION
This study has shown that improved ability to maintain a steady cocontraction around the ankle joint is accompanied by a selective increase in 15- to 35-Hz coherence between antagonistic muscles in nondancers. Ballet dancers had a tendency to be better than nondancers at maintaining a steady cocontraction, but did not show larger coherence at baseline. They also did not improve performance with training, and showed no significant changes in coherence. The lack of improvement is likely due to the fact that the ballet dancers' initial level of performance was very high. These findings suggest that training a cocontraction task is accompanied by short-term plastic changes in the central drive to the antagonist muscles but that these changes are not necessary for maintained high-level performance.
It has been shown previously that cocontraction training is accompanied by suppression of the soleus H-reflex mediated by increased presynaptic inhibition of Ia afferents (24). This suppression was found to be correlated to the improvement of performance, and it was suggested that it may be of functional significance to reduce reflex gain during cocontraction to allow for a centrally mediated increase in ankle joint stiffness. The present observation of increased coupling between antagonistic motor units following cocontraction training is consistent with this idea. The lack of a significant correlation between the increase of coherence and improved performance as well as the lack of difference in coherence between the two groups despite a tendency for better performance in the ballet dancers in the first sets of training suggest that coherence is not directly related to the functional performance of cocontraction. A functional significance of the change in coherence may nevertheless be supported by the finding that the change in coherence in the nondancers was selective for the coupling between antagonistic motor units and was not observed for motor units within the same muscle. This is remarkable, since it demonstrates that the drive to populations of antagonistic motor units may be separated from the drive to populations of agonist motor units. This highlights that the central drive to pairs of antagonistic muscles is organized differently from the central drive to the individual agonist muscles, as has been suggested from analysis of segmental reflex mechanisms during cocontraction (21). The reduction in motor-evoked potentials during cocontraction observed by Nielsen et al. (16; see also Ref. 21) and following cocontraction training observed by Perez et al. (24) also suggests a reduction in the monosynaptic corticospinal (corticomotoneuronal) drive to the individual muscle. This may be of importance since a large proportion of corticomotoneuronal cells have been shown to have collaterals with reciprocal Ia inhibitory interneurons which inhibit motoneurons of the antagonist muscles (6). Reducing the activity of such corticomotoneuronal cells and allowing circuitries that provide a common drive to antagonist motor units to become more active is a likely mechanism behind the increased coherence between the antagonistic motor units observed here. Evidence of corticospinal neurons organized specifically to provide a common drive to antagonistic muscles has been provided from monkey experiments (13).
In the study by Hansen et al. (12), coherence between antagonist motor units was observed in the 15- to 35-Hz frequency band accompanied by a central peak in the cumulant density function when subjects felt in control of the cocontraction, whereas coherence around 10 Hz accompanied by a central trough in the cumulant density function was observed when they felt that they could not control the contraction. This was suggested to be related to activation of different central circuitries providing input to the antagonistic motor units in different frequency bands and organized either to synchronize or desynchronize the antagonist motor units. The increased coherence in the 15- to 35-Hz frequency band is consistent with increased activity in the circuitry responsible for synchronization of the motor units as subjects become better at activating the motor units together. We did not observe any change in the 10-Hz frequency band, and we therefore have no evidence that the other circuitry became less active. We also did not observe any troughs in the cumulant density function in any subject before or after the training. There may be several reasons for this discrepancy with the study by Hansen et al. (12). We averaged data over 3-min periods and may easily have averaged together periods of synchronized central drive with periods of desynchronized central drive. In contrast to Hansen et al. (12), our analysis was based on the analog data signal, whereas they analyzed digitized data obtained by triggering on the largest motor unit activity in each of the recordings. We may therefore again have averaged out troughs between some of the motor units.
Given their daily training, which involves significant emphasis on stability of the ankle joint during various ballet postures, it was not surprising that the ballet dancers tended to be better at maintaining a stable cocontraction than the nondancers. Previous studies have also demonstrated that ballet dancers have smaller reflexes in the antagonistic muscles and greatly reduced reciprocal inhibition between the antagonist ankle muscles compared with nondancers (14, 16). Both of these findings likely reflect long-term adaptations in the segmental reflex circuitries, which facilitate the ability of the dancers to cocontract the antagonist ankle muscles appropriately. We had therefore also expected 15- to 35-Hz coherence between the antagonist ankle motor units to be larger in the ballet dancers than in the nondancers, but this was not the case. One reason may be that intermuscular coherence shows very large variability between subjects, despite similar functional abilities, and that a possible long-term adaptation in the individual dancers is not reflected in the average population data. Another possibility is that intermuscular coherence changes dynamically in relation to training and that the short-term changes that we have observed here are not maintained in the long term. In this way, the descending control of the antagonist muscles would be allowed to maintain some flexibility and continuously adapt according to ongoing changes in motor performance. There is indeed evidence to suggest that changes in motor cortical excitability and corticospinal drive in relation to motor learning are relatively short lived and are not maintained over longer periods unless progressive learning is implemented (23, 25). It should be noted that the observation by Ushiyama et al. (27), that corticomuscular coherence appears to be reduced in ballet dancers compared with nondancers, is not necessarily in contrast to our finding of no difference in coherence between the antagonistic motor unit activities. First, intermuscular coherence does not necessarily reflect corticomuscular coherence, as already mentioned. Second, in the Ushiyama study coherence was measured during agonist contraction and not during cocontraction, as in this study.
To conclude, we suggest that improved ability to maintain a stable cocontraction around the ankle joint is accompanied by short-term plastic changes in the neural drive to the involved muscles (possibly to allow for new learning to take place) but that such changes are not necessary for maintained high-level performance.
DISCLOSURES
No conflicts of interest, financial or otherwise, are declared by the author(s).
AUTHOR CONTRIBUTIONS
Author contributions: S.S.G., M.K., K.K.P., M.A.P., and J.B.N. conception and design of research; S.S.G., M.K., and K.K.P. performed experiments; S.S.G., M.K., K.K.P., and T.H.P. analyzed data; S.S.G., M.K., K.K.P., and J.B.N. interpreted results of experiments; S.S.G. and T.H.P. prepared figures; S.S.G. and J.B.N. drafted manuscript; S.S.G., M.K., K.K.P., T.H.P., M.A.P., and J.B.N. edited and revised manuscript; S.S.G., M.K., K.K.P., T.H.P., M.A.P., and J.B.N. approved final version of manuscript.
REFERENCES
- 1.Amjad AM, Halliday DM, Rosenberg JR, Conway BA. An extended difference of coherence test for comparing and combining several independent coherence estimates: theory and application to the study of motor units and physiological tremor. J Neurosci Methods 73: 69–79, 1997. [DOI] [PubMed] [Google Scholar]
- 2.Bremner FD, Baker JR, Stephens JA. Correlation between the discharges of motor units recorded from the same and from different finger muscles in man. J Physiol 432: 355–380, 1991. [DOI] [PMC free article] [PubMed] [Google Scholar]
- 3.Crone C, Nielsen J. Spinal mechanisms in man contributing to reciprocal inhibition during voluntary dorsiflexion of the foot. J Physiol 416: 255–272, 1989. [DOI] [PMC free article] [PubMed] [Google Scholar]
- 4.Farmer SF, Bremner FD, Halliday DM, Rosenberg JR, Stephens JA. The frequency content of common synaptic inputs to motoneurones studied during voluntary isometric contraction in man. J Physiol 470: 127–155, 1993. [DOI] [PMC free article] [PubMed] [Google Scholar]
- 5.Farmer SF, Gibbs J, Halliday DM, Harrison LM, James LM, Mayston MJ, Stephens JA. Changes in EMG coherence between long and short thumb abductor muscles during human development. J Physiol 579: 389–402, 2007. [DOI] [PMC free article] [PubMed] [Google Scholar]
- 6.Fetz EE, Cheney PD. Functional relations between primate motor cortex cells and muscles: fixed and flexible. Ciba Found Symp 132: 98–124, 1987. [DOI] [PubMed] [Google Scholar]
- 7.Halliday DM, Conway BA, Farmer SF, Rosenberg JR. Load-independent contributions from motor-unit synchronization to human physiological tremor. J Neurophysiol 82: 664–675, 1999. [DOI] [PubMed] [Google Scholar]
- 8.Halliday DM, Farmer SF. On the need for rectification of surface EMG. J Neurophysiol 103: 3547; author reply 3548–3549, 2010. [DOI] [PubMed] [Google Scholar]
- 9.Halliday DM, Rosenberg JR. On the application, estimation and interpretation of coherence and pooled coherence. J Neurosci Methods 100: 173–174, 2000. [DOI] [PubMed] [Google Scholar]
- 10.Halliday DM, Rosenberg JR, Amjad AM, Breeze P, Conway BA, Farmer SF. A framework for the analysis of mixed time series/point process data: theory and application to the study of physiological tremor, single motor unit discharges and electromyograms. Prog Biophys Mol Biol 64: 237–278, 1995. [DOI] [PubMed] [Google Scholar]
- 11.Hansen NL, Conway BA, Halliday DM, Hansen S, Pyndt HS, Biering-Sorensen F, Nielsen JB. Reduction of common synaptic drive to ankle dorsiflexor motoneurons during walking in patients with spinal cord lesion. J Neurophysiol 94: 934–942, 2005. [DOI] [PubMed] [Google Scholar]
- 12.Hansen S, Hansen NL, Christensen LO, Petersen NT, Nielsen JB. Coupling of antagonistic ankle muscles during co-contraction in humans. Exp Brain Res 146: 282–292, 2002. [DOI] [PubMed] [Google Scholar]
- 13.Humphrey DR, Reed DJ. Separate cortical systems for control of joint movement and joint stiffness: reciprocal activation and coactivation of antagonist muscles. Adv Neurol 39: 347–372, 1983. [PubMed] [Google Scholar]
- 14.Koceja DM, Burke JR, Kamen G. Organization of segmental reflexes in trained dancers. Int J Sports Med 12: 285–289, 1991. [DOI] [PubMed] [Google Scholar]
- 15.Myers LJ, Lowery M, O'Malley M, Vaughan CL, Heneghan C, St Clair Gibson A, Harley YX, Sreenivasan R. Rectification and non-linear pre-processing of EMG signals for cortico-muscular analysis. J Neurosci Methods 124: 157–165, 2003. [DOI] [PubMed] [Google Scholar]
- 16.Nielsen J, Crone C, Hultborn H. H-reflexes are smaller in dancers from The Royal Danish Ballet than in well-trained athletes. Eur J Appl Physiol Occup Physiol 66: 116–121, 1993. [DOI] [PubMed] [Google Scholar]
- 17.Nielsen J, Kagamihara Y. Synchronization of human leg motor units during co-contraction in man. Exp Brain Res 102: 84–94, 1994. [DOI] [PubMed] [Google Scholar]
- 18.Nielsen J, Kagamihara Y. The regulation of disynaptic reciprocal Ia inhibition during co-contraction of antagonistic muscles in man. J Physiol 456: 373–391, 1992. [DOI] [PMC free article] [PubMed] [Google Scholar]
- 19.Nielsen J, Kagamihara Y. The regulation of presynaptic inhibition during co-contraction of antagonistic muscles in man. J Physiol 464: 575–593, 1993. [DOI] [PMC free article] [PubMed] [Google Scholar]
- 20.Nielsen J, Sinkjaer T, Toft E, Kagamihara Y. Segmental reflexes and ankle joint stiffness during co-contraction of antagonistic ankle muscles in man. Exp Brain Res 102: 350–358, 1994. [DOI] [PubMed] [Google Scholar]
- 21.Nielsen JB. Co-contraction of antagonistic muscles in man. Dan Med Bull 45: 423–435, 1998. [PubMed] [Google Scholar]
- 22.Nielsen JB. Sensorimotor integration at spinal level as a basis for muscle coordination during voluntary movement in humans. J Appl Physiol 96: 1961–1967, 2004. [DOI] [PubMed] [Google Scholar]
- 23.Pascual-Leone A, Amedi A, Fregni F, Merabet LB. The plastic human brain cortex. Annu Rev Neurosci 28: 377–401, 2005. [DOI] [PubMed] [Google Scholar]
- 24.Perez MA, Lundbye-Jensen J, Nielsen JB. Task-specific depression of the soleus H-reflex after cocontraction training of antagonistic ankle muscles. J Neurophysiol 98: 3677–3687, 2007. [DOI] [PubMed] [Google Scholar]
- 25.Perez MA, Lungholt BK, Nyborg K, Nielsen JB. Motor skill training induces changes in the excitability of the leg cortical area in healthy humans. Exp Brain Res 159: 197–205, 2004. [DOI] [PubMed] [Google Scholar]
- 26.Rosenberg JR, Halliday DM, Breeze P, Conway BA. Identification of patterns of neuronal connectivity: partial spectra, partial coherence, and neuronal interactions. J Neurosci Methods 83: 57–72, 1998. [DOI] [PubMed] [Google Scholar]
- 27.Ushiyama J, Takahashi Y, Ushiba J. Muscle dependency of corticomuscular coherence in upper and lower limb muscles and training-related alterations in ballet dancers and weightlifters. J Appl Physiol 109: 1086–1095, 2010. [DOI] [PubMed] [Google Scholar]


