Abstract
Purpose—
Drug induced cardiac toxicity is a disruption of the functionality of cardiomyocytes which is highly correlated to the organization of the subcellular structures. We can analyze cellular structures by utilizing microscopy imaging data. However, conventional image analysis methods might miss structural deteriorations that are difficult to perceive. Here, we propose an image-based deep learning pipeline for the automated quantification of drug induced structural deteriorations using a 3D heart slice culture model.
Methods—
In our deep learning pipeline, we quantify the induced structural deterioration from three anticancer drugs (doxorubicin, sunitinib, and herceptin) with known adverse cardiac effects. The proposed deep learning framework is composed of three convolutional neural networks that process three different image sizes. The results of the three networks are combined to produce a classification map that shows the locations of the structural deteriorations in the input cardiac image.
Results—
The result of our technique is the capability of producing classification maps that accurately detect drug induced structural deterioration on the pixel level.
Conclusion—
This technology could be widely applied to perform unbiased quantification of the structural effect of the cardiotoxins on heart slices.
Keywords: Cardiotoxicity, Cardiotoxins, Deep learning, Convolutional neural network
INTRODUCTION
Drug induced cardiotoxicity is a major cause of market withdrawal.17 In the last decade of the twentieth century, eight non-cardiovascular drugs were withdrawn from clinical use because they prolonged the QT interval,3 resulting in ventricular arrhythmias and potentially sudden death. In addition, cancer therapies (while in many cases effective) can lead to a number of cardiotoxic effects including cardiomyopathy and arrhythmias. For example, both traditional (e.g., anthracyclines and radiation) and targeted (e.g., herceptin) breast cancer therapies can result in cardiovascular complications in a subset of patients.16 Thus, there is a growing need for reliable preclinical screening strategies for CV toxicities associated with emerging breast cancer therapies prior to human clinical trials.
The lack of availability of culture systems for human heart tissue that is functionally and structurally viable for more than 24 h is a limiting factor in reliable cardiotoxicity testing. Therefore, there is an urgent need to develop a reliable system for culturing human heart tissue under physiologic conditions for testing drug toxicity. The recent move towards the use of human induced pluripotent stem cell-derived cardiomyocytes (hiPSC-CMs) in cardiotoxicity testing has provided a partial solution to address this issue; however, the immature nature of the hiPS-CMs and loss of tissue integrity compared to multicellular heart tissue are major limitations of this technology.23 Moreover, the heart tissue is structurally more complicated, being comprised of a heterogeneous mixture of various cell types including endothelial cells, neurons and various types of stromal fibroblasts linked together with a very specific mixture of extracellular matrix proteins.21 This heterogeneity of the non-cardiomyocyte cell population5,11,12 in the adult mammalian heart is a major obstacle in modeling heart tissue using individual cell types.
Culturing human heart slices is a promising model of intact human myocardium. This technology provides access to a complete 3D multicellular system that reflects the human myocardium; however, its use has been severely limited by the short period of viability in culture, which does not extend beyond 24 h using the most robust protocols reported to date10,20,29 due to multiple factors including not incorporating physiologic mechanical loading, air–liquid interface, and use of a simple medium that does not support the demands of the cardiac tissue. We have previously used electrical stimulation and an optimized media to keep cardiac tissue slices viable for up to 6 days.18,19 This culture system has the potential to become a powerful predictive human in situ model for cardiotoxicity testing to close the gap between preclinical and clinical testing results. We recently provided a proof of concept that the heart slice culture system outperformed the hiPSC-CMs in predicting functional cardiotoxicity.14 However, this technology is still limited by the inability to quantify structural cardiotoxicities such as the troponin expression and the gap junction protein, connexin43, expression and localization. Here we are using the artificial intelligence6–8 and the deep learning framework to reliably quantify the effect of cardiotoxins on cardiac tissue structural integrity in an automated and unbiased manner.
MATERIALS AND METHODS
Harvesting Porcine Heart Tissue
All animal procedures were in accordance with the institutional guidelines and approved by the University of Louisville Institutional Animal Care and Use Committee. The protocol for harvesting pig hearts has been described in detail.18,19 Briefly, following deeply anesthetizing the pig with 5% isoflurane, pig heart was quickly excised out and the heart was clamped at the aortic arch and perfused with 1 L sterile cardioplegia solution (110 mM NaCl, 1.2 mM CaCl2, 16 mM KCl, 16 mM MgCl2, 10 mM NaHCO3, 5 units/mL heparin, pH 7.4), then the heart was preserved on an ice-cold cardioplegic solution and immediately transported to the lab on wet ice.
Heart Slicing and Culturing
Slicing and culturing 300 μm thick heart tissue slices were performed as previously described in Refs. [18,19]. A refined oxygenated growth medium was used (Medium 199, 1× ITS supplement, 10% FBS, 5 ng/mL VEGF, 10 ng/mL FGF-basic, and 2× Antibiotic-Antimycotic), and changed 3 times/day. Sunitinib (Tocris Inc.) (100 nM, 1μM, and 10 μM), herceptin (In-vivoGen Inc.) (1, 10, and 100 μg), or doxorubicin (Sigma Millipore Inc.) (100 nM, 1μM, and 10 μM, and 50 μM) was added freshly to the culture medium at each medium change. Control slices received DMSO at the same dilution factor as the drug-treated slices.
Heart Slice Fixation, Mounting and Immunofluorescence
Heart slices were fixed with 4% paraformaldehyde for 48 h. Fixed tissue was dehydrated in 10% sucrose for 1 h, 20% sucrose for 1 h, and 30% for overnight. The dehydrated tissue was then embedded in optimal cutting temperature compound (OCT compound) and gradually frozen in isopentane/dry ice bath. OCT embedded blocks were stored at −80 °C until sectioning. 8 μm sections were cut and immunolabeled for target proteins using the following procedure: To remove the OCT compound, the slides were heated for 5 min at 95 °C until the OCT compound melted. Then 1 mL of PBS was added to each slide and incubated at RT for 10–30 min until the OCT compound washed off. Sections were then permeabilized by incubating for 30 min in 0.1% Triton-X in PBS at RT. The Triton-X was removed, and non-specific antibody binding of the sections were blocked with 3% BSA solution for 1 h at RT. After washing the BSA off with PBS, each section was marked off with a wax pen. After marking sections off, the primary antibodies (1:200 dilution in 1% BSA) connexin 43 (Abcam; #AB11370), troponin-T (Thermo Scientific; #MA5–12960)] were added to each section and incubated for 90 min at RT. The primary antibodies were washed off with PBS three times followed by the addition of the secondary antibodies (1:200 dilution in 1% BSA) anti-Ms AlexaFluor 488 (Thermo Scientific; #A16079), anti-Rb AlexaFluor 594 (Thermo Scientific; #T6391) and incubated for 90 min at RT. The secondary antibody was removed by washing the sections 3 times with PBS. To distinguish the bona fide target staining from the background, we used a secondary antibody only as a control. After 3 times PBS washes, DAPI was added for 15 min. The sections were washed again 3 times with PBS. Finally, slices were mounted in vectashield (Vector Laboratories) and sealed with nail polish. All immunofluorescence imaging and quantification were performed using a Cytation 1 high content imager and the fluorescent signal quantification and masking were performed using the Gen5 software.
The Classification Task
To perform image classification, we utilized deep learning25 where a convolutional neural network (CNN) was trained to differentiate between two groups of images categorized by their class labels.22 In our study, the two groups of images to be distinguished are control cells treated with a vehicle and drug treated cells. The aim of the CNN-based deep learning framework is to determine whether the two groups are distinguishable or not and quantify the detected differences. We developed our deep learning framework to perform a series of two class trainings in which it compares images of each test condition (drug dose k ∈ {1, , N}) to reference images of the cells treated with vehicle-only, where N is the total number of the tested doses. As illustrated in Fig. 1 we designed our experiment by having six cross-sections per drug dose. We dedicated the images collected from four cross-sections for training; i.e., teaching our deep learning framework to incorporate particular image features with a specific class. We dedicated the images of the remaining two cross-sections for validation. During each training, our deep learning framework determines whether the set of images treated with a vehicle are distinguishable from the set of images treated with a specific drug dose. If they are distinguishable, the percentage of the structural deterioration is assessed. The images used in our pipelines are the result of the merge between three independent cellular markers; DAPI stain to stain nuclei (represented by blue color), troponin-T cardiac marker (represented by green color), and connexin 43 gap Junction Protein (represented by red color). An expert has annotated the images to identify the location where structural deterioration occurred.
FIGURE 1.
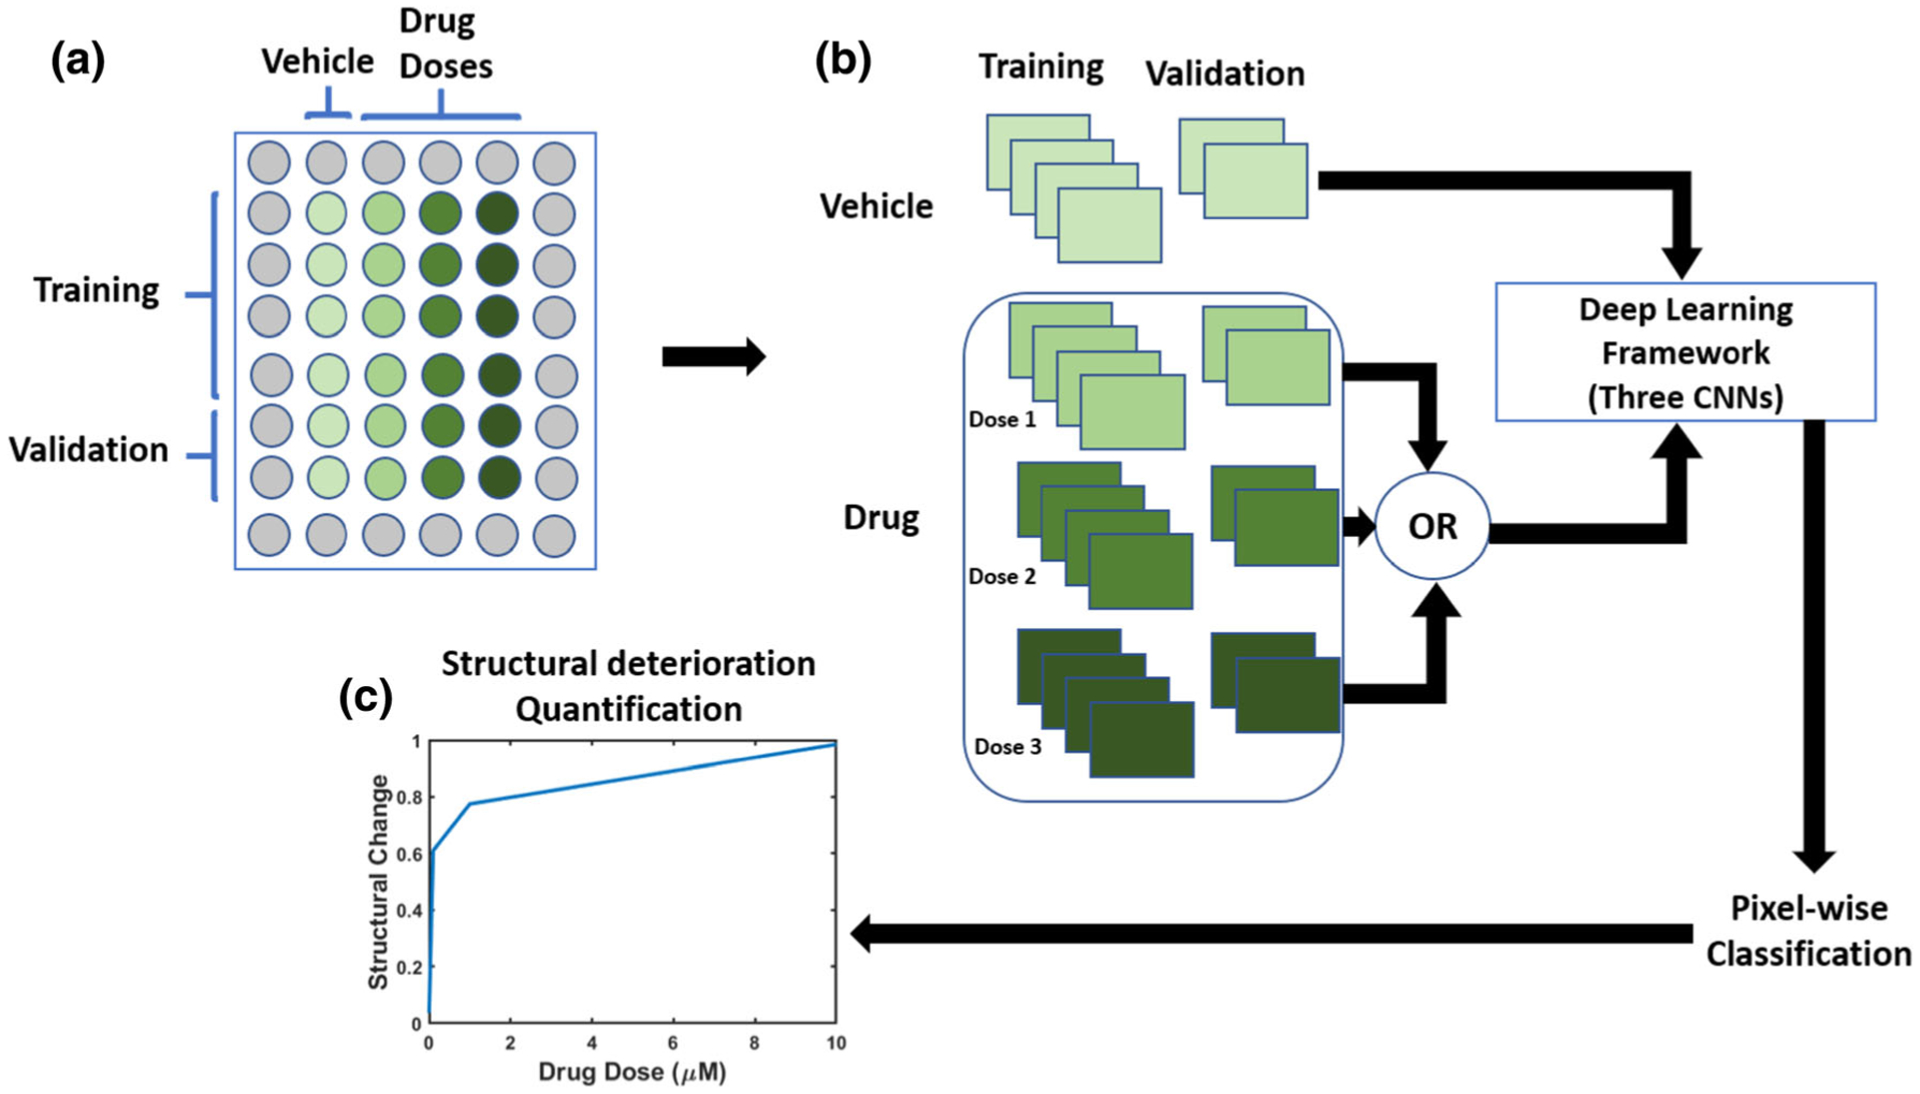
Schematic illustration of our proposed pipeline for structural deterioration quantification. (a) The input to our pipeline was a collection of cardiac cells images annotated and imaged at different drug doses and different time points, and a set of reference cardiac cells images treated by applying the vehicle only. (b) Our pipeline utilizes deep learning to quantify structural deteriorations induced by the applied drug by comparing images from the vehicle wells to each drug dose k ∈ {1, , N} where N is the number of the tested drug doses. For each drug dose, a deep learning framework that is composed of three convolutional neural networks (illustrated in Fig. 2) was trained to classify between vehicle and drug images. The trained framework was then used to classify the images of the validation wells. (c) The output of our pipeline was an estimate for the structural deterioration vs. all drug doses.
Patches Generation
For each drug dose, we dedicated the images of four cross-sections for training and the images of the remaining two cross-sections for validation. The images of the training set were divided into overlapping patches with three different sizes: 75 × 75 pixels, 100 × 100 pixels, and 125 × 125 pixels. The degree of overlap between each patch and the next one is 50%. We stored each patch size in a separate folder. Therefore, for each drug dose we have three folders dedicated for training. The generation of overlapped patches helps our deep learning framework to learn various viewpoints in the image. We removed the patches that contains only background. In a similar manner, we divided the images of validation set into overlapped patches with the three mentioned sizes. The degree of overlap was about seventy-five percent. Therefore, the degree of overlap in the validation set was increased. Therefore, during testing we will have various labels for the same area. The validation set will be used to perform pixel-wise classification as we will discuss in Sect. 2.7.
The Proposed Deep Learning Framework
The usage of deep learning techniques, particularly CNNs is at the core of our deep learning framework. CNNs have excellent performance in computer vision applications, such as image classification.22 The architecture of the CNN is composed of an input layer, output layer, and hidden layers. The hidden layers include convolutional layers, rectified linear unit layers, pooling layers, and fully connected layers. The depth of the CNN is identified by the number of the hidden layers. The weights of the CNN are the parameters of the hidden layers. Through iterative optimization the CNN can be trained by a set of labeled images. The result of training is that the CNN learns its weights that maximize the number of correctly classified samples during prediction.
Our deep learning framework is composed of three CNNs which process three patch sizes as shown in Fig. 2. The first CNN is fed with 75 × 75 patches, the second CNN is fed with 100 × 100 patches, and the third CNN is fed with 125 × 125 patches. We designed the three CNNs to have the same architecture. As illustrated in Fig. 2, each CNN is composed of a series of convolutional layers interspersed with max-pooling layers followed by two fully-connected layers. The output of the second fully-connected layer is fed to a soft-max layer to produce output probabilities. The purpose of the convolutional layer is to convolve the input with filters and the result of this operation is feature maps that represent the object in the input. We used multiple filters in each convolutional layer. Therefore, a volume of feature maps results in from each convolutional layer. In our design, There are three convolutional layers that contain filters with size 3 × 3 that have stride equals to 1. The purpose of the max-pooling layers is to reduce the spatial dimension by a factor of 2. This operation removes the less prominent features and keeps the most important features in the feature map. Furthermore, the computational cost and training time are reduced by max-pooling operation. In our design, a stride of 2 was used in the max-pooling layers. A 12 neurons was used in the first fully connected connected layer. The second layer contains 2 neurons for the 2 classes classification. The purpose of the final soft-max layer is to produce probabilities for multi-class classification. The probabilities are in the range of 0 to 1. Now, we can obtain a probability for each class and the highest value represents the classification result for the input sample. We used the cross-entropy loss to train each the three CNNs. Specifically, the cross-entropy between the ground truth labels and the predicted probabilities is minimized. To avoid overfitting while training the CNNs, we used a dropout with a rate of 0.2 in the convolutional and fully-connected layers.
FIGURE 2.
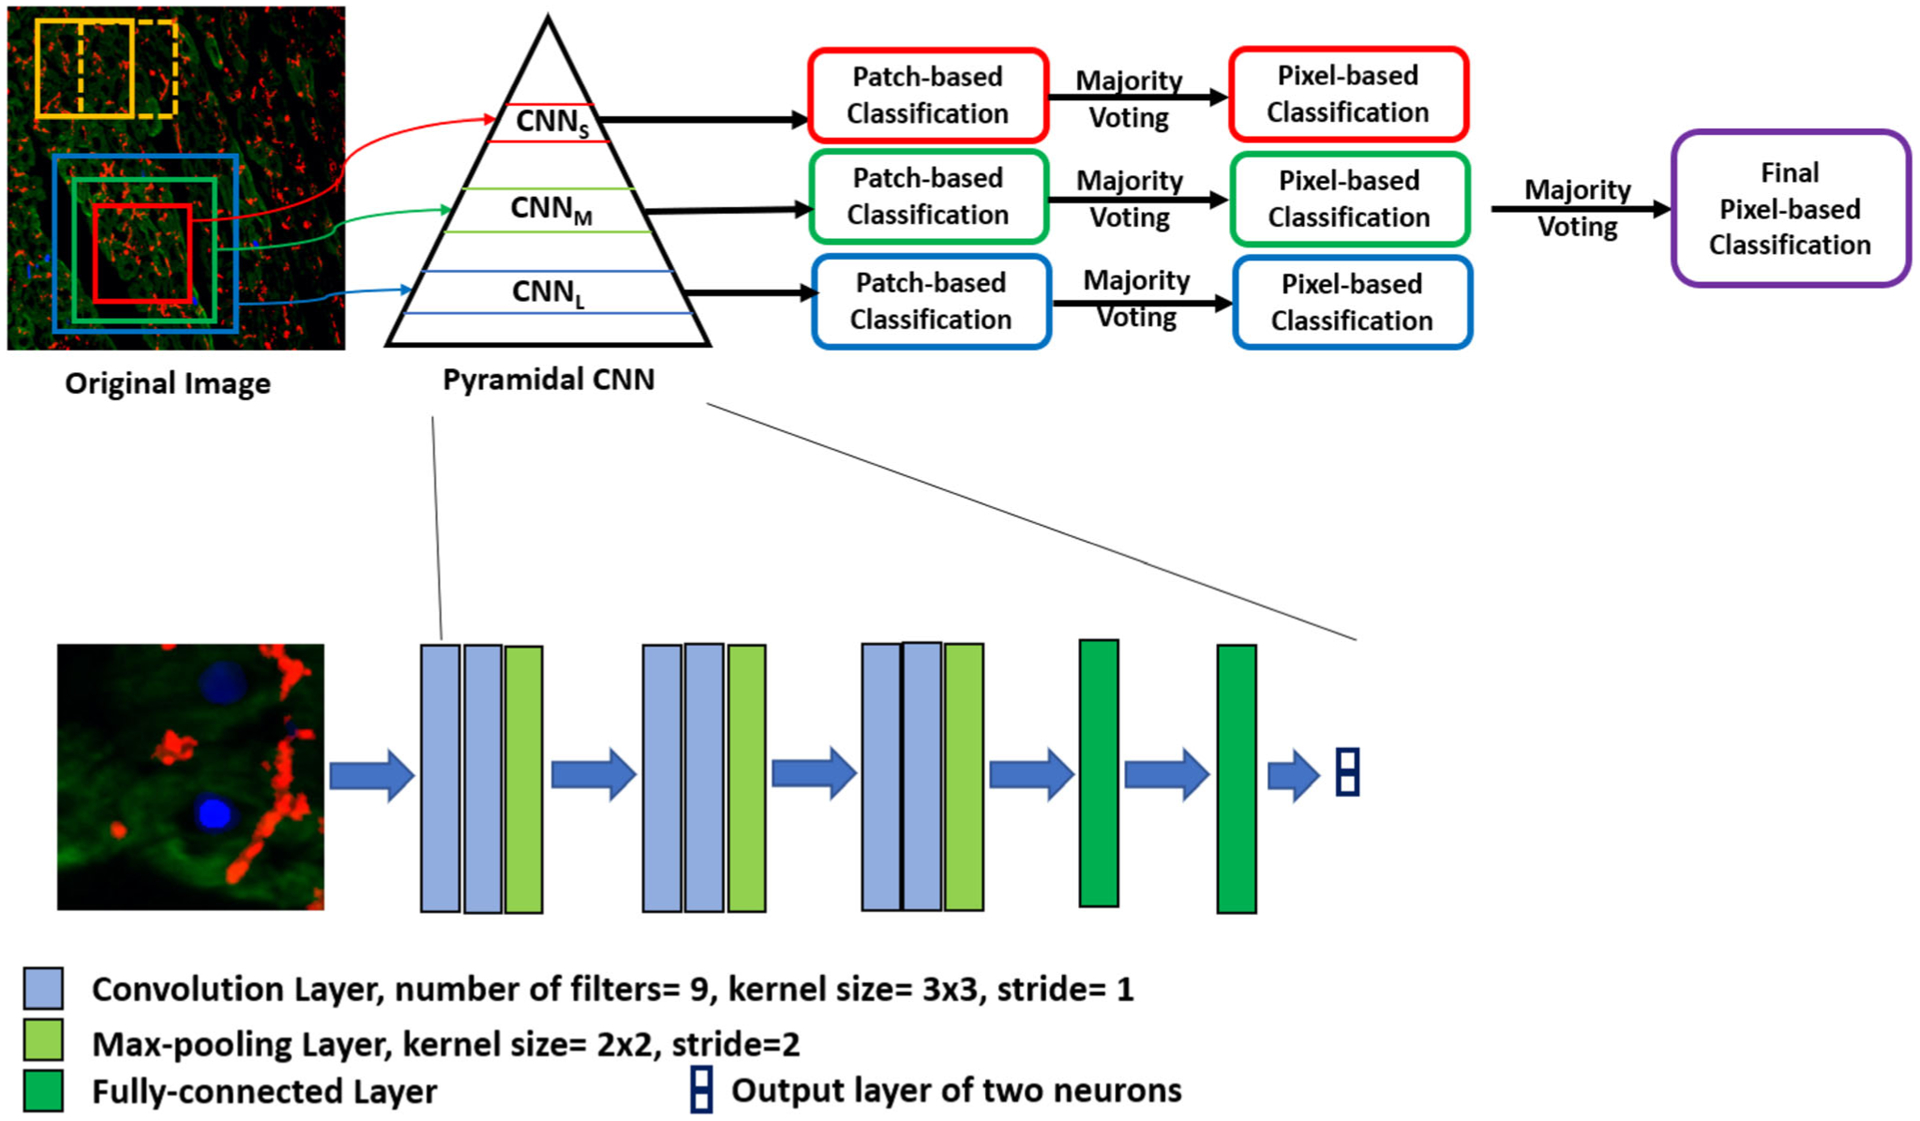
Schematic illustration of our proposed deep learning framework. This figure is a magnification for the deep learning framework box in Fig. 1. The input to the framework is the merged image where nuclear DAPI (Blue), cardiac troponin-T (green), and gap junction protein (connexin 43) (red). Our framework is composed of three CNNs (small, medium, and large) which process three patch sizes to form a pyramidal CNN. The first CNN (CNNS) is fed with a small patch size of 75 × 75, the second CNN (CNNM) is fed with a medium patch size of 100 × 100, and the third CNN (CNNL) is fed with a large patch size of 125 × 125. We designed the three CNNs to have the same architecture as shown in the zoomed part (lower panel). The CNNs classify overlapped patches into two classes. Then, we apply majority voting for each CNN to obtain a pixel-wise classification. Finally, a majority voting is applied again across the three CNN to get a final pixel map for the locations of the structural deterioration in the input image.
Pixel-Wise Classification
Each CNN can provide patch-wise classification and pixel-wise classification for the input tested image. It is easy to think about patch-wise classification while pixel-wise classification requires an illustration. During testing, we give a label for the tested patch then we assign the same label to the pixels of that patch. Because there is an overlap between patches, each pixel can lie in various patches and therefore each pixel have multiple labels. We apply majority voting for the labels of each pixel to obtain a single label. This is how our CNNs provide pixel-wise classification. To obtain better pixel-wise classification, the result of the three CNNs is combined through majority voting (fusion). Now, we have a labelled map for the input image where our classification is on the pixel level. We have two classes: pixels that belong to drug treated cells and pixels that belong to vehicle treated cells. The percentage of the drug treated pixels is estimated. This value represents the percentage of the structural deterioration in the tested image.
Validation of the CNN Prediction by Expert Eye
In order to assess the performance of our method for structural deterioration quantification, pixels which were identified as structurally deteriorated by our pipeline were compared with a manual annotation by an expert. Figure 3 demonstrates the labeling of one cardiomyocytes image where (a) in the figure represents the expert labeling of the regions of structural deterioration. Our initial deep learning structure of CNN gave a different interpretation from the expert eye detected deteriorations (see image (b) in Fig. 3). Then, we modified the CNN structure to produce image (c) in Fig. 3. The modification resulted in the detection of approximately the same deteriorations as the expert eye. Please refer to (d) and (e) in Fig. 3 for the analysis of the results. The CNN modifications included architecture optimization as well as the usage of three smaller patch sizes to increase the accuracy of detection. Accuracy of detection was 93%, sensitivity was 92%, and specificity was 94%.
FIGURE 3.
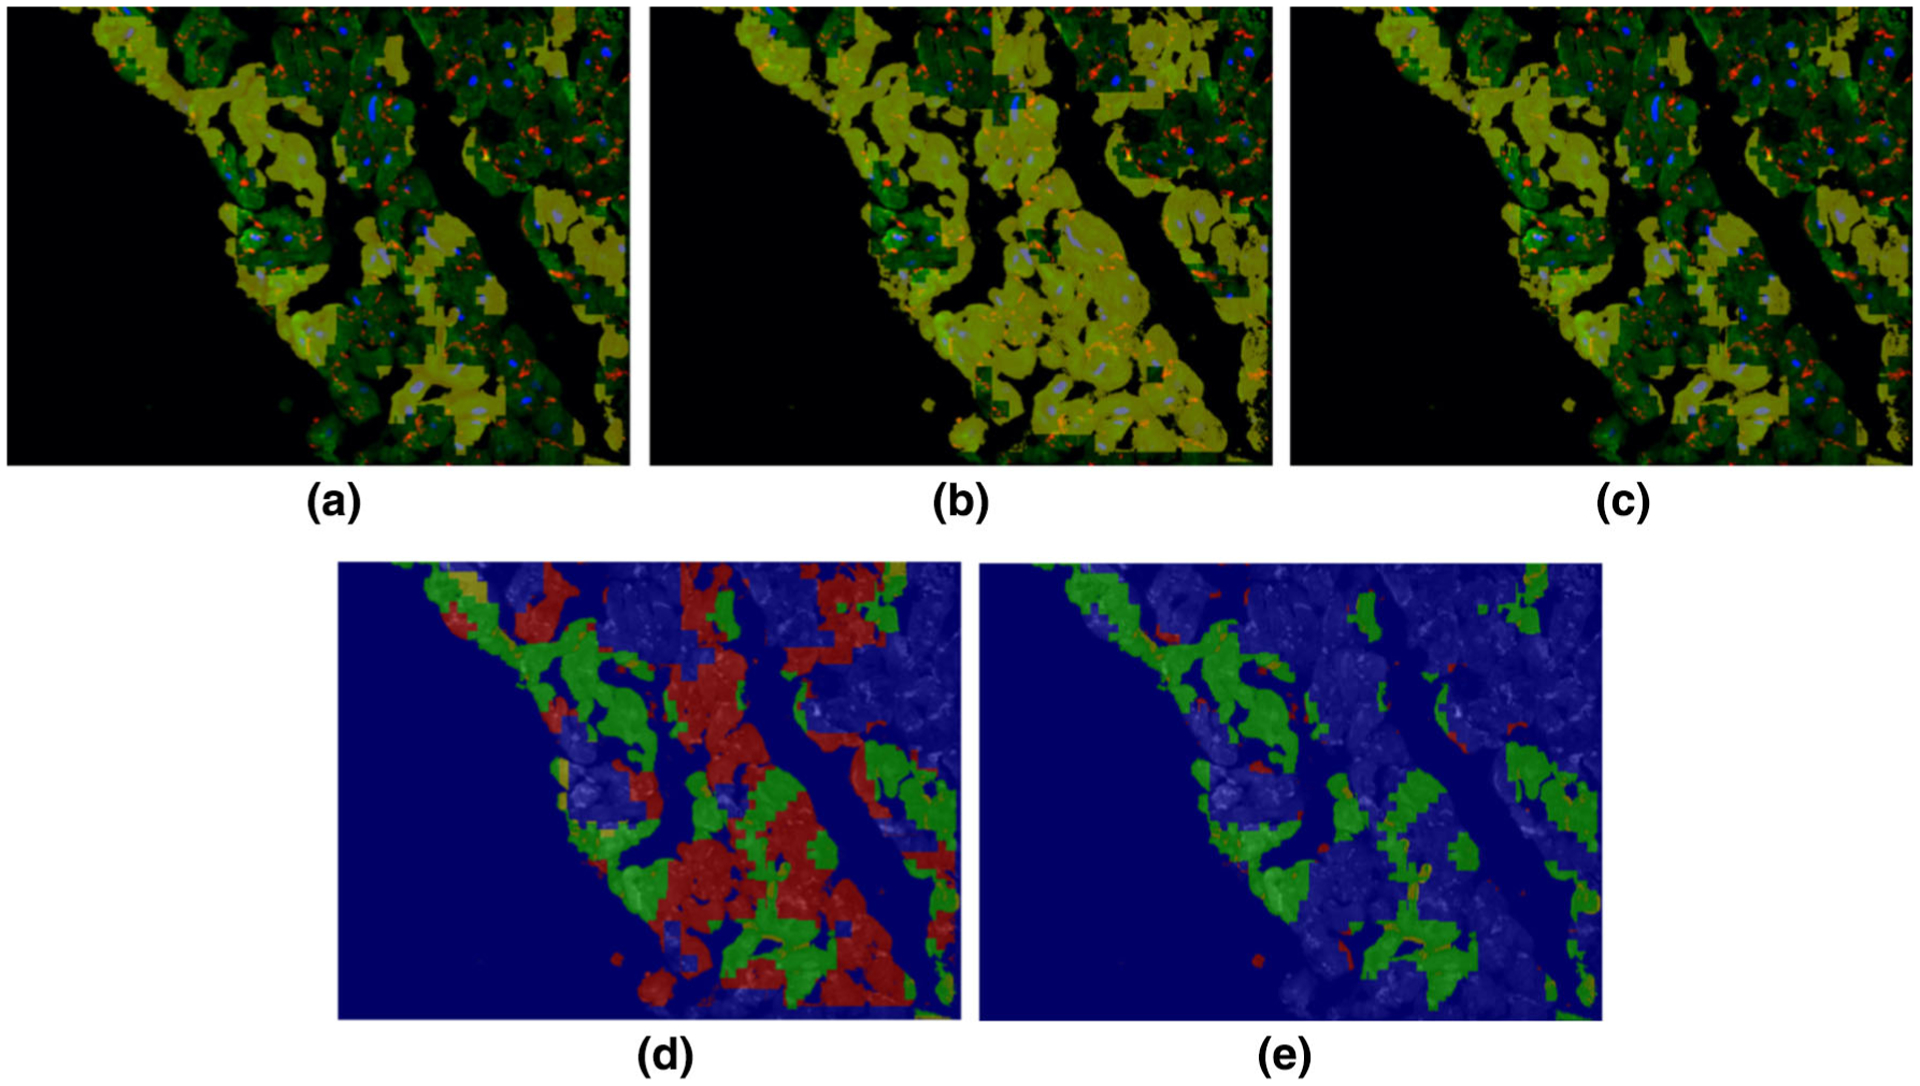
An example of labeling of one cardiomyocytes image. The cardiomyocytes image is shown as a colored image in (a)–(c) where nuclear DAPI, cardiac troponin-T, and gap junction protein (connexin 43) are shown in, blue, green and red colors, respectively, and the yellow overlay (opacity 60%) labels the region of structural deterioration: (a) is the expert labeling (ground truth), (b) is the initial result from our framework before optimization, and (c) is the optimal result from our framework after optimization. Detection accuracy for the images in (b) and (e) are shown in (d) and (e) respectively, where the original cardiomyocytes image is shown as a background gray image. The green, blue, red, and yellow colors in (d) and (e) refer to the true positive, true negative, false positive, and false negative pixels, respectively.
EXPERIMENTAL RESULTS
The deep learning library Tensorflow1 was used to implement our deep learning framework. Determining the optimal parameters of any deep learning framework is an essential component. Therefore, we evaluated the system performance as a function of the parameters. To obtain the optimal parameters we performed a grid search. We searched for the following parameters: The number of layers, number of filters, kernel size, stride, initialization of the convolutional layers, patch size, number of epochs, type of the optimizer, and learning rate. The grid search resulted in the following settings: six convolutional layers, nine filters in each convolutional layers, kernel size = 3 × 3, convolutional layers have a stride = 1 and the max-pooling layers have a stride = 2, He initialization9 was used to initialize the convolutional layers. patch size = 32, number of epochs = 50, Adam optimizer was used with 0.001 learning rate. We transformed each patch in the training set by random flipping and random rotation by angles 90, 180, and 270. This technique is called data augmentation, which is used to increase the size of the training data. Increasing the size of the training data boosts network performance.
We estimated the percentage of the structural deterioration for the cells treated with a vehicle only and drug treated cells. Three drugs were analyzed: Doxorubicin, Herceptin, and Sunitinib. The cells were treated by three doses from each drug: 0.1, 1, and 10 micro-Mole for Doxorubicin and Sunitinib and 1, 10, and 100 μg for Herceptin. Our deep learning framework produces patch-wise classification and pixel-wise classification for each cardiac-cells image in the validation set. Then, the percentage of the structural deterioration is assessed. Tables 1, 2, 3, and 4 show the resultant percentage of the structural deterioration from patch-wise classification and pixel-wise classification for cells treated with vehicle only, Doxorubicin, Sunitinib, and Herceptin, respectively. From Table 1, we can see that small structural deteriorations were detected by our method in the three patch sizes. Patch size 75 × 75 had the highest structural deterioration. In the fusion process, we apply majority voting for the pixel-wise classifications. The value of the structural deterioration resulted by the fusion process is always some value between the range of pixel-wise classification. Fusion gives better estimate of structural deterioration. From Table 2, we can see that high structural deteriorations were detected by our method. patch size 100 × 100 had the highest structural deterioration.
TABLE 1.
Percentage of structural deterioration in the cells treated with vehicle only.
| Patch-wise classification | Pixel-wise classification | ||||||
|---|---|---|---|---|---|---|---|
| Drug dose (μM) | 75 × 75 (%) | 100 × 100 (%) | 125 × 125 (%) | 75 × 75 (%) | 100 × 100 (%) | 125 × 125 (%) | Fusion (%) |
| Vehicle | 5.5 | 4.1 | 3.8 | 4.2 | 3.4 | 3.1 | 3.7 |
Three patch sizes were analyzed: 75 × 75, 100 × 100, and 125 × 125. The analysis was performed on a total of 450 images.
TABLE 2.
Percentage of structural deterioration in the cells treated with Doxorubicin.
| Patch-wise classification | Pixel-wise classification | ||||||
|---|---|---|---|---|---|---|---|
| Drug dose (μM) | 75 × 75 (%) | 100 × 100 (%) | 125 × 125 (%) | 75 × 75 (%) | 100 × 100 (%) | 125 × 125 (%) | Fusion (%) |
| 0.1 | 81 | 88 | 83 | 84 | 89 | 85 | 87.5 |
| 1 | 83 | 88 | 84 | 85 | 89 | 87 | 88 |
| 10 | 84 | 89 | 85 | 86 | 91 | 88 | 89 |
Three patch sizes were analyzed: 75 × 75, 100 × 100, and 125 × 125. The analysis was performed on a total of 375 images for each dose.
TABLE 3.
Percentage of structural deterioration in the cells treated with sunitinib.
| Patch-wise classification | Pixel-wise classification | ||||||
|---|---|---|---|---|---|---|---|
| Drug dose (μM) | 75 × 75 (%) | 100 × 100 (%) | 125 × 125 (%) | 75 × 75 (%) | 100 × 100 (%) | 125 × 125 (%) | Fusion (%) |
| 0.1 | 17 | 21 | 20 | 19 | 23 | 21 | 22 |
| 1 | 40 | 50 | 43 | 43 | 53 | 45 | 49 |
| 10 | 69 | 80 | 75 | 72 | 83 | 76 | 79 |
Three patch sizes were analyzed: 75 × 75, 100 × 100, and 125 × 125. The analysis was performed on a total of 375 images for each dose.
TABLE 4.
Percentage of structural deterioration in the cells treated with Herceptin.
| Patch-wise classification | Pixel-wise classification | ||||||
|---|---|---|---|---|---|---|---|
| Drug dose (μg) | 75 × 75 (%) | 100 × 100 (%) | 125 × 125 (%) | 75 × 75 (%) | 100 × 100 (%) | 125 × 125 (%) | Fusion (%) |
| 1 | 50 | 67 | 57 | 51 | 68 | 58 | 61 |
| 10 | 73 | 78 | 74 | 75 | 79 | 76 | 77.5 |
| 100 | 94 | 98 | 95 | 96 | 99 | 98 | 98.5 |
Three patch sizes were analyzed: 75 × 75, 100 × 100, and 125 × 125. The analysis was performed on a total of 375 images for each dose.
As shown in Tables 2, 3, and 4, among the cells treated by drugs, cells treated by sunitinib gave the lowest structural deterioration. Again, the highest structural deterioration was detected form patch size 100 × 100. Cells treated by Herceptin gave higher structural deterioration than cells treated by sunitinib and gave lower structural deterioration than cells treated by Doxorubicin. Figures 4, 5, 6, and 7 show samples of pixel-wise classifications for the cardiac cells treated by vehicle only, Doxorubicin, Sunitinib, and Herceptin, respectively. The figures show original cardiac-cells images and the same images with a yellow overlays (opacity 60%) that represent the locations of structural deterioration. From Fig. 4, we can notice minor yellow areas. From Figs. 5, 6, and 7, we can notice that the yellow areas increase in size by increasing the drug dose. Figure 8 shows the amount of structural deterioration vs. drug dose for the three drugs.
FIGURE 4.
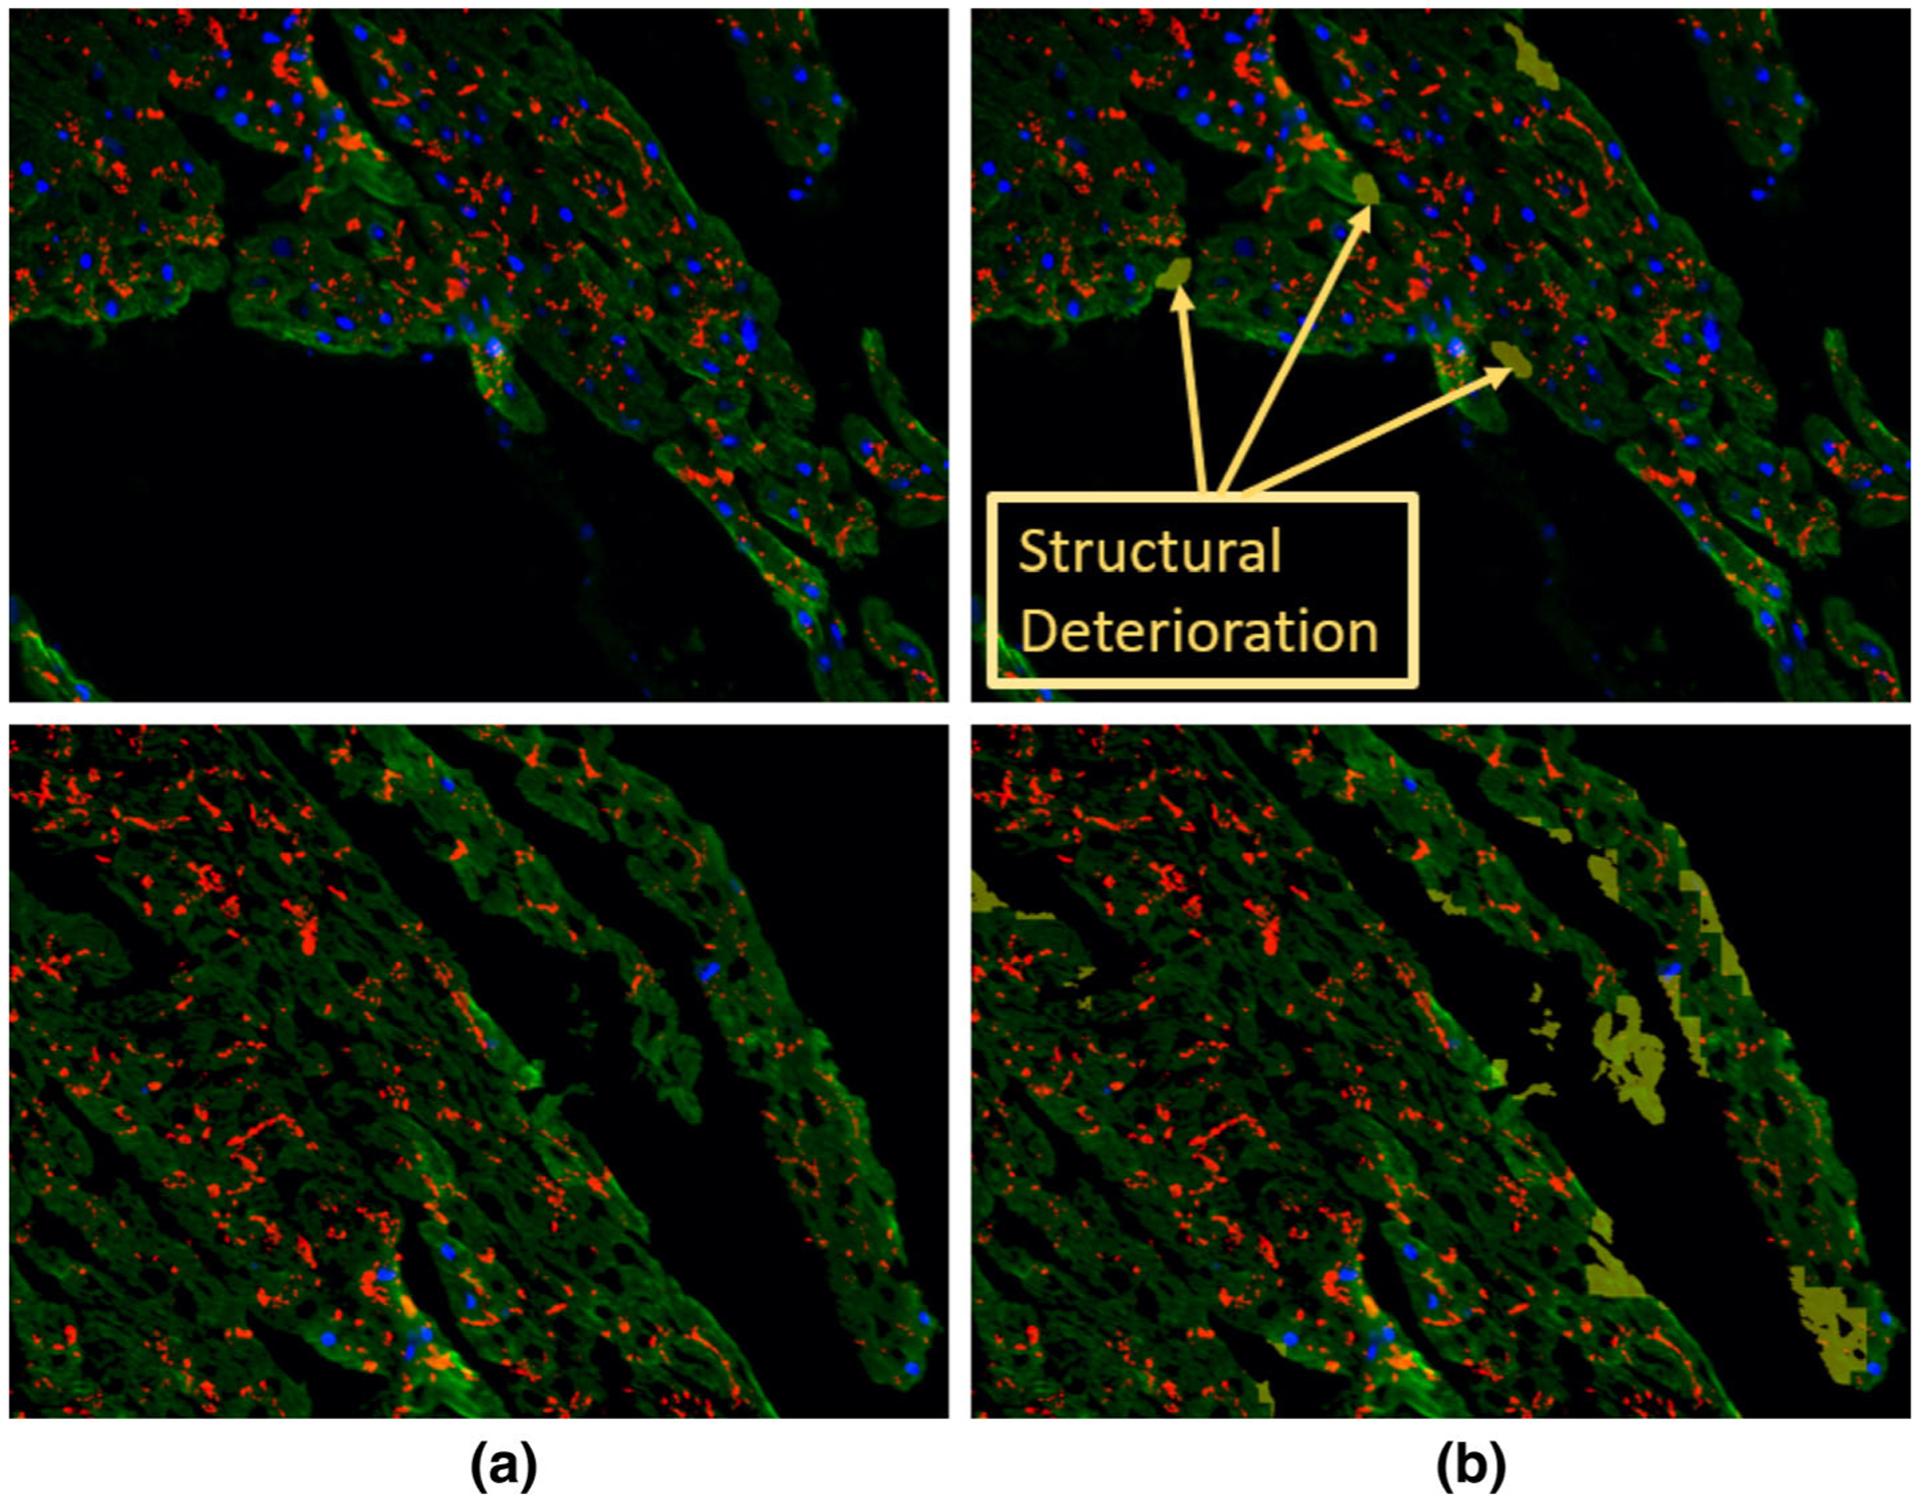
The detected structural deterioration in the images of cells treated by vehicle only. (a) is the original image where nuclear DAPI (Blue), cardiac troponin-T (green), and gap junction protein (connexin 43) (red). (b) is the original image with structural deterioration areas overlaid with yellow color that has opacity of 60%.
FIGURE 5.
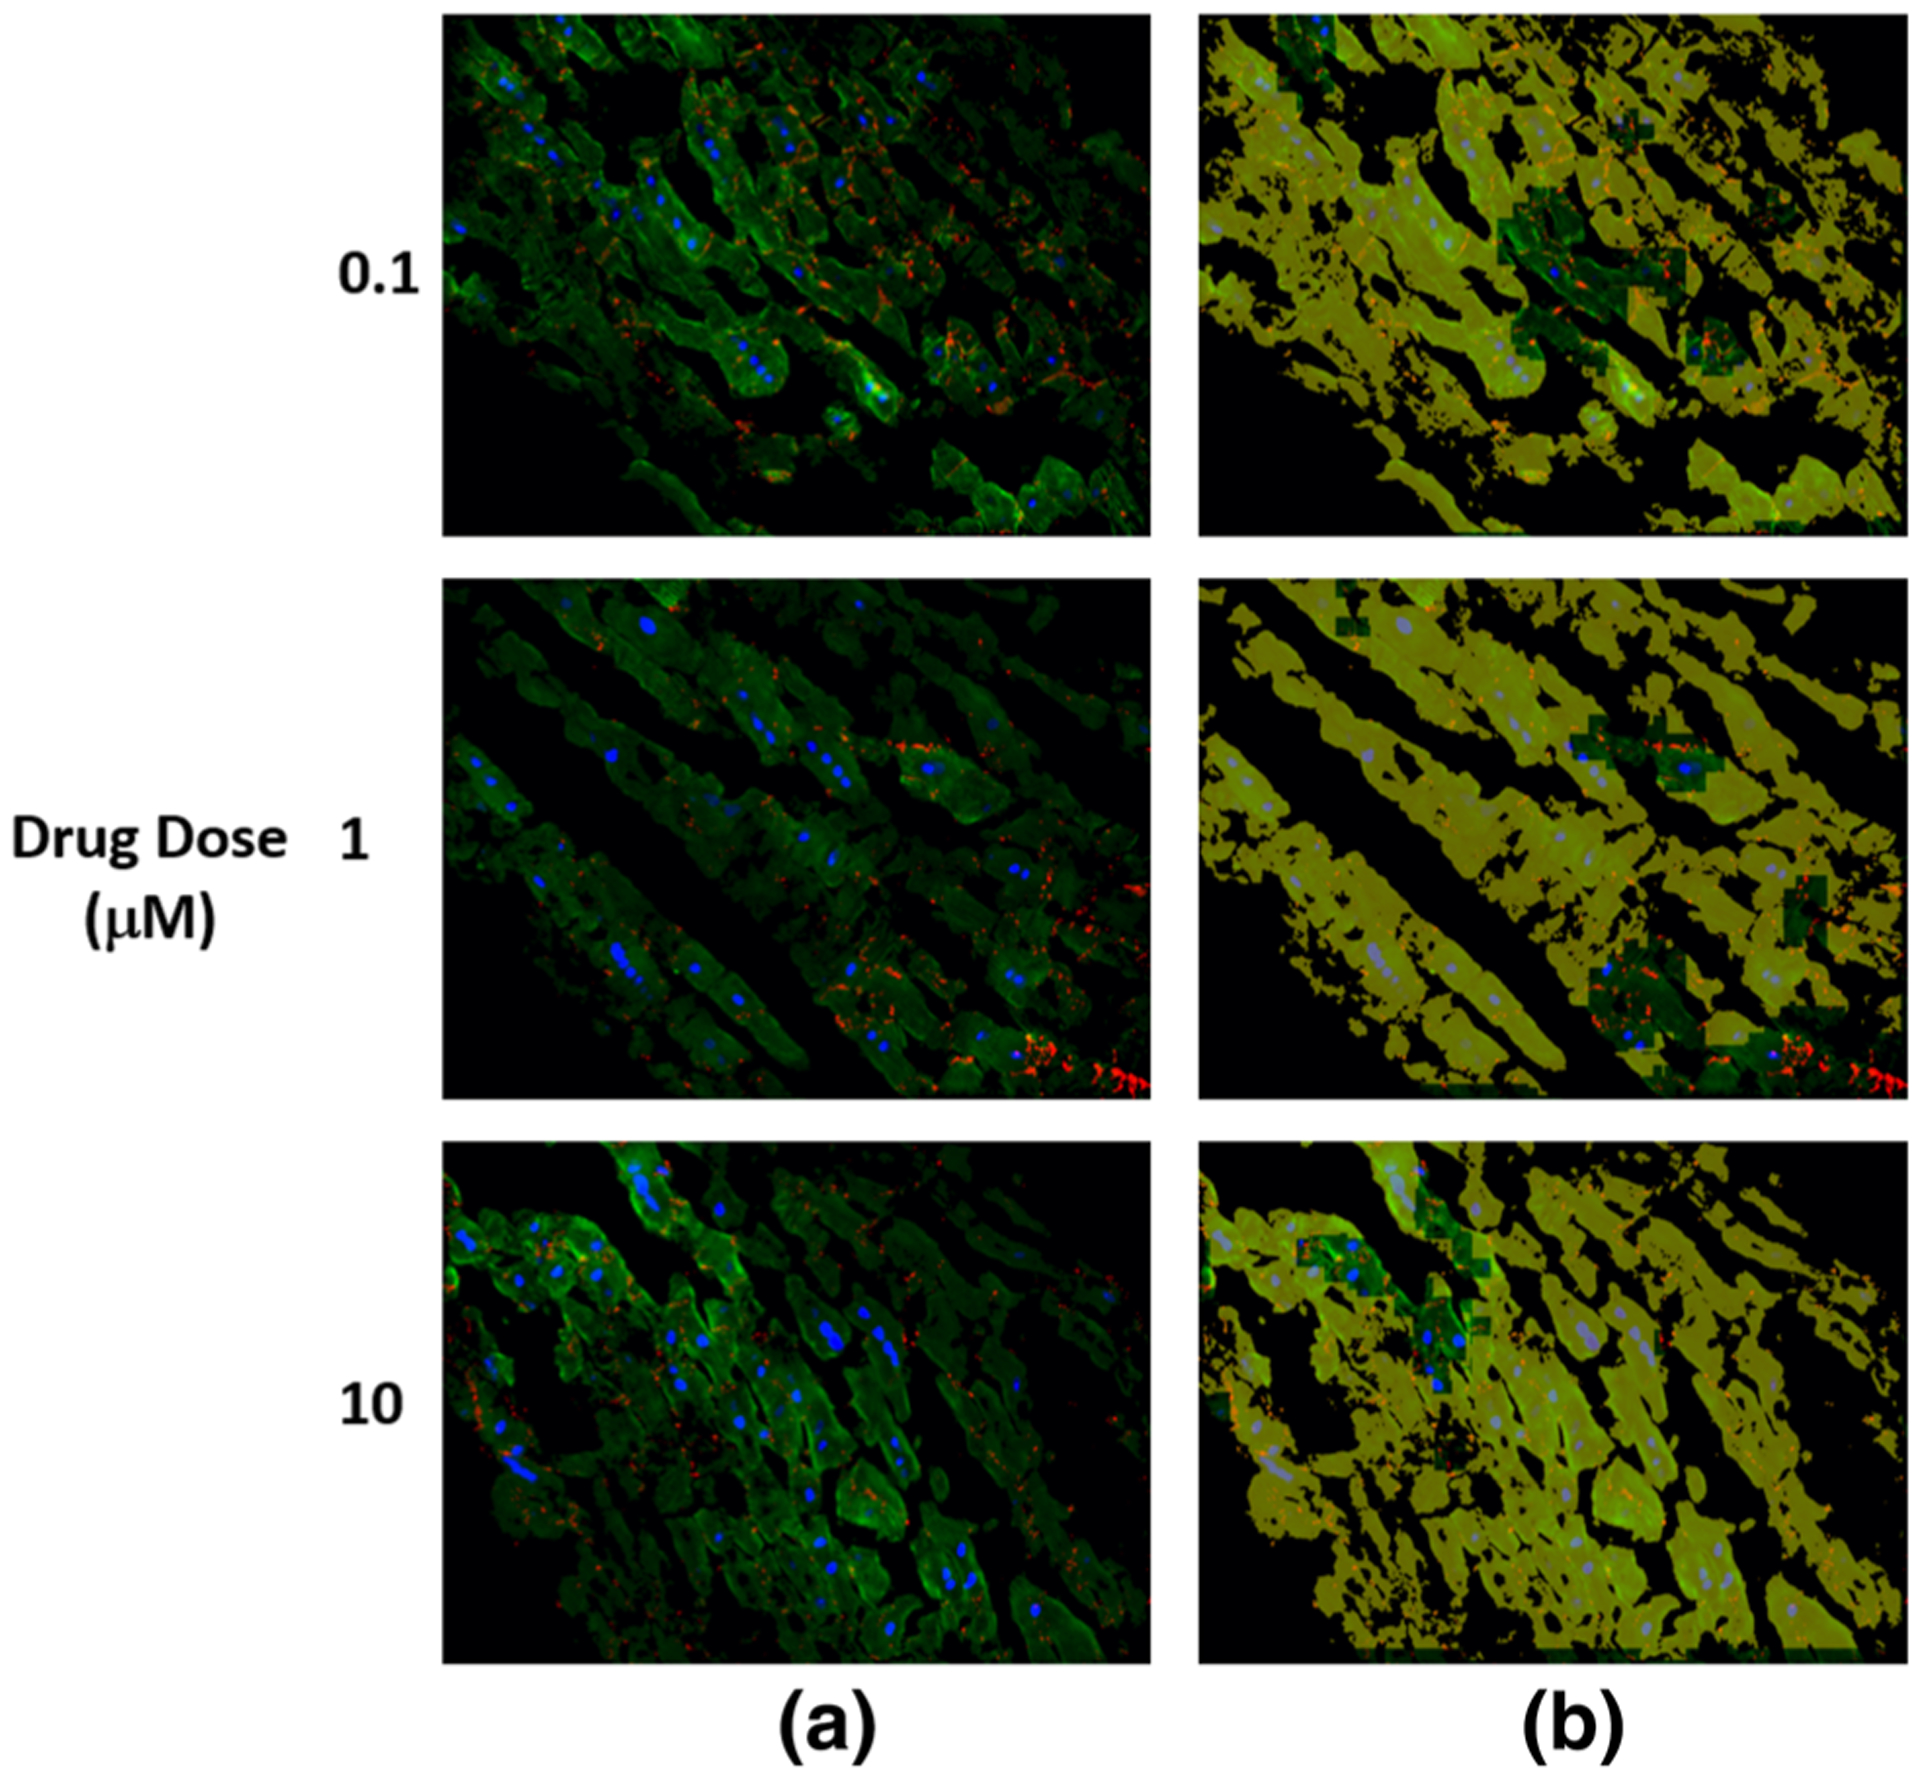
The detected structural deterioration in the images of cells treated by doxorubicin. (a) is the original image where nuclear DAPI (Blue), cardiac troponin-T (green), and gap junction protein (connexin 43) (red). (b) is the original image with structural deterioration areas overlaid with yellow color that has opacity of 60%.
FIGURE 6.
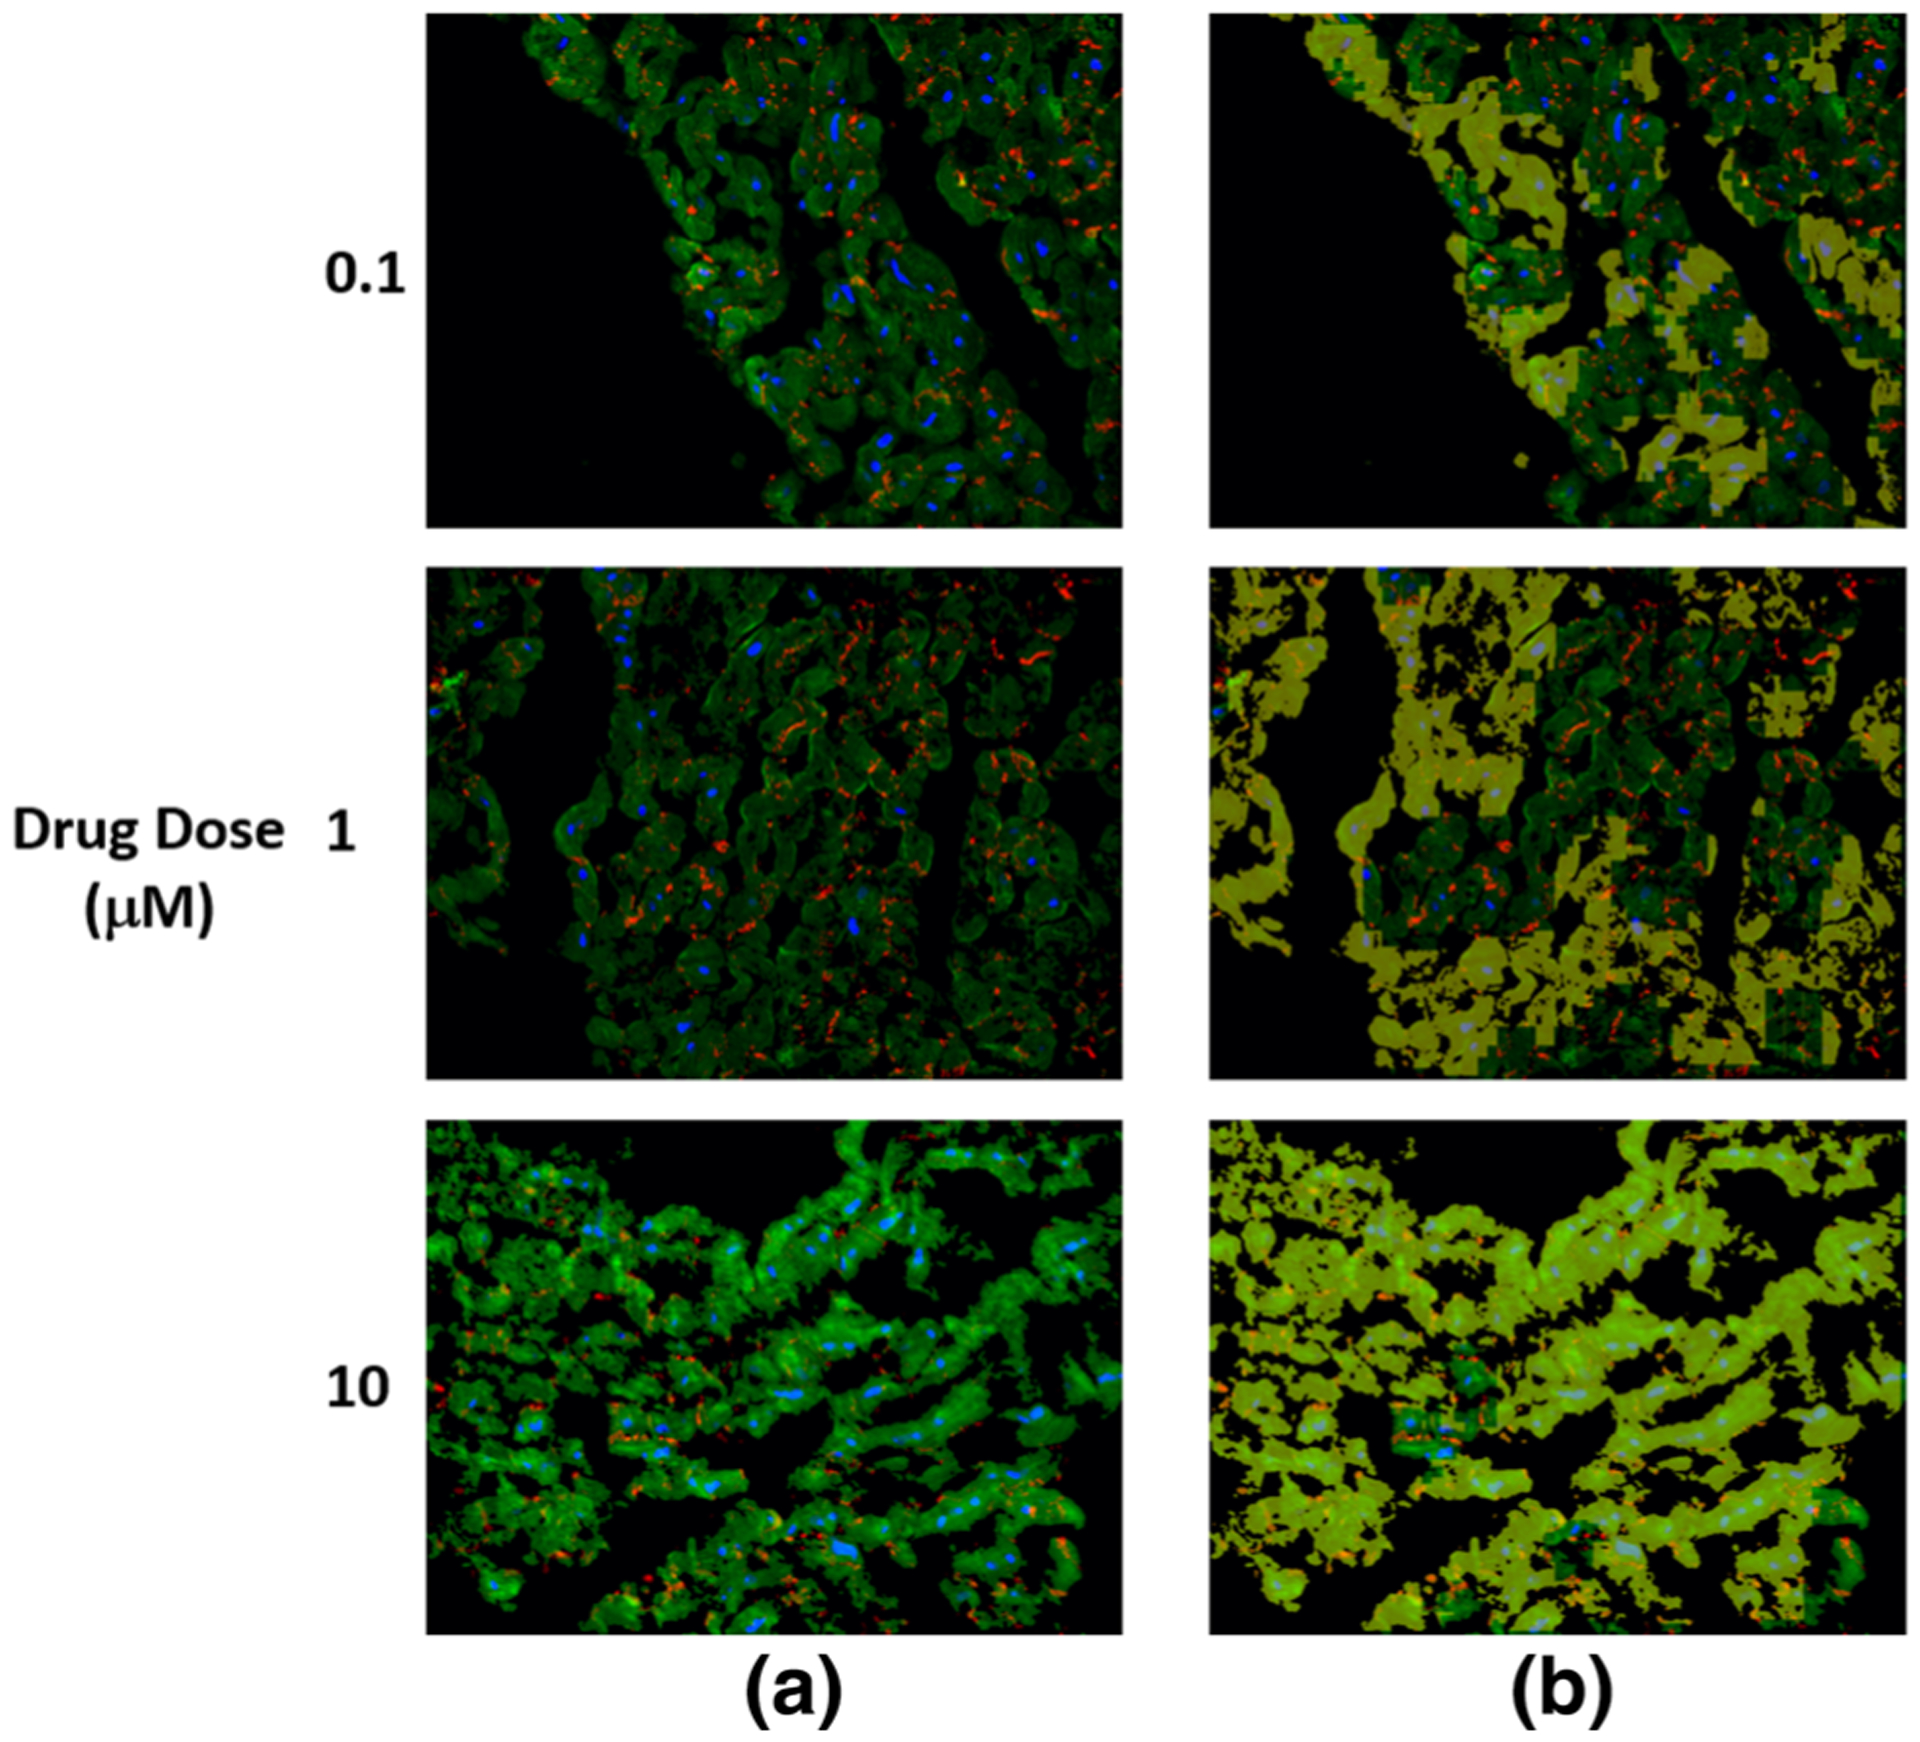
The detected structural deterioration in the images of cells treated by sunitinib. (a) is the original image where nuclear DAPI (Blue), cardiac troponin-T (green), and gap junction protein (connexin 43) (red). (b) is the original image with structural deterioration areas overlaid with yellow color that has opacity of 60%.
FIGURE 7.
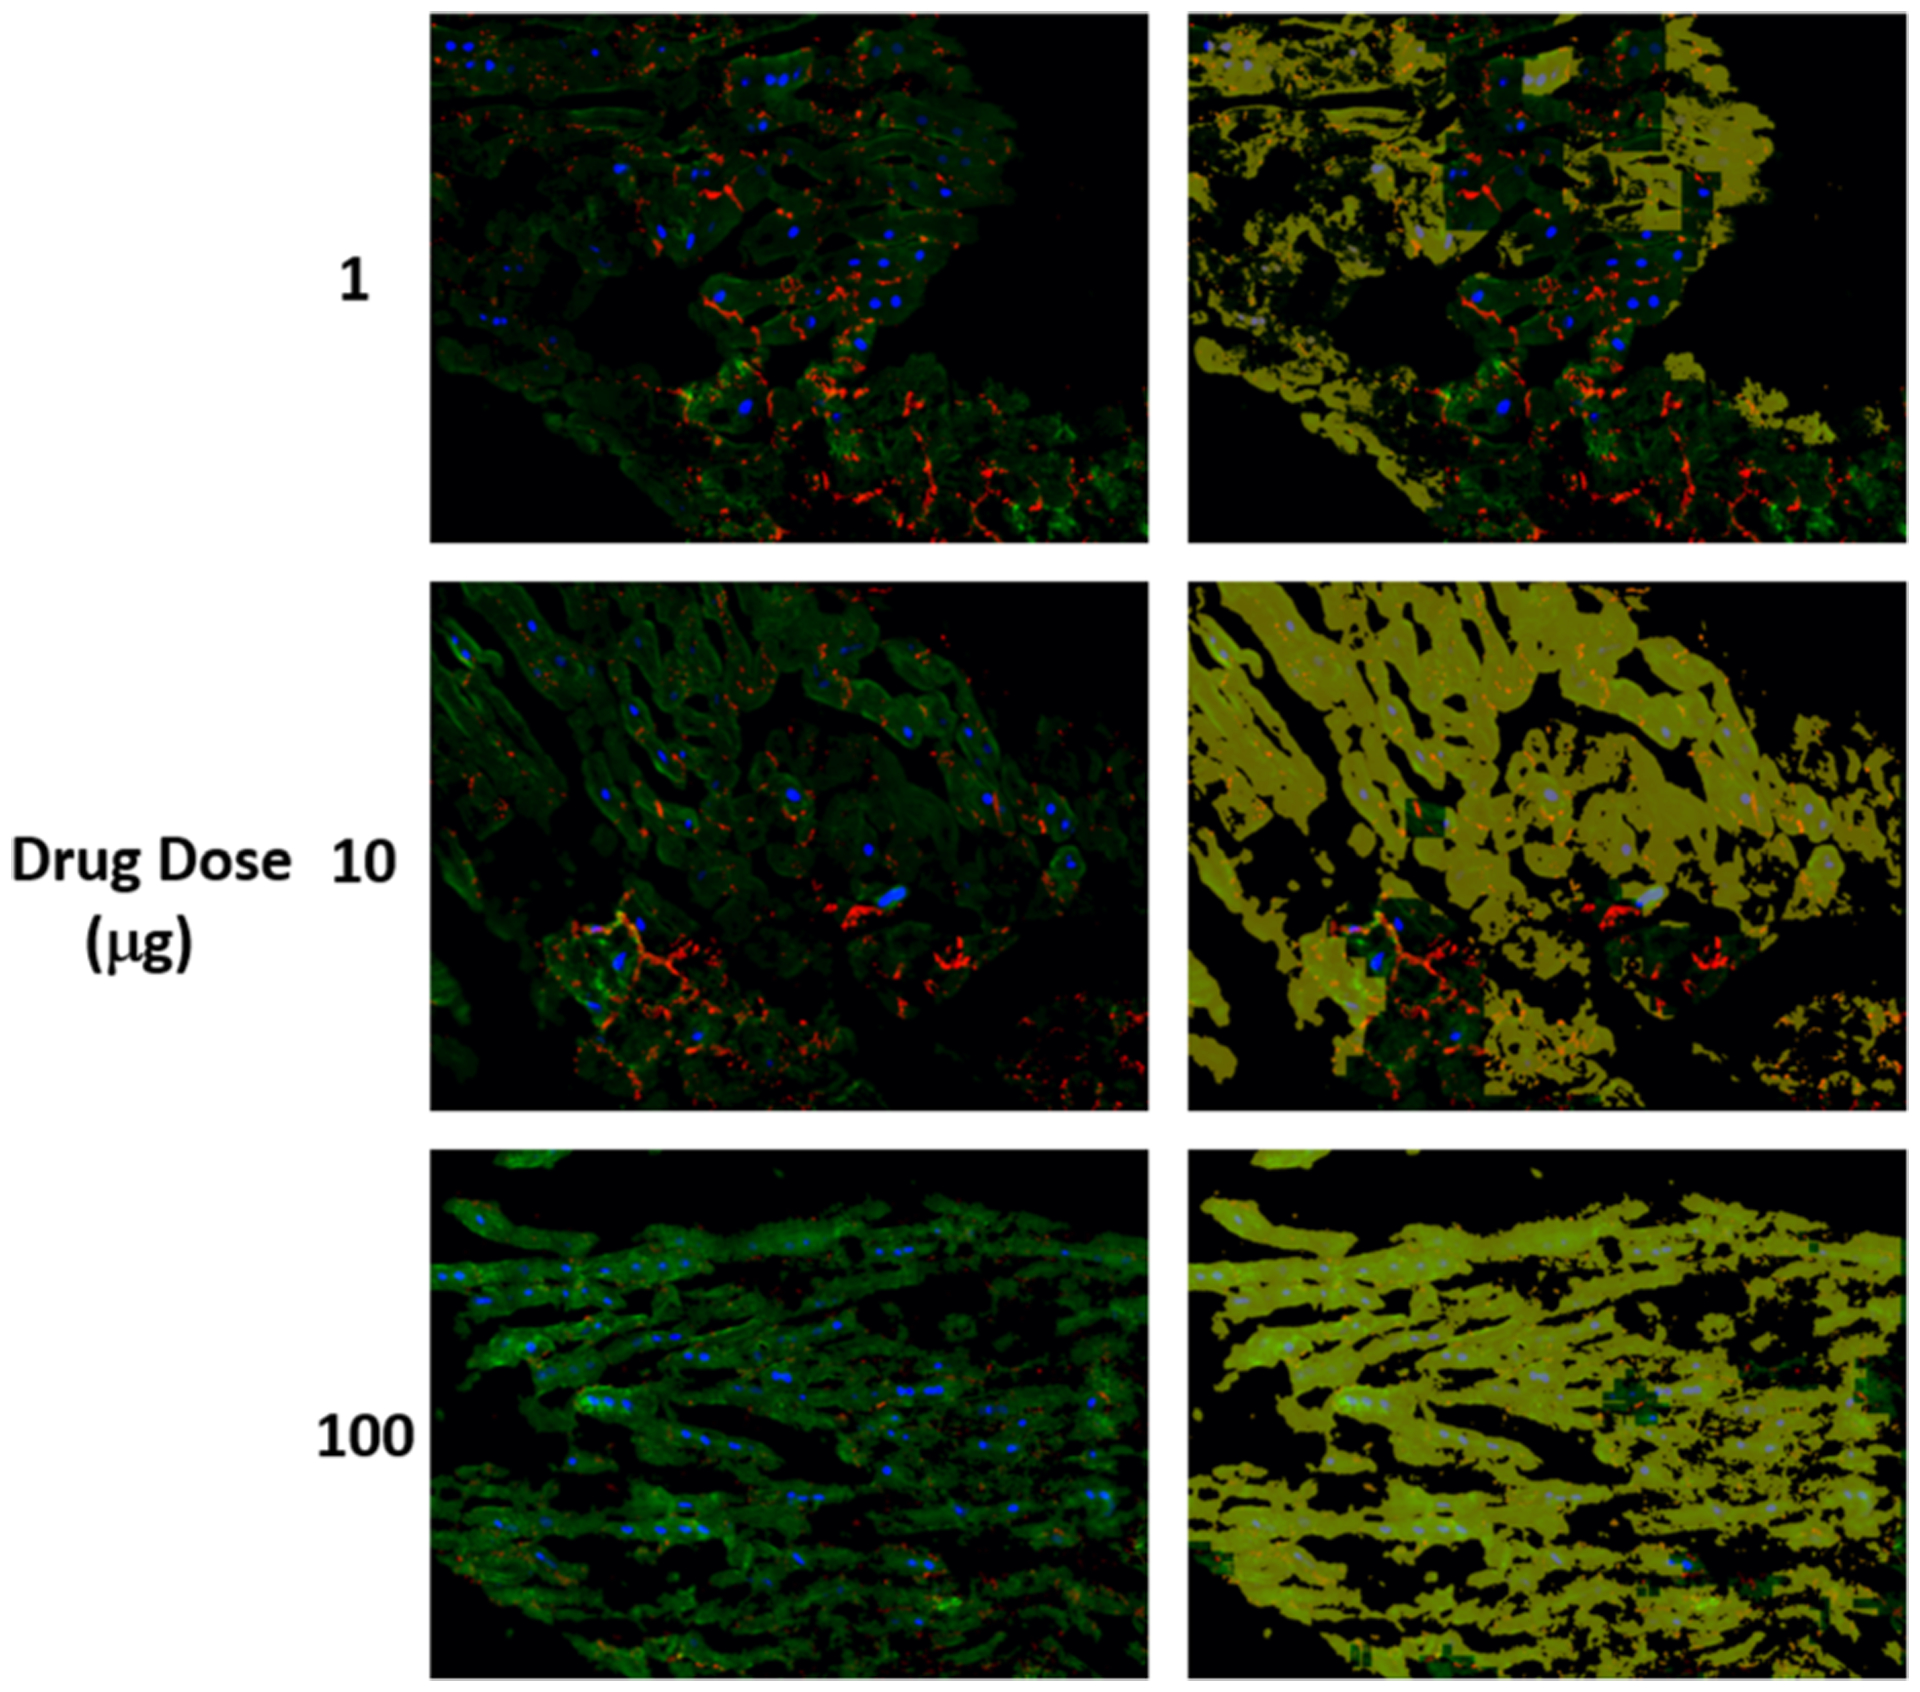
The detected structural deterioration in the images of cells treated by herceptin. (a) is the original image where nuclear DAPI (Blue), cardiac troponin-T (green), and gap junction protein (connexin 43) (red). (b) is the original image with structural deterioration areas overlaid with yellow color that has opacity of 60%.
FIGURE 8.

The percentage of structural deterioration in the cells treated by doxorubicin (a), sunitinib (b), and herceptin (c) vs. drug dose. We can notice that for the three curves that the percentage of the structural deterioration increases with the drug dose. The analysis was performed on a total of 375 images for each drug dose.
Additionally, we have validated our approach to detect structure deterioration at different time-points using independent dataset. Specifically, we imaged the human cardiomyocytes at day 0, 2, 10, and 12. Day 0 and day 2 are expected to show normal tissue structure, while day 10 and day 12 are expected to show structural deterioration. We trained our deep learning framework using data from day 0 and day 12. Then, our aim was to detect the similarity between the cardiac structures in heart slices between day 0 and day 2 in culture as well as day 10 and day 12 in culture. In other words, when we perform two class classification, images of day 0 should be classified as day 0, images from day 2 should be classified as day 0. images from day 10 should be classified as day 12, and images from day 12 should be classified as day 12. Figure 9 shows the probability of being class day 12 for the tested images. Day 0 is correctly classified by a 100% accuracy. Day 12 is correctly classified with 99% accuracy. We can notice that day 2 is similar to some degree to day 0 and day 10 is similar to some degree to day12.
FIGURE 9.
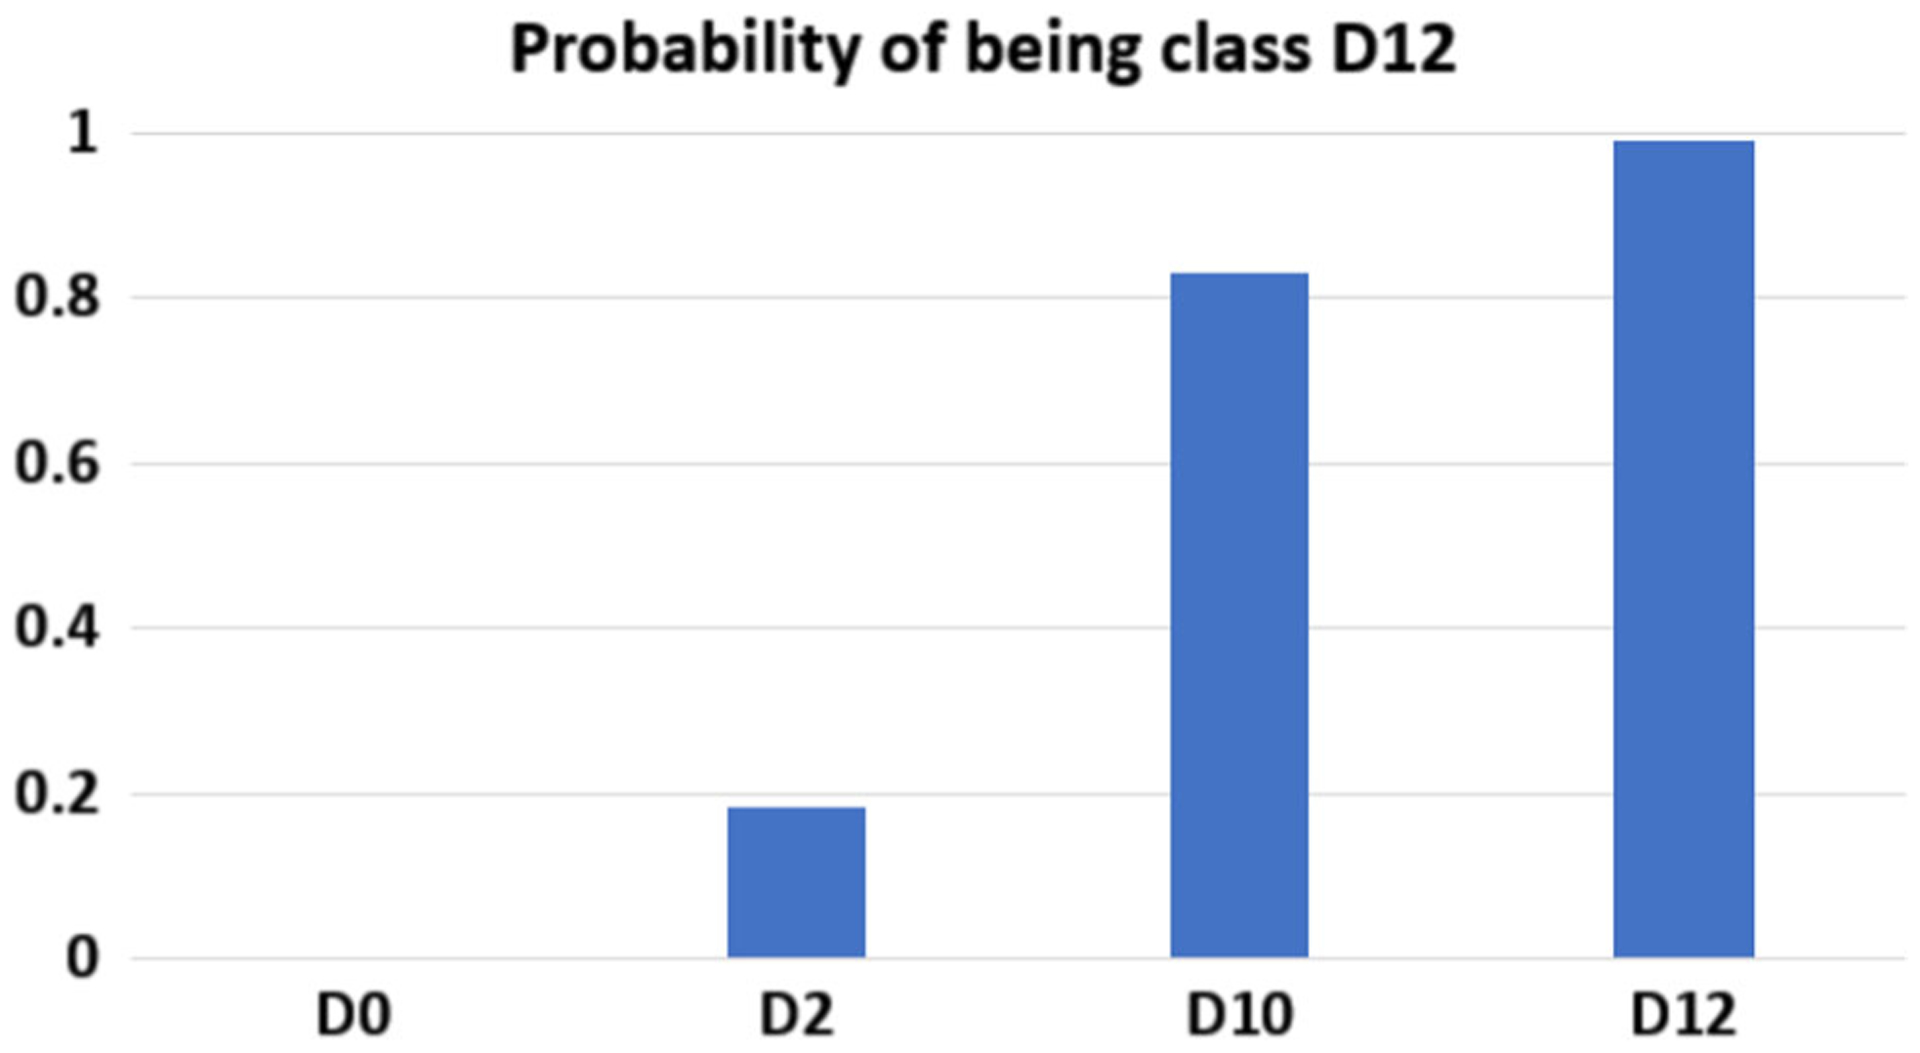
Classification of the tested images that belong to different time-points where D0, D2, D10 and D12 refer to fresh heart slices (D0) or cultured for 2 days, 10 days or 12 days, respectively. The column bar graph shows the probability of the images in being class of day 12 (Total number of images = 300).
DISCUSSION
Drug-induced cardiotoxicity is a major cause of drug attrition.17 Therefore, there is a pressing need for predictable preclinical screening strategies for cardiovascular toxicities associated with emerging new drugs prior to clinical trials. The recent consideration of hiPSC-CMs for testing drug toxicity provided a partial solution for some contexts of use but did not solved the overall need in predicting effects in a diversity of functional cardiac modes of failure. In addition to fetal-like properties, A single cell type does not replicate the complexity of a 3D heart tissue that contains multiple cell types and biological connections.
There have been several studies that investigated the effect of anticancer drugs on human cardiomyocytes. Zhao et al.30 studied the cardiotoxicity induced by doxorubicin in hiPSC-CMs. They stated that doxorubicin can cause dose-dependent problems that range from strange deteriorations in myocardial structure to serious health problems such as cardiomyopathy and congestive heart failure. Cardiotoxicity due to doxorubicin was found at a low dose of 0.5 μM. Maillet et al.13 found that doxorubicin is responsible for dose-dependent apoptotic cell death and the incidence of congestive heart failure is 18% at cumulative doses of 550 to 600 mg/m2. The cardiotoxicity induced by sunitinib was studied by Wang at al.27 They found that death in hiPSC-CMs was induced by sunitinib at doses lager than 3 μM and exposure times over 5 days. Inhibition of autophagic activity in human cardiomyocytes was noticed in a dose-dependent manner when the cardiomyocytes were exposed to 10, 20, and 50 μg/mL doses of Herceptin for 1 day.15 They reported that the most efficient inhibition was at 50 μg/mL dose. Inhibition of autophagy increases DNA damage and production of reactive oxygen species. From Fig. 8, we can conclude that the percentage of structural deterioration in cardiomyocytes is dose-dependent and increases with the applied dose. This finding is consistent with what was reported by Refs. [13,15,27,30]. From Table 2, we can notice that a small dose of doxorubicin (0.1 μM) results in a high percentage of structural deterioration (87.5%). This finding is consistent with30 who reported that doxorubicin-induced cardiotoxicity starts at a dose of 0.5 μM. Wang et al.27 reported that death of cardiomyocytes due to sunitinib occurs at doses larger than 3 μM. These doses lie in the range of our used sunitinib doses. Similarly, we used doses that induce structural deterioration as stated in Ref. [15], in the case of herceptin.
Recent advances in heart slice technology provided a promising platform for reliable cardiotoxicity testing.4,19,28 We were able to demonstrate the clinical cardiotoxic phenotype of three different categories of cardiotoxic drugs using a 3D heart slice culture model.14 We have been able to quantify the effect of cardiotoxins on the heart slice functionality; however, it was not possible for unbiased quantification of the structural effects of the cardiotoxins. We selected three anticancer drugs with known adverse cardiac side effects: doxorubicin, an anthracycline with a long history of cardiotoxicity; Herceptin, a monoclonal antibody target HER2; and, sunitinib, a small molecule multi-targeted kinase inhibitor (TKI) with potent activity against VEGF and PDGF receptors.16 All three drugs have been associated with cardiomyopathy through different mechanisms.16 As the maximum blood concentration of doxorubicin ranges between 100 and 300 nM,2 we used 100 nM, 1 μM, 10 μM concentrations. We used 1, 10 and 100 μg/mL concentrations for herceptin as the blood level is ranging between 1 and 10 μg/mL.24 Sunitinib concentrations of 100 nM, 1 μM, 10 μM were used as the normal blood concentration range is 100–200 nM.26 Here, we generated a deep learning framework that can automatically quantify the effect of cardiotoxins on cardiac tissues. Our deep learning framework is composed of three CNNs that process the cardiac images from multiple views. Furthermore, our framework can quantify the structural deterioration on the patch and pixel levels. In other words, the images of training cross-sections were divided into overlapping patches and were fed to the deep learning framework to teach it how to classify between drug treated cells and vehicle treated cells. This classification corresponds to cells affected by the drug and cells not affected or structural deterioration and normal structure. Then, during the validation, the framework was able to classify the inputted patches into patches with structural deterioration and patches without. Furthermore, due to the fact that there is an overlap between the patches, the pixels of the cardiac image can have multiple labels from the classified patches. By applying majority voting, we can obtain a classification for each pixel. The results of the three CNNs is combined again by majority voting to obtain final classification for each pixel in the cardiac image. Therefore, one of the advantages of our technique is the capability of producing classification maps that detect drug induced structural deterioration on the pixel level. This technology could be widely applied to perform unbiased quantification of the structural effect of the cardiotoxins on heart slices.
FUNDING
TMAM is supported by NIH Grants R01HL147921 and P30GM127607 and American Heart Association Grant 16SDG29950012.
Footnotes
DATA AVAILABILITY
No high throughput sequencing data are generated in this work. All algorithms and calculations are described within the manuscript.
CONFLICT OF INTEREST
Authors HA, FK, KH, JMM, MMM, QO, and AE declare that they have no conflict of interest. TMAM, holds equities in Tenaya Therapeutics.
ETHICS APPROVAL
All institutional and national guidelines for the care and use of laboratory animals were followed and approved by the University of Louisville Institutional Animal Care and Use Committee.
REFERENCES
- 1.Abadi M, Agarwal A, Barham P, Brevdo E, Chen Z, Citro C, Corrado GS, Davis A, Dean J, and Devin M, et al. Tensorflow: large-scale machine learning on heterogeneous distributed systems, 2016. arXiv:1603.04467.
- 2.Barpe DR, Rosa DD, and Froehlich PE. Pharma-cokinetic evaluation of doxorubicin plasma levels in normal and overweight patients with breast cancer and simulation of dose adjustment by different indexes of body mass. Eur. J. Pharma. Sci 41(3–4):458–463, 2010. [DOI] [PubMed] [Google Scholar]
- 3.Fermini B, and Fossa AA. The impact of drug-induced qt interval prolongation on drug discovery and development. Nat. Rev. Drug Discov 2(6):439–447, 2003. [DOI] [PubMed] [Google Scholar]
- 4.Fischer C, Milting H, Fein E, Reiser E, Lu K, Seidel T, Schinner C, Schwarzmayr T, Schramm R, Tomasi R, et al. Long-term functional and structural preservation of precision-cut human myocardium under continuous electromechanical stimulation in vitro. Nat. Commun 10(1):1–12, 2019. [DOI] [PMC free article] [PubMed] [Google Scholar]
- 5.Fu X, Khalil H, Kanisicak O, Boyer JG, Vagnozzi RJ, Maliken BD, Sargent MA, Prasad V, Valiente-Alandi I, Blaxall BC, et al. : Specialized fibroblast differentiated states underlie scar formation in the infarcted mouse heart. J. Clin. Invest 128(5):2127–2143, 2018. [DOI] [PMC free article] [PubMed] [Google Scholar]
- 6.Hammouda K, Khalifa F, Abdeltawab H, Elnakib A, Giridharan G, Zhu M, Ng C, Dassanayaka S, Kong M, Darwish H, et al. : A new framework for performing cardiac strain analysis from cine mri imaging in mice. Sci. Rep 10(1):1–15, 2020. [DOI] [PMC free article] [PubMed] [Google Scholar]
- 7.Hammouda K, Khalifa F, Soliman A, Abdeltawab H, Ghazal M, Abou El-Ghar M, Haddad A, Darwish HE, Keynton R, and El-Baz A: A 3d cnn with a learnable adaptive shape prior for accurate segmentation of bladder wall using mr images. In: 2020 IEEE 17th International Symposium on Biomedical Imaging (ISBI), pp. 935–938. IEEE, 2020. [Google Scholar]
- 8.Hammouda K, Khalifa F, Soliman A, Ghazal M, Abou El-Ghar M, Haddad A, Elmogy M, Darwish H, Keynton R, and El-Baz A: A deep learning-based approach for accurate segmentation of bladder wall using mr images. In: 2019 IEEE International Conference on Imaging Systems and Techniques (IST), pp. 1–6. IEEE, 2019. [Google Scholar]
- 9.He K, Zhang X, Ren S, and Sun J. Delving deep into rectifiers: Surpassing human-level performance on imagenet classification. In: Proceedings of the IEEE International Conference on Computer Vision, pp. 1026–1034, 2015. [Google Scholar]
- 10.Kang C, Qiao Y, Li G, Baechle K, Camelliti P, Rentschler S, Efimov I: Human organotypic cultured cardiac slices: new platform for high throughput preclinical human trials. Sci. Rep 6:28798, 2016. [DOI] [PMC free article] [PubMed] [Google Scholar]
- 11.Kanisicak O, Khalil H, Ivey MJ, Karch J, Maliken BD, Correll RN, Brody MJ, Lin SCJ, Aronow BJ, Tallquist MD, et al. Genetic lineage tracing defines myofibroblast origin and function in the injured heart. Nat. Commun 7(1):1–14, 2016. [DOI] [PMC free article] [PubMed] [Google Scholar]
- 12.Kretzschmar K, Post Y, Bannier-Hélaouët M, Mattiotti A, Drost J, Basak O, Li VS, van den Born M, Gunst QD, Versteeg D, et al. Profiling proliferative cells and their progeny in damaged murine hearts. Proc. Natl. Acad. Sci 115(52):E12245–E12254, 2018. [DOI] [PMC free article] [PubMed] [Google Scholar]
- 13.Maillet A, Tan K, Chai X, Sadananda SN, Mehta A, Ooi J, Hayden MR, Pouladi MA, Ghosh S, Shim W, et al. : Modeling doxorubicin-induced cardiotoxicity in human pluripotent stem cell derived-cardiomyocytes. Sci. Rep 6(1):1–13, 2016. [DOI] [PMC free article] [PubMed] [Google Scholar]
- 14.Miller JM, Meki MH, Ou Q, George SA, Gams A, Abouleisa RR, Tang XL, Ahern BM, Giridharan GA, El-Baz A, et al. Heart slice culture system reliably demonstrates clinical drug-related cardiotoxicity. Toxicol. Appl. Pharmacol 406:115213, 2020. [DOI] [PMC free article] [PubMed] [Google Scholar]
- 15.Mohan N, Shen Y, Endo Y, ElZarrad MK, and Wu WJ. Trastuzumab, but not pertuzumab, dysregulates her2 signaling to mediate inhibition of autophagy and increase in reactive oxygen species production in human cardiomyocytes. Mol. Cancer Therap 15(6):1321–1331, 2016. [DOI] [PubMed] [Google Scholar]
- 16.Moslehi JJ Cardiovascular toxic effects of targeted cancer therapies. N. Engl. J. Med 375(15):1457–1467, 2016. [DOI] [PubMed] [Google Scholar]
- 17.Onakpoya IJ, Heneghan CJ, and Aronson JK. Post-marketing withdrawal of 462 medicinal products because of adverse drug reactions: a systematic review of the world literature. BMC Med. 14(1):10, 2016. [DOI] [PMC free article] [PubMed] [Google Scholar]
- 18.Ou Q, Abouleisa RR, Tang XL, Juhardeen HR, Meki MH, Miller JM, Giridharan G, El-Baz A, Bolli R, and Mohamed TM. Slicing and culturing pig hearts under physiological conditions. J. Visual. Exp. Jove, 2020. 10.3791/60913. [DOI] [PMC free article] [PubMed] [Google Scholar]
- 19.Ou Q, Jacobson Z, Abouleisa RR, Tang XL, Hindi SM, Kumar A, Ivey KN, Giridharan G, El-Baz A, Brittian K, et al. Physiological biomimetic culture system for pig and human heart slices. Circ. Res 125(6):628–642, 2019. [DOI] [PMC free article] [PubMed] [Google Scholar]
- 20.Perbellini F, Watson SA, Scigliano M, Alayoubi S, Tkach S, Bardi I, Quaife N, Kane C, Dufton NP, Simon A, et al. Investigation of cardiac fibroblasts using myocardial slices. Circ. Res 114(1):77–89, 2018. [DOI] [PMC free article] [PubMed] [Google Scholar]
- 21.Pinto AR, Ilinykh A, Ivey MJ, Kuwabara JT, D’antoni ML, Debuque R, Chandran A, Wang L, Arora K, Rosenthal NA, et al. Revisiting cardiac cellular composition. Circ. Res 118(3):400–409, 2016. [DOI] [PMC free article] [PubMed] [Google Scholar]
- 22.Rawat W, and Wang Z. Deep convolutional neural networks for image classification: a comprehensive review. Neu. Comput 29(9):2352–2449, 2017. [DOI] [PubMed] [Google Scholar]
- 23.Robertson C, Tran DD, and George SC. Concise review: Maturation phases of human pluripotent stem cell-derived cardiomyocytes. Stem Cells 31(5):829–837, 2013. [DOI] [PMC free article] [PubMed] [Google Scholar]
- 24.Stemmler HJ, Schmitt M, Willems A, Bernhard H, Harbeck N, and Heinemann V. Ratio of trastuzumab levels in serum and cerebrospinal fluid is altered in her2-positive breast cancer patients with brain metastases and impairment of blood-brain barrier. Anti-Cancer Drugs 18(1):23–28, 2007. [DOI] [PubMed] [Google Scholar]
- 25.Sze V, Chen YH, Yang TJ, and Emer JS. Efficient processing of deep neural networks: a tutorial and survey. Proc. IEEE 105(12):2295–2329, 2017. [Google Scholar]
- 26.Takasaki S, Kawasaki Y, Kikuchi M, Tanaka M, Suzuka M, Noda A, Sato Y, Yamashita S, Mitsuzuka K, Saito H, et al. Relationships between sunitinib plasma concentration and clinical outcomes in japanese patients with metastatic renal cell carcinoma. Int. J. Clin. Oncol 23(5):936–943, 2018. [DOI] [PubMed] [Google Scholar]
- 27.Wang H, Sheehan RP, Palmer AC, Everley RA, Boswell SA, Ron-Harel N, Ringel AE, Holton KM, Jacobson CA, Erickson AR, et al. Adaptation of human ipsc-derived cardiomyocytes to tyrosine kinase inhibitors reduces acute cardiotoxicity via metabolic reprogramming. Cell Syst. 8(5):412–426, 2019. [DOI] [PMC free article] [PubMed] [Google Scholar]
- 28.Watson SA, Duff J, Bardi I, Zabielska M, Ata-nur SS, Jabbour RJ, Simon A, Tomas A, Smolenski RT, Harding SE, et al. Biomimetic electromechanical stimulation to maintain adult myocardial slices in vitro. Nat. Commun 10(1):1–15, 2019. [DOI] [PMC free article] [PubMed] [Google Scholar]
- 29.Watson SA, Scigliano M, Bardi I, Ascione R, Terracciano CM, and Perbellini F. Preparation of viable adult ventricular myocardial slices from large and small mammals. Nat. Protoc 12(12):2623–2639, 2017. [DOI] [PubMed] [Google Scholar]
- 30.Zhao L, and Zhang B. Doxorubicin induces cardiotoxicity through upregulation of death receptors mediated apoptosis in cardiomyocytes. Sci. Rep 7(1):1–11, 2017. [DOI] [PMC free article] [PubMed] [Google Scholar]


