Cho et al. revealed that tricellulin links tricellular junction–specific tight junction strands, the central sealing elements, with F-actin anchored end-on to tricellular junctions. This enables the converging central sealing elements to remain in proximity, which effectively closes the gap between three epithelial cells.
Abstract
The epithelial cell sheet functions as a barrier to prevent invasion of pathogens. It is necessary to eliminate intercellular gaps not only at bicellular junctions, but also at tricellular contacts, where three cells meet, to maintain epithelial barrier function. To that end, tight junctions between adjacent cells must associate as closely as possible, particularly at tricellular contacts. Tricellulin is an integral component of tricellular tight junctions (tTJs), but the molecular mechanism of its contribution to the epithelial barrier function remains unclear. In this study, we revealed that tricellulin contributes to barrier formation by regulating actomyosin organization at tricellular junctions. Furthermore, we identified α-catenin, which is thought to function only at adherens junctions, as a novel binding partner of tricellulin. α-catenin bridges tricellulin attachment to the bicellular actin cables that are anchored end-on at tricellular junctions. Thus, tricellulin mobilizes actomyosin contractility to close the lateral gap between the TJ strands of the three proximate cells that converge on tricellular junctions.
Introduction
Tight junctions (TJs) are essential for the barrier function of the epithelial cell sheet. The major constituent of TJs is the four-transmembrane protein, claudin (Tsukita et al., 2001). Claudins from adjacent epithelial cells bind to each other to seal the intercellular gap between the two cells. However, in order to fulfill the barrier function of the epithelial cell sheet, it is important to seal not only bicellular junctions but also the point that forms when three cells meet (Higashi and Miller, 2017). As claudins cannot form homophilic interactions simultaneously between the three cells, specialized structures called tricellular TJs (tTJs) are assembled to close the gap at tricellular junctions (Friend and Gilula, 1972; Staehelin, 1973; Wade and Karnovsky, 1974). Bicellular TJ (bTJ) strands that converge at tricellular contacts extend vertically in the basal direction to form tTJ strands called the central sealing elements (Wade and Karnovsky, 1974). Consequently, a tricellular junction is essentially the miniscule central tube that is formed by the three pairs of tTJ strands and their associated plasma membranes (Staehelin, 1973). Thus, tricellular junctions are particularly vulnerable structures in the epithelial barrier. Indeed, it is reported that neutrophils preferentially transmigrate across the endothelium at tricellular junctions (Burns et al., 2003; Burns et al., 1997; Sumagin and Sarelius, 2010). To minimize the size of the central tube, it is necessary to gather the central sealing elements as closely as possible. However, the molecular mechanism to achieve this remains completely unknown.
The discovery of tricellulin revealed that a tTJ differs from a bTJ in terms of not only strand organization but also molecular composition (Ikenouchi et al., 2005). Tricellulin is an ∼65-kD, four-transmembrane protein that is the first identified integral component of tTJs. Tricellulin localization is controlled through at least two independent mechanisms. Localization of tricellulin at tTJs was lost when another membrane protein of tTJs, LSR (also known as Angulin-1), was knocked down in cultured epithelial cells, indicating that LSR recruits tricellulin to tTJs through protein–protein interaction (Masuda et al., 2011). In the other mechanism, occludin, a bTJ membrane protein that shows sequence similarity to tricellulin, excludes tricellulin from bTJ, since tricellulin is mislocalized to bTJ in occludin knockdown (KD) cultured epithelial cells and in epithelial tissue of Occ−/− mice (Ikenouchi et al., 2008; Kitajiri et al., 2014).
Mutations of tricellulin lead to the onset of heritable, nonsyndromic deafness called DFNB49 (Riazuddin et al., 2006). We previously reported that knockdown of tricellulin by siRNA impaired the formation of tTJs and epithelial barrier function (Ikenouchi et al., 2005). In agreement with this observation, it was reported that the organization of tTJs was severely affected in the knock-in mouse that carries a mutation orthologous to the tricellulin mutation linked to DFNB49 (TricR497X/R497X; Nayak et al., 2013). Freeze-fracture EM revealed that the central sealing elements were not laterally associated in the TricR497X/R497X mice, resulting in the formation of a large central tube and the increase of paracellular leaking of ions (Nayak et al., 2013). Therefore, tricellulin appears to be directly involved in the lateral association of central sealing elements to minimize the diameter of the central tube and to keep TJs functionally continuous at the tricellular contacts, by making two vertical strands of central sealing elements laterally associated in a very tight manner; however, its detailed mechanisms remain unclear.
Tricellular junctions are tension hotspots where mechanical force is applied to cell adhesion molecules (Bosveld et al., 2018; Letizia et al., 2019; Uechi and Kuranaga, 2019). Tricellular junctions experience high tension due to outward forces generated by actomyosin-dependent line tension acting along each bicellular junction. Homologues of neither tricellulin nor LSR have been identified in invertebrate epithelial cells. However, several cell adhesion molecules are enriched at tricellular junctions (Bosveld and Bellaïche, 2020; Byri et al., 2015; Schulte et al., 2003). Among them, Sidekick (Sdk), which belongs to the immunoglobulin superfamily, is concentrated at tricellular adherence junctions (tAJs) in Drosophila (Lye et al., 2014). In a departure from the vertebrate system, Sdk itself mediates homophilic adhesions between the three cells that comprise the tAJ. Additionally, Sdk anchors the actomyosin cytoskeleton through Polychaetoid (mammalian homologue of ZO-1) and Canoe (mammalian homologue of afadin) at tricellular junctions (Letizia et al., 2019). However, in the case of vertebrate epithelia, the functional relationship between either tricellulin or LSR and the underlying actomyosin cytoskeleton at tricellular junctions is not known.
In the present study, we revealed that tricellulin anchors F-actin connected to tricellular junctions in an end-on manner via α-catenin, the principal scaffold protein of AJs. Tricellulin plays an essential role in the formation of tTJs by coupling close association of two central sealing elements with actomyosin contractility at tricellular junctions.
Results
Formation of tricellular actin meshworks during maturation of epithelial junction
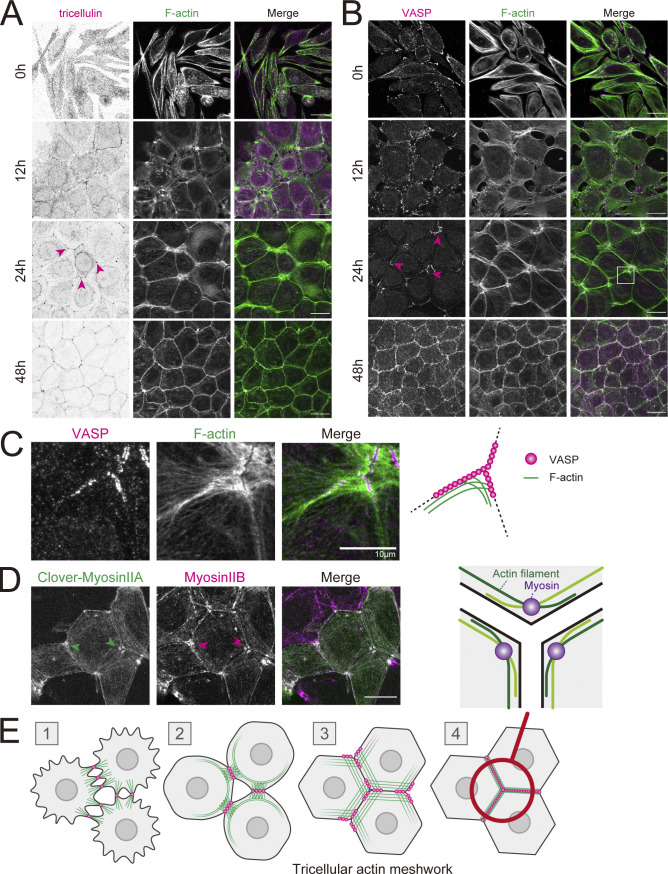
To elucidate the molecular mechanisms of barrier formation at tTJs, we first investigated the contribution of the actin cytoskeleton. The actin cytoskeleton is dynamically reorganized during the formation of epithelial cell adhesion. The process of reorganizing the actin cytoskeleton associated with the formation of bicellular junctions has been analyzed in detail (Kishikawa et al., 2008; Vasioukhin et al., 2000; Yonemura et al., 1995), but with regard to tricellular junctions, the analysis is rudimentary. Therefore, we undertook to describe in detail the reorganization of the actin cytoskeleton associated with the formation of tricellular junctions using the Ca2+ switch assay in the mouse mammary epithelial cell line EpH4. EpH4 cells were cultured in low-Ca2+ medium overnight, after which cell adhesion formation was initiated by switching to normal-Ca2+ medium (Fig. 1, A and B).
Figure 1.
Formation of a tricellular actin meshwork during epithelial junction formation. (A–C) WT EpH4 cells (EpH4 WT) were cultured overnight in low-calcium medium then in normal culture medium containing calcium for 0, 12, 24, and 48 h. Cells were fixed and stained with phalloidin (green) and either anti-tricellulin mAb (N24-69 was used throughout for immunofluorescence unless noted otherwise; A) or anti-VASP mAb (magenta; B). The boxed region is magnified in C. Magenta arrowheads indicate tricellulin or VASP localized at tricellular junctions. Scale bar: 20 μm. (D) WT EpH4 cells expressing Clover-myosin IIA were stained with anti-myosin IIB mAb (magenta). Arrowheads indicate that myosin II localized at tricellular junctions. Scale bar: 20 μm. (E) Schematic showing the process of junction formation focusing on the changes in VASP localization (magenta circles) and distribution of actin filaments (green lines). Appearance of sparse, spot-like AJs between nearby cells signals the initiation of epithelial adhesion formation (stage 1). AJs increase in density, which triggers the formation of mature, belt-like AJs (stage 2). VASPs accumulate at these primordial AJs, which anchor actin filaments that are perpendicularly associated. During these initial stages, tricellulins do not localize to spot-like AJs (stage 1) but gradually accumulate at maturing bicellular junctions (Fig. 1 A, 12 h, stage 2). The maturation of belt-like AJs and the formation of bicellular TJs alter tricellulin localization to tricellular junctions only (Fig. 1 A, 24 h, stage 3). At the same time, VASPs strongly accumulate to the ends of bicellular junctions in the vicinity of tricellular junctions. Two actin cables running along converging bicellular junctions crisscross at VASP-positive junctions, resulting in the formation of a finely interlaced mesh-like actin network at tricellular corners, which we call “tricellular actin meshwork.” Finally, when tricellular TJs are sealed, VASPs are no longer concentrated around tricellular junctions, and the actin meshwork is bundled to linear actomyosin fibers (stage 4). The region circled in red is enlarged to show a schematic of the orientation of the actin filaments that crisscross at the tricellular junction. The actin filaments (green lines) that run along bicellular junctions intersect at the tricellular corner to form partially overlapping, antiparallel strands. Myosin (purple circles) concentrate where actin filaments overlap. Based on the observation of actin distribution at tricellular junctions (Fig. 1 C).
In the early stage of adhesion formation, tricellulin was localized throughout the bicellular junctions, and the most prominent actin structures were cables that formed perpendicular to the cell–cell interface, likely associated with spot-like AJs (Fig. 1 A, 12 h). Interestingly, when tricellulin concentrates at tricellular junctions, actin cables that run parallel to the converging bicellular junctions crisscross to form a fine meshwork at tricellular junctions (Fig. 1 A, 24 h; and Fig. 1 C). In order to understand how this tricellular actin meshwork is formed, we examined the localization of the Ena/vasodilator-stimulated protein (VASP) family proteins involved in directed actin polymerization associated with junction formation. At the initial stage of cell adhesion, VASP is concentrated at spot-like AJs as described previously (Fig. 1 B, 12 h; Vasioukhin et al., 2000). VASP then accumulates in the vicinity of tricellular junctions concurrent with tricellulin concentration there (Fig. 1 B, 24 h; and Fig. 1 C). More precisely, VASP localization is restricted to the ends of converging bicellular junctions. Intriguingly, actin fibers of the tricellular actin meshwork appear to specifically emanate from VASP-positive regions (Fig. 1 C). Moreover, myosin II is also preferentially recruited to the tricellular actin meshwork, in particular at the intersection of converging actin filaments where the overlapping elements form antiparallel strands (Fig. 1 D). Thus, the cortical actomyosin network is perpendicularly anchored end-on between the VASP-positive poles at the tricellular corners. These observations concur with previously reported organization of the actomyosin cytoskeleton at tricellular junctions in cells in which intercellular tension is highly elevated (Choi et al., 2016).
From these results, we propose that the formation of the actin meshwork at tricellular junctions is a distinct morphological stage during the maturation of epithelial junctions (Fig. 1 E). In the following experiments, we examined the functional roles of the tricellular actin meshwork in the formation of epithelial barriers.
Generation and characterization of tricellulin knockout (Tric KO) cultured epithelial cells
Membrane proteins such as tricellulin or LSR are involved in the formation of tTJs, but it is unclear how these proteins contribute to their barrier function. Therefore, we generated Tric KO EpH4 cells to analyze the functional roles of tricellulin.
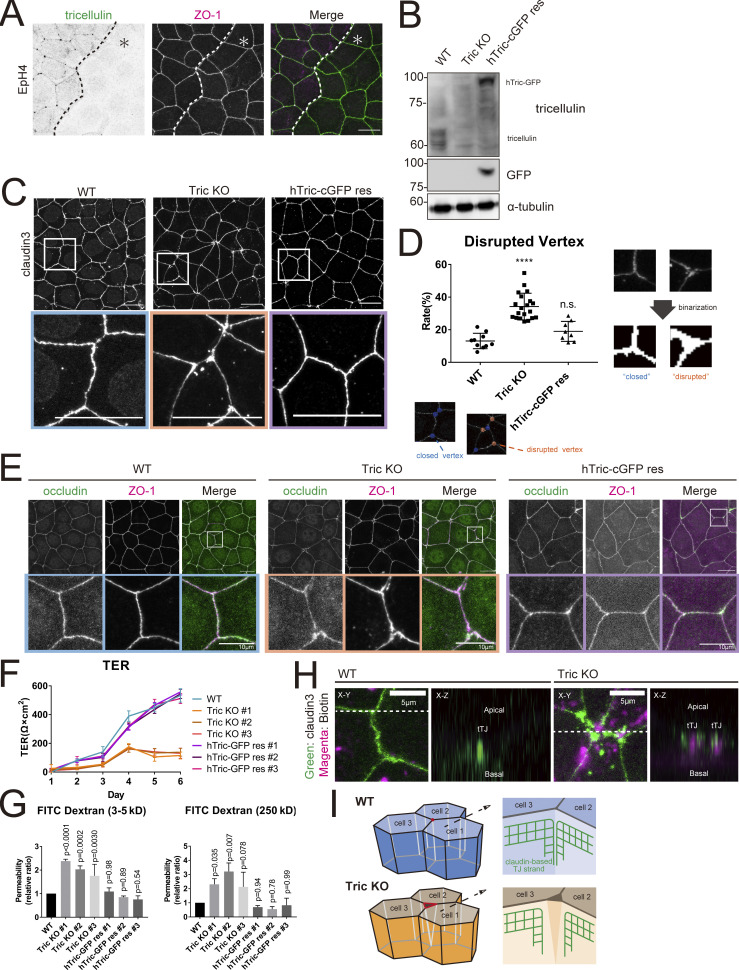
We confirmed the loss of protein expression by immunofluorescence microscopy (Fig. 2 A) and by Western blotting (Fig. 2 B). Next, we examined the difference in morphology of tTJs based on the staining pattern of claudin-3. Claudin-3 was comparably localized at tTJs as at bTJs in the WT cell sheet, resulting in a seamless tTJs that appeared as an uninterrupted intersection of three bTJs. By contrast, claudin-3 was concentrated at ends of bTJs in the vicinity of tTJs in Tric KO cells, such that the bTJs failed to converge as a vertex, which resulted in tTJs with significant gaps (Fig. 2 C). We devised an image analysis protocol to automatically categorize tricellular vertices as “closed” or “disrupted” to quantify the rate of gap formation at tTJs. Tricellular vertices were disrupted in the Tric KO cell sheet at more than twice the rate as in the WT cell sheet, confirming that tTJ formation is significantly impaired by loss of tricellulin (Fig. 2 D). The bTJ scaffold protein ZO-1 and another bTJ membrane protein, occludin, also showed discontinuous distributions around tTJs in Tric KO cells (Fig. 2 E). These phenotypes of Tric KO cells were fully rescued by the exogenous expression of GFP-tagged human tricellulin in Tric KO cells (hTric-cGFP res). These observations are in good agreement with our previous report, in which we concluded that the continuity of the TJ network was not maintained at tricellular contacts in Tric KD EpH4 cells (Ikenouchi et al., 2005).
Figure 2.
Generation and characterization of tricellulin-deficient epithelial cells. (A) Immunofluorescence images showing anti-tricellulin mAb (green) and anti–ZO-1 mAb (magenta) staining in a co-culture of WT and Tric KO EpH4 cells. Dotted line overlays the border between WT and Tric KO cells, which are indicated by the asterisk. Scale bar: 20 μm. (B) Whole-cell lysates of WT, Tric KO, and hTric-cGFP res EpH4 cells were immunoblotted with the indicated antibodies. Molecular weight measurements are in kD. (C) WT, Tric KO, and hTric-cGFP res EpH4 cells were stained with anti–claudin-3 pAb. Insets are enlarged below. Scale bar: 20 μm. (D) Graph showing the rate of disrupted tTJs. The numbers of closed and disrupted vertices were automatically quantified based on images represented in C. Examples of the processed postanalysis images are enlarged below the graph. Closed tTJs are encircled in blue, and disrupted tTJs, in orange. One-way ANOVA with Tukey’s post hoc analysis; ns, P > 0.05; ****, P < 0.001. (E) WT, Tric KO, and hTric-cGFP res EpH4 cells were co-stained with anti-occludin mAb (green) and anti–ZO-1 mAb (magenta). Insets are shown below. Scale bar: 20 μm. (F) WT cells, three independent clones of Tric KO cells, and three independent clones of hTric-cGFP res EpH4 cells were prepared for TER measurements as described in Materials and methods (means ± SD; n = 6). (G) Graph showing the paracellular flux of FITC-dextran tracer molecules over 2 h (n = 3; P values from one-way ANOVA with Tukey’s post hoc analysis are shown). (H) Cell-surface biotinylation assay in WT and Tric KO EpH4 cells. Cells were treated with sulfo-NHS-SS-biotin from the apical side, fixed, and stained with anti–claudin-3 pAb (green) and Texas Red streptavidin (magenta). Scale bar: 5 μm. (I) Schematic showing the architecture of tTJs in WT and Tric KO cells. Bicellular TJ strands that converge at tricellular contacts are closely associated in WT cells but are disassociated in Tric KO cells. Source data are available for this figure: SourceData F2.
Next, we examined the consequence of tricellulin loss on epithelial barrier function. We measured transepithelial electrical resistance (TER) over 6 d in WT and Tric KO cells. TER values are strong indicators of epithelial barrier integrity and reflect the paracellular permeability to ions. The TER value continued to increase for 6 d in WT cells. By contrast, the TER values did not significantly increase above seeding level even after 6 d in Tric KO cells. The TER values of hTric-cGFP res recovered to the same level as that of WT cells (Fig. 2 F). We also examined the paracellular permeability to macromolecules by measuring the flux of membrane-impermeable tracers of various sizes (FITC-dextran, 3–5 and 250 kD). We previously found that the paracellular barrier was impaired in a size-selective manner in Tric KD epithelial cells, with greater susceptibility to smaller molecules (Ikenouchi et al., 2005). However, the paracellular barrier against even the largest tracer molecule (FITC-dextran, 250 kD) was compromised in Tric KO cells (Fig. 2 G). This discrepancy may arise partially because expression of tricellulin is completely suppressed in the Tric KO cells used in this study.
Our observations so far indicated that the central tube that runs along the length of the cell remains unsealed and exposed in Tric KO cells. Indeed, when biotin tracer was added into the medium from the apical side, we observed extensive biotin signals throughout the lateral membrane at tricellular regions in Tric KO cells, but only at the apical membrane in WT cells, suggesting the existence of a tubular gap at tricellular junctions (Fig. 2 H).
Taken together, the above observations in Tric KO cells corroborate and extend our previous observations in Tric KD cells. The TJ network at tricellular junctions is interrupted in the absence of tricellulin, which renders the epithelial barrier porous and nonfunctional. The gapped appearance of TJ molecules in these cells suggests that tricellulin is essential to conjoin the bTJ strands that converge at tricellular contacts. Thus, tricellulin directly contributes to epithelial barrier function by promoting the assembly of the central sealing elements (Fig. 2 I).
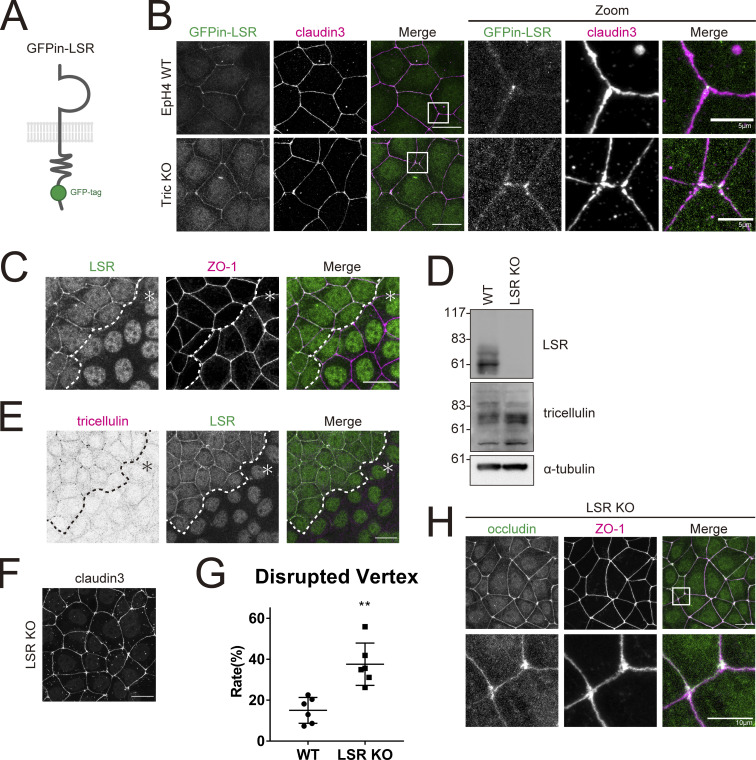
Tricellulin is recruited to tTJs by LSR (Masuda et al., 2011). Therefore, we examined whether LSR contributes to the barrier formation at tTJs together with tricellulin. We examined the localization of LSR in Tric KO cells. Tricellular localization of LSR was not affected in Tric KO cells, confirming the previous report that LSR is recruited to tTJs independently of tricellulin (Fig. 3, A and B; Masuda et al., 2011). We generated LSR-KO EpH4 cells by CRISPR-Cas9 system (Fig. 3, C and D). In agreement with previous studies, enrichment of tricellulin at tTJs was completely lost in LSR KO cells (Fig. 3 E; Masuda et al., 2011). Next, we examined whether LSR KO cells also exhibit tTJ disorganization. We found that tTJ formation was severely disrupted in LSR KO cells, as in Tric KO cells (Fig. 3, F–H). These results suggest that LSR exerts its effect on tTJs primarily by recruiting tricellulin.
Figure 3.
Loss of LSR results in tTJ abnormality similar to the loss of tricellulin. (A) Schematic showing GFPin-LSR construct. (B) EpH4 WT or Tric KO cells expressing GFPin-LSR were stained with anti–claudin-3 pAb (magenta). Boxed regions are enlarged at right. Scale bar: 20 μm. (C) Immunofluorescence images showing anti-LSR pAb (green) and anti–ZO-1 mAb (magenta) staining in a co-culture of WT and LSR KO EpH4 cells. Dotted line overlays the border between WT and LSR KO cells, which are indicated by the asterisk. Scale bar: 20 μm. (D) Whole-cell lysates of WT and LSR KO EpH4 cells were immunoblotted with the indicated antibodies. Molecular weight measurements are in kD. (E) Immunofluorescence images showing anti-LSR pAb (green) and anti-tricellulin mAb (magenta) staining in a co-culture of WT and LSR KO EpH4 cells. Dotted line overlays the border between WT and LSR KO cells, which are indicated by the asterisk. Scale bar: 20 μm. (F) LSR KO EpH4 cells were stained with anti–claudin-3 pAb. Scale bar: 20 μm. (G) The rate of tTJ disruption was quantified as in Fig. 1 D. Student’s t test; **, P < 0.01. (H) LSR KO EpH4 cells were co-stained with anti-occludin mAb (green) and anti–ZO-1 mAb (magenta). Insets are enlarged below. Scale bar: 20 μm. Source data are available for this figure: SourceData F3.
Actomyosin contractility drives the association of converging central sealing elements at tTJs
So far, we have shown that antiparallel actomyosin strands crisscross to form a meshwork at the tricellular corner (Fig. 1 E) and that tricellulin is essential for the barrier function of tTJs (Fig. 2 I). Therefore, we next examined whether the contractile activity of actomyosin at the tricellular junctions contributes to the barrier function of tTJs.
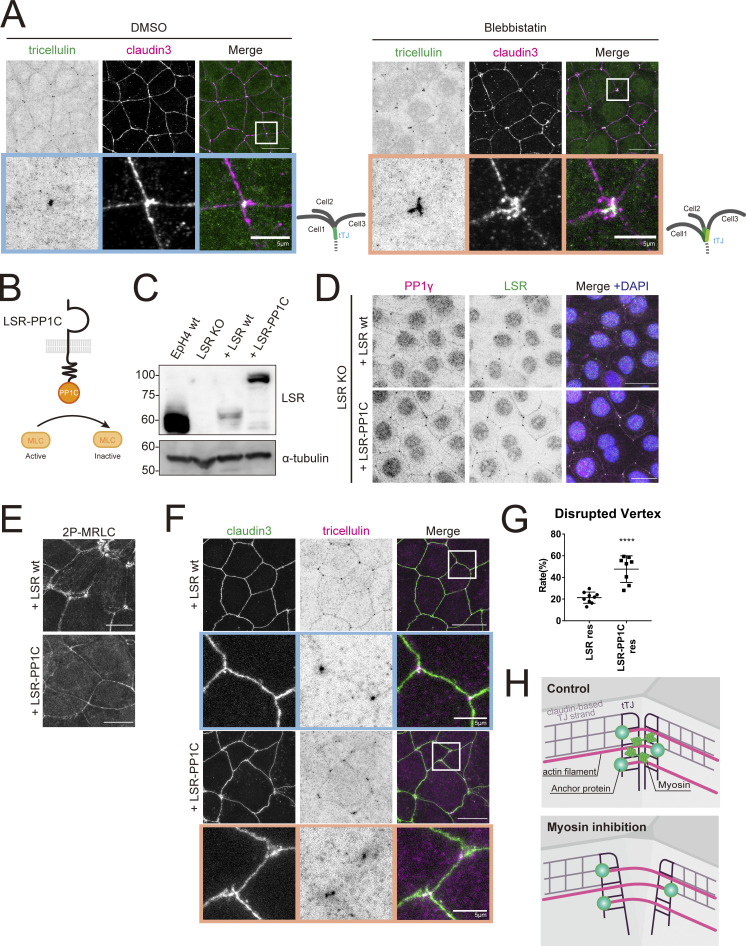
We posited that myosin II, acting on the antiparallel actin filaments, could be the driving force to bring the opposing TJ strands in proximity. In WT cells, perijunctional accumulation of myosin II was more prominent in the vicinity of tricellular junctions than around bicellular junctions (Fig. 1 D). Tricellulin staining was acutely focused at tricellular contacts, indicating that the central sealing elements were tightly associated (Fig. 4 A). By contrast, when we treated the cells with the myosin II inhibitor blebbistatin, tricellulin staining appeared not as a focused dot, but instead as three “split” short lines at bTJs, suggesting that the central sealing elements were detached from one another (Fig. 4 A).
Figure 4.
The contractile force of actomyosin is necessary to maintain the central sealing elements in proximity. (A) WT EpH4 cells were treated with DMSO (control) or blebbistatin (50 μM) for 2 h, fixed, and then stained with anti-tricellulin mAb (green) and anti–claudin-3 pAb (magenta). Boxed regions are magnified below. Scale bar: 20 μm. (B) Schematic showing LSR-PP1C chimeric construct. (C) Whole-cell lysates of EpH4 WT cells, LSR KO cells, or LSR KO cells expressing either WT LSR (LSR wt) or LSR-PP1C were immunoblotted with the indicated antibodies. Molecular weight measurements are in kD. (D–F) LSR KO EpH4 cells expressing either LSR wt or LSR-PP1C were fixed and stained with anti-LSR pAb (green), anti-PP1γ mAb (magenta), and DAPI (blue; D); anti-2P-MRLC mAb (E); or anti–claudin-3 pAb (green) and anti-tricellulin mAb (magenta; F). (F) Boxed regions are magnified below. Scale bar: 20 μm. (G) The rate of tTJ disruption was quantified as in Fig. 1 D. Student’s t test; ****, P < 0.001. (H) Schematic showing changes in tTJs following myosin inhibition. Loss of actomyosin contractility at tTJs results in increased distance between converging central sealing elements. Source data are available for this figure: SourceData F4.
To avoid the possibility that this phenotype was caused by secondary changes due to myosin II inhibition throughout the cell, we next inhibited myosin II activity more specifically at tricellular junctions by expressing a chimeric construct termed LSR-PP1C, in which PP1C, a catalytic subunit of myosin phosphatase, is fused to the COOH-terminal of full length LSR. We established cell lines that stably expressed WT LSR or LSR-PP1C in LSR KO cells (Fig. 4, B and C). Both WT LSR and LSR-PP1C were strongly concentrated at tTJs in LSR KO cells (Fig. 4 D). We confirmed that the activation level of myosin II was decreased specifically at tricellular junctions in cells expressing LSR-PP1C, based on staining with the antibody against 2P-MRLC (Fig. 4 E). Tricellulin was similarly focused at tTJs in both WT- and chimera-rescued cells, indicating that myosin activity is dispensable for its localization (Fig. 4 F). However, tTJ formation was severely compromised in LSR-PP1–rescued cells due to the failure of bTJs to converge, judging from the staining of claudin-3 and tricellulin (Fig. 4, F and G). These findings show that down-regulation of myosin II activity at tricellular junctions impairs tTJ formation. Thus, it appears that the antiparallel actomyosin strands are somehow connected to the central sealing elements and that the contractile activity of the myosin II motor enables the close, lateral association of the converging bTJ networks (Fig. 4 H).
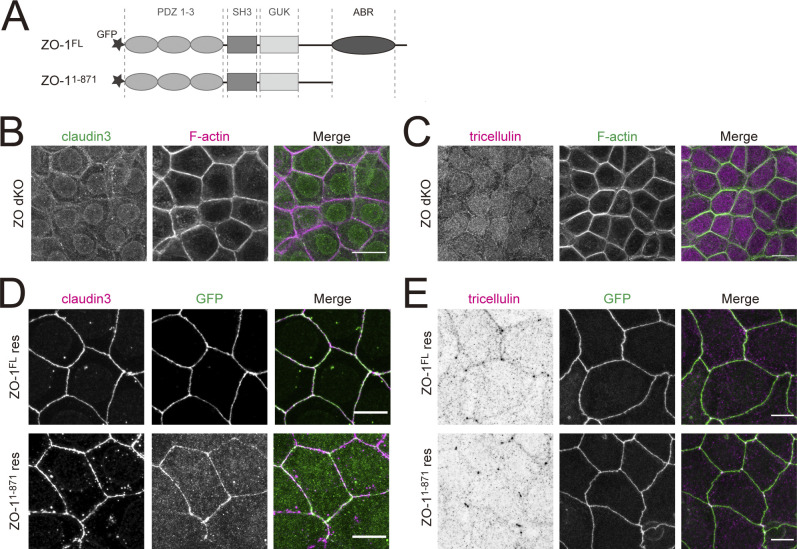
We next asked how the central sealing elements are coupled to the actomyosin cytoskeleton at tricellular junctions. Zonula Occludens (ZO) family proteins bind to both claudins and F-actin though their PDZ domains and COOH-terminus actin-binding regions, respectively (Fanning and Anderson, 2009; Van Itallie and Anderson, 2014). Therefore, one possibility is that ZO family proteins mediate this interaction. In support of this possibility, it was recently demonstrated that accumulation of the actin cytoskeleton to ectopic TJs formed in fibroblasts by forced expression of claudin requires ZO-1 (Van Itallie et al., 2017). Thus, the linkage between the central sealing elements and the actin cytoskeleton may likewise depend on the binding between claudin and ZO-1. We tested this hypothesis by expressing either full-length ZO-1 (ZO-1FL) or ZO-1 lacking the COOH-terminus actin-binding region (ZO-11–871) in EpH4 cells lacking both ZO-1 and ZO-2 (ZO double knockout [dKO]; Fig. S1 A). Staining for claudin-3 and tricellulin revealed that formation of both bTJs and tTJs was suppressed in ZO dKO cells, as previously reported (Fig. S1, B and C; Ikenouchi et al., 2007; Umeda et al., 2006). Unexpectedly, expression of either ZO-1FL or ZO-11–871 restored the proper localizations of claudin-3 at bTJs and tTJs (Fig. S1 D). Furthermore, the focused staining of tricellulin in ZO dKO cells rescued with ZO-11–871 indicated that the central sealing elements were tightly associated (Fig. S1 E). These results clearly indicate that ZO proteins do not mediate the receptor–cytoskeleton interaction of the central sealing elements at tricellular junctions, and instead point to the existence of an as-yet-unidentified anchor protein.
Figure S1.
Binding of ZO-1 to the actin cytoskeleton is not required for normal tTJ formation. (A) Domain structures of ZO-1. Black star indicates the N-terminal GFP tag. (B) Immunofluorescence images showing anti–claudin-3 pAb (green) and phalloidin (magenta) staining in EpH4 ZO dKO cells. Scale bar: 20 μm. (C) Immunofluorescence images showing anti-tricellulin mAb (magenta) and phalloidin (green) staining in EpH4 ZO dKO cells. Scale bar: 20 μm. (D) ZO dKO cells expressing GFP-tagged ZO-1FL or ZO-11–871 were stained with anti–claudin-3 pAb (magenta). Scale bar: 10 μm. (E) ZO dKO cells expressing GFP-tagged ZO-1FL or ZO-11–871 were stained with anti-tricellulin mAb (magenta). Scale bar: 10 μm.
α-catenin is activated at tTJs and recruits vinculin
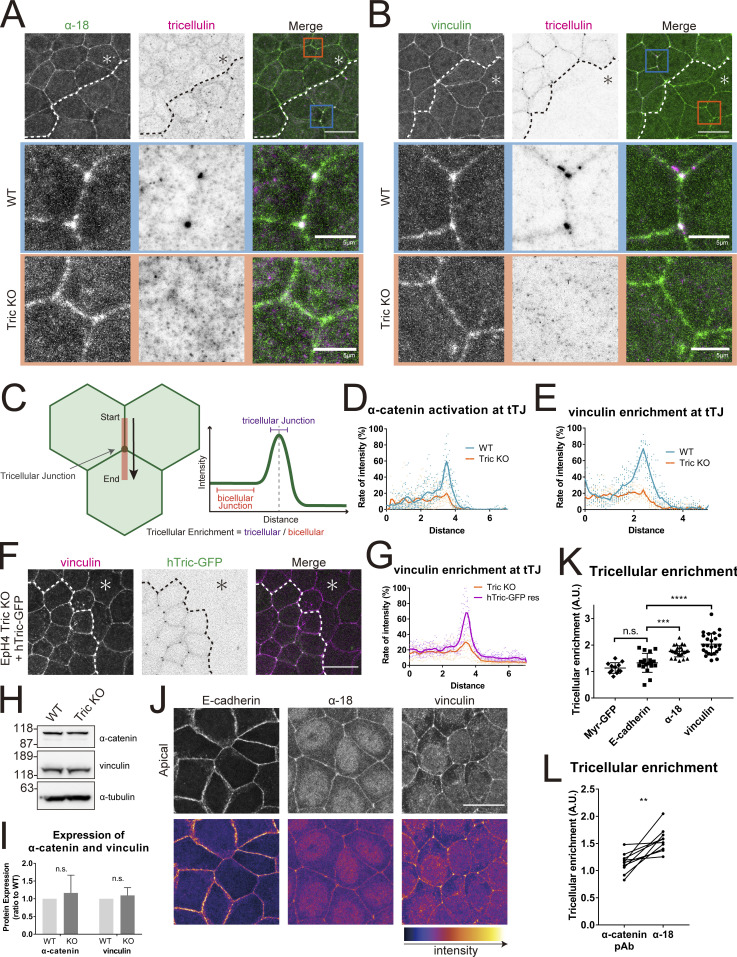
We therefore investigated the possibility that tricellulin itself is involved in the linkage between the central sealing elements and F-actin at tricellular junctions. We searched for actin-binding proteins that accumulated at tTJs in WT but not in Tric KO cells. In this way, we found that α-catenin and vinculin, both of which are major components of AJs, localized to tricellular junctions in a tricellulin-dependent manner (Fig. 5, A and B). α-Catenin undergoes structural change in response to mechanical stress (Yonemura et al., 2010). This structural change exposes the region responsible for vinculin recruitment, which allows selective reinforcement of adhesions under high mechanical stress (Yonemura, 2011). Staining with the α-18 mAb, which specifically recognizes the tension-activated open conformation of α-catenin (Yonemura et al., 2010), showed that tricellular junctions were under high mechanical strain in WT cells (Fig. 5 A); quantification of open-form α-catenin enrichment by line scan analyses spanning bTJ and tTJ confirmed that conformational activation of α-catenin was relatively elevated at tricellular junctions (Fig. 5, C and D). By contrast, α-18 staining was not notably elevated at tricellular junctions compared to bicellular junctions in Tric KO cells (Figs. 5, A and D; and S2, A and C). The intensity of vinculin staining at tricellular junctions also varied in accordance with the different conformation states of α-catenin in WT and Tric KO cells, with elevated intensity in the former and relatively reduced intensity in the latter (Figs. 5, B and E; and S2, B and D). Expression of GFP-tagged human tricellulin in Tric KO cells rescued vinculin enrichment at tricellular junctions, confirming tricellulin as the key molecule in its recruitment (Fig. 5, F and G). There was also no significant difference in the expression level of either α-catenin or vinculin between WT cells and Tric KO cells (Fig. 5, H and I). Notably, while open-form α-catenin and vinculin were about twice as concentrated at the tricellular junctions as at bicellular junctions, E-cadherin, the major cell adhesion molecule of AJs, or myristoylated GFP, the plasma membrane marker, were not significantly enriched at tricellular junctions (Fig. 5, J and K). Furthermore, we costained EpH4 cells with α-catenin pAb and α18 mAb and compared the tricellular enrichment of the total amount of α-catenin (the signal intensity of staining with the α-catenin pAb) to that of open-form α-catenin (the signal intensity of staining with the α18 mAb). The degree of α18 mAb concentration at tricellular junctions was higher than that of α-catenin pAb concentration in all samples (Fig. 5 L). This result suggests that the intercellular tension applied to tricellular junctions is higher than to bicellular junctions.
Figure 5.
α-catenin and vinculin are recruited to tTJs in a tricellulin-dependent manner. (A and B) Immunofluorescence images showing anti–α-catenin mAb (α18; green) and anti-tricellulin pAb (N450, magenta; A) or anti-vinculin mAb (green) and anti-tricellulin mAb (magenta; B) staining in a co-culture of WT and Tric KO EpH4 cells. Dotted line overlays the border between WT and Tric KO cells, which are indicated by the asterisk. Tricellular junctions of WT and Tric KO cells are enlarged in the middle and bottom rows, respectively. Scale bar: 20 μm. (C) Schematic showing the method for quantifying protein enrichment at tricellular junctions. A line scan was performed extending from bTJ across tTJ based on the respective immunofluorescence image. The value of tricellular enrichment was calculated by dividing the average intensity value of the tricellular junction by that of the bicellular junction. (D and E) Intensity profiles of α-catenin (D) and vinculin (E) according to the method described in C. Blue line is WT cells, and orange line is Tric KO cells. In both cases, 10 samples were randomly selected. (F) Tric KO EpH4 cells and hTric-cGFP-rescued EpH4 cells were co-cultured and stained with anti-vinculin mAb (magenta). Dotted line overlays the border between Tric KO cells, which are indicated by the asterisk, and hTric-cGFP res EpH4 cells. Scale bar: 20 μm. (G) Intensity profiles of vinculin according to the method described in C. Orange line is Tric KO cells, and purple line is hTric-cGFP res cells. 10 samples were randomly selected. (H) Expression levels of α-catenin and vinculin in WT and Tric KO EpH4 cells were assessed by immunoblotting. Molecular weight measurements are in kD. (I) Quantification of H. Expression levels were corrected for total protein as determined by α-tubulin. n = 3; Student’s t test; ns, P > 0.05. (J) Immunofluorescence images showing anti–E-cadherin mAb, anti–α-catenin mAb (α18), or anti-vinculin mAb staining in EpH4 WT cells. Scale bar: 20 μm. (K) Enrichment of proteins stained in I to tricellular junctions was quantified. Line scan analysis was performed as described in C, and tricellular enrichment was calculated. One-way ANOVA with Tukey’s post hoc analysis, ns, P > 0.05; ***, P < 0.005; ****, P < 0.001. (L) WT EpH4 cells were stained with α-catenin pAb and α-catenin mAb (α18), and their tricellular enrichment was determined as described in C. Lines connect the values acquired at the same line scan. Student’s t test; **, P < 0.01. A.U., arbitrary unit. Source data are available for this figure: SourceData F5.
Figure S2.
α-catenin activation and vinculin enrichment at tTJs are dependent on the contractile force of actomyosin. (A and B) Quantification of anti–α-catenin mAb (α18; A) and anti-vinculin mAb (B) staining at bicellular junctions. Fluorescence intensities of anti–α-catenin mAb (α18) and anti-vinculin mAb were normalized by the anti–α-catenin pAb intensity. The plot shows the average value of individual line scans. (Student’s t test, n.s., ≧0.05). (C and D) Quantification of anti–α-catenin mAb (α18; C) and anti-vinculin mAb (D) staining at tricellular junctions. Line scan analysis was performed as described in Fig. 5 C and tricellular enrichment was calculated. Student’s t test; *, P < 0.05; **, P < 0.01. (E) Immunofluorescence images showing anti–α-catenin mAb (α18; magenta), anti–claudin-3 pAb (yellow), and β-catenin (cyan) staining in EpH4 WT cells. Insets are x-z axis images. Scale bar: 5 μm. Arrowhead indicates co-localization of open-form α-catenin with claudin-3 at tTJs. (F) Graph showing the x-z axis intensity of E. (G) Immunofluorescence images showing anti-vinculin mAb (magenta), anti–claudin-3 pAb (yellow), and E-cadherin (cyan) staining in EpH4 WT cells. Insets are x-z axis images. Scale bar: 5 μm. Arrowhead indicates co-localization of vinculin with claudin-3 at tTJs. (H) Graph showing the x-z axis intensity of G. (I and J) WT EpH4 cells were treated with DMSO (control) or blebbistatin (50 μM) for 2 h, fixed, and then stained with either anti–α-catenin mAb (α18) and anti–α-catenin pAb (I) or anti-vinculin mAb and anti–α-catenin pAb (J). Scale bar: 5 μm. The graphs show the normalized intensity profile along a single representative junction. A.U., arbitrary unit.
Next, we examined whether α-catenin and vinculin that accumulated at tricellular junctions colocalize with TJ marker proteins (claudin-3) or AJ marker proteins (E-cadherin or β-catenin) in the z-axis direction. Although it is difficult to clarify the precise position of α-catenin and vinculin in the z-axis direction due to the limitations of light microscopy, open-form α-catenin and vinculin were colocalized with claudin-3 and partially with AJ proteins at the apical side of apical junctions (Fig. S2, E–H). These observations lend support to our conclusion that open-form α-catenin and vinculin links TJ strands to the actin cytoskeleton via tricellulin at tTJs.
To exclude the possibility that vinculin is recruited to tricellular junctions independently of open-form α-catenin, we treated cells with blebbistatin and examined the distribution of total α-catenin, open-form α-catenin, and vinculin (Fig. S2, I and J). Inhibition of myosin II activity resulted in the concomitant loss of open-form α-catenin and vinculin from tricellular junctions, but the staining of total α-catenin was not changed, suggesting that vinculin recruitment to tricellular junctions is dependent on open-form α-catenin.
Because ZO-1 can bind to α-catenin, one might think that ZO-1 associated with TJ strands mediates the recruitment of α-catenin–vinculin complex to tTJs. However, we found that ZO-1 associated with TJs could not bind α-catenin simultaneously. In L fibroblasts, neither claudin nor E-cadherin is expressed, but ZO-1 and α-catenin are endogenously expressed. On one hand, expression of claudin-1 in these cells (C1L cells), recruited ZO-1, but not α-catenin, to cell–cell contacts (Fig. S3 A). On the other hand, in E-cadherin–expressing L fibroblasts (EL cells), ZO-1 and α-catenin were colocalized at junctions together with E-cadherin (Fig. S3 B). These findings indicate that ZO-1 associated with claudin cannot bind to α-catenin at the same time. Considering the differences between the cell adhesion structures formed in L fibroblasts and those in epithelial cells, such as the lack of circumferential ring and polarity proteins in the former, the mode of interaction among α-catenin, ZO-1, and claudins in epithelial cells cannot be simply extrapolated based on the results obtained from the experiments of L fibroblasts. Therefore, the possibility that α-catenin and ZO-1 cooperatively support the binding between tricellulin and actin cannot be completely ruled out. However, the above findings do not support the proposition that α-catenin and vinculin are recruited to tricellular junctions by E-cadherin or ZO-1. Altogether, these results show that tricellulin recruits vinculin to tricellular junctions by a mechanism involving α-catenin activation.
Figure S3.
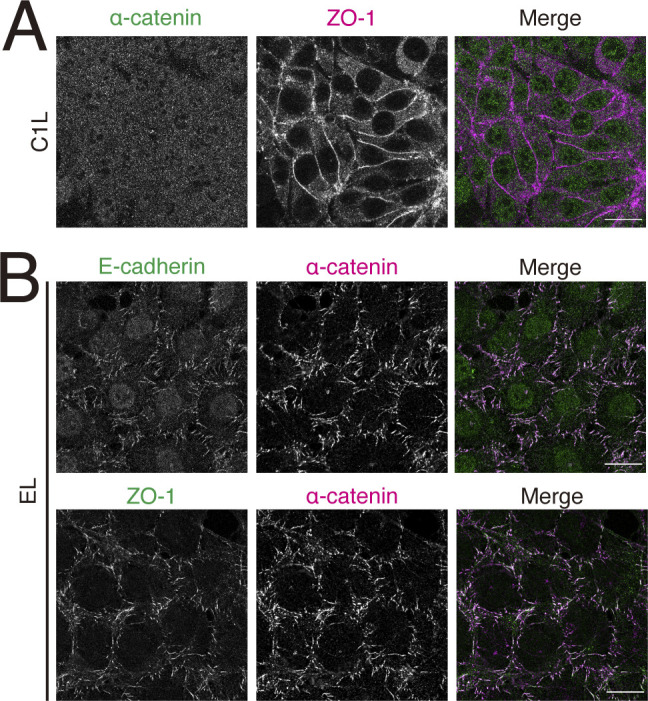
α-catenin interacts with ZO-1 at AJs but not at TJs. (A) Immunofluorescence images showing anti–α-catenin pAb (green) and anti–ZO-1 mAb (magenta) staining in L fibroblast stably expressing claudin-1 (C1L). Scale bar: 20 μm. (B) Immunofluorescence images showing anti–α-catenin pAb (magenta) and anti–ZO-1 mAb (green) or anti–α-catenin pAb (magenta) and anti–E-cadherin mAb (green) in L fibroblast stably expressing E-cadherin (EL). Scale bar: 20 μm.
α-catenin is a novel binding partner of tricellulin
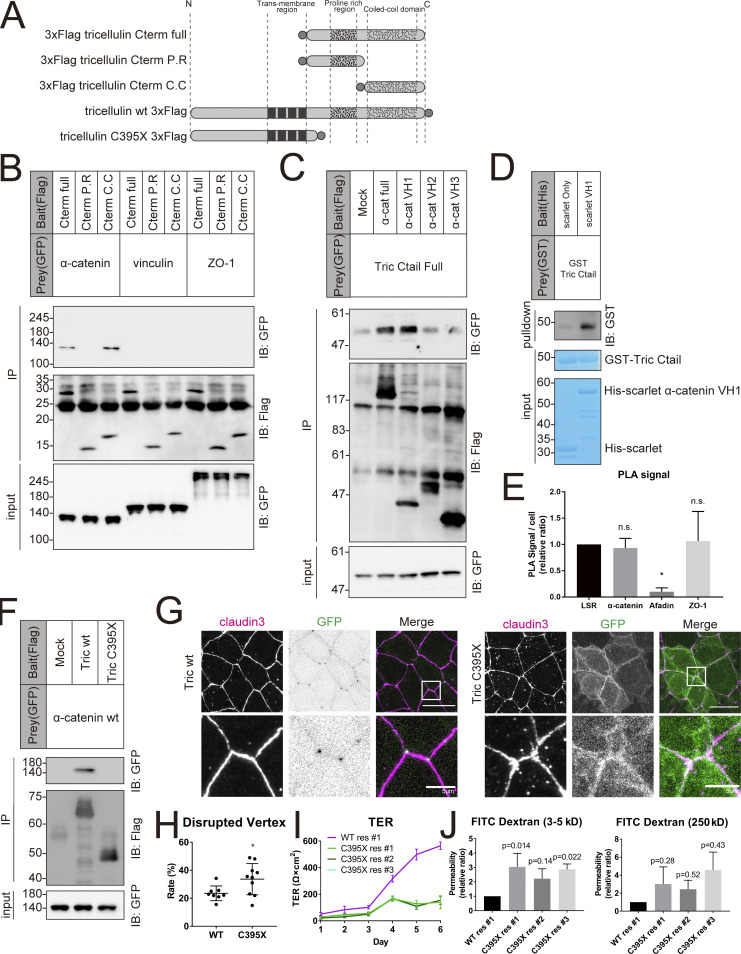
The above findings suggest that α-catenin and vinculin, through tricellulin, mediate the anchorage between the central sealing elements and the actomyosin cytoskeleton at tricellular junctions. Because vinculin recruitment requires α-catenin, we wondered whether tricellulin directly binds α-catenin. We explored this possibility by performing a pulldown assay using a series of deletion mutants of the COOH terminus region of tricellulin (Cterm, Fig. 6 A). α-catenin coprecipitated with the full-length Cterm as well as with the Cterm fragment containing the coiled-coil domain, but not with the fragment containing the proline-rich region (Fig. 6, A and B). In contrast, vinculin and ZO-1, which accumulate at tricellular junctions to the same extent as open-form α-catenin, did not bind to tricellulin (Fig. 6 B).
Figure 6.
Tricellulin binds to α-catenin directly through its coiled-coil region. (A) Schematic showing the various tricellulin fragments. Gray circle indicates the FLAG tag. (B) Representative immunoblots (IB) showing FLAG immunoprecipitates (IP) probed with the indicated antibodies. FLAG-tagged tricellulin fragments were co-expressed with GFP-tagged α-catenin, vinculin, or ZO-1; n = 3. (C) Representative immunoblots showing FLAG immunoprecipitates probed with the indicated antibodies. FLAG-tagged α-catenin fragments were coexpressed with GFP-tagged tricellulin Ctail full; n = 3. (D) Representative immunoblots showing His pulldown samples probed with anti-GST mAb or stained with Coomassie brilliant blue. GST-tagged tricellulin Ctail full and Scarlet-tagged α-catenin VH1 were purified from E. coli. Details of the experiment are described in Materials and methods; n = 3. (E) Graph showing the average number of PLA signals detected per cell. Details of the experiment are described in Materials and methods (n = 3; one-way ANOVA with Tukey’s post hoc analysis; ns, P > 0.05; *, P < 0.05). (F) Representative immunoblots showing FLAG immunoprecipitates probed with the indicated antibodies. FLAG-tagged WT tricellulin or DFNB49-associated mutant (C395X) was coexpressed with GFP-tagged α-catenin (n = 3). (G) Tric KO EpH4 cells expressing either WT (left) or C395X (right) tricellulin were stained with anti–claudin-3 pAb (magenta). Boxed regions are magnified below. Scale bar: 20 μm. (H) The rate of tTJ disruption was quantified as in Fig. 1 D. Student’s t test; *, P < 0.05. (I) Graph depicting the change in TER over 6 d from seeding. Tric KO cells expressing WT tricellulin (WT res) and three independent clones of C395X res were prepared for TER measurements as described in Materials and methods (means ± SD; n = 6). (J) Graph showing the paracellular flux of FITC-dextran tracer molecules over 2 h (n = 3, P values from one-way ANOVA with Tukey’s post hoc analysis are shown). Molecular weight measurements are in kD. Source data are available for this figure: SourceData F6.
We next narrowed down the domain of α-catenin responsible for the binding to the Cterm of tricellulin. α-catenin contains three vinculin homology domains (VH1–3), and the VH1 domain showed strongest binding affinity to tricellulin Cterm by an immunoprecipitation assay in a heterologous expression system (Fig. 6 C). We also confirmed that the VH1 domain of α-catenin directly binds to the COOH terminus region of tricellulin by a pulldown assay using purified proteins (Fig. 6 D).
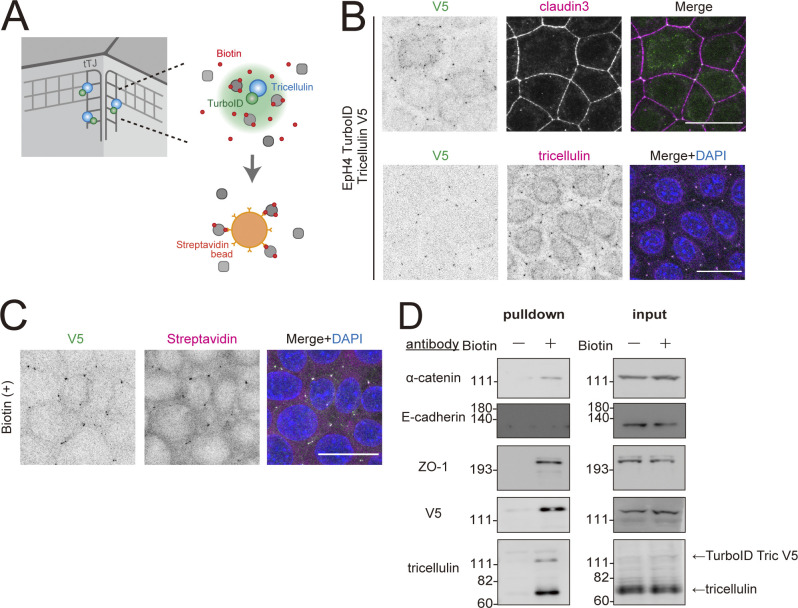
In order to more specifically address whether α-catenin and tricellulin directly interact at tTJ, we performed two assays based on proximity labeling. In the first, we established EpH4 cells stably expressing tricellulin fused to a proximity-dependent biotin identification tag (tricellulin-TurboID-V5) and examined whether α-catenin was specifically biotin-labeled by the enzymatic activity of TurboID (Fig. S4 A; Branon et al., 2018). Tricellulin-TurboID-V5 was localized at tTJ (Fig. S4 B). When biotin was added to the culture medium, proteins at tricellular junctions were biotinylated (Fig. S4 C). Immunoblot analysis of biotinylated proteins isolated by streptavidin pulldown showed that α-catenin and ZO-1, but not E-cadherin, were efficiently biotinylated (Fig. S4 D). Biotinylation of ZO-1 was expected because ZO proteins are associated with the central sealing elements by direct binding to claudins. By contrast, α-catenin and E-cadherin are primarily AJ proteins, and thus would not be expected to be biotinylated by tricellulin-TurboID-V5. That α-catenin was labeled to an extent detectable by immunoblot analysis strongly favors the notion that α-catenin is tightly associated with tricellulin at tTJs, considering that the practical labeling radius of TurboID is ∼10 nm (Branon et al., 2018). We also performed a proximity ligation assay (PLA), which detects protein–protein interaction between proteins within 40–100 nm of each other in situ (Fredriksson et al., 2002). PLA signal was detected between tricellulin and LSR, as expected. We also detected PLA signals between tricellulin and α-catenin, but not between tricellulin and afadin (Fig. 6 E). PLA signal was also detected between tricellulin and ZO-1 (Fig. 6 E). Although the direct binding between ZO-1 and tricellulin was not detected (Fig. 6 B), this was not unexpected since tricellulin is embedded in the claudin-based TJ strands. Along with the results of the binding experiments, these data support the existence of a specific interaction between tricellulin and α-catenin and none of the other actin binding junctional scaffold proteins tested.
Figure S4.
Specific interaction between tricellulin and α-catenin in intact cells as shown by proximity labeling. (A) Schematic of proximity labeling using V5-tagged tricellulin-TurboID fusion protein. (B) Immunofluorescence images of EpH4 cells expressing V5-tagged tricellulin-TurboID. Cells were stained with anti-V5 mAb (green) and anti–claudin-3 pAb (upper panels) or anti-tricellulin mAb (lower panels, magenta). Scale bar: 20 μm. (C) Immunofluorescence images of EpH4 cells expressing V5-tagged tricellulin-TurboID after addition of 500 µM Biotin. Cells were stained with anti-V5 mAb (green) and Texas Red streptavidin (magenta). Scale bar: 20 μm. (D) Representative immunoblots showing biotinylated proteins probed with the indicated antibodies; n = 3. Molecular weight measurements are in kD. Source data are available for this figure: SourceData FS4.
Tricellulin is a causative gene for familial hearing loss (nonsyndromic deafness, DFNB49; Riazuddin et al., 2006). Of note, mutations of the human tricellulin gene associated with hearing loss result in the removal of all or most of the COOH-terminus cytoplasmic domain (Riazuddin et al., 2006). Furthermore, in a knock-in mouse that carries a mutation orthologous to the tricellulin coding mutation linked to DFNB49 hearing loss in humans, central sealing elements were not laterally associated, resulting in the dysfunction of epithelial barrier (Nayak et al., 2013). A pulldown assay using the DFNB49-associated tricellulin mutant C395X, which lacks most of the COOH-terminus cytoplasmic domain due to a premature stop codon, revealed that this mutation reduced tricellulin-α-catenin binding affinity (Fig. 6 F). As expected, expression of this mutant in Tric KO cells failed to rescue the tTJ morphology (Fig. 6, G and H). TER measurements showed that the barrier function of tricellulin KO cells expressing the C395X mutant was markedly diminished compared with tricellulin KO cells expressing WT tricellulin (Fig. 6 I). When we assessed the paracellular permeability by the FITC tracer assay, there was a clear trend toward increased permeability of both small (3–5 kD) and large (250 kD) tracers (Fig. 6 J). Taken together, these findings suggest that the direct binding between tricellulin and α-catenin is essential to form and maintain the functional architecture of tTJ.
Vinculin reinforcement of the interaction between tricellulin and F-actin is required for tTJ formation
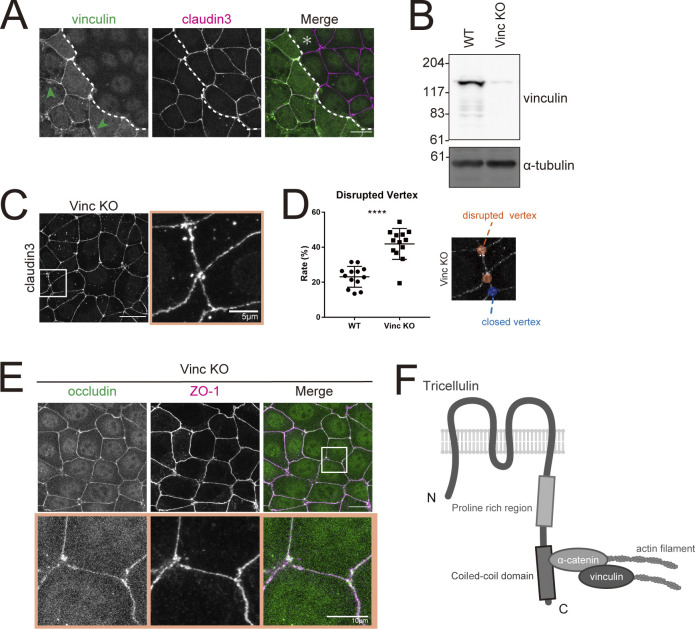
We next looked to elucidate the functional role of vinculin at tricellular junctions by examining vinculin KO cells (Fig. 7, A and B). As was the case in Tric KO cells, claudin-3 staining showed that bTJs failed to converge at tricellular contacts to form the compacted tTJs in vinculin KO cells (Fig. 7 C). Quantification of tTJ disruption confirmed that the number of abnormal tTJs was significantly increased in vinculin KO cells compared with WT cells (Fig. 7 D). Likewise, other TJ components, such as ZO-1 and occludin, were also not concentrated at tTJs, suggesting that the central sealing elements remained detached from one another in vinculin KO cells (Fig. 7 E).
Figure 7.
Loss of vinculin leads to impairment of tTJ organization. (A) Immunofluorescence images showing anti-vinculin mAb (green) and anti–claudin-3 pAb (magenta) staining in a co-culture of WT and Vinc KO EpH4 cells. Dotted line overlays the border between WT and Vinc KO cells, which are indicated by the asterisk. Green arrowheads indicate vinculin localized at focal adhesions. Scale bar: 20 μm. (B) Whole-cell lysates of WT and Vinc KO EpH4 cells were immunoblotted with the indicated antibodies. Molecular weight measurements are in kD. (C) Vinc KO EpH4 cells were stained with the anti–claudin-3 pAb. Boxed region is shown at right. Scale bar: 20 μm. (D) The rate of tTJ disruption was quantified as in Fig. 1 D. Student’s t test; ****, P < 0.001. (E) Vinc KO EpH4 cells were costained with anti-occludin mAb (green) and anti–ZO-1 mAb (magenta). Boxed regions are magnified below. Scale bar: 20 μm. (F) Schematic of tricellulin, α-catenin, and vinculin in complex at tricellular junctions. Source data are available for this figure: SourceData F7.
Therefore, we concluded that the tricellulin–α-catenin complex enables tension-dependent growth of the tricellular actin meshwork though recruitment of vinculin. These results indicate that the role of vinculin closely mirrors its function at AJs and focal adhesions, where it strengthens the binding between actin filament and membrane protein (Grashoff et al., 2010; Yonemura et al., 2010). In the case of tTJs, vinculin reinforces the connection of tricellulin to F-actin via α-catenin and promotes the formation of a tricellular actin meshwork (Fig. 7 F).
α-catenin binding to tricellulin is specifically required for tTJ formation
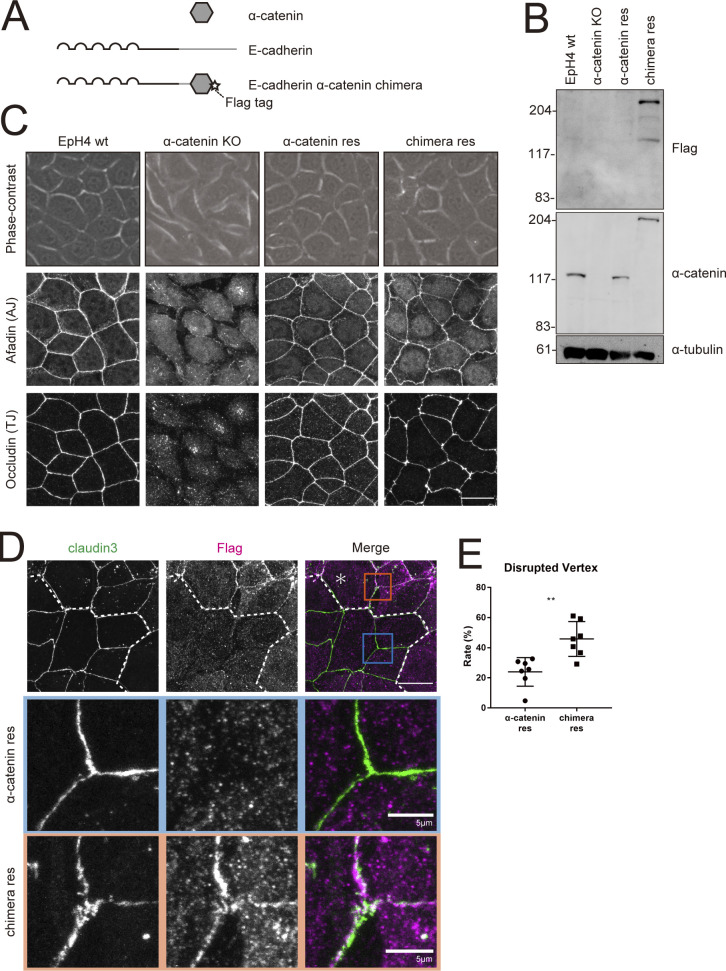
Finally, we sought to investigate the functional significance of the interaction between tricellulin and α-catenin at tricellular junctions. α-catenin depletion precludes the formation of AJs and TJs, which makes it impossible to analyze its specific contribution at tTJs by a knockout approach (Shigetomi et al., 2018; Watabe-Uchida et al., 1998). To overcome this difficulty, we took advantage of a chimeric protein consisting of a nonfunctional E-cadherin lacking its catenin-binding domain, fused to a full-length α-catenin (Fig. 8, A and B). This E-cadherin–α-catenin chimera is functional and rescues AJ formation in α-catenin–deficient cells (Gorfinkiel and Arias, 2007; Maiden and Hardin, 2011; Nagafuchi et al., 1994; Pacquelet and Rørth, 2005). However, there is no free cytosolic α-catenin that can bind to tricellulin in these cells, which enables us to clarify the necessity of α-catenin interaction with tricellulin in tTJ formation.
Figure 8.
E-cadherin–α-catenin chimera cannot rescue tTJ formation in α-catenin KO cells. (A) Schematic of the E-cadherin–α-catenin chimeric construct. Star indicates FLAG-tag. (B) Whole-cell lysates of EpH4 WT cells, α-catenin KO cells, α-catenin KO cells expressing WT α-catenin (α-catenin res), and α-catenin KO cells expressing E-cadherin–α-catenin chimera (chimera res) were immunoblotted with the indicated antibodies. Molecular weight measurements are in kD. (C) Phase-contrast (top panels) and immunofluorescence images of WT, α-catenin KO, α-catenin rescued, and chimera rescued EpH4 cells. Cells were stained with using anti-afadin pAb as the AJ marker and anti-occludin mAb as the bTJ marker (middle and lower panels). Scale bar: 20 µm. (D) Immunofluorescence images showing anti–claudin-3 pAb (green) and an anti-FLAG mAb (magenta) staining of a co-culture of α-catenin rescued cells and chimera rescued cells. Dotted line overlays the border between α-catenin rescued cells and chimera rescued cells, which are indicated by the asterisk. Insets are enlarged below. Blue and orange insets correspond to α-catenin rescued cells and chimera rescued cells, respectively. Scale bar: 20 μm. (E) The rate of tTJ disruption was quantified as in Fig. 1 D. Student’s t test; **, P < 0.01. Source data are available for this figure: SourceData F8.
We generated α-catenin KO EpH4 cells by using the CRISPR-Cas9 method (Fig. 8, B and C; Shigetomi et al., 2018). As previously reported, α-catenin KO cells showed spindle cell shape, and expression of either α-catenin or the chimera in α-catenin KO cells restored the typical polygonal morphology of epithelial cells (Fig. 8 C; Shigetomi et al., 2018). Moreover, formation of both AJs and bTJs was also rescued, judging from the staining pattern of afadin (AJ marker) and occludin (bTJ marker; Fig. 8 C).
Next, we closely investigated whether this E-cadherin–α-catenin chimera could rescue tTJ formation in α-catenin KO cells by co-culturing WT and chimera-rescue cells. Claudin-3 staining showed that bTJ formation progressed to a similar extent in WT and chimera rescue cells, but that tTJ formation remained in disarray in the latter (Fig. 8, D and E). These observations strongly indicate that α-catenin plays a crucial role at tricellular junctions, which requires its direct interaction with tricellulin.
Discussion
In this study, we revealed that the α-catenin–vinculin complex, previously thought to function only at AJs, also plays an indispensable role in the formation of tTJs. Although multiple reports had previously shown that tricellulin is required for tTJ formation, the precise molecular mechanism by which it exerted its effect had remained elusive. We demonstrate that tricellulin links tTJ-specific TJ strands, the central sealing elements, with F-actin anchored end-on to tricellular junctions. This enables the converging central sealing elements to remain in proximity, which effectively closes the gap that forms at the convergence of three epithelial cells (Fig. 9).
Figure 9.
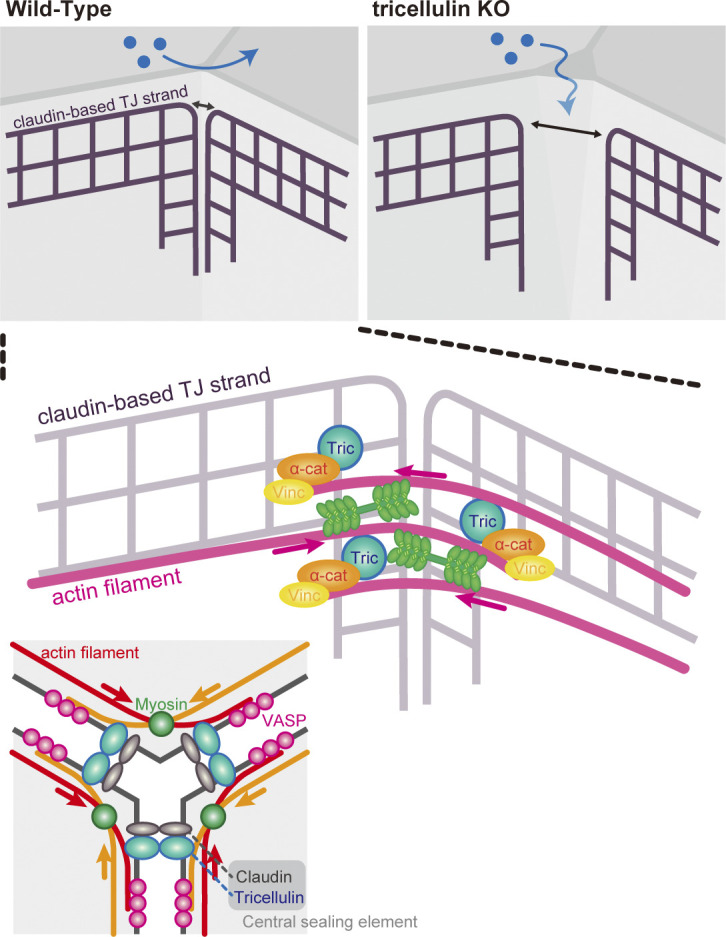
Proposed model of tTJ formation mediated by tricellulin–α-catenin interaction. In WT epithelial cells, an actin meshwork forms around tricellular junctions concurrent with the maturation of bicellular adhesions. The tricellular actin meshwork is anchored to the central sealing elements by the tricellulin–α-catenin–vinculin complex. Myosin-driven contractility brings the converging central sealing elements in close contact and closes the central tube. Because the anchorage between the central sealing elements and the actin filaments is lost in Tric KO cells, myosin cannot act at tTJs, which results in the formation of gaps at tricellular junctions.
The importance of tTJs in the epithelial barrier has been pointed out in several biological contexts. In Drosophila, follicular epithelial cells surrounding oocytes temporarily form large gaps at the tricellular junction to breach the epithelial barrier and take up large-sized nutrients such as lipid droplets from the mother (Isasti-Sanchez et al., 2021; Row et al., 2021). In vertebrates, when neutrophils transmigrate from the blood vessels, they preferentially escape from the tricellular junctions of endothelial cells (Burns et al., 2003). In addition, elongated cell processes of antigen-presenting immune cells search for pathogens on the surface of the body through the tricellular junctions of epithelial cells in the epidermis (Kubo et al., 2009). These examples suggest that the reversible permeability of cells and substances through tricellular junctions of epithelial cells is regulated by mechanisms still unknown. Because tricellulin undergoes post-translational modifications such as phosphorylation (Ikenouchi et al., 2005), and various kinases are reportedly involved in the regulation of the formation of tTJs (Kojima et al., 2010; Nakatsu et al., 2019), it will be important to elucidate how and under what physiological conditions the interaction between α-catenin and tricellulin is regulated in the future studies.
We also revealed that organization of F-actin and contractile activity of myosin II are essential for the formation of a tTJ barrier. First, to our surprise, we found that ZO-1 does not contribute to the physical connection between the central sealing elements and F-actin. ZO-1 is a well-known F-actin binding protein of TJs, but recently it was reported that its binding strength with F-actin is much weaker than that of α-catenin (Belardi et al., 2020; Hansen et al., 2013). The tricellular junctions are thought to be mechanical tension hotspots in the epithelial cell sheet, which we confirmed by observing elevated conformational activation of α-catenin relative to bicellular junctions. Therefore, α-catenin–vinculin, and not ZO-1, may be required as the molecular linker between F-actin and the central sealing elements to bear the comparatively high mechanical load at tricellular junctions. We demonstrated that F-actin is connected to tricellular junctions in a perpendicular end-on manner (Fig. 1 C), but how this organization of F-actin is regulated remains unknown. In this respect, tricellulin was reported to bind to Tuba, which is a guanine nucleotide exchange factor of Cdc42, via its NH2-terminal cytoplasmic region (Oda et al., 2014). Therefore, it will be interesting to examine whether tricellulin is also involved in the formation of the distinctly oriented F-actin strands at tricellular junctions via regulation of the Cdc42–Wiskott-Aldrich syndrome protein (WASP) pathway.
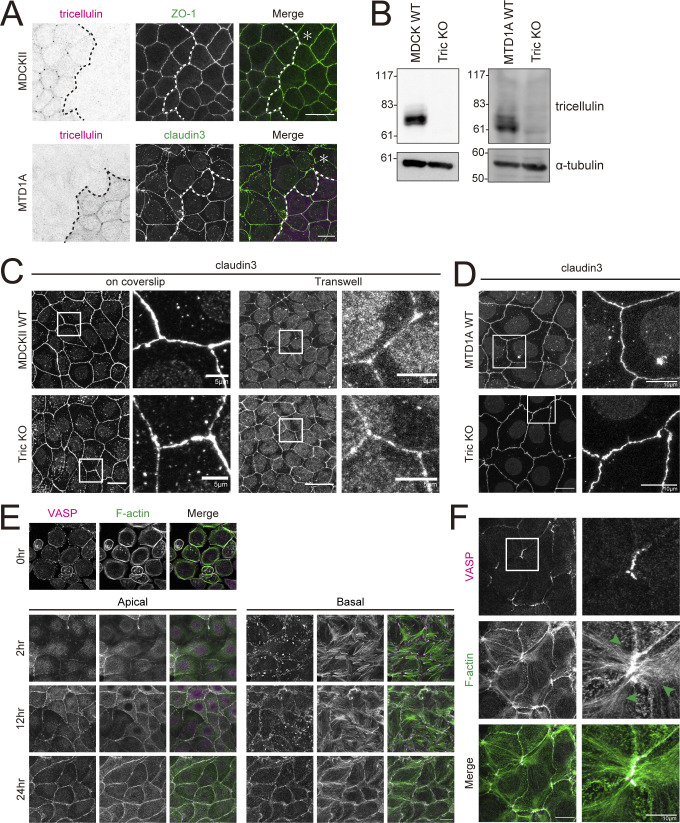
In addition, there may be tissue- or cell type–specific regulatory mechanisms on the mode of interaction between tricellulin and actomyosin network. It has been reported that the mechanism of tricellulin-dependent tTJ formation is particularly important for epithelial sheets that require high barrier function, such as sensory epithelial cells in the inner ear. In contrast, it has been reported that tricellulin is not required for the formation of tTJs in cultured epithelial cells with low barrier function, such as MDCK II cells (Fig. S5, A–C; Sugawara et al., 2021; Van Itallie et al., 2010). Although they cells are often used as typical epithelial cells, MDCK II cells do not have morphologically defined AJs, and no tricellular actin meshworks are observed at tricellular junctions (Fig. S5 E; Miyake et al., 2006). On the other hand, in cultured epithelial cells with high barrier function and normal AJs, such as EpH4 and MTD1A cells, tricellular actin meshworks are formed at tricellular junctions, and loss of tricellulin leads to the disruption of tTJs (Figs. 1 A, 2 C, and S5, D and F). In fact, it was reported that tricellulin is essential for barrier function, especially in tight epithelium (Ayala-Torres et al., 2019). Elucidation of the reason that the requirement of tricellulin for tTJ formation differs depending on such tissues and cell types is also an interesting research topic for the future.
Figure S5.
Depletion of tricellulin affects tTJ formation in MTD1A cells but not in MDCKII cells. (A) Upper panels are immunofluorescence images showing anti-tricellulin mAb (54H19L38, magenta) and anti–ZO-1 mAb (green) staining in a co-culture of WT and Tric KO MDCKII cells. Lower panels are immunofluorescence images showing anti-tricellulin mAb (N24-69, magenta) and anti–claudin-3 pAb (green) staining in a co-culture of WT and Tric KO MTD1A cells. Dotted line overlays the border between WT and Tric KO cells, indicated by the asterisk. Scale bar: 20 μm. (B) Whole-cell lysates of WT and Tric KO MDCKII cells (left panels) or MTD1A cells (right panels) were immunoblotted with the indicated antibodies (MDCKII, anti-tricellulin mAb, 54H19L38; MTD1A, anti-tricellulin pAb, N450). Molecular weight measurements are in kD. (C) WT and Tric KO MDCKII cells were cultured either on coverslips or in Transwell chambers and stained with anti–claudin-3 pAb. Insets are enlarged to the right. Scale bar: 20 μm. (D) WT and Tric KO MTD1A cells were stained with anti–claudin-3 pAb. Insets are enlarged to the right. Scale bar: 20 μm. (E) MDCKII WT cells were cultured overnight in low-calcium medium and then in normal culture medium containing calcium for 0, 2, 12, and 24 h. Cells were stained with phalloidin (green) and anti-VASP mAb (magenta). The images after 2 h show apical projections (upper panels) and basal projections (lower panels) separately, divided into the top row with the apical plane stacked and the bottom row with the basal plane stacked. Scale bar: 20 μm. (F) MTD1A WT cells were subjected to calcium switch and fixed at 24 h after restoration of normal culture medium. Cells were stained with anti-VASP mAb (magenta) and phalloidin (green). Green arrowheads indicate actin fibers extending from tricellular junctions. Scale bar: 20 μm. Source data are available for this figure: SourceData FS5.
Finally, the Drosophila tAJ adhesion molecule Sdk is involved in cell adhesion remodeling that accompanies epithelial sheet deformation (Finegan et al., 2019; Letizia et al., 2019; Uechi and Kuranaga, 2019). It was recently reported that tricellulin is involved in collective cell movement of epithelial cells, which requires coordinated cell adhesion remodeling (Lohmann et al., 2020). It is therefore conceivable that the regulation of tTJs by the interaction between tricellulin and α-catenin could be involved in dynamic behaviors of the epithelial cell sheet. In the future, it will be important to address the role of the tricellulin–α-catenin complex in organizing such phenomena, for example in tissue elongation.
Many mysteries remain in the molecular mechanism of tTJ formation in mammalian epithelial cells. The logical next step will be to clarify how the interaction between tricellulin and α-catenin is regulated.
Materials and methods
Regents and plasmids
Epithelial cells were grown in DMEM supplemented with 10% (vol/vol) FCS. We established KO epithelial cells by using the CRISPR-Cas9 system. Oligonucleotides were phosphorylated, annealed, and cloned into the BsmBI site of pLenti-CRISPR v2 vector according to Zhang laboratory protocols (F. Zhang, Massachusetts Institute of Technology, Cambridge, MA). The target sequences were as follows: tricellulin (mouse), 5′-GGTAGTAGCAGAGTCCACCT-3′; tricellulin (dog), 5′-GGGCGTGTTGAACAGCGGGT-3′; and vinculin (mouse), 5′-GGGGTCACGGAGCCAACCTT-3′.
The following primary antibodies were used for immunofluorescence microscopy, immunoblotting, and PLA: rabbit anti–claudin-3 (34-1700) polyclonal antibody (pAb; Thermo Fisher Scientific); rabbit anti–ZO-1 (61-7300) pAb (Thermo Fisher Scientific); rabbit anti-tricellulin (54H19L38) mAb (Thermo Fisher Scientific); rabbit anti–α-catenin pAb (Sigma-Aldrich); rabbit anti-LSR (HPA007270) pAb (Sigma-Aldrich); mouse anti-vinculin (V9131) mAb (Sigma-Aldrich); rabbit anti-afadin (D1Y3Z) mAb (Cell Signaling Technology); rabbit anti-phospho-myosin light chain 2 (Thr18/Ser19; E2J8F) mAb (Cell Signaling Technology); rabbit anti-VASP (9A2) mAb (Cell Signaling Technology); mouse anti-DYKDDDDK (FLAG; 1E6) mAb (Wako Pure Chemical Industries); mouse anti-V5 (SV5-Pk1) mAb (Abcam); rat ECCD-2 mAb (Takara Bio); mouse anti-PP1γ (E-4) mAb (Santa Cruz); and mouse anti–β-catenin (610154) mAb (BD Biosciences). Rat anti-GFP (JFP-J5), mouse anti–α-tubulin (12G10) mAb, rat anti-occludin (Moc37) mAb, mouse anti–ZO-1 (T8754) mAb, mouse myosin IIB (CMII-23), and mouse anti-GST(P1A12) were produced in-house. Rat anti-mouse tricellulin mAb (N24-69) and rabbit anti-mouse tricellulin pAb (N450) were previously raised in-house (Ikenouchi et al., 2005). Rat anti–α-catenin mAb (α18) was a generous gift from Dr. A. Nagafuchi (Nara Medical University, Nara, Japan). Secondary antibodies were as follows: Cy2-conjugated donkey anti-rat IgG antibody (712-225-150), anti-mouse IgG antibody (715-225-151), and anti-rabbit-IgG antibody (711-225-152); Cy3-conjugated donkey anti-rat IgG antibody (712-165-153), anti-mouse IgG antibody (715-165-150), and anti-rabbit IgG antibody (711-165-152; Jackson ImmunoResearch); and HRP-conjugated anti-rat IgG antibody (HAF005; R&D Systems), anti-mouse-IgG antibody (A90-516P; Bethyl Laboratories), and anti-rabbit IgG antibody (4030-05; Southern Biotech).
F-actin was visualized with either Alexa Fluor 488–phalloidin (A12379) or Alexa Fluor 594–phalloidin (A12381; Invitrogen). Biotinylated protein was visualized with Texas Red streptavidin (SA-5006; Vector). Nuclear was visualized with DAPI (049-18801; Wako Pure Chemical Industries). Blebbistatin was purchased from Cayman Chemical.
Fluorescence microscopy
Epithelial cells cultured on coverslips were fixed with 0.75% formalin (prepared in PBS for 15 min at RT) and treated with 0.4% Triton X-100 prepared in PBS for 5 min. Then cells were blocked with 1% BSA prepared in PBS for 1 h at RT. Cells were incubated with primary antibodies for 1 h at RT and secondary antibodies for 30 min at RT. Antibodies were prepared in blocking buffer. Samples were observed at RT with a confocal microscope (LSM700; Carl Zeiss MicroImaging) equipped with a Plan-APO (63×/1.40 NA, oil immersion) objective. Images were captured on a device camera and acquired using Zen 2012 (Carl Zeiss MicroImaging). Measurement of the brightness in tTJs was quantified by using ImageJ/Fiji.
Immunoblotting
Samples collected by SDS sample buffer were resolved by SDS-PAGE and transferred to nitrocellulose membranes. After blocking with nonfat milk, membranes were sequentially incubated with primary antibody diluted with blocking buffer for 1 h at RT and with HRP-conjugated secondary antibody diluted with blocking buffer for 30 min at RT. Chemiluminescence signal was detected using a LAS4000mini imaging system (Fujifilm), and signal intensity was quantified by using ImageJ/Fiji.
Image analysis for evaluating the anomaly ratio of tTJs
To determine whether tTJs is formed normally, we evaluated immunofluorescence images by the following process. First, histogram equalization was applied to the image (1,192 × 1,192 pixels or 476 × 476 pixels) for bleach correction. Second, after Gaussian blurring with 5 × 5–pixel window size, p-tile binarization (p = 90%) was applied. Third, the top 1% largest connected components were kept, and the remaining components were discarded to remove the fragmental saturated pixels. Fourth, dilation and erosion operations were applied to obtain a consistent binarized image. Fifth, skeletonization was applied to the binarized image to extract the TJ region. Finally, a pixel on the skeleton was defined as a tTJ region when its eight neighborhoods contained at least three skeleton pixels. Note that if two neighboring pixels were determined to be tTJ regions, one of them was discarded as a duplicated detection.
The detected tTJ regions were classified as normal closed or anomalous disrupted tTJs based on the threshold constant K; when the 25 × 25–pixel window centered at a detected tTJ region pixel contained more than K white pixels in the binarized image, the tTJ region was considered disrupted. The threshold K was experimentally determined as 1.65 by taking the average number of white pixels in the 25 × 25–pixel windows centered at the skeleton pixels in the analyzed images.
TER measurement and paracellular tracer flux measurement
TER measurement and paracellular tracer flux analyses were performed as described previously (Ikenouchi et al., 2005). In brief, 105 cells were seeded on a 12-mm-diameter cell culture insert (Thermo Fisher Scientific) and cultured with daily medium changes. TER was measured for 6 d using an epithelial volt-ohm meter (Millicell-ERS; EMD Millipore) with correction for fluid resistance between the potential-sensing electrodes.
After TER measurement on the sixth day, FITC-dextran (3–5, and 250 kD; Sigma-Aldrich) was added to the medium in the apical compartment at a concentration of 1 mg/ml to perform the paracellular tracer flux assay. Medium was collected from the basal compartment after 2 h, and the FITC signal was measured with a fluorometer.
Pull-down assay
HEK293 cells expressing target protein were washed with ice-cold PBS and lysed with cell lysis buffer (20 mM Tris-HCl [pH 7.5], 150 mM NaCl, and 1% Triton X-100) or radioimmunoprecipitation assay (RIPA) buffer (50 mM Tris-HCl, pH 8.0, 150 mM NaCl, 0.1% sodium deoxycholate, 0.1% SDS, and 1% Triton X-100) supplemented with 10 μg/ml leupeptin (334-40414; Wako Pure Chemical Industries), 2 μg/ml aprotinin (10236624001; Roche), and 50 μM amidinobenzylsulfonyl fluoride (015-26333; Wako Pure Chemical Industries). Clarified lysates were incubated with anti-DYKDDDDK tag antibody beads (018-22783; Wako Pure Chemical Industries) overnight. Beads were washed with the lysis buffer, and bound proteins were dissolved in SDS sample buffer.
His-scarlet-α-catenin VH1 and GST-tricellulin Ctail was expressed in Escherichia coli (BL21star pRARE) and purified using TALON metal affinity resin (Takara Bio) or Glutathione Sepharose 4B (GE Healthcare). After measuring the concentration of purified proteins, scarlet α-catenin VH1 was loaded on TALON metal affinity resin, and purified GST-tagged tricellulin Ctail was added in cell lysis buffer. After reacting at 4°C for 2 h, the beads were washed with cell lysis buffer, and bound proteins were eluted with elution buffer (50 mM Hepes NaOH, pH 7.5, 100 mM NaCl, and 200 mM imidazole).
Biotin tracer assay
EZ-Link sulfo-NHS-SS-biotin (Pierce) was adjusted to 1 mg/ml with Biotin Tracer assay buffer (25 mM Hepes NaOH, pH 7.0, 137 mM NaCl, 5 mM KCl, 0.7 mM Na2HPO4, 6 mM dextrose, and 1.8 mM CaCl2). The adjusted biotin was added from the apical side of the epithelial cells and incubated for 10 min. After washing with buffer, the samples were fixed using 100% methanol at −20°C.
PLA
For PLA, we used EpH4 Tric KO cells expressing FLAG-tagged human tricellulin and Duolink PLA Kit (Sigma-Aldrich). The cells cultured on coverslips were fixed with 100% methanol at −20°C. Then cells were blocked with 1% BSA prepared in PBS for 30 min at RT. Blocked cells were incubated with primary antibodies for 1 h at RT. The combination of primary antibodies was mouse anti-DYKDDDDK(FLAG) and one of the following pAbs: rabbit anti-LSR, rabbit anti–α-catenin, rabbit anti-afadin, or rabbit anti–ZO-1. After washing, the samples were incubated with PLA probe solution containing the secondary antibodies for 1 h at 37°C. Then the samples were washed and incubated with the ligation solution containing the DNA ligase for 30 min at 37°C. After ligation, the samples were incubated with the amplification solution containing DNA polymerase and fluorescently labeled nucleotides for 100 min at 37°C. Finally, the samples were washed, counterstained with DAPI in mounting medium, and observed with a confocal microscope. Images from three fields of view were acquired for each sample, with each field of view containing ≥20 nuclei as identified by DAPI staining. The number of PLA signals was divided by the number of nuclei to calculate the number of PLA signals per cell. The results were normalized to the values of the positive control (the PLA signals between LSR and tricellulin), which was set to 1.00. Experiments were performed independently three times.
TurboID streptavidin pulldown assay
For the TurboID streptavidin pulldown assay, we used EpH4 WT cells expressing tricellulin-TurboID-V5. Cells were cultured to confluence in 10-cm dishes, and biotinylation was initiated by adding biotin to a final concentration of 500 µM. After incubating at 37°C for 1 h, the cells were washed with PBS and lysed with RIPA lysis buffer (50 mM Tris-HCl, pH 8.0, 150 mM NaCl, 0.1% sodium deoxycholate, 0.1% SDS, 1% Triton X-100, and protease inhibitor). Clarified lysates were incubated with High Capacity Streptavidin Agarose Resin (Life Technologies) overnight. Beads were washed with RIPA lysis buffer, and bound proteins were dissolved in SDS sample buffer.
Statistical analysis
Prism v8.4.1 (GraphPad) was used to graph data and perform statistical analyses. One-way ANOVA, unpaired t test, or multiple t tests were performed as appropriate to compare means. Normality of data distribution was assessed by D’Agostino–Pearson test. Error bars are SD, and P values are noted in the figures.
Online supplemental material
Fig. S1 shows that binding of ZO-1 to the actin cytoskeleton is not required for normal tTJ formation. Fig. S2 shows the concomitant loss of open-form α-catenin and vinculin from tricellular junctions in tricellulin KO EpH4 cells or EpH4 cells treated with blebbistatin. Fig. S3 shows that ZO-1 associated with claudin-1 could not bind α-catenin simultaneously in L fibroblasts expressing claudin-1. Fig. S4 shows that α-catenin, but not E-cadherin, was efficiently biotinylated in EpH4 cells stably expressing tricellulin fused to a proximity-dependent biotin identification tag. Fig. S5 shows that depletion of tricellulin affects tTJ formation in MTD1A cells but not in MDCKII cells.
Supplementary Material
contains original blots for Fig. 2.
contains original blots for Fig. 3.
contains original blots for Fig. 4.
contains original blots for Fig. 5.
contains original blots for Fig. 6.
contains original blots for Fig. 7.
contains original blots for Fig. 8.
contains original blots for Fig. S4.
contains original blots for Fig. S5.
Acknowledgments
We thank all members of the Ikenouchi Laboratory (Department of Biology, Faculty of Sciences, Kyushu University) for helpful discussions.
This work was supported by MEXT/JSPS KAKENHI (JP19H03227 [J. Ikenouchi], JP21K19231 [J. Ikenouchi], and JP19K06640 [K. Matsuzawa]), AMED-FORCE (21gm4010011h0001), JST-FOREST (JPMJFR204L), and grants from the MSD Life Science Foundation, the Mitsubishi Foundation, and the Cell Science Research Foundation.
The authors declare no competing financial interests.
Author contributions: Y. Cho performed most of the experiments, analyzed the data, and wrote the paper. D. Haraguchi and S. Uchida contributed quantitative image analyses. K. Shigetomi and K. Matsuzawa performed some experiments. J. Ikenouchi designed research and wrote the paper.
References
- Ayala-Torres, C., Krug S.M., Schulzke J.D., Rosenthal R., and Fromm M.. 2019. Tricellulin effect on paracellular water transport. Int. J. Mol. Sci. 20:5700. 10.3390/ijms20225700. [DOI] [PMC free article] [PubMed] [Google Scholar]
- Belardi, B., Hamkins-Indik T., Harris A.R., Kim J., Xu K., and Fletcher D.A.. 2020. A weak link with actin organizes tight junctions to control epithelial permeability. Dev. Cell. 54:792–804.e7. 10.1016/j.devcel.2020.07.022. [DOI] [PMC free article] [PubMed] [Google Scholar]
- Bosveld, F., and Bellaïche Y.. 2020. Tricellular junctions. Curr. Biol. 30:R249–r251. 10.1016/j.cub.2020.01.029 [DOI] [PubMed] [Google Scholar]
- Bosveld, F., Wang Z., and Bellaïche Y.. 2018. Tricellular junctions: a hot corner of epithelial biology. Curr. Opin. Cell Biol. 54:80–88. 10.1016/j.ceb.2018.05.002. [DOI] [PubMed] [Google Scholar]
- Branon, T.C., Bosch J.A., Sanchez A.D., Udeshi N.D., Svinkina T., Carr S.A., Feldman J.L., Perrimon N., and Ting A.Y.. 2018. Efficient proximity labeling in living cells and organisms with TurboID. Nat. Biotechnol. 36:880–887. 10.1038/nbt.4201 [DOI] [PMC free article] [PubMed] [Google Scholar]
- Burns, A.R., Smith C.W., and Walker D.C.. 2003. Unique structural features that influence neutrophil emigration into the lung. Physiol. Rev. 83:309–336. 10.1152/physrev.00023.2002. [DOI] [PubMed] [Google Scholar]
- Burns, A.R., Walker D.C., Brown E.S., Thurmon L.T., Bowden R.A., Keese C.R., Simon S.I., Entman M.L., and Smith C.W.. 1997. Neutrophil transendothelial migration is independent of tight junctions and occurs preferentially at tricellular corners. J. Immunol. 159:2893–2903 [PubMed] [Google Scholar]
- Byri, S., Misra T., Syed Z.A., Bätz T., Shah J., Boril L., Glashauser J., Aegerter-Wilmsen T., Matzat T., Moussian B., et al. 2015. The triple-repeat protein anakonda controls epithelial tricellular junction formation in Drosophila. Dev. Cell. 33:535–548. 10.1016/j.devcel.2015.03.023 [DOI] [PubMed] [Google Scholar]
- Choi, W., Acharya B.R., Peyret G., Fardin M.A., Mege R.M., Ladoux B., Yap A.S., Fanning A.S., and Peifer M.. 2016. Remodeling the zonula adherens in response to tension and the role of afadin in this response. J. Cell Biol. 213:243–260. 10.1083/jcb.201506115 [DOI] [PMC free article] [PubMed] [Google Scholar]
- Fanning, A.S., and Anderson J.M.. 2009. Zonula occludens-1 and -2 are cytosolic scaffolds that regulate the assembly of cellular junctions. Ann. N. Y. Acad. Sci. 1165:113–120. 10.1111/j.1749-6632.2009.04440.x [DOI] [PMC free article] [PubMed] [Google Scholar]
- Finegan, T.M., Hervieux N., Nestor-Bergmann A., Fletcher A.G., Blanchard G.B., and Sanson B.. 2019. The tricellular vertex-specific adhesion molecule Sidekick facilitates polarised cell intercalation during Drosophila axis extension. PLoS Biol. 17:e3000522. 10.1371/journal.pbio.3000522 [DOI] [PMC free article] [PubMed] [Google Scholar]
- Fredriksson, S., Gullberg M., Jarvius J., Olsson C., Pietras K., Gústafsdóttir S.M., Ostman A., and Landegren U.. 2002. Protein detection using proximity-dependent DNA ligation assays. Nat. Biotechnol. 20:473–477. 10.1038/nbt0502-473 [DOI] [PubMed] [Google Scholar]
- Friend, D.S., and Gilula N.B.. 1972. Variations in tight and gap junctions in mammalian tissues. J. Cell Biol. 53:758–776. 10.1083/jcb.53.3.758 [DOI] [PMC free article] [PubMed] [Google Scholar]
- Gorfinkiel, N., and Arias A.M.. 2007. Requirements for adherens junction components in the interaction between epithelial tissues during dorsal closure in Drosophila. J. Cell Sci. 120:3289–3298. 10.1242/jcs.010850 [DOI] [PubMed] [Google Scholar]
- Grashoff, C., Hoffman B.D., Brenner M.D., Zhou R., Parsons M., Yang M.T., McLean M.A., Sligar S.G., Chen C.S., Ha T., and Schwartz M.A.. 2010. Measuring mechanical tension across vinculin reveals regulation of focal adhesion dynamics. Nature. 466:263–266. 10.1038/nature09198 [DOI] [PMC free article] [PubMed] [Google Scholar]
- Hansen, S.D., Kwiatkowski A.V., Ouyang C.Y., Liu H., Pokutta S., Watkins S.C., Volkmann N., Hanein D., Weis W.I., Mullins R.D., and Nelson W.J.. 2013. αE-catenin actin-binding domain alters actin filament conformation and regulates binding of nucleation and disassembly factors. Mol. Biol. Cell. 24:3710–3720. 10.1091/mbc.e13-07-0388 [DOI] [PMC free article] [PubMed] [Google Scholar]
- Higashi, T., and Miller A.L.. 2017. Tricellular junctions: how to build junctions at the TRICkiest points of epithelial cells. Mol. Biol. Cell. 28:2023–2034. 10.1091/mbc.E16-10-0697 [DOI] [PMC free article] [PubMed] [Google Scholar]
- Ikenouchi, J., Furuse M., Furuse K., Sasaki H., Tsukita S., and Tsukita S.. 2005. Tricellulin constitutes a novel barrier at tricellular contacts of epithelial cells. J. Cell Biol. 171:939–945. 10.1083/jcb.200510043 [DOI] [PMC free article] [PubMed] [Google Scholar]
- Ikenouchi, J., Sasaki H., Tsukita S., Furuse M., and Tsukita S.. 2008. Loss of occludin affects tricellular localization of tricellulin. Mol. Biol. Cell. 19:4687–4693. 10.1091/mbc.e08-05-0530 [DOI] [PMC free article] [PubMed] [Google Scholar]
- Ikenouchi, J., Umeda K., Tsukita S., Furuse M., and Tsukita S.. 2007. Requirement of ZO-1 for the formation of belt-like adherens junctions during epithelial cell polarization. J. Cell Biol. 176:779–786. 10.1083/jcb.200612080 [DOI] [PMC free article] [PubMed] [Google Scholar]
- Isasti-Sanchez, J., Münz-Zeise F., Lancino M., and Luschnig S.. 2021. Transient opening of tricellular vertices controls paracellular transport through the follicle epithelium during Drosophila oogenesis. Dev. Cell. 56:1083–1099.e5. 10.1016/j.devcel.2021.03.021 [DOI] [PubMed] [Google Scholar]
- Kishikawa, M., Suzuki A., and Ohno S.. 2008. aPKC enables development of zonula adherens by antagonizing centripetal contraction of the circumferential actomyosin cables. J. Cell Sci. 121:2481–2492. 10.1242/jcs.024109 [DOI] [PubMed] [Google Scholar]
- Kitajiri, S., Katsuno T., Sasaki H., Ito J., Furuse M., and Tsukita S.. 2014. Deafness in occludin-deficient mice with dislocation of tricellulin and progressive apoptosis of the hair cells. Biol. Open. 3:759–766. 10.1242/bio.20147799 [DOI] [PMC free article] [PubMed] [Google Scholar]
- Kojima, T., Fuchimoto J., Yamaguchi H., Ito T., Takasawa A., Ninomiya T., Kikuchi S., Ogasawara N., Ohkuni T., Masaki T., et al. 2010. c-Jun N-terminal kinase is largely involved in the regulation of tricellular tight junctions via tricellulin in human pancreatic duct epithelial cells. J. Cell. Physiol. 225:720–733. 10.1002/jcp.22273 [DOI] [PubMed] [Google Scholar]
- Kubo, A., Nagao K., Yokouchi M., Sasaki H., and Amagai M.. 2009. External antigen uptake by Langerhans cells with reorganization of epidermal tight junction barriers. J. Exp. Med. 206:2937–2946. 10.1084/jem.20091527 [DOI] [PMC free article] [PubMed] [Google Scholar]
- Letizia, A., He D., Astigarraga S., Colombelli J., Hatini V., Llimargas M., and Treisman J.E.. 2019. Sidekick is a key component of tricellular adherens junctions that acts to resolve cell rearrangements. Dev. Cell. 50:313–326.e5. 10.1016/j.devcel.2019.07.007 [DOI] [PMC free article] [PubMed] [Google Scholar]
- Lohmann, S., Giampietro C., Pramotton F.M., Al-Nuaimi D., Poli A., Maiuri P., Poulikakos D., and Ferrari A.. 2020. The role of tricellulin in epithelial jamming and unjamming via segmentation of tricellular junctions. Adv. Sci. (Weinh). 7:2001213. 10.1002/advs.202001213 [DOI] [PMC free article] [PubMed] [Google Scholar]
- Lye, C.M., Naylor H.W., and Sanson B.. 2014. Subcellular localisations of the CPTI collection of YFP-tagged proteins in Drosophila embryos. Development. 141:4006–4017. 10.1242/dev.111310 [DOI] [PMC free article] [PubMed] [Google Scholar]
- Maiden, S.L., and Hardin J.. 2011. The secret life of α-catenin: moonlighting in morphogenesis. J. Cell Biol. 195:543–552. 10.1083/jcb.201103106 [DOI] [PMC free article] [PubMed] [Google Scholar]
- Masuda, S., Oda Y., Sasaki H., Ikenouchi J., Higashi T., Akashi M., Nishi E., and Furuse M.. 2011. LSR defines cell corners for tricellular tight junction formation in epithelial cells. J. Cell Sci. 124:548–555. 10.1242/jcs.072058 [DOI] [PubMed] [Google Scholar]
- Miyake, Y., Inoue N., Nishimura K., Kinoshita N., Hosoya H., and Yonemura S.. 2006. Actomyosin tension is required for correct recruitment of adherens junction components and zonula occludens formation. Exp. Cell Res. 312:1637–1650. 10.1016/j.yexcr.2006.01.031 [DOI] [PubMed] [Google Scholar]
- Nagafuchi, A., Ishihara S., and Tsukita S.. 1994. The roles of catenins in the cadherin-mediated cell adhesion: functional analysis of E-cadherin-alpha catenin fusion molecules. J. Cell Biol. 127:235–245. 10.1083/jcb.127.1.235 [DOI] [PMC free article] [PubMed] [Google Scholar]
- Nakatsu, D., Kano F., Shinozaki-Narikawa N., and Murata M.. 2019. Pyk2-dependent phosphorylation of LSR enhances localization of LSR and tricellulin at tricellular tight junctions. PLoS One. 14:e0223300. 10.1371/journal.pone.0223300 [DOI] [PMC free article] [PubMed] [Google Scholar]
- Nayak, G., Lee S.I., Yousaf R., Edelmann S.E., Trincot C., Van Itallie C.M., Sinha G.P., Rafeeq M., Jones S.M., Belyantseva I.A., et al. 2013. Tricellulin deficiency affects tight junction architecture and cochlear hair cells. J. Clin. Invest. 123:4036–4049. 10.1172/JCI69031 [DOI] [PMC free article] [PubMed] [Google Scholar]
- Oda, Y., Otani T., Ikenouchi J., and Furuse M.. 2014. Tricellulin regulates junctional tension of epithelial cells at tricellular contacts via Cdc42. J. Cell Sci. 127:4201–4212. 10.1242/jcs.150607 [DOI] [PubMed] [Google Scholar]
- Pacquelet, A., and Rørth P.. 2005. Regulatory mechanisms required for DE-cadherin function in cell migration and other types of adhesion. J. Cell Biol. 170:803–812. 10.1083/jcb.200506131 [DOI] [PMC free article] [PubMed] [Google Scholar]
- Riazuddin, S., Ahmed Z.M., Fanning A.S., Lagziel A., Kitajiri S., Ramzan K., Khan S.N., Chattaraj P., Friedman P.L., Anderson J.M., et al. 2006. Tricellulin is a tight-junction protein necessary for hearing. Am. J. Hum. Genet. 79:1040–1051. 10.1086/510022 [DOI] [PMC free article] [PubMed] [Google Scholar]
- Row, S., Huang Y.C., and Deng W.M.. 2021. Developmental regulation of oocyte lipid intake through ‘patent’ follicular epithelium in Drosophila melanogaster. iScience. 24:102275. 10.1016/j.isci.2021.102275 [DOI] [PMC free article] [PubMed] [Google Scholar]
- Schulte, J., Tepass U., and Auld V.J.. 2003. Gliotactin, a novel marker of tricellular junctions, is necessary for septate junction development in Drosophila. J. Cell Biol. 161:991–1000. 10.1083/jcb.200303192 [DOI] [PMC free article] [PubMed] [Google Scholar]
- Shigetomi, K., Ono Y., Inai T., and Ikenouchi J.. 2018. Adherens junctions influence tight junction formation via changes in membrane lipid composition. J. Cell Biol. 217:2373–2381. 10.1083/jcb.201711042 [DOI] [PMC free article] [PubMed] [Google Scholar]
- Staehelin, L.A. 1973. Further observations on the fine structure of freeze-cleaved tight junctions. J. Cell Sci. 13:763–786. [DOI] [PubMed] [Google Scholar]
- Sugawara, T., Furuse K., Otani T., Wakayama T., and Furuse M.. 2021. Angulin-1 seals tricellular contacts independently of tricellulin and claudins. J. Cell Biol. 220:e202005062. 10.1083/jcb.202005062 [DOI] [PMC free article] [PubMed] [Google Scholar]
- Sumagin, R., and Sarelius I.H.. 2010. Intercellular adhesion molecule-1 enrichment near tricellular endothelial junctions is preferentially associated with leukocyte transmigration and signals for reorganization of these junctions to accommodate leukocyte passage. J. Immunol. 184:5242–5252. 10.4049/jimmunol.0903319 [DOI] [PMC free article] [PubMed] [Google Scholar]
- Tsukita, S., Furuse M., and Itoh M.. 2001. Multifunctional strands in tight junctions. Nat. Rev. Mol. Cell Biol. 2:285–293. 10.1038/35067088 [DOI] [PubMed] [Google Scholar]
- Uechi, H., and Kuranaga E.. 2019. The tricellular junction protein Sidekick regulates vertex dynamics to promote bicellular junction extension. Dev. Cell. 50:327–338.e5. 10.1016/j.devcel.2019.06.017 [DOI] [PubMed] [Google Scholar]
- Umeda, K., Ikenouchi J., Katahira-Tayama S., Furuse K., Sasaki H., Nakayama M., Matsui T., Tsukita S., Furuse M., and Tsukita S.. 2006. ZO-1 and ZO-2 independently determine where claudins are polymerized in tight-junction strand formation. Cell. 126:741–754. 10.1016/j.cell.2006.06.043 [DOI] [PubMed] [Google Scholar]
- Van Itallie, C.M., and Anderson J.M.. 2014. Architecture of tight junctions and principles of molecular composition. Semin. Cell Dev. Biol. 36:157–165. 10.1016/j.semcdb.2014.08.011 [DOI] [PMC free article] [PubMed] [Google Scholar]
- Van Itallie, C.M., Fanning A.S., Holmes J., and Anderson J.M.. 2010. Occludin is required for cytokine-induced regulation of tight junction barriers. J. Cell Sci. 123:2844–2852. 10.1242/jcs.065581 [DOI] [PMC free article] [PubMed] [Google Scholar]
- Van Itallie, C.M., Tietgens A.J., and Anderson J.M.. 2017. Visualizing the dynamic coupling of claudin strands to the actin cytoskeleton through ZO-1. Mol. Biol. Cell. 28:524–534. 10.1091/mbc.E16-10-0698 [DOI] [PMC free article] [PubMed] [Google Scholar]
- Vasioukhin, V., Bauer C., Yin M., and Fuchs E.. 2000. Directed actin polymerization is the driving force for epithelial cell-cell adhesion. Cell. 100:209–219. 10.1016/s0092-8674(00)81559-7 [DOI] [PubMed] [Google Scholar]
- Wade, J.B., and Karnovsky M.J.. 1974. The structure of the zonula occludens. A single fibril model based on freeze-fracture. J. Cell Biol. 60:168–180. 10.1083/jcb.60.1.168 [DOI] [PMC free article] [PubMed] [Google Scholar]
- Watabe-Uchida, M., Uchida N., Imamura Y., Nagafuchi A., Fujimoto K., Uemura T., Vermeulen S., van Roy F., Adamson E.D., and Takeichi M.. 1998. alpha-Catenin-vinculin interaction functions to organize the apical junctional complex in epithelial cells. J. Cell Biol. 142:847–857. 10.1083/jcb.142.3.847 [DOI] [PMC free article] [PubMed] [Google Scholar]
- Yonemura, S. 2011. A mechanism of mechanotransduction at the cell-cell interface: emergence of α-catenin as the center of a force-balancing mechanism for morphogenesis in multicellular organisms. Bioessays. 33:732–736. 10.1002/bies.201100064 [DOI] [PubMed] [Google Scholar]
- Yonemura, S., Itoh M., Nagafuchi A., and Tsukita S.. 1995. Cell-to-cell adherens junction formation and actin filament organization: similarities and differences between non-polarized fibroblasts and polarized epithelial cells. J. Cell Sci. 108:127–142. [DOI] [PubMed] [Google Scholar]
- Yonemura, S., Wada Y., Watanabe T., Nagafuchi A., and Shibata M.. 2010. alpha-Catenin as a tension transducer that induces adherens junction development. Nat. Cell Biol. 12:533–542. 10.1038/ncb2055 [DOI] [PubMed] [Google Scholar]
Associated Data
This section collects any data citations, data availability statements, or supplementary materials included in this article.
Supplementary Materials
contains original blots for Fig. 2.
contains original blots for Fig. 3.
contains original blots for Fig. 4.
contains original blots for Fig. 5.
contains original blots for Fig. 6.
contains original blots for Fig. 7.
contains original blots for Fig. 8.
contains original blots for Fig. S4.
contains original blots for Fig. S5.


