

Abstract
Situated models of emotion hypothesize that emotions are optimized for the context at hand, but most neuroimaging approaches ignore context. For the first time, we applied Granger causality (GC) analysis to determine how an emotion is affected by a person’s cultural background and situation. Electroencephalographic recordings were obtained from mainland Chinese (CHN) and US participants as they viewed and rated fearful and neutral images displaying either social or non-social contexts. Independent component analysis and GC analysis were applied to determine the epoch of peak effect for each condition and to identify sources and sinks among brain regions of interest. We found that source–sink couplings differed across culture, situation and culture × situation. Mainland CHN participants alone showed preference for an early-onset source–sink pairing with the supramarginal gyrus as a causal source, suggesting that, relative to US participants, CHN participants more strongly prioritized a scene’s social aspects in their response to fearful scenes. Our findings suggest that the neural representation of fear indeed varies according to both culture and situation and their interaction in ways that are consistent with norms instilled by cultural background.
Keywords: effective connectivity, Granger causality, EEG, emotion, culture, context
Introduction
Emotion categories such as anger and fear are not monolithic entities but vary widely in their neural, physiological and behavioral manifestations (Kreibig, 2010; Wilson-Mendenhall et al., 2011; Wormwood et al., 2019). This variation occurs by traits of the experiencer, such as gender (Fischer et al., 2004), personality (Lim et al., 2012) and cultural background (Kwon et al., 2013; Mesquita et al., 2016), as well as aspects of the emotion’s context (Kreibig, 2010; Wilson-Mendenhall et al., 2011). Such variation is readily explained by psychological constructionist approaches to emotion, which argue that emotions emerge from situation-specific activity within a set of brain networks that are themselves involved in supporting basic psychological processes that are not specific to emotions (Lindquist and Barrett, 2012; Barrett, 2014). This contrasts with a basic emotion approach, wherein emotions are localized to specific brain regions or anatomically defined networks (e.g. Panksepp and Watt, 2011; Tracy and Randles, 2011). Past research has examined the neural basis of emotions (Vytal and Hamann, 2010; Lindquist and Barrett, 2012); the cultural influence on emotional behaviors, perceptions and experiences (Markus and Kitayama, 1991; Kitayama et al., 2006); and the situated nature of emotion (Leshin et al., n.d.; Wilson-Mendenhall et al., 2011). Yet situated emotion has received little examination on the level of effective connectivity.
The purpose of this study was to examine the effects of culture and context on fear by applying Granger causality (GC) analysis to electroencephalographic (EEG) measures of brain activity, obtained while participants viewed images evoking different emotions. Fear is one of the most well-studied emotion categories in both animal and human research (see Leshin and Lindquist, 2020). Its neural correlates, although often associated with the amygdala (see Lindquist et al., 2012), encompass regions throughout the midbrain, basal ganglia, medial temporal lobe (amygdala and hippocampus), ventral and dorsal anterior cingulate cortex, insula, lateral prefrontal cortex, medial prefrontal cortex, posterior cingulate cortex, lateral parietal cortex, sensorimotor cortex and visual cortex (Vytal and Hamann, 2010; Lindquist et al., 2012). For the first time, the present work examines the extent to which the brain’s effective connectivity may depend on the context of the fear experience, the cultural background of the experiencer and their interaction.
Hypothesis 1 (H1): effect of context in emotion processing
Many models of emotion hypothesize that emotions are situated phenomena that prepare the organism to manage a given situation by conferring adaptive advantages (Roseman and Smith, 2001; Barrett & Finlay, 2018). Yet relatively few studies explicitly model the impact of the context on the neural basis of emotion. In this study, context was operationalized as the presence (social) or absence (non-social) of people in a scene. Social situations involve representing faces, body postures and others’ behaviors (Fiske and Taylor, 1991), whereas non-social situations involve representing spatiotemporal information and non-human animals. These situations might also invoke different behavioral affordances such as representation of the mental states of others vs motor actions. Indeed, when Wilson-Mendenhall et al. (2011) instructed participants undergoing functional magnetic resonance imaging (fMRI) to imagine and embody moments of either social threats (e.g. being censured) or non-social threats (e.g. a fire), scenarios involving social threats were associated with greater activation within the ventromedial prefrontal cortex (vmPFC), a region associated with representing the minds of others (Heberlein et al., 2008). In contrast, scenarios involving non-social threats were associated with greater activation within regions involving visuospatial representation and motor actions, such as the parahippocampal gyrus, superior temporal gyrus and mid-cingulate cortex. Similarly, Vieira et al. (2020) found preferential activation of the mPFC in the context of social threats (i.e. facial portrayals of anger) vs non-social threats (i.e. portrayals of arachnids).
Consistent with Wilson-Mendenhall et al. (2011), we expected that (H1) the neural basis of fear would differ when experienced in a social vs non-social context—for instance, by showing greater effective connectivity among regions implicated in socially situated fear conditions (e.g. vmPFC) or activating regions involved in emotion perception of faces (e.g. supramarginal gyrus or superior temporal gyrus; Bechara et al., 1995; Silani et al., 2013). In contrast, for non-social fear conditions, we predicted greater effective connectivity among regions involved in motor action and planning (e.g. supplementary motor area or mid-anterior cingulate; Paus, 2001).
Hypothesis 2 (H2): effect of culture on emotion processing
Culture involves one’s socioecological context as well as one’s values, norms, icons and lay theories (Markus and Kitayama, 1991; Gelfand et al., 2017). The impact of culture on emotion experience is well researched (Markus and Kitayama, 1991; Mesquita and Frijda, 1992; Kitayama et al., 2006; De Leersnyder et al., 2021). There is evidence that cultural norms may have evolved via socialization to facilitate the needs of different groups; geographic proximity, which suggests similar ancestors and/or historical contact, predicts a greater likelihood that two cultures possess more similar understanding of the meaning of emotion categories than more geographically distant cultures (Jackson et al., 2019). Similarly, migration history over millennia is associated with the intensity of affiliative emotions expression; cultures of a relatively heterogeneous migration history (e.g. the USA) are more likely to strongly and intensely express smiles compared to cultures of more homogeneous history (Rychlowska et al., 2015).
Such culturally instantiated norms serve to predict which emotions a person will experience in a given context, the features of that emotion, and how individuals are likely to regulate and express their emotions. Regarding experience, emotion-based norms in Western societies champion the expression and accentuation of emotion, thus encouraging individuals to experience independent emotions (e.g. anger) and to experience their emotions intensely (De Leersnyder et al., 2021). In contrast, emotion-based norms of Eastern societies favor emotions that promote group harmony and collectivist values (e.g. shame) and that do not stand out from the group as overly intense (Boiger et al., 2020; De Leersnyder et al., 2021).
Cultures also vary regarding the features ascribed to an emotion. For instance, individuals from Belgium and Japan experience shame and anger as consisting of different appraisals and action tendencies (Boiger et al., 2020). Despite relatively less research on cross-cultural differences in the neural basis of emotion experience, studies on empathy (Cheon et al., 2013) and emotion perception (see Han and Ma, 2014) suggest that during the perception of the same social stimuli, East Asian participants are more likely to show increased activation in brain regions associated with the representation of others’ minds, whereas Western participants are more likely to show activation in regions associated with the self and the experience and expression of intense emotions (Han and Ma, 2014). Our own recent fMRI findings reveal that participants from the USA have greater activation in the dorsal anterior insula, a region associated with negativity (Lindquist et al., 2016) during negative emotions such as fear (Leshin et al., n.d.).
Finally, cultures proscribe different emotion regulation goals. Individuals from Eastern societies show greater likelihood of regulating emotional experiences at the onset of perception since temperance in experience is valued in these cultures; Matsumoto et al. (2008) found that participants from more collectivist cultures tend to endorse emotion suppression more strongly than cultures prioritizing individualism. Neural correlates of such cultural variation have also been found (e.g. Hajcak and Nieuwenhuis, 2006; Moser et al., 2006, 2009, 2010). For instance, Asian-American and European-American participants showed group differences in the parietal late positive potential during an emotion regulation task, suggesting culturally instantiated tendency for emotion downregulation exclusive to Asian participants (Murata et al., 2013).
For this study, culture is operationalized by nationality, with participants having been born and lived in mainland China or the USA until at least 18 years of age. Consistent with earlier findings, we expected that (H2) the neural basis of fear would differ by culture and that Chinese (CHN) participants would show greater activation and connectivity among regions involved in the representation of social others (e.g. superior temporal gyrus) or emotion regulation [e.g. dorsolateral prefrontal cortex (dlPFC)], while US participants would show greater activation and connectivity among regions involved in the representation of the self (e.g. vmPFC) or the expression of emotion [e.g. supplementary motor area (SMA)].
Hypothesis 3 (H3): context interaction with culture in emotion processing
Finally, evidence suggests that individuals from collectivist societies are more likely to incorporate context into mental representations (Nisbett and Miyamoto, 2005), including emotions (Masuda et al., 2008). Chua et al. (2005a) found that CHN participants were more likely to visually saccade to the background context of visual scenes, whereas American participants more quickly and more frequently fixated on the central image. Similarly, Taiwanese participants focus more on the emotions induced by the situation, whereas American participants focus more on the agency of the main character (Chua et al., 2005b). These findings and similar ones (Nisbett and Miyamoto, 2005; Masuda et al., 2008) are aligned with the collectivist–individualist distinction (Markus and Kitayama, 1991), with individuals from collectivist cultures consistently giving greater priority to context compared to individualist cultures. We thus predicted that (H3) the neural basis of fear would differ according to culture, such that CHN participants would show greater activation and connectivity among regions involved in the representation of social others (e.g. superior temporal gyrus) or emotion regulation (e.g. dlPFC) in social contexts, whereas US participants would show greater activation and connectivity among regions involved in the representation of the self (e.g. vmPFC) or the expression of emotion (e.g. SMA) regardless of context.
Method
Participants
Participants included 21 US natives of European-American descent (12 females, mean ± s.d.: 21.5 ± 1.9 years) and 19 CHN natives who had lived in mainland China for at least 18 years (13 females, mean ± s.d.: 23.1 ± 2.8 years) recruited from local colleges and communities. Among the CHN participants, no significant gender difference was found for time living in China and the USA. Both CHN and US groups included only native or proficient English-speaking participants. Participants had no history of neurological disorder and normal or corrected-to-normal vision. All participants were right-handed, as measured by the Edinburgh inventory (Oldfield, 1971; Toga and Thompson, 2003). Participants gave informed consent before the experiment and received monetary compensation afterward.
Stimuli and experimental procedure
The study protocol was approved by the university’s Institutional Review Board. The image set comprised 180 colored images (60 sad, 60 fear and 60 neutral), with images obtained from the International Affective Picture System (Lang et al., 1999), Open Affective Standardized Image Set (Kurdi et al., 2017) and Nencki Affective Picture System (Marchewka et al., 2014). To establish normed categorizations, participants (N = 444; 54% female, Mage = 37.13 years, s.d. = 11.48) were recruited on Amazon’s Mechanical Turk to rate each image on the degree of valence, arousal and emotion category. Despite differences in mean age between the norming group and the experiment’s participants, the fear-neutral categorization is not expected to be influenced by age; across the adult age span, people tend to report the same intensity of negative affective states in daily life (Carstensen et al., 2000), and age-related differences in emotion appear to be a product of situation selection rather than age (Livingstone and Isaacowitz, 2019). Fear and neutral images differed significantly in ratings of valence (F = 169.51, P < 0.001) and arousal (F = 494.42, P < 0.001). Images of a given category were rated as higher on that category than on other emotion categories. To reduce the number of comparisons, this study only examined data obtained for fear (vs neutral) images. No significant between-culture difference in ratings was found for these images.
Images appeared on a 17" computer monitor 60 cm in front of the participants. Figure 1 depicts the sequence of stimuli. Participants were told to immerse themselves in the images as if they were experiencing the content of the images themselves. After a practice trial, they completed five runs of image sets, each run containing 36 randomly ordered images, including six instances of each combination of context (social and non-social) and emotion (fear, sad and neutral). The set of five runs took about 30 min and was followed by a 9-min resting state task, in which participants were told to focus on the screen’s fixation cross and keep their mind at rest.
Fig. 1.
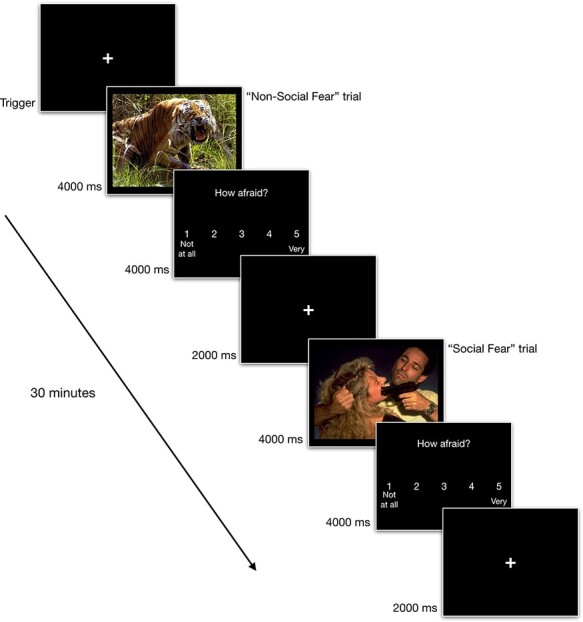
Schematic of stimulus sequence and timing of the task. At the beginning of each trial, cross fixation was displayed for 2 s, followed by an affective picture for 4 s, and then emotion rating scales were presented for 4 s. The total duration of each trial was 12 s regardless of conditions.
EEG acquisition and preprocessing
Figure 2 summarizes the steps applied in preprocessing the EEG dataset and conducting a GC analysis. EEG signals were recorded using an EEG cap (Electro-Cap International, Inc.) embedded with 62 active electrodes covering frontal, central, parietal and occipital areas, based on the modified 10–20 system of the International Federation (Sharbrough et al., 1991). Recordings were referenced to the left ear lobe and grounded to between AFz and Fpz. EEG signals were amplified with a g.USBamp amplifier (g.tec Medical Engineering). EEG signals were sampled at 256 Hz and band-pass filtered between 0.01 and 75 Hz to take out unwanted frequency bands, and notch-filtered at 60 Hz to remove US electrical mains hum.
Fig. 2.
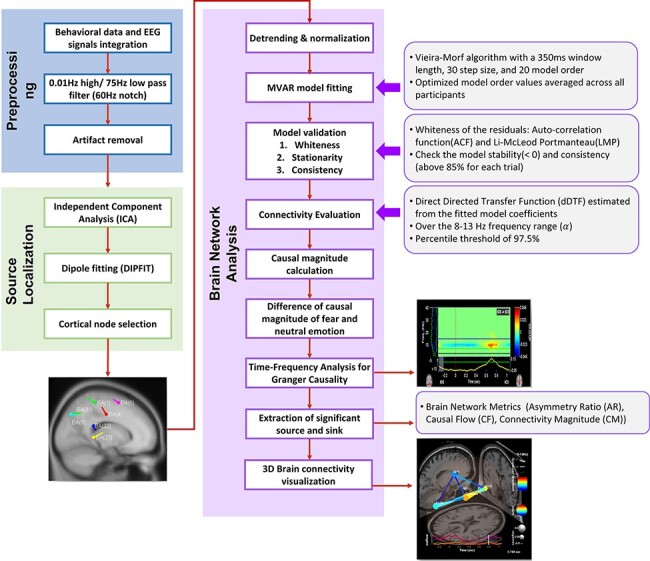
Connectivity analysis procedures. (A) Preprocessing, (B) source localization, (C) Brain Network Analysis.
EEG data were preprocessed according to the steps in Figure 2A. First, EEG data were visually inspected to exclude trials that contained electrode drift noise and muscle-movement-related noise. Then the EEG signal was decomposed into independent components (ICs) through independent component analysis (ICA), and ICs were visually inspected so that components resembling EOG activity were rejected from further analysis. Signal acquisition and processing were all conducted using the BCI2000 system (Schalk et al., 2004), MATLAB (The MathWorks, 2006) and EEGLAB (Delorme et al., 2011).
Effective connectivity analysis
While the use of affective pictures is a commonplace but well-established method of inducing emotion (e.g. Lench et al., 2011), both GC and effective connectivity analysis are still relatively novel compared to traditional quantitative EEG methods such as event-related desynchronization/event-related synchronization (e.g. Nam et al., 2011), event-related potentials (e.g. Lee et al., 2017) and spectral power analysis (e.g. Roche et al., 2019). Although some studies have used GC to examine EEG patterns associated with the recognition of emotion (Keil et al., 2009; Chen et al., 2013), GC analysis has not to our knowledge been applied to examine individual differences in emotion, especially concerning culture and context. We see the latter to be an especially novel contribution of the presented work.
GC is the causal statistical influence between two simultaneously measured time-series datasets, in this case representing neural activity at specific regions of interest. It is a metric for effective connectivity, which, unlike structural and functional connectivity, is concerned with the ‘directed’ causal influence between active brain regions. As a metric for effective connectivity, GC is regarded as an exploratory alternative to dynamic causal modeling (Bressler and Seth, 2011; Roebroeck et al., 2011). Our implementation of GC analysis (Figure 2) was the same as that of Kim et al. (2017, 2019). After artifact removal, source localization was completed in three steps: ICA, dipole fitting and node selection (Figure 2B). Effective connectivity among the selected nodes was evaluated using the EEGLAB Source Information Flow Toolbox (SIFT; Delorme et al., 2011) Finally, for the epoch of peak power for each condition, graph theory metrics were obtained to identify nodes as Granger causal sources and sinks, which indicate effective connectivity from or to a given node, respectively. For details of this study’s implementation of GC analysis, see Supplementary Material.
Results
GC metrics for culture, context and their interaction were obtained for fear-neutral contrast rather than making explicit comparisons of networks for fear and neutral emotion, similar to other EEG- and fMRI-based analyses of emotion (e.g. Fusar-Poli et al., 2009; Peelen et al., 2010; Diano et al., 2017). The purpose of the analysis was to examine categorical differences in overall patterns of connectivity (e.g. differences in source–sink couplings) rather than quantitative analysis comparing specific GC metrics. For this reason, further quantitative analyses (e.g. determining significant differences in connectivity strength between conditions) were not conducted following extraction of GC metrics (for a similar approach, see Coben and Mohammad-Rezazadeh, 2015). Still, connections themselves are determined statistically significant by ICA.
Dipole fitting and epoch selection
Dipole fitting resulted in eight cortical regions of interest, listed in Table 1. All extracted brain sources were less than 10% residual variance (RV), a criterion for determining statistically significant brain sources.
Table 1.
The cortical regions associated with Brodmann’s area (BA) localized during affective processing
| Comp. | Talairach coord. (x, y, z) | Location | Lobe | Closest BA | RV (%) |
|---|---|---|---|---|---|
| 1 | −2, −3, 41 | mACC | Limbic | 24 | 3.81 |
| 2 | 35, −32, 19 | SMG | Parietal | 40 | 6.53 |
| 3 | −42, −29, 45 | Left-PrimSensory (1) | Parietal | 1 | 4 |
| 4 | 13, 46, 24 | dlPFC | Frontal | 9 | 2.9 |
| 5 | 17, −63, 25 | dPCC | Limbic | 31 | 3.82 |
| 6 | 27, 5, −20 | Superior temporal gyrus; temporal pole | Temporal | 38 | 4.8 |
| 7 | −60, −53, 6 | Angular gyrus | Parietal | 39 | 7.4 |
| 8 | −21, 28, 52 | Premotor cortex (PMC) and SMA | Frontal | 6 | 4.76 |
Note: Comp refers to component number.
Effective connectivity analysis was based on alpha bands (8–13 Hz). Given the mean frequency band of the alpha power, the most significant time point for each condition was selected in the time–frequency grid map, which shows the GC between brain nodes. At the most significant time point, the asymmetric ratio (AR) values of all brain sources were computed to determine the main brain source (highest AR value at that time point) and sink (lowest AR value). Additional graph metrics causal flow (CF) and connectivity magnitude (CM) were obtained for these time-specific source–sink pairings. A single pairing was obtained for each condition.
EC analysis of context on emotion (H1)
Table 2 also shows main GC metrics for the social and non-social conditions (see Figure 3 for a visualization). The social condition showed a relatively earlier-onset (20 ms) pairing involving the supramarginal gyrus (SMG; source) and mid-anterior cingulate cortex (mACC; sink). The non-social condition showed a relatively later onset (240 ms) involving the PMC/SMA (source) and dorsal posterior cingulate cortex (dPCC; sink), as well as enhanced bidirectional flow between the SMG and sensory cortex.
Table 2.
GC metrics for peak epochs for univariate effects of culture and context
| Culture | Context | |||
|---|---|---|---|---|
| Variable | US | CHN | Social | Non-social |
| Epoch (ms) | 130 | 20 | 20 | 240 |
| Source | PMC/SMA (8) | SMG (2) | SMG (2) | PMC/SMA (8) |
| Source AR | 0.2917 | 0.1183 | 0.1742 | 0.2974 |
| Source CF | 0.0577 | 0.0596 | 0.0544 | 0.0767 |
| Sink | dPCC (5) | dPCC(5) | mACC (1) | dPCC (5) |
| Sink AR | −0.1653 | −0.6828 | −0.2816 | −0.2227 |
| Sink CF | −0.0268 | −0.0916 | −0.0475 | −0.0207 |
| Source–sink CM | 0.008 | 0.0222 | 0.0312 | 0.0151 |
Note: Epoch indicates the given condition’s most significant time, following stimulus onset, according to the time–frequency grid map. Values beside regions correspond to components listed in Table 1.
Fig. 3.
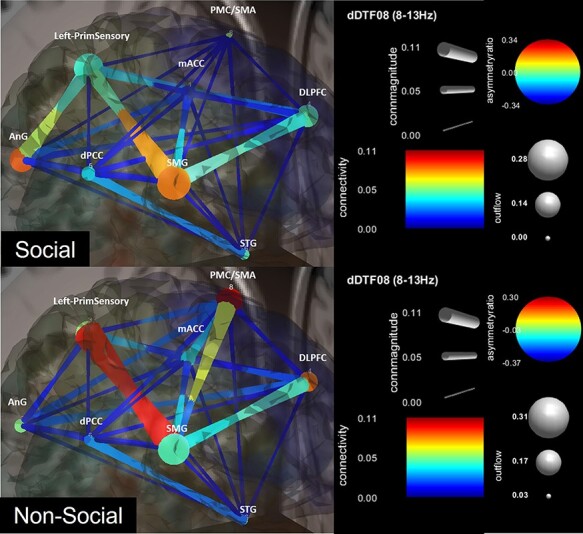
Effective connectivity of social and non-social conditions. For nodes, warmer colors indicate causal sources, cooler colors indicate causal sinks and larger diameters indicate greater outflow from the node. For edges, warmer colors indicate greater connectivity strength and larger diameters indicate greater CM.
EC analysis of culture on emotion (H2)
Table 2 shows GC metrics for culture (see Figure 4 for a visualization). US participants showed a relatively later onset (130 ms) pairing involving the PMC/SMA (source) and dPCC (sink), accompanied by the primary sensory cortex as a major source of outflow to the angular gyrus and mACC. CHN participants showed a relatively earlier-onset (20 ms) pairing involving the SMG (source) and dPCC (sink). In contrast to US participants, CHN participants show relatively less coupling with the sensory cortex and show the angular gyrus as a source rather than sink.
Fig. 4.
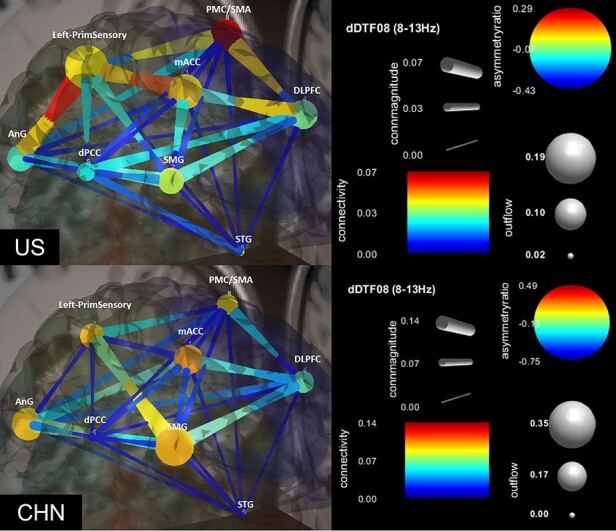
Effective connectivity of US and CHN participants. For nodes, warmer colors indicate causal sources, cooler colors indicate causal sinks and larger diameters indicate greater outflow from the node. For edges, warmer colors indicate greater connectivity strength and larger diameters indicate greater CM.
EC analysis of culture × context interaction on emotion (H3)
Table 3 shows the GC metrics for the four unique combinations of culture and context (see Figure 5 for a visualization). For social images, both US and CHN participants showed pairings with relatively later onset (380 and 460 ms, respectively) compared to the corresponding pairings for the non-social condition (130 and 210 ms, respectively). While the social condition showed the dPCC as a sink regardless of culture, GC source differed by culture, with US participants favoring the PMC/SMA and CHN participants favoring the SMG. For non-social images, the GC source was the same for both cultures while sink differed by culture, with US participants favoring the dlPFC and CHN participants favoring the dPCC.
Table 3.
GC metrics for peak epochs for culture–context interaction
| Variable | Social | Non-social | ||
|---|---|---|---|---|
| US | CHN | US | CHN | |
| Epoch (ms) | 380 | 460 | 130 | 210 |
| Source | PMC/SMA (8) | SMG (2) | PMC/SMA (8) | PMC/SMA (8) |
| Source AR | 0.2953 | 0.6074 | 0.3763 | 0.6267 |
| Source CF | 0.0611 | 0.0831 | 0.062 | 0.3513 |
| Sink | dPCC (5) | dPCC (5) | dlPFC (4) | dPCC (5) |
| Sink AR | −0.3572 | −0.6427 | −0.2816 | −0.4408 |
| Sink CF | −0.0699 | −0.0811 | −0.0205 | −0.0048 |
| Source–sink CM | 0.0382 | 0.0391 | 0.0264 | 0.0031 |
Note: Epoch indicates the given condition’s most significant time, following stimulus onset, according to the time–frequency grid map. Values beside regions correspond to components listed in Table 1.
Fig. 5.
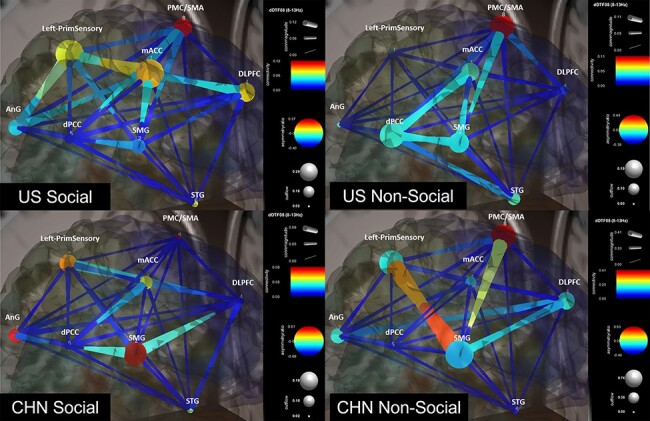
Effective connectivity of culture–context interaction. For nodes, warmer colors indicate causal sources, cooler colors indicate causal sinks and larger diameters indicate greater outflow from the node. For edges, warmer colors indicate greater connectivity strength and larger diameters indicate greater CM.
Discussion
Effective connectivity during emotion is mediated by context
Consistent with the notion that emotions are highly situated (Wilson-Mendenhall et al., 2011), we predicted that (H1) social and non-social images would elicit different connectivity patterns reflecting differences in situated fear. Indeed, the non-social condition showed a pairing of the PMC/SMA (source) and dPCC (sink), suggesting that non-social instances of fear preferentially evoked sensorimotor representations—a finding consistent with Wilson-Mendenhall et al. (2011). In contrast, the social condition showed an early latency pairing of the SMG and mACC, accompanied by outflow from the angular gyrus. While consistent with our prediction, this pairing is too early to plausibly reflect response to the image but may reflect anticipation of upcoming social information and motor action. The SMG is involved in recognizing emotion in facial expressions (Adolphs et al., 1996), and the mACC is involved in many processes related to motor control (Lindquist et al., 2012). The angular gyrus is extensively involved in social cognition; it is commonly activated in theory of mind tasks that involve inferences regarding others’ beliefs and goals (Schurz et al., 2017), and it is active in instances of action-outcome evaluation when observed actions are attributed to another person’s agency as opposed one’s own (Farrer and Frith, 2002). With regard to the latter, it has been suggested that the angular gyrus is more generally a supramodal area acting as a mediator between perception and interpretation (van Kemenade et al., 2017).
Effective connectivity during emotion is mediated by cultural background
Consistent with known cultural differences in emotion (see De Leersnyder et al., 2021), we predicted (H2) cultural differences in effective connectivity patterns during fear. Indeed, we found that for US participants the PMC appeared as a source, accompanied by outflow from S1. Positive and negative images are known to affect motor cortex excitability (Hajcak et al., 2007), and the SMA is thought to receive projections from the mACC with the function of directing attention and motor response (Devinsky et al., 1995; Lindquist et al., 2012). This suggests that US participants were experiencing fear—whether social or non-social—as a state involving heightened sensory processing and motor preparation.
In contrast, CHN participants showed a source–sink pairing involving the SMG with outflow from the angular gyrus. As discussed earlier, the angular gyrus is involved in social cognition (Schurz et al., 2017) and action-outcome awareness (van Kemenade et al., 2017). The SMG is more specifically associated with visual recognition of emotion in facial expressions (Adolphs et al., 1996). Together, this suggests that CHN participants might have been engaging in relatively more social processing, regardless of social vs non-social context. These findings are consistent with earlier findings that East Asian participants, relative to Western participants, show greater tendencies to construct emotional meaning based on others’ emotional and mental states (e.g. Masuda et al., 2008). Interestingly, the SMG is also implicated in attenuating egocentricity bias (Silani et al., 2013), a finding consistent with this interpretation. Notably, the angular gyrus–SMG pairing was relatively earlier in latency than US participants’ activation and too early to reflect a response to the presented image. This may suggest that CHN participants recruited regions known to support socioemotional processing in an anticipatory manner, rather than in response to the given image. In addition, our findings suggest that CHN participants showed less preference for the recruitment of sensorimotor regions in response to the images, relative to US participants.
It is further worth noting that these differences were found despite any potential for acculturation of CHN participants to the US context. Our recruitment criteria ensured that CHN participants had lived at least 18 years in mainland China. Given that the average age of CHN participants was 23.1 ± 2.8 years (s.d.), we do not expect that exposure to US culture superseded CHN native’s cultural background. However, previous work on emotional acculturation (De Leersnyder et al., 2011) suggests that this effect is worth examining in future studies, provided a sample with greater variation in acculturation time.
The interaction of context and culture on effective connectivity during emotion
Lastly, we expected (H3) a context × culture interaction involving cultural differences in source–sink pairing for social images. Indeed, while other combinations of culture and context consistently showed the PMC/SMA as a causal source, the CHN social condition alone showed a marked lack of outflow from the PMC/SMA and instead showed both the angular gyrus and the SMG as Granger causal sources. Similarly, while other interactions consistently showed the dPCC as causal sink, the US non-social condition alone showed the dlPFC as a causal sink. This is consistent with our analysis of culture, in that it appears that CHN participants have more strongly prioritized regions involved in social emotional processing (SMG and angular gyrus) relative to other regions involved in representation of sensory information and action planning (dlPFC, PMC and S1).
We also observed that the CHN-social condition (CHN-S) connectivity strength was the strongest among all combinations of culture and situation, although the CHN-S and US-social (US-S) connectivity magnitudes are comparable. Altogether, differences in source–sink pairing corroborate a view that, relative to US participants, CHN participants prioritized social aspects of the scene when experiencing fear.
Implications
Altogether, our results suggest that neural patterns of effective connectivity indeed reflect situational and cultural differences in instances of fear. This is consistent with an emphasis of context in social psychology (Asch, 1956; Latane and Darley, 1968), as well as emotion models wherein emotion is highly situated (Lindquist, 2013; Gendron et al., 2020; De Leersnyder et al., 2021). This contrasts with theoretical approaches (e.g. Ekman and Cordaro, 2011; Izard, 2011) which treat emotions as having dedicated neural circuitry that activates in a consistent and specific manner across contexts (Kragel and LaBar, 2016; Saarimäki et al., 2016).
Apart from theoretical implications, these findings may also inform future research on brain–computer interfaces (Nam et al., 2018) which seek to ‘read’ the emotional experiences of users and predict their behavior or studies that seek to find biomarkers of emotional disorders such as depression (Li et al., 2019; Cai et al., 2020). Modeling the situated nature of emotions may give technology greater purchase in these categorization efforts.
Limitations and future research
Several limitations bear acknowledgment. First, EEG has relatively impoverished spatial resolution compared to fMRI or positron emission tomography (PET), perhaps accounting for why we failed to find a component representing the amygdala, for instance. However, it should be noted that other components—such as the mACC—are highly connected to the amygdala (Vogt et al., 1987) and are thought to subserve responses to salient stimuli (see Lindquist et al., 2012). Furthermore, other studies examining emotion have similarly found lack of heightened amygdala activity when contrasting fear with other emotions (Winston et al., 2003; Peelen et al., 2010), and meta-analyses of the fMRI and PET literature (bearing better spatial resolution than EEG) reveal that the amygdala is less reliably active in fearful experiences than in other emotional states (Lindquist et al., 2012) and in some cases is not necessary for fear response (Ponnusamy et al., 2007; Amsel et al., 2015).
Second, our manipulation of context and emotion category was restricted to fear in social and non-social situations, despite the wealth of emotion categories and means of characterizing a situation (e.g. imminence of threat and ability to escape; Harrison et al., 2015). However, consistent with previous findings on positive emotion (e.g. Iwata et al., 1995; Iwata and Buka, 2002), we predict that other emotion categories would show similar variation in culture and context, insofar as those emotion categories are affected by the instillment of cultural norms. Furthermore, considering proposed universal functions of fear in threat avoidance, fear might be an emotion category where cultural differences might be least likely. If true, the present study may be underestimating the range of cultural differences in the neural basis of emotion. Nonetheless, future research may compare variation both within and between emotion categories.
Third, our study was not designed to discriminate among the host of measurable phenomena underlying a given instance of emotion, such as situation appraisal, accessing conceptual knowledge, accessing norms of emotion conceptualization, and the initiation of response in physiology and behavior (Barrett et al., 2007; De Leersnyder et al., 2021). Still, differences of source–sink pairings may speak to culture’s influence on the variety of psychological processes occurring in an instance of emotion—for instance, suggesting differences in response (e.g. heightened sensorimotor processing during fear) and appraisal (e.g. heightened emphasis on social processing). Future research should investigate the extent to which these differences correlate with differences in appraisals, behavioral intentions, peripheral physiology or eye tracking to further disambiguate their meanings.
A final limitation is the issue of sample size, which is not uncommon for studies of effective connectivity. Still, our sample (N = 21 US and 19 CHN) size surpassed that required by a power analysis using G*Power (Cohen’s d = 0.5, power = 0.8; Faul et al., 2007). It is also worth noting that the sample size was greater than those of previous GC analyses: 10 participants in Protopapa et al. (2014), 20 in Kim et al. (2017) and 20 in Kim et al. (2019).
Conclusion
The purpose of this study was to determine the effect of context, culture and their interaction in how emotional content is represented via effective connectivity among the brain regions. In a task involving emotion induction from fearful and neutral images, we found context-, culture-, and context by culture-driven differences in terms of GC metrics. To our knowledge, this is the first study that has applied GC to examine context, culture and their interaction on the effective connectivity of brain networks during emotion. Our findings corroborate a constructionist account of emotion, wherein the experience of emotion is highly situated.
Supplementary Material
Acknowledgements
We would like to thank all those who have helped in carrying out the research, including Nayoung Kim for her assistance in data collection.
Contributor Information
Zachary H Pugh, Department of Psychology, North Carolina State University, Raleigh, NC 27695, USA.
Sanghyun Choo, Department of Industrial and Systems Engineering, North Carolina State University, Raleigh, NC 27695, USA.
Joseph C Leshin, Department of Psychology and Neuroscience, University of North Carolina at Chapel Hill, Chapel Hill, NC 27599, USA.
Kristen A Lindquist, Department of Psychology and Neuroscience, University of North Carolina at Chapel Hill, Chapel Hill, NC 27599, USA.
Chang S Nam, Department of Industrial and Systems Engineering, North Carolina State University, Raleigh, NC 27695, USA.
Funding
This research was partly supported by the National Science Foundation (NSF) under Grant NSF BCS-1551688. Any opinions, findings and conclusions or recommendations expressed in this material are those of the authors and do not necessarily reflect the views of the NSF.
Conflict of interest
The authors declared that they had no conflict of interest with respect to their authorship or the publication of this article.
Supplementary data
Supplementary data are available at SCAN online.
References
- Adolphs R., Damasio H., Tranel D., Damasio A.R. (1996). Cortical systems for the recognition of emotion in facial expressions. Journal of Neuroscience, 16(23), 7678–87. [DOI] [PMC free article] [PubMed] [Google Scholar]
- Amsel L., Harbo S., Halberstam A. (2015). There is nothing to fear but the amygdala: applying advances in the neuropsychiatry of fear to public policy. Mind & Society, 14(1), 141–52. [Google Scholar]
- Asch S.E. (1956). Studies of independence and conformity: I. A minority of one against a unanimous majority. Psychological Monographs: General and Applied, 70(9), 1–70. [Google Scholar]
- Barrett L.F., Mesquita B., Ochsner K.N., Gross J.J. (2007). The experience of emotion. Annual Review of Psychology, 58(1), 373–403. [DOI] [PMC free article] [PubMed] [Google Scholar]
- Barrett L.F.(2014). The conceptual act theory: a précis. Emotion Review, 6(4), 292–7. doi: 10.1177/1754073914534479. [DOI] [Google Scholar]
- Barrett L.F., Finlay B.L. (2018). Concepts, goals and the control of survival-related behaviors. Current Opinion in Behavioral Sciences, 24(November), 172–9. [DOI] [PMC free article] [PubMed] [Google Scholar]
- Bechara A., Tranel D., Damasio H., Adolphs R., Rockland C., Damasio A.R.(1995). Double dissociation of conditioning and declarative knowledge relative to the amygdala and hippocampus in humans. Science, 269(5227), 1115–18. doi: 10.1126/science.7652558. [DOI] [PubMed] [Google Scholar]
- Boiger M., Kirchner-Häusler A., Schouten A., Uchida Y., Mesquita B.(2020). Different bumps in the road: the emotional dynamics of couple disagreements in Belgium and Japan. Emotion. 10.1037/emo0000910. [DOI] [PubMed] [Google Scholar]
- Bressler S.L., Seth A.K. (2011). Wiener–Granger causality: a well established methodology. NeuroImage, 58, 323–9. [DOI] [PubMed] [Google Scholar]
- Cai H., Qu Z., Li Z., Zhang Y., Hu X., Hu B. (2020). Feature-level fusion approaches based on multimodal EEG data for depression recognition. Information Fusion, 59(November 2019), 127–38. [Google Scholar]
- Carstensen L.L., Pasupathi M., Mayr U., Nesselroade J.R. (2000). Emotional experience in everyday life across the adult life span. Journal of Personality and Social Psychology, 79(4), 644–55. [PubMed] [Google Scholar]
- Chen D., Wu F., Wang Z., Li H., Chen J. (2013). Eeg-based emotion recognition with brain network using independent components analysis and Granger causality. International Conference on Computer Medical Applications, ICCMA 2013, 4(1), 1–8. [Google Scholar]
- Cheon B.K., Im D.-M., Harada T., et al. (2013). Cultural modulation of the neural correlates of emotional pain perception: the role of other-focusedness. Neuropsychologia, 51(7), 1177–86. [DOI] [PubMed] [Google Scholar]
- Chua H.F., Boland J.E., Nisbett R.E. (2005a). Cultural variation in eye movements during scene perception. Proceedings of the National Academy of Sciences of the United States of America, 102(35), 12629–33. [DOI] [PMC free article] [PubMed] [Google Scholar]
- Chua H.F., Leu J., Nisbett R.E. (2005b). Culture and diverging views of social events. Personality & Social Psychology Bulletin, 31(7), 925–34. [DOI] [PubMed] [Google Scholar]
- Coben R., Mohammad-Rezazadeh I. (2015). Neural connectivity in epilepsy as measured by Granger causality. Frontiers in Human Neuroscience, 9, 194. doi: 10.3389/fnhum.2015.00194. [DOI] [PMC free article] [PubMed] [Google Scholar]
- De Leersnyder J., Mesquita B., Kim H.S. (2011). Where do my emotions belong? A study of immigrants’ emotional acculturation. Personality & Social Psychology Bulletin, 37(4), 451–63. [DOI] [PubMed] [Google Scholar]
- De Leersnyder J., Mesquita B., Boiger M. (2021). What has culture got to do with emotions? Handbook of Advances in Culture and Psychology, 8(62), 62–119. [Google Scholar]
- Delorme A., Mullen T., Kothe C., et al. (2011). EEGLAB, SIFT, NFT, BCILAB, and ERICA: new tools for advanced EEG processing. Computational Intelligence and Neuroscience. doi: 10.1155/2011/130714. [DOI] [PMC free article] [PubMed] [Google Scholar]
- Devinsky O., Morrell M.J., Vogt B.A. (1995). Contributions of anterior cingulate cortex to behaviour. Brain : A Journal of Neurology, 118(1), 279–306. [DOI] [PubMed] [Google Scholar]
- Diano M., Tamietto M., Celeghin A., et al. (2017). Dynamic changes in amygdala psychophysiological connectivity reveal distinct neural networks for facial expressions of basic emotions. Scientific Reports, 7(1), 1–13. [DOI] [PMC free article] [PubMed] [Google Scholar]
- Ekman P., Cordaro D. (2011). What is meant by calling emotions basic. Emotion Review, 3(4), 364–70. [Google Scholar]
- Farrer C., Frith C.D. (2002). Experiencing oneself vs another person as being the cause of an action: the neural correlates of the experience of agency. NeuroImage, 15(3), 596–603. [DOI] [PubMed] [Google Scholar]
- Faul F., Erdfelder E., Lang A.-G., Buchner A. (2007). G*Power 3: a flexible statistical power analysis program for the social, behavioral, and biomedical sciences. Behavior Research Methods, 39(2), 175–91. [DOI] [PubMed] [Google Scholar]
- Fischer A.H., Rodriguez Mosquera P.M., Van Vianen A.E.M., Manstead A.S.R. (2004). Gender and culture differences in emotion. Emotion, 4(1), 87–94. [DOI] [PubMed] [Google Scholar]
- Fiske S.T., Taylor S.E. (1991). SocialCognition, 2nd edn, New York, NY: McGrawHill. [Google Scholar]
- Fusar-Poli P., Placentino A., Carletti F., et al. (2009). Functional atlas of emotional faces processing: a voxel-based meta-analysis of 105 functional magnetic resonance imaging studies. Journal of Psychiatry and Neuroscience, 34(6), 418–32. [PMC free article] [PubMed] [Google Scholar]
- Gelfand M.J., Harrington J.R., Jackson J.C.(2017). The strength of social norms across human groups. Perspectives on Psychological Science, 12(5), 800–9. doi: 10.1177/1745691617708631. [DOI] [PubMed] [Google Scholar]
- Gendron M., Mesquita B., Barrett L.F. (2020). The brain as a cultural artifact. In: Culture, Mind, and Brain, Cambridge: Cambridge University Press, 188–222. doi: 10.1017/9781108695374.010. [DOI] [Google Scholar]
- Hajcak G., Molnar C., George M.S., Bolger K., Koola J., Nahas Z.(2007). Emotion facilitates action: a transcranial magnetic stimulation study of motor cortex excitability during picture viewing. Psychophysiology, 44(1), 91–7. doi: 10.1111/j.1469-8986.2006.00487.x. [DOI] [PubMed] [Google Scholar]
- Hajcak G., Nieuwenhuis S.(2006). Reappraisal modulates the electrocortical response to unpleasant pictures. Cognitive, Affective & Behavioral Neuroscience, 6(4), 291–7. doi: 10.3758/CABN.6.4.291. [DOI] [PubMed] [Google Scholar]
- Han S., Ma Y. (2014). Cultural differences in human brain activity: a quantitative meta-analysis. NeuroImage, 99, 293–300. [DOI] [PubMed] [Google Scholar]
- Harrison L.A., Ahn C., Adolphs R. (2015). Exploring the structure of human defensive responses from judgments of threat scenarios. PLoS One, 10(8), e0133682. [DOI] [PMC free article] [PubMed] [Google Scholar]
- Heberlein A.S., Padon A.A., Gillihan S.J., Farah M.J., Fellows L.K. (2008). Ventromedial frontal lobe plays a critical role in facial emotion recognition. Journal of Cognitive Neuroscience, 20(4), 721–33. [DOI] [PubMed] [Google Scholar]
- Iwata N., Roberts C.R., Kawakami N. (1995). Japan-U.S. comparison of responses to depression scale items among adult workers. Psychiatry Research, 58(3), 237–45. [DOI] [PubMed] [Google Scholar]
- Iwata N., Buka S. (2002). Race/ethnicity and depressive symptoms: a cross-cultural/ethnic comparison among university students in East Asia, North and South America. Social Science & Medicine, 55(12), 2243–52. [DOI] [PubMed] [Google Scholar]
- Izard C.E. (2011). Forms and functions of emotions: matters of emotion–cognition interactions. Emotion Review, 3(4), 371–8. [Google Scholar]
- Jackson J.C., Watts J., Henry T.R., et al. (2019). Emotion semantics show both cultural variation and universal structure. Science, 366(6472), 1517–22. [DOI] [PubMed] [Google Scholar]
- Keil A., Sabatinelli D., Ding M., Lang P.J., Ihssen N., Heim S. (2009). Re-entrant projections modulate visual cortex in affective perception: evidence from Granger causality analysis. Human Brain Mapping, 30(2), 532–40. [DOI] [PMC free article] [PubMed] [Google Scholar]
- Kim N.Y., Wittenberg E., Nam C.S. (2017). Behavioral and neural correlates of executive function: interplay between inhibition and updating processes. Frontiers in Neuroscience, 11(June), 1–14. [DOI] [PMC free article] [PubMed] [Google Scholar]
- Kim N.Y., House R., Yun M.H., Nam C.S. (2019). Neural correlates of workload transition in multitasking: an ACT-R model of hysteresis effect. Frontiers in Human Neuroscience, 12, 535. doi: 10.3389/fnhum.2018.00535. [DOI] [PMC free article] [PubMed] [Google Scholar]
- Kitayama S., Mesquita B., Karasawa M. (2006). Cultural affordances and emotional experience: socially engaging and disengaging emotions in Japan and the United States. Journal of Personality and Social Psychology, 91(5), 890–903. [DOI] [PubMed] [Google Scholar]
- Kragel P.A., LaBar K.S. (2016). Decoding the nature of emotion in the brain. Trends in Cognitive Sciences, 20(6), 444–55. [DOI] [PMC free article] [PubMed] [Google Scholar]
- Kreibig S.D. (2010). Autonomic nervous system activity in emotion: a review. Biological Psychology, 84(3), 394–421. [DOI] [PubMed] [Google Scholar]
- Kurdi B., Lozano S., Banaji M.R. (2017). Introducing the Open Affective Standardized Image Set (OASIS). Behavior Research Methods, 49(2), 457–70. [DOI] [PubMed] [Google Scholar]
- Kwon H., Yoon K.L., Joormann J., Kwon J.-H. (2013). Cultural and gender differences in emotion regulation: relation to depression. Cognition & Emotion, 27(5), 769–82. [DOI] [PubMed] [Google Scholar]
- Lang P.J., Bradley M.M., Cuthbert B.N. (1999). International Affective Picture System (IAPS): Instruction Manual and Affective Ratings. The Center for Research in Psychophysiology, University of Florida. [Google Scholar]
- Latane B., Darley J.M. (1968). Group inhibition of bystander intervention in emergencies. Journal of Personality and Social Psychology, 10(3), 215–21. [DOI] [PubMed] [Google Scholar]
- Lee J.Y., Lindquist K.A., Nam C.S. (2017). Emotional granularity effects on event-related brain potentials during affective picture processing. Frontiers in Human Neuroscience, 11, 133. doi: 10.3389/fnhum.2017.00133. [DOI] [PMC free article] [PubMed] [Google Scholar]
- Lench H.C., Flores S.A., Bench S.W. (2011). Discrete emotions predict changes in cognition, judgment, experience, behavior, and physiology: a meta-analysis of experimental emotion elicitations. Psychological Bulletin, 137(5), 834–55. [DOI] [PubMed] [Google Scholar]
- Leshin J.C., McCormick E.M., Doyle C.M., Gates K.M., Nam C.S., Lindquist K.A. (n.d.). Situational and Cultural Context Moderate the Brain Representation of Emotion Experience. [Google Scholar]
- Leshin J.C., Lindquist K.A. (2020). Neuroimaging of emotion dysregulation. In: Beauchaine, T.P., Crowell, S.E., editors. The Oxford Handbook of Emotion Dysregulation, New York: Oxford University Press, 181–201. doi: 10.1093/oxfordhb/9780190689285.013.14. [DOI] [Google Scholar]
- Li X., La R., Wang Y., et al. (2019). EEG-based mild depression recognition using convolutional neural network. Medical & Biological Engineering & Computing, 57(6), 1341–52. [DOI] [PubMed] [Google Scholar]
- Lim S.I., Woo J.C., Bahn S., Nam C.S. (2012). The effects of individuals’ mood state and personality trait on the cognitive processing of emotional stimuli. Proceedings of the Human Factors and Ergonomics Society Annual Meeting, 56(1), 1059–63. [Google Scholar]
- Lindquist K.A., Wager T.D., Kober H., Bliss-Moreau E., Barrett L.F. (2012). The brain basis of emotion: a meta-analytic review. Behavioral and Brain Sciences, 35(3), 121–43. [DOI] [PMC free article] [PubMed] [Google Scholar]
- Lindquist K.A. (2013). Emotions emerge from more basic psychological ingredients: a modern psychological constructionist model. Emotion Review, 5(4), 356–68. [Google Scholar]
- Lindquist K.A., Satpute A.B., Wager T.D., Weber J., Barrett L.F. (2016). The brain basis of positive and negative affect: evidence from a meta-analysis of the human neuroimaging literature. Cerebral Cortex, 26(5), 1910–22. [DOI] [PMC free article] [PubMed] [Google Scholar]
- Lindquist K.A., Barrett L.F. (2012). A functional architecture of the human brain: emerging insights from the science of emotion. Trends in Cognitive Sciences, 16(11), 533–40. [DOI] [PMC free article] [PubMed] [Google Scholar]
- Livingstone K.M., Isaacowitz D.M. (2019). Age similarities and differences in spontaneous use of emotion regulation tactics across five laboratory tasks. Journal of Experimental Psychology: General, 148(11), 1972–92. [DOI] [PMC free article] [PubMed] [Google Scholar]
- Marchewka A., Żurawski Ł., Jednoróg K., Grabowska A. (2014). The Nencki Affective Picture System (NAPS): introduction to a novel, standardized, wide-range, high-quality, realistic picture database. Behavior Research Methods, 46(2), 596–610. [DOI] [PMC free article] [PubMed] [Google Scholar]
- Markus H.R., Kitayama S. (1991). Culture and the self: implications for cognition, emotion, and motivation. Psychological Review, 98(2), 224–53. [Google Scholar]
- Masuda T., Ellsworth P.C., Mesquita B., Leu J., Tanida S., Van de Veerdonk E. (2008). Placing the face in context: cultural differences in the perception of facial emotion. Journal of Personality and Social Psychology, 94(3), 365–81. [DOI] [PubMed] [Google Scholar]
- Matsumoto D., Yoo S.H., Nakagawa S. (2008). Culture, emotion regulation, and adjustment. Journal of Personality and Social Psychology, 94(6), 925–37. [DOI] [PubMed] [Google Scholar]
- Mesquita B., De Leersnyder J., Boiger M. (2016). The cultural psychology of emotion. Handbook of Emotion, 4, 393–411. [Google Scholar]
- Mesquita B., Frijda N.H. (1992). Cultural variations in emotions: a review. Psychological Bulletin, 112(2), 179–204. [DOI] [PubMed] [Google Scholar]
- Moser J.S., Hajcak G., Bukay E., Simons R.F. (2006). Intentional modulation of emotional responding to unpleasant pictures: an ERP study. Psychophysiology, 43(3), 292–6. [DOI] [PubMed] [Google Scholar]
- Moser J.S., Krompinger J.W., Dietz J., Simons R.F. (2009). Electrophysiological correlates of decreasing and increasing emotional responses to unpleasant pictures. Psychophysiology, 46(1), 17–27. [DOI] [PubMed] [Google Scholar]
- Moser J.S., Most S.B., Simons R.F. (2010). Increasing negative emotions by reappraisal enhances subsequent cognitive control: a combined behavioral and electrophysiological study. Cognitive, Affective & Behavioral Neuroscience, 10(2), 195–207. [DOI] [PubMed] [Google Scholar]
- Murata A., Moser J.S., Kitayama S. (2013). Culture shapes electrocortical responses during emotion suppression. Social Cognitive and Affective Neuroscience, 8(5), 595–601. [DOI] [PMC free article] [PubMed] [Google Scholar]
- Nam C.S., Jeon Y., Kim Y.-J., Lee I., Park K. (2011). Movement imagery-related lateralization of event-related (de)synchronization (ERD/ERS): motor-imagery duration effects. Clinical Neurouphysiology, 122, 567–77. [DOI] [PubMed] [Google Scholar]
- Nam, C.S., Nijholt, A., Lotte, F. editors. (2018). Brain–Computer Interfaces Handbook: Technological and Theoretical Advances. CRC Press, Boca Raton. [Google Scholar]
- Nisbett R.E., Miyamoto Y. (2005). The influence of culture: holistic versus analytic perception. Trends in Cognitive Sciences, 9(10), 467–73. [DOI] [PubMed] [Google Scholar]
- Oldfield R.C.C. (1971). The assessment and analysis of handedness: the Edinburgh inventory. Neuropsychologia, 9(1), 97–113. [DOI] [PubMed] [Google Scholar]
- Panksepp J., Watt D. (2011). What is basic about basic emotions? Lasting lessons from affective neuroscience. Emotion Review, 3(4), 387–96. [Google Scholar]
- Paus T. (2001). Primate anterior cingulate cortex: where motor control, drive and cognition interface. Nature Reviews Neuroscience, 2(6), 417–24. [DOI] [PubMed] [Google Scholar]
- Peelen M.V., Atkinson A.P., Vuilleumier P. (2010). Supramodal representations of perceived emotions in the human brain. Journal of Neuroscience, 30(30), 10127–34. [DOI] [PMC free article] [PubMed] [Google Scholar]
- Ponnusamy R., Poulos A.M., Fanselow M.S. (2007). Amygdala-dependent and amygdala-independent pathways for contextual fear conditioning. Neuroscience, 147(4), 919–27. [DOI] [PMC free article] [PubMed] [Google Scholar]
- Protopapa F., Siettos C.I., Evdokimidis I., Smyrnis N. (2014). Granger causality analysis reveals distinct spatio-temporal connectivity patterns in motor and perceptual visuo-spatial working memory. Frontiers in Computational Neuroscience, 8, 146. doi: 10.3389/fncom.2014.00146. [DOI] [PMC free article] [PubMed] [Google Scholar]
- Roche K.J., LeBlanc J.J., Levin A.R., O’Leary H.M., Baczewski L.M., Nelson C.A. (2019). Electroencephalographic spectral power as a marker of cortical function and disease severity in girls with Rett syndrome. Journal of Neurodevelopmental Disorders, 11(1), 1–14. [DOI] [PMC free article] [PubMed] [Google Scholar]
- Roebroeck A., Formisano E., Goebel R. (2011). The identification of interacting networks in the brain using fMRI: model selection, causality and deconvolution. NeuroImage, 58(2), 296–302. [DOI] [PubMed] [Google Scholar]
- Roseman I.J., Smith C.A. (2001). Appraisal theory: overview, assumptions, varieties, controversies. In: Scherer, K.R., Schorr, A., Johnstone, T., editors. Appraisal Processes in Emotion: Theory, Methods, Research, New York: Oxford University Press, 3–19. [Google Scholar]
- Rychlowska M., Miyamoto Y., Matsumoto D., et al. (2015). Heterogeneity of long-history migration explains cultural differences in reports of emotional expressivity and the functions of smiles. Proceedings of the National Academy of Sciences, 112(19), E2429–36. [DOI] [PMC free article] [PubMed] [Google Scholar]
- Saarimäki H., Gotsopoulos A., Jääskeläinen I.P., et al. (2016). Discrete neural signatures of basic emotions. Cerebral Cortex, 26(6), 2563–73. [DOI] [PubMed] [Google Scholar]
- Schalk G., McFarland D.J., Hinterberger T., Birbaumer N., Wolpaw J.R. (2004). BCI2000: a general-purpose brain-computer interface (BCI) system. IEEE Transactions on Biomedical Engineering, 51(6), 1034–43. [DOI] [PubMed] [Google Scholar]
- Schurz M., Tholen M.G., Perner J., Mars R.B., Sallet J. (2017). Specifying the brain anatomy underlying temporo-parietal junction activations for theory of mind: a review using probabilistic atlases from different imaging modalities. Human Brain Mapping, 38(9), 4788–805. [DOI] [PMC free article] [PubMed] [Google Scholar]
- Sharbrough F., Chatrian G., Lesser R., Luders H., Nuwer M., Picton T.(1991). American electroencephalographic society guidelines for standard electrode position nomenclature. Journal of Clinical Neurophysiology, 8, 200–2. doi: 10.1097/00004691-199104000-00007. [DOI] [PubMed] [Google Scholar]
- Silani G., Lamm C., Ruff C.C., Singer T. (2013). right supramarginal gyrus is crucial to overcome emotional egocentricity bias in social judgments. The Journal of Neuroscience, 33(39), 15466–76. [DOI] [PMC free article] [PubMed] [Google Scholar]
- The MathWorks . (2004). MATLAB The Language of Technical Computing. Natick, MA: The MathWorks, Inc. doi: 10.1007/s10766-008-0082-5. [DOI] [Google Scholar]
- Toga A.W., Thompson P.M. (2003). Mapping brain asymmetry. Nature Reviews Neuroscience, 4(1), 37–48. [DOI] [PubMed] [Google Scholar]
- Tracy J.L., Randles D. (2011). Four models of basic emotions: a review of Ekman and Cordaro, Izard, Levenson, and Panksepp and Watt. Emotion Review, 3(4), 397–405. [Google Scholar]
- van Kemenade B.M., Arikan B.E., Kircher T., Straube B. (2017). The angular gyrus is a supramodal comparator area in action–outcome monitoring. Brain Structure & Function, 222(8), 3691–703. [DOI] [PubMed] [Google Scholar]
- Vieira J.B., Pierzchajlo S.R., Mitchell D.G.V. (2020). Neural correlates of social and non-social personal space intrusions: role of defensive and peripersonal space systems in interpersonal distance regulation. Social Neuroscience, 15(1), 36–51. [DOI] [PubMed] [Google Scholar]
- Vogt B.A., Pandya D.N., Rosene D.L. (1987). Cingulate cortex of the rhesus monkey: I. Cytoarchitecture and thalamic afferents. The Journal of Comparative Neurology, 262(2), 256–70. [DOI] [PubMed] [Google Scholar]
- Vytal K., Hamann S. (2010). neuroimaging support for discrete neural correlates of basic emotions: a voxel-based meta-analysis. Journal of Cognitive Neuroscience, 22(12), 2864–85. [DOI] [PubMed] [Google Scholar]
- Wilson-Mendenhall C.D., Barrett L.F., Simmons W.K., Barsalou L.W. (2011). Grounding emotion in situated conceptualization. Neuropsychologia, 49(5), 1105–27. [DOI] [PMC free article] [PubMed] [Google Scholar]
- Winston J., O’Doherty J., Dolan R. (2003). Common and distinct neural responses during direct and incidental processing of multiple facial emotions. NeuroImage, 20(1), 84–97. [DOI] [PubMed] [Google Scholar]
- Wormwood J.B., Siegel E.H., Kopec J., Quigley K.S., Barrett L.F.(2019). You are what I feel: a test of the affective realism hypothesis. Emotion, 19(5), 788. doi: 10.1037/emo0000484. [DOI] [PubMed] [Google Scholar]
Associated Data
This section collects any data citations, data availability statements, or supplementary materials included in this article.