Abstract
Background
Alzheimer’s disease (AD) is closely related to immunity and competitive endogenous RNAs (ceRNAs) are believed to play a key role in the development of AD. Therefore, understanding the ceRNA network related to AD immunity will contribute to the identification of novel immunotherapeutic targets and provide new insights into AD from an immunological perspective.
Methods
Weighted gene coexpression network analysis (WGCNA) and Enrichr enrichment analysis were performed to identify the immune-related gene coexpression modules through microarray datasets from the Gene Expression Omnibus (GEO) database. The differentially expressed long non-coding RNAs (lncRNAs) and microRNAs (miRNAs) were identified from the microarray through differential analysis and mapped with related databases. Cytoscape was used to construct a lncRNA-miRNA-mRNA network. Subsequently, ImmuCellAI immune infiltration analysis was performed and a ceRNA sub-network of related core immune cells was constructed. Finally, the potential pathways related to these core factors were determined through gene set enrichment analysis (GSEA).
Results
Through WGCNA analysis and enrichment analysis, the blue module and the green module were identified as key modules related to AD immunity. Naïve CD8 cells were shown to be the key immune cells related to AD. Correlation analysis and receiver operating characteristic (ROC) curves verified lncRNA Long Intergenic Non-Protein Coding RNA 472 (LINC00472), lncRNA HLA Complex Group 18 (HCG18), RUNX Family Transcription Factor 3 (RUNX3), Tensionin 1 (TNS1), Linker For Activation Of T Cells Family Member 2 (LAT2), and Solute Carrier Family 38 Member 2 (SLC38A2) as possible key targets related to AD immunity.
Conclusions
The lncRNA LINC00472, lncRNA HCG18, RUNX3, TNS1, LAT2, and SLC38A2 identified in this study may be key targets related to AD immunity. These insights will provide future directions for the further AD research.
Keywords: Competitive endogenous RNAs (ceRNA), Alzheimer’s disease (AD), immune infiltration, Pearson correlation analysis, ROC curve
Introduction
Alzheimer’s disease (AD) is a neurodegenerative condition characterized by progressive deterioration of cognition and memory, and is the main form of dementia (1,2). In 2017, approximately 50 million people worldwide were affected by AD, and this number will continue to increase in the next 30 years (3). However, the mechanisms of AD pathogenesis have not been completely elucidated (4). The characteristic pathology of AD includes the formation of extracellular senile plaques formed by neurogenic fiber tangles, β-amyloid deposition formed by tau protein hyperphosphorylation, and neuronal loss due to glial cell proliferation (5,6). Currently, donepezil, galantamine, rivastigmine (7), and memantine (8) can be used to temporarily alleviate symptoms. Although much effort has been made to study the pathology and potential pathogenesis of AD, there is still no comprehensive treatment intervention for AD. Therefore, there is an urgent need to identify novel molecular targets that can improve the diagnosis and therapy of AD patients.
Recently, the correlation between immune system disorders and AD has received widespread attention. Although the involvement of blood derivatized immune cells in the central nervous system (CNS) is limited in AD and associated dementia, systemic immune responses are known to affect the brain. For example, an immune response to systemic infections can lead to delirium (9). Microglia is a key component of the CNS innate immunity and shows obvious phenotypes and plays different roles at various stages of the disease. Innate immune cells derived from peripheral blood, such as neutrophils, natural killer (NK) cells, monocytes, and macrophages, can also be recruited into the CNS to participate in the progression of AD (10). Therefore, this study aimed to identify new therapeutic targets in AD from an immunological perspective.
Advances in high-throughput technology offer excellent possibilities for identifying AD-related and immune-related biomarkers. Non-coding RNAs (ncRNAs) account for nearly 98% of the human genome. The expression of certain ncRNAs is significantly altered in the blood and CNS of patients with neurodegenerative disorders, such as AD (11). Long ncRNAs (lncRNAs) are ncRNAs with a length of more than 200 nucleotides. Although lncRNAs do not participate in protein coding, growing evidence suggests that they play a multi-level regulatory role in gene expression, such as via epigenetics, transcription, and translation (12). Salmena et al. (13) proposed the competitive endogenous RNA (ceRNA) hypothesis, where lncRNAs and mRNAs can competitively bind to microRNAs (miRNAs) by sharing one or more miRNA response element, thus achieving competitive binding. Increasingly, researchers have started to clarify the significance of ceRNAs in AD, and a study showed that knockdown of the lncRNA SOX21-AS1 reduced Aβ 25-35 expression by promoting the miR-132/PI3K/AKT pathway to inhibit dependent neuronal cell damage. Therefore, this study aimed to identify novel lncRNA targets for the treatment of AD.
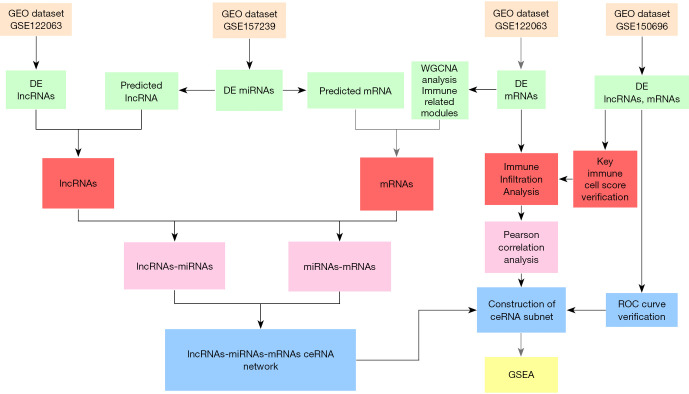
The detailed mechanisms of immune regulation in AD remains unclear and the immunomodulatory effect of ceRNA in the development of AD has not been fully elucidated. To the best of our knowledge, this study is the first to report the molecular mechanisms of ceRNA immunoregulation during the progression of AD. This study not only identified the ceRNA network related to AD immunity, but also identified the key immune cells related to AD, and we also conducted correlation analysis on immune cells and ceRNA. These insights contribute to the identification and development of potential AD biomarkers and therapeutic targets. The research process is shown in Figure 1.
Figure 1.
A schematic diagram showing the workflow of the integrative bioinformatics analyses. GEO, Gene Expression Omnibus; DE, differential expression; ROC, receiver operating characteristic; GSEA, gene set enrichment analysis.
We present the following article in accordance with the STREGA reporting checklist (available at https://atm.amegroups.com/article/view/10.21037/atm-21-6762/rc).
Methods
Microarray data
Microarray data was obtained from the Gene Expression Omnibus (GEO) database (http://www.ncbi.nlm.nih.gov/geo). The GSE157239 miRNA dataset (public on Oct 14, 2020), including 8 AD samples and 8 normal samples, was analyzed. The lncRNA and mRNA datasets were obtained from GSE122063 (14) and GSE150696 (15). The GSE122063 dataset was used as the training set (public on Apr 23, 2019) and contains 56 AD samples and 44 normal samples. The GSE150696 data set was used as the validation set (public on May 24, 2021) and contains 9 AD samples and 9 normal samples. The study was conducted in accordance with the Declaration of Helsinki (as revised in 2013).
Data preprocessing and differential analysis
The GPL21572, GPL16699, and GPL17585 platform files were downloaded from the GEO database and annotated with probe ID based on the annotation information in the platform file. The “GEO2R” online analysis tool was used to analyze the differences in these 3 datasets, and batch processing was performed on the results of the differential analysis to identify the differentially expressed miRNAs (DEmiRNAs), mRNAs (DEmRNAs), and lncRNAs (DElncRNAs).
Weighted gene co-expression network analysis (WGCNA)
The DEmRNAs expression matrix of the AD group and the control group was imported from in the dataset GSE122063 into image GP (http://www.ehbio.com/Cloud_Platform/front/#/) for WGCNA calculation. This allows us to access the co-expressed gene modules associated with AD. Pearson correlation analysis was performed to compute the linear correlation between each genome. This matrix was converted to a symbolic adjacency matrix using a power function to construct the standard network, which was then converted to a topological overlap matrix (TOM). The highly expressed genes were grouped by hierarchical clustering. In the next step, a dynamic tree cutting algorithm was used to cut the branches of the clustering dendrogram and generate the modules. The gene expression profile of each module was summarized by the first principal component, called the module Eigengene (ME). ME associations were used for evaluating the characteristics of the modules. Module meaning (MS) and gene meaning (GS) were used to compute the expression patterns of the modules related to disease traits. The minimum number of genes and the threshold which can achieve high reliability of results was 30 and 0.25, respectively. In addition, each module was represented by a discrete color. Finally, similar modules (module EigEngenes) were merged into a single module and used for further investigation (16).
Identification of immune related modules
Gene Ontology (GO) enrichment analysis is an important bioinformatics tool for annotating genes and gene products. It aims to standardize the representation of gene and gene product properties across all species (17). In this study, Enrichr was used to perform the GO biological processes enrichment analysis for each module in the WGCNA. The meaningful items were filter based on P values, and ranked based on the combined score.
Construction of the ceRNA network
According to the theory that lncRNA acts as a miRNA sponge to influence miRNA and regulate mRNA expression (14), a ceRNA network was constructed. During the construction of the network, the expression of lncRNAs should be negatively correlated with the expression of miRNAs and positively correlated with mRNA expression (15). The mRNAs related to the DEmiRNAs in GSE120584 dataset were identified through the miRTarbase and starBase database. To ensure the accuracy of the results, mRNAs that were listed in two databases were selected. These mRNAs were then mapped to immune-related modules. The DEmiRNAs-related datasets were search using the starbase database and the results were mapped with the DElncRNAs in the GSE122063 dataset. Cytoscape 3.7.2 was used to visualize the ceRNA network constructed.
Immune infiltration analysis and verification
ImmuCellAI was used to predict the patient's response to immune checkpoint blockade therapy. This tool is based on gene set characteristics and is used to accurately assess the abundance and difference in the penetration of 24 immune cells from gene microarrays (18). This tool was used to analyze the immune infiltration of the DEmRNAs in the GSE122063 and GSE150696 datasets to identify key immune cells associated with AD. The former is the training set and the latter is the validation set. The receiver operating characteristic (ROC) curves were used for verification, and an area under the curve (AUC) value greater than 0.8 was set as the threshold (19).
Construction of the ceRNA subnets related to key immune cells and verification
Pearson correlation analysis was used to calculate the correlation between the cell infiltration value of key immune cells and the expression value of mRNAs and lncRNAs in the ceRNA. The ceRNA sub-network was constructed based on the correlation coefficient |R| >0.5 and P value <0.05. The correlation coefficient between the expression values of lncRNAs and mRNAs in the sub-network was calculated and R>0.5 was set as the threshold. Finally, the ROC curve of the network was verified through the GSE150696 dataset to finalize the network.
Analysis of the key target regulatory pathways
The lncRNAs in the sub-network were groups according to the median expression value and gene setting enrichment analysis (GSEA) was used to analyze the Kyoto Encyclopedia of Genes and Genomes (KEGG) pathways of the microarray dataset. The key pathways were identified based on the standardized enrichment score (ES) and the adjusted P value.
Statistical analysis
This study used GEO2R online analysis, WGCNA algorithm, enrichment analysis algorithm, Pearson correlation analysis, immune infiltration algorithm, ROC curve algorithm, and GSEA algorithm.
Results
Differential expression analysis
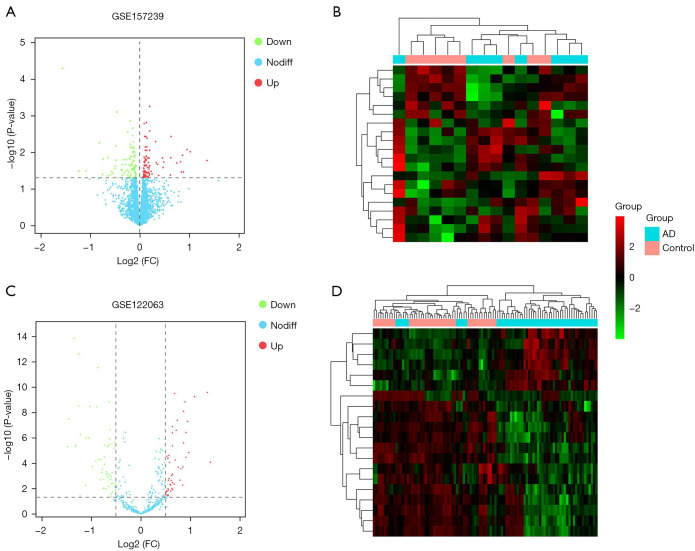
The GEO2R tool was used to analyze the differences between the microarray datasets GSE122063, GSE157239, and GSE150696. A total of 188 AD-related DEmiRNAs were identified, including 95 that were upregulated and 93 that were downregulated (Figure 2A,2B). In addition, 105 DElncRNAs were identified from the GSE122063 dataset (Figure 2C,2D). Furthermore, 9,528 DEmRNAs were identified from the GSE122063 dataset.
Figure 2.
Volcano maps and cluster maps. (A) A volcano map showing the differentially expressed microRNAs (miRNAs) in AD. Red represents the upregulated genes, green represents the downregulated genes, and blue represents genes that were not significantly differentially expressed. (B) A cluster map of the differentially expressed miRNAs. (C) A volcano map of the differentially expressed long non-coding RNAs (lncRNAs) in AD. Red represents the upregulated genes, green represents the downregulated genes, and blue represents genes that were not significantly differentially expressed. (D) A cluster map of the differentially expressed lncRNAs. AD, Alzheimer’s disease.
WGCNA and immune module recognition
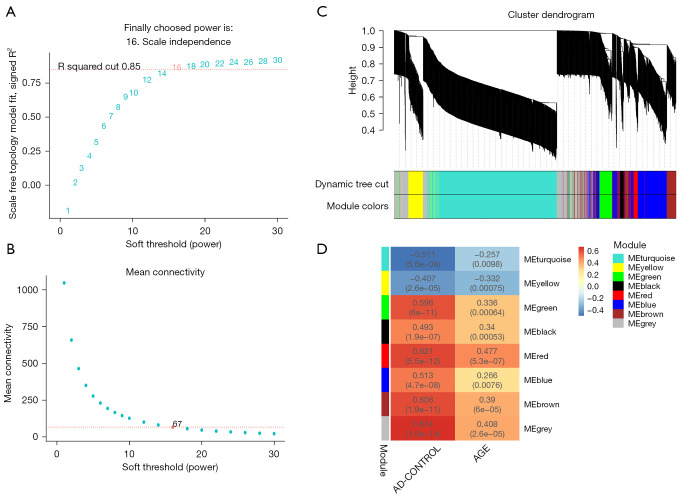
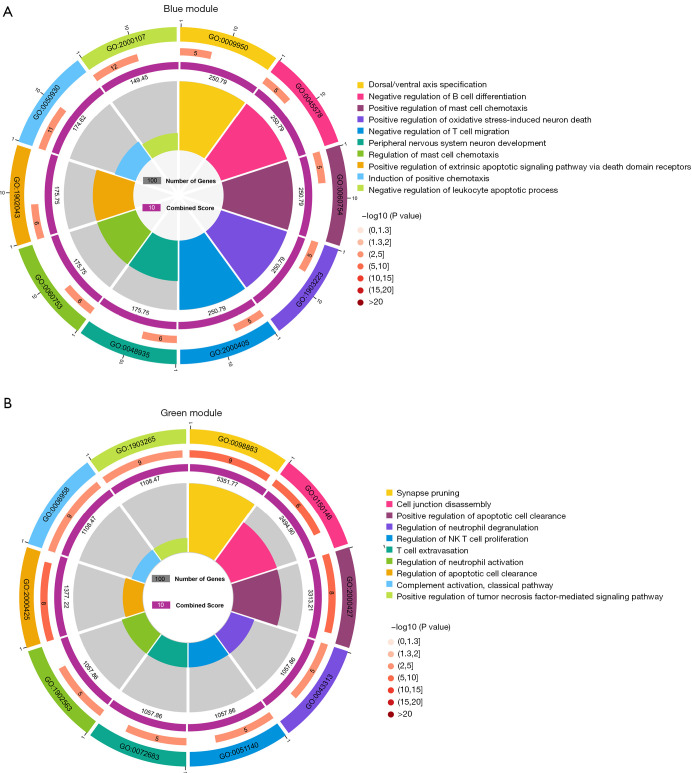
The WGCNA algorithm was used to segment the AD samples and the control samples. Based on the scale-free topology with R2=0.85, the Pearson correlation matrix of the gene was transformed into a strengthened adjacency matrix according to the power of r=16 (Figure 3A,3B). Use the topological overlap matrix (TOM)-based dissimilarity measurement method to cluster all selected genes, the tree was divided into seven modules with different colors according to the dynamic tree cutting algorithm (Figure 3C). The relationship between each module and its respective clinical features was computed and graphed (Figure 3D). The Enrichr tool was used to perform enrichment analysis on each module, and the top ten GO biological processes were selected based on the combined scores for ranking. The results showed that the processes involved in the blue module included negative regulation of B cell differentiation (GO-0045578); negative regulation of T cell migration (GO-2000405); positive regulation of oxidative stress-induced neuron death (GO-1903223); regulation of mast cell chemotaxis (GO-0060753); and negative regulation of leukocyte apoptotic process (GO-2000107) (Figure 4A). In addition, processes in the green module included positive regulation of tumor necrosis factor-mediated signaling pathway (GO-1903265); regulation of neutrophil activation (GO-1902563); regulation of neutrophil degranulation (GO-0043313); regulation of NK T cell proliferation (GO-0051140); and T cell extravasation (GO-0072683) (Figure 4B). Therefore, the blue module and the green module are immune-related modules.
Figure 3.
Weighted co-expression network and gene module analysis. (A,B) Soft threshold selection process. (C) A clustering dendrogram. Each color represents a specific co-expression module. In the colored rows below the tree diagram, the two colors represent the original module and the merged module, respectively. (D) A heat map showing the correlation between AD and the characteristic genes of the module. AD, Alzheimer’s disease.
Figure 4.
Module enrichment analysis. (A) GO enrichment analysis results of the blue module. (B) GO enrichment analysis results of the green module. GO, Gene Ontology.
Visualization of the ceRNA network
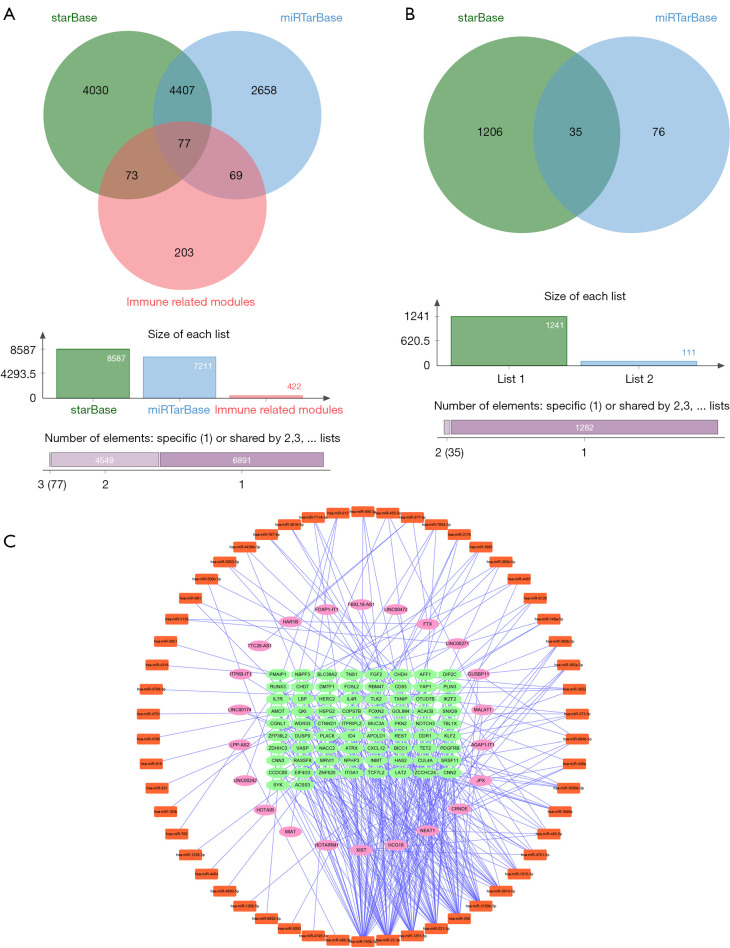
The Starbase and miRTarbase databases were used to predict the mRNAs regulated by the DEmiRNAs. A total of 8,587 mRNAs were identified in the Starbase database and 7,211 were identified in the miRTarbase database. The two databases were screened for intersecting mRNAs that occurred in the immune-related modules and a total of 77 mRNAs were identified (Figure 5A). The Starbase database was used to predict the DEmiRNA-related lncRNAs, and a total of 1,241 lncRNAs were found. These were intersected with the DELncRNA to obtain 35 lncRNAs (Figure 5B). After correlation analyses (15), Cytoscape 3.7.2 was used to construct a ceRNA network, consisting of 150 nodes and 316 edges, including 22 lncRNAs and 74 mRNAs (Figure 5C).
Figure 5.
Construction of the ceRNA network. (A) The intersection of the mRNAs of the immune-related module and the mRNAs predicted by the database. (B) The intersection of the differentially expressed lncRNAs and the lncRNAs predicted by the database. (C) The ceRNA network. The pink oval represents lncRNAs, the orange rectangle denotes miRNAs, and the green ellipse represents mRNAs. ceRNA, competitive endogenous RNA.
Immune cell abundance
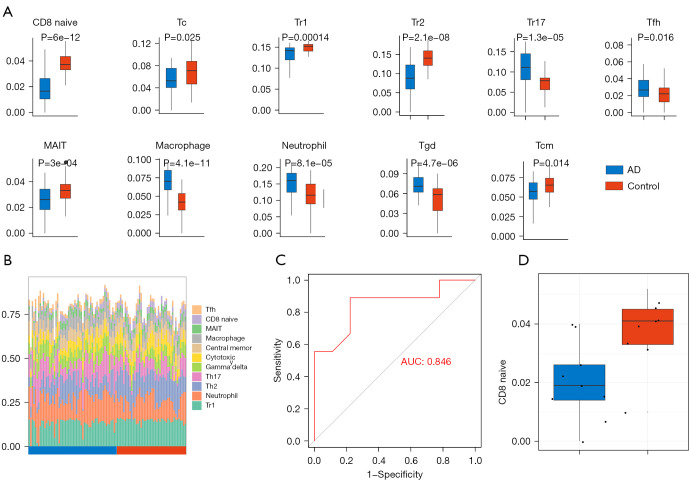
The ImmuCellAI online tool was used to evaluate the abundance of 24 immune cells based on the microarray data. In the GSE122063 dataset, there were significant differences between the AD samples and the control samples in the abundance of immune cells including naïve CD8 cells, cytotoxic T cells, T regulatory type 1 cells (Tr1), T helper 2 cells (Th2), T helper 17 cells (Th17), T follicular helper cells (Tfh), central memory T cells, mucosal-associated invariant T (MAIT) cells, macrophages, neutrophisl, and gamma delta T cells (Figure 6A,6B). The difference in the abundance of naïve CD8 cells was the most significant. Furthermore, the immune score of the AD group was significantly lower than that of the control group. Subsequently, ImmuCellAI was used to analyze the immune infiltration of the GSE150696 dataset to obtain the relevant immune scores. The expression of naïve CD8 cells was verified based on this immune score and the ROC curve with an AUC of 0.846 (Figure 6C). In the GSE150696 dataset, the immune infiltration score of the AD group was also lower than that of the control group (Figure 6D).
Figure 6.
Immune infiltration analysis. (A) The immune cell types that are differentially expressed in AD samples and control samples are shown. (B) The abundance of the differentially expressed immune cells in the samples. (C) The receiver operating characteristic (ROC) curve was used to verify the expression of naïve CD8 cells in the GSE150696 dataset. (D) The Immune infiltration score of CD8 cells in AD group and control group. AD, Alzheimer’s disease.
Construction of the naïve CD8 cell-related ceRNA sub-network
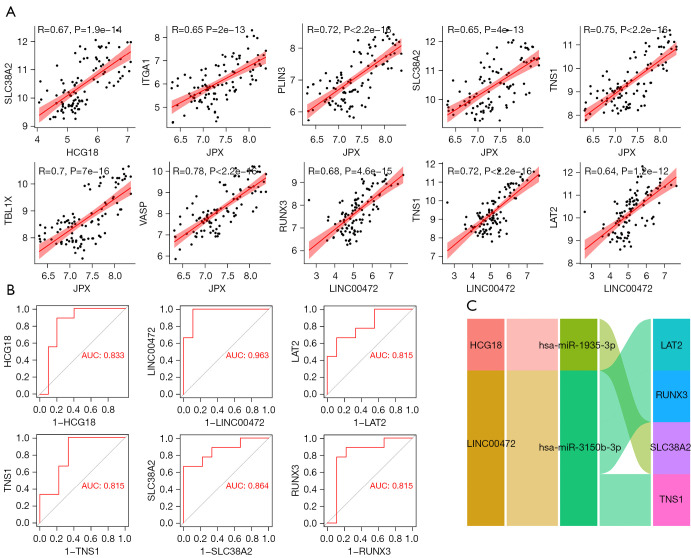
Using the GSE122063 dataset, the correlation between the lncRNAs and mRNAs identified in the ceRNA network and the expression of naïve CD8 cells was examined in total online: https://cdn.amegroups.cn/static/public/10.21037atm-21-6762-1.xlsx. Using the GSE122063 dataset, the correlation between the lncRNAs and mRNAs identified in the ceRNA network and the expression of naïve CD8 cells was examined (Figure 7A). Furthermore, the correlation between the lncRNAs and mRNAs of interest were investigated. ROC curves were used to verify the related targets. The miRNAs in this ceRNA sub-network were also verified through the GSE150696 dataset (Figure 7B). Finally, it was determined that the lncRNA Long Intergenic Non-Protein Coding RNA 472 (LINC00472), lncRNA HLA Complex Group 18 (HCG18), RUNX Family Transcription Factor 3 (RUNX3), Tensionin 1 (TNS1), Linker For Activation Of T Cells Family Member 2 (LAT2), and Solute Carrier Family 38 Member 2 (SLC38A2) may be key targets related to AD (Figure 7C).
Figure 7.
Construction of the naïve CD8 cell-related ceRNA sub-network. (A) Correlation analysis of lncRNA and mRNA in the ceRNA sub-network of naïve CD8 cells. (B) The ROC curve was used to verify the potential targets in the GSE150696 dataset. (C) The naïve CD8 cell-related ceRNA subnetwork. Flow indicates interaction. ROC, receiver operating characteristic.
Results of the gene set enrichment analysis (GSEA)
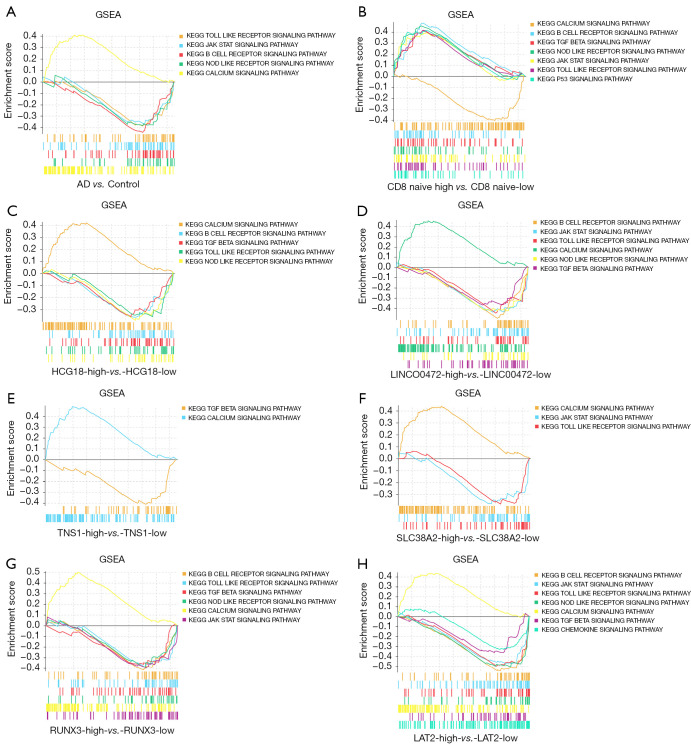
GSEA was applied to the GSE122063 dataset to clarify the regulatory pathways of the core prognostic factors. Median grouping of lncRNA LINC00472 and lncRNA HCG18, RUNX3, TNS1, LAT2, SLC38A2, and naïve CD8 immune infiltration score was performed. In addition, analyses were also grouped according to AD samples and control samples. The results suggested that the ceRNA sub-network may regulate the progression of AD by regulating the calcium signaling pathway; the NOD-like receptor signaling pathway; the toll-like receptor (TLR) signaling pathway; the B cell receptor signaling pathway; and the JAK-STAT signaling pathway (Figure 8).
Figure 8.
The results of the GSEA enrichment analysis. (A) AD samples compared to control samples. (B) High expression of naïve CD8 cells compared to low expression of naïve CD8 cells. (C) High expression of HCG18 compared to low expression of HCG18. (D) High expression of LINC00472 compared to low expression of LINC00472. (E) High expression of TNS1 compared to low expression of TNS1. (F) High expression of SLC38A2 compared to low expression of SLC38A2. (G) High expression of RUNX3 compared to low expression of RUNX3. (H) High expression of LAT2 compared to low expression of LAT2. AD, Alzheimer’s disease; GSEA, gene set enrichment analysis; HCG18, HLA complex group 18; LINC00472, long intergenic non-protein coding RNA 472; TNS1, TNS1, tensionin 1; SLC38A2, solute carrier family 38 member 2; RUNX3, RUNX family transcription factor 3; LAT2, linker for activation of T cells family member 2.
Discussion
The immune system plays a significant role in the pathogenesis of AD (20). In this study, the immune infiltration analysis indicated that naïve CD8 cells may be the core immune cell associated with AD. It is well known that people over 70 years old are a high-risk group for AD. The aging process is accompanied by immune senescence (21) and the loss of naïve CD8 T cells is more pronounced with age. However, the exact mechanisms by which naïve CD8 cells contribute to AD is still poorly understood due to changes in the T cell compartment caused by aging (22). In this study, we identified a ceRNA immunomodulatory network related to AD progression.
To the best of our knowledge, this research is the first to identify the AD-related immune cells and construct a ceRNA network related to immune cells. AD immune-related gene co-expression modules were identified through WGCNA and a relevant ceRNA network was constructed. The naïve CD8 cell-related ceRNA sub-network was determined based on the immune infiltration results and Pearson correlation analysis. The GEO dataset for this network was verified and finally, lncRNA LINC00472, lncRNA HCG18, RUNX3, TNS1, LAT2, and SLC38A2 were identified as possible key targets related to AD immunity. In addition, GSEA analysis revealed that the network may regulate the progression of AD through the calcium signaling pathway, the NOD-like receptor signaling pathway, the TLR signaling pathway, and the B cell receptor signaling pathway.
Pancreas have important research value in neurodegenerative diseases (23). β-amyloid deposits form extracellular plaques, which are attributed to amyloidosis and inflammation. Relevant studies have shown that β-amyloid protein can bind to immune cells, stimulate cytokines, and produce certain toxicity. These results further indicate that there is an intertwined relationship between AD and β-amyloid immune response (24). Increasingly, studies have shown that AD is not just a neurodegenerative disease but is also a complex multifactorial disease with a large number of neurovascular factors. Atherosclerosis can lead to neurovascular dysfunction, which is characterized by inflammation and excessive connections (25). Abnormal proliferation and migration of vascular smooth muscle cells (VSMC) after vascular injury is important for the development of atherosclerosis and intimal hyperplasia (26,27). One study showed that overexpression of lncRNA LINC00472 induced VSMC migration and proliferation by regulating miR-149-3P (28), which may affect the progression of AD. Further research regarding the role of lncRNA LINC00472 in AD is warranted. The lncRNA HCG18 in the ceRNA sub-network is also an important factor in the regulation of blood vessels in the body. It has been reported that lncRNA HCG18 inhibited the proliferation of VSMC and induced apoptosis (29). The destruction of the vascular endothelial cell barrier can lead to many diseases including ischemia (30,31), and decrease cerebral blood flow and the activation of neurohormones may cause neurovascular unit dysfunction and lead to neuronal energy crisis (32). LncRNA HCG18 has also been demonstrated to promote PM2.5-mediated vascular endothelial barrier dysfunction through sponge miR-21-5p (33). These studies all support the notion that the lncRNAs in the naïve CD8-related ceRNA sub-network identified in this study may affect the progress of AD by regulating the mechanism and function of blood vessels. The mechanisms of action of these lncRNAs in AD require further investigation.
This report identified RUNX3, TNS1, LAT2, and SLC38A2 through the ceRNA sub-network as possible key targets for the immune regulation of AD. Runt-related transcription factor 3 (Runx3) plays a crucial role in cell development by participating in a range of important physiological and pathological processes in organisms such as cell growth, proliferation, migration, apoptosis, and angiogenesis (34). Studies have shown that Runx3 is highly expressed in the thymic medulla and cortex, and plays a role in the development of CD8 T cells during thymus production (35). Chronic cerebral ischemia is the main risk factor for neurodegenerative AD and upregulation of Runx3 has been shown to inhibit hippocampal neuronal apoptosis induced by chronic cerebral ischemia (36). In addition, Runx3 can regulate hypoxia-induced endothelial-mesenchymal transition of human cardiac microvascular endothelial cells (CMEC), suggesting a role in the regulation of vascular function (37). Tensionin 1 (TNS1) is a member of the tensin family and acts as a scaffold for adhesion-related signal transduction by binding to the actin cytoskeleton and β1 integrin (38). TNS1 is a key component of specialized cell adhesion that binds to extracellular fibronectin fibrils (39). Genetic research and biochemical analysis of brain tissue, as well as the cerebrospinal fluid and serum of AD patients showed that the level and function of synaptic cell adhesion molecules in AD are affected (40). In esophageal squamous cell carcinoma, high expression of TNS1 in fibroblasts is associated with immune rejection (41), and the immune infiltration of TNS1 in AD warrants further investigation. Amino acid homeostasis interference plays a key role in the pathogenesis of AD in APP/PS1 mice (42). The outflow of glutamine through LAT2 (linker for activation of T cells family member 2) may drive the reuptake of the essential amino acid substrate of this antiporter in cerebrospinal fluid, thereby participating in maintaining the amino acid gradient between plasma and cerebrospinal fluid (43). In addition, during the production of chemokines, the activity of LAT2 increases, which changes the recruitment of immune cells at the site of inflammation (44). SNAT2 (SLC38A2) is a member of the amino acid transporter family, and it is also the most widely expressed and regulated (45). SLC38A2 acts as a sodium-dependent amino acid transporter, mediating the outflow of neutral α-amino acids across the blood-brain barrier and their uptake to neurons (46).
The GSEA results indicated that this ceRNA sub-network may regulate the progression of AD through the certain signaling pathways. Dysregulation of Ca2+ is universal in all AD pathologies, and increasing evidence indicates that age-related neuronal Ca2+ homeostasis may play a proximal role in the pathogenesis of AD. Dysregulation of Ca2+ can induce synaptic defects and promote amyloid beta (Aβ) plaques and the accumulation of neurofibrillary tangles (47). Furthermore, when the Ca2+ levels of neurons near the amyloid deposit are higher than the normal resting level, this can promote negative plasticity (48,49). The accumulation of Aβ plaques induces the innate immune response to activate the NOD-like receptor (NLR) family, such as the NLRP3 inflammasome, and has become the focus of much research (50). Under the stimulation of Ab deposition, NLRP3 assembles and activates in the microglia of the AD brain, leading to caspase-1 activation and the downstream secretion of interleukin (IL)-1β, and subsequent inflammatory events. Therefore, the NLRP3 inflammasome may be a suitable target for reducing neuroinflammation and alleviating the pathological process in AD (51). The aggregated Aβ further promotes the initiation of microglial inflammasomes through TLR/MyD88 signals. In addition, the secreted IL-1β can induce the initiation of microglial inflammasomes through IL-1R/MyD88 signaling (52). Therefore, this vicious cycle of activating NLRP3 inflammasomes through TLR/IL-1R/MyD88 signaling may lead to chronic/persistent inflammation and neurodegeneration in AD (53). In recent years, the role of B cells in neurological diseases has greatly expanded our view of neuroinflammatory mechanisms (54). It is becoming increasingly obvious that AD patients show a sustained immune response, which may be due to the destruction of the blood brain barrier (BBB) (55,56). This immunological component of AD has been further supported by recent experiments in AD mice showing the complete depletion of B cells. Furthermore, the genetic loss of B cells significantly improved disease symptoms (57). Considering the key role of the JAK-STAT signal in the regulation of the inflammatory response, it is not surprising that the JAK-STAT signal has been associated with inflammatory diseases and used as a therapeutic target (58). However, there are few studies regarding the JAK-STAT pathway and AD. In rodent models, very high concentrations of Aβ increased tyrosine phosphorylation and transcriptional activity in a Tyk2-dependent manner, and increased the tyrosine phosphorylation of STAT3 in the AD brain (59). Meanwhile, inhibition of JAK-STAT3 signaling inhibited the activation of astrocytes and microglia in animal models of degeneration (60). Regarding the focus of the paper, this study identified key immune cells that are potentially related to AD, and built a ceRNA network around this immune cell. This current report is the first to use WGCNA to construct a ceRNA network consisting of the key immune cells in AD. However, there were certain limitations to this study. While this research was verified by multiple datasets, future in vitro and in vivo experiments should be conducted to confirm these findings. Moreover, the precise mechanisms involved should be further investigated.
Conclusions
This report used WGCNA and Pearson correlation analysis to study the relationship between immune infiltration and ceRNA in AD. The lncRNA LINC00472, lncRNA HCG18, RUNX3, TNS1, LAT2, and SLC38A2 were identified as possible key therapeutic targets for the treatment of AD. These results provide crucial insights into the immune regulation mechanism in AD from a ceRNA perspective, and suggests potential therapeutic candidates and prognostic targets for the management of patients with AD.
Supplementary
The article’s supplementary files as
Acknowledgments
Funding: None.
Ethical Statement: The authors are accountable for all aspects of the work in ensuring that questions related to the accuracy or integrity of any part of the work are appropriately investigated and resolved. The study was conducted in accordance with the Declaration of Helsinki (as revised in 2013).
Footnotes
Reporting Checklist: The authors have completed the STREGA reporting checklist. Available at https://atm.amegroups.com/article/view/10.21037/atm-21-6762/rc
Conflicts of Interest: All authors have completed the ICMJE uniform disclosure form (available at https://atm.amegroups.com/article/view/10.21037/atm-21-6762/coif). The authors have no conflicts of interest to declare.
References
- 1.Scheltens P, Blennow K, Breteler MM, et al. Alzheimer's disease. Lancet 2016;388:505-17. 10.1016/S0140-6736(15)01124-1 [DOI] [PubMed] [Google Scholar]
- 2.Zhang H, Wei W, Zhao M, et al. Interaction between Aβ and Tau in the Pathogenesis of Alzheimer's Disease. Int J Biol Sci 2021;17:2181-92. 10.7150/ijbs.57078 [DOI] [PMC free article] [PubMed] [Google Scholar]
- 3.Pottiez G, Yang L, Stewart T, et al. Mass-Spectrometry-Based Method To Quantify in Parallel Tau and Amyloid β 1-42 in CSF for the Diagnosis of Alzheimer's Disease. J Proteome Res 2017;16:1228-38. 10.1021/acs.jproteome.6b00829 [DOI] [PMC free article] [PubMed] [Google Scholar]
- 4.Huaying C, Xing J, Luya J, et al. A Signature of Five Long Non-Coding RNAs for Predicting the Prognosis of Alzheimer's Disease Based on Competing Endogenous RNA Networks. Front Aging Neurosci 2021;12:598606. 10.3389/fnagi.2020.598606 [DOI] [PMC free article] [PubMed] [Google Scholar]
- 5.Wang JZ, Wang ZH, Tian Q. Tau hyperphosphorylation induces apoptotic escape and triggers neurodegeneration in Alzheimer's disease. Neurosci Bull 2014;30:359-66. 10.1007/s12264-013-1415-y [DOI] [PMC free article] [PubMed] [Google Scholar]
- 6.Sun Y, Lin J, Zhang L. The application of weighted gene co-expression network analysis in identifying key modules and hub genes associated with disease status in Alzheimer's disease. Ann Transl Med 2019;7:800. 10.21037/atm.2019.12.59 [DOI] [PMC free article] [PubMed] [Google Scholar]
- 7.Loveman E, Green C, Kirby J, et al. The clinical and cost-effectiveness of donepezil, rivastigmine, galantamine and memantine for Alzheimer's disease. Health Technol Assess 2006;10:iii-iv, ix-xi, 1-160. [DOI] [PubMed]
- 8.Kishi T, Matsunaga S, Oya K, et al. Memantine for Alzheimer's Disease: An Updated Systematic Review and Meta-analysis. J Alzheimers Dis 2017;60:401-25. 10.3233/JAD-170424 [DOI] [PubMed] [Google Scholar]
- 9.Lutshumba J, Nikolajczyk BS, Bachstetter AD. Dysregulation of Systemic Immunity in Aging and Dementia. Front Cell Neurosci 2021;15:652111. 10.3389/fncel.2021.652111 [DOI] [PMC free article] [PubMed] [Google Scholar]
- 10.Wu KM, Zhang YR, Huang YY, et al. The role of the immune system in Alzheimer's disease. Ageing Res Rev 2021;70:101409. 10.1016/j.arr.2021.101409 [DOI] [PubMed] [Google Scholar]
- 11.Lauretti E, Dabrowski K, Praticò D. The neurobiology of non-coding RNAs and Alzheimer's disease pathogenesis: Pathways, mechanisms and translational opportunities. Ageing Res Rev 2021;71:101425. 10.1016/j.arr.2021.101425 [DOI] [PubMed] [Google Scholar]
- 12.Wu Q, Liu Y, Xie Y, et al. Identification of Potential ceRNA Network and Patterns of Immune Cell Infiltration in Systemic Sclerosis-Associated Interstitial Lung Disease. Front Cell Dev Biol 2021;9:622021. 10.3389/fcell.2021.622021 [DOI] [PMC free article] [PubMed] [Google Scholar]
- 13.Salmena L, Poliseno L, Tay Y, et al. A ceRNA hypothesis: the Rosetta Stone of a hidden RNA language? Cell 2011;146:353-8. 10.1016/j.cell.2011.07.014 [DOI] [PMC free article] [PubMed] [Google Scholar]
- 14.Shi H, Sun F, Yang T, et al. Construction of a ceRNA immunoregulatory network related to the development of vascular dementia through a weighted gene coexpression network analysis. Ann Transl Med 2021;9:858. 10.21037/atm-21-1717 [DOI] [PMC free article] [PubMed] [Google Scholar]
- 15.Low CYB, Lee JH, Lim FTW, et al. Isoform-specific upregulation of FynT kinase expression is associated with tauopathy and glial activation in Alzheimer's disease and Lewy body dementias. Brain Pathol 2021;31:253-66. 10.1111/bpa.12917 [DOI] [PMC free article] [PubMed] [Google Scholar]
- 16.Burstein MD, Tsimelzon A, Poage GM, et al. Comprehensive genomic analysis identifies novel subtypes and targets of triple-negative breast cancer. Clin Cancer Res 2015;21:1688-98. 10.1158/1078-0432.CCR-14-0432 [DOI] [PMC free article] [PubMed] [Google Scholar]
- 17.Ashburner M, Ball CA, Blake JA, et al. Gene ontology: tool for the unification of biology. The Gene Ontology Consortium. Nat Genet 2000;25:25-9. 10.1038/75556 [DOI] [PMC free article] [PubMed] [Google Scholar]
- 18.Miao YR, Zhang Q, Lei Q, et al. ImmuCellAI: A Unique Method for Comprehensive T-Cell Subsets Abundance Prediction and its Application in Cancer Immunotherapy. Adv Sci (Weinh) 2020;7:1902880. 10.1002/advs.201902880 [DOI] [PMC free article] [PubMed] [Google Scholar]
- 19.Zou D, Li R, Huang X, et al. Identification of molecular correlations of RBM8A with autophagy in Alzheimer's disease. Aging (Albany NY) 2019;11:11673-85. 10.18632/aging.102571 [DOI] [PMC free article] [PubMed] [Google Scholar]
- 20.Fani L, Georgakis MK, Ikram MA, et al. Circulating biomarkers of immunity and inflammation, risk of Alzheimer's disease, and hippocampal volume: a Mendelian randomization study. Transl Psychiatry 2021;11:291. 10.1038/s41398-021-01400-z [DOI] [PMC free article] [PubMed] [Google Scholar]
- 21.Hu B, Jadhav RR, Gustafson CE, et al. Distinct Age-Related Epigenetic Signatures in CD4 and CD8 T Cells. Front Immunol 2020;11:585168. 10.3389/fimmu.2020.585168 [DOI] [PMC free article] [PubMed] [Google Scholar]
- 22.Yang X, Wang X, Lei L, et al. Age-Related Gene Alteration in Naïve and Memory T cells Using Precise Age-Tracking Model. Front Cell Dev Biol 2021;8:624380. 10.3389/fcell.2020.624380 [DOI] [PMC free article] [PubMed] [Google Scholar]
- 23.Yang S, Yang H, Luo Y, et al. Long non-coding RNAs in neurodegenerative diseases. Neurochem Int 2021;148:105096. 10.1016/j.neuint.2021.105096 [DOI] [PubMed] [Google Scholar]
- 24.Faridi A, Yang W, Kelly HG, et al. Differential Roles of Plasma Protein Corona on Immune Cell Association and Cytokine Secretion of Oligomeric and Fibrillar Beta-Amyloid. Biomacromolecules. 2019;20:4208-17. 10.1021/acs.biomac.9b01116 [DOI] [PMC free article] [PubMed] [Google Scholar]
- 25.Shabir O, Berwick J, Francis SE. Neurovascular dysfunction in vascular dementia, Alzheimer's and atherosclerosis. BMC Neurosci 2018;19:62. 10.1186/s12868-018-0465-5 [DOI] [PMC free article] [PubMed] [Google Scholar]
- 26.Sun Y, Chen D, Cao L, et al. MiR-490-3p modulates the proliferation of vascular smooth muscle cells induced by ox-LDL through targeting PAPP-A. Cardiovasc Res 2013;100:272-9. 10.1093/cvr/cvt172 [DOI] [PubMed] [Google Scholar]
- 27.Shin HJ, Oh J, Kang SM, et al. Leptin induces hypertrophy via p38 mitogen-activated protein kinase in rat vascular smooth muscle cells. Biochem Biophys Res Commun 2005;329:18-24. 10.1016/j.bbrc.2004.12.195 [DOI] [PubMed] [Google Scholar]
- 28.Jing R, Pan W, Long T, et al. LINC00472 regulates vascular smooth muscle cell migration and proliferation via regulating miR-149-3p. Environ Sci Pollut Res Int 2021;28:12960-7. 10.1007/s11356-020-10761-9 [DOI] [PubMed] [Google Scholar]
- 29.Lu Y, Guo J, Zhu S, et al. LncRNA HCG18 is critical for vascular smooth muscle cell proliferation and phenotypic switching. Hum Cell 2020;33:537-44. 10.1007/s13577-020-00366-2 [DOI] [PubMed] [Google Scholar]
- 30.Lee DY, Chiu JJ. Atherosclerosis and flow: roles of epigenetic modulation in vascular endothelium. J Biomed Sci 2019;26:56. 10.1186/s12929-019-0551-8 [DOI] [PMC free article] [PubMed] [Google Scholar]
- 31.Brunner H, Cockcroft JR, Deanfield J, et al. Endothelial function and dysfunction. Part II: Association with cardiovascular risk factors and diseases. A statement by the Working Group on Endothelins and Endothelial Factors of the European Society of Hypertension. J Hypertens 2005;23:233-46. 10.1097/00004872-200502000-00001 [DOI] [PubMed] [Google Scholar]
- 32.Cermakova P, Eriksdotter M, Lund LH, et al. Heart failure and Alzheimer's disease. J Intern Med 2015;277:406-25. 10.1111/joim.12287 [DOI] [PMC free article] [PubMed] [Google Scholar]
- 33.Wang S, Lin Y, Zhong Y, et al. The long noncoding RNA HCG18 participates in PM2.5-mediated vascular endothelial barrier dysfunction. Aging (Albany NY) 2020;12:23960-73. 10.18632/aging.104073 [DOI] [PMC free article] [PubMed] [Google Scholar]
- 34.Selvarajan V, Osato M, Nah GSS, et al. RUNX3 is oncogenic in natural killer/T-cell lymphoma and is transcriptionally regulated by MYC. Leukemia 2017;31:2219-27. 10.1038/leu.2017.40 [DOI] [PMC free article] [PubMed] [Google Scholar]
- 35.Woolf E, Xiao C, Fainaru O, et al. Runx3 and Runx1 are required for CD8 T cell development during thymopoiesis. Proc Natl Acad Sci U S A 2003;100:7731-6. 10.1073/pnas.1232420100 [DOI] [PMC free article] [PubMed] [Google Scholar]
- 36.Huang K, Yang C, Zheng J, et al. Effect of circular RNA, mmu_circ_0000296, on neuronal apoptosis in chronic cerebral ischaemia via the miR-194-5p/Runx3/Sirt1 axis. Cell Death Discov 2021;7:124. 10.1038/s41420-021-00507-y [DOI] [PMC free article] [PubMed] [Google Scholar]
- 37.Liu Y, Zou J, Li B, et al. RUNX3 modulates hypoxia-induced endothelial-to-mesenchymal transition of human cardiac microvascular endothelial cells. Int J Mol Med 2017;40:65-74. 10.3892/ijmm.2017.2998 [DOI] [PMC free article] [PubMed] [Google Scholar]
- 38.Torr EE, Ngam CR, Bernau K, et al. Myofibroblasts exhibit enhanced fibronectin assembly that is intrinsic to their contractile phenotype. J Biol Chem 2015;290:6951-61. 10.1074/jbc.M114.606186 [DOI] [PMC free article] [PubMed] [Google Scholar]
- 39.Bernau K, Torr EE, Evans MD, et al. Tensin 1 Is Essential for Myofibroblast Differentiation and Extracellular Matrix Formation. Am J Respir Cell Mol Biol 2017;56:465-76. 10.1165/rcmb.2016-0104OC [DOI] [PMC free article] [PubMed] [Google Scholar]
- 40.Leshchyns'ka I, Sytnyk V. Synaptic Cell Adhesion Molecules in Alzheimer's Disease. Neural Plast 2016;2016:6427537. 10.1155/2016/6427537 [DOI] [PMC free article] [PubMed] [Google Scholar]
- 41.Li Y, Xu F, Chen F, et al. Transcriptomics based multi-dimensional characterization and drug screen in esophageal squamous cell carcinoma. EBioMedicine 2021;70:103510. 10.1016/j.ebiom.2021.103510 [DOI] [PMC free article] [PubMed] [Google Scholar]
- 42.González-Domínguez R, García-Barrera T, Vitorica J, et al. Deciphering metabolic abnormalities associated with Alzheimer's disease in the APP/PS1 mouse model using integrated metabolomic approaches. Biochimie 2015;110:119-28. 10.1016/j.biochi.2015.01.005 [DOI] [PubMed] [Google Scholar]
- 43.Dolgodilina E, Camargo SM, Roth E, et al. Choroid plexus LAT2 and SNAT3 as partners in CSF amino acid homeostasis maintenance. Fluids Barriers CNS 2020;17:17. 10.1186/s12987-020-0178-x [DOI] [PMC free article] [PubMed] [Google Scholar]
- 44.Suzuki R, Leach S, Liu W, et al. Molecular editing of cellular responses by the high-affinity receptor for IgE. Science 2014;343:1021-5. 10.1126/science.1246976 [DOI] [PMC free article] [PubMed] [Google Scholar]
- 45.Mackenzie B, Erickson JD. Sodium-coupled neutral amino acid (System N/A) transporters of the SLC38 gene family. Pflugers Arch 2004;447:784-95. 10.1007/s00424-003-1117-9 [DOI] [PubMed] [Google Scholar]
- 46.Crist AM, Hinkle KM, Wang X, et al. Transcriptomic analysis to identify genes associated with selective hippocampal vulnerability in Alzheimer's disease. Nat Commun 2021;12:2311. 10.1038/s41467-021-22399-3 [DOI] [PMC free article] [PubMed] [Google Scholar]
- 47.Tong BC, Wu AJ, Li M, et al. Calcium signaling in Alzheimer's disease & therapies. Biochim Biophys Acta Mol Cell Res 2018;1865:1745-60. 10.1016/j.bbamcr.2018.07.018 [DOI] [PubMed] [Google Scholar]
- 48.Kuchibhotla KV, Goldman ST, Lattarulo CR, et al. Abeta plaques lead to aberrant regulation of calcium homeostasis in vivo resulting in structural and functional disruption of neuronal networks. Neuron 2008;59:214-25. 10.1016/j.neuron.2008.06.008 [DOI] [PMC free article] [PubMed] [Google Scholar]
- 49.Foster TC. Calcium homeostasis and modulation of synaptic plasticity in the aged brain. Aging Cell 2007;6:319-25. 10.1111/j.1474-9726.2007.00283.x [DOI] [PubMed] [Google Scholar]
- 50.Heneka MT. Inflammasome activation and innate immunity in Alzheimer's disease. Brain Pathol 2017;27:220-2. 10.1111/bpa.12483 [DOI] [PMC free article] [PubMed] [Google Scholar]
- 51.Zhang Y, Zhao Y, Zhang J, et al. Mechanisms of NLRP3 Inflammasome Activation: Its Role in the Treatment of Alzheimer's Disease. Neurochem Res 2020;45:2560-72. 10.1007/s11064-020-03121-z [DOI] [PubMed] [Google Scholar]
- 52.Grebe A, Hoss F, Latz E. NLRP3 Inflammasome and the IL-1 Pathway in Atherosclerosis. Circ Res 2018;122:1722-40. 10.1161/CIRCRESAHA.118.311362 [DOI] [PubMed] [Google Scholar]
- 53.Yang J, Wise L, Fukuchi KI. TLR4 Cross-Talk With NLRP3 Inflammasome and Complement Signaling Pathways in Alzheimer's Disease. Front Immunol 2020;11:724. 10.3389/fimmu.2020.00724 [DOI] [PMC free article] [PubMed] [Google Scholar]
- 54.Ahn JJ, Abu-Rub M, Miller RH. B Cells in Neuroinflammation: New Perspectives and Mechanistic Insights. Cells 2021;10:1605. 10.3390/cells10071605 [DOI] [PMC free article] [PubMed] [Google Scholar]
- 55.Erickson MA, Banks WA. Blood-brain barrier dysfunction as a cause and consequence of Alzheimer's disease. J Cereb Blood Flow Metab 2013;33:1500-13. 10.1038/jcbfm.2013.135 [DOI] [PMC free article] [PubMed] [Google Scholar]
- 56.Carrano A, Hoozemans JJ, van der Vies SM, et al. Amyloid Beta induces oxidative stress-mediated blood-brain barrier changes in capillary amyloid angiopathy. Antioxid Redox Signal 2011;15:1167-78. 10.1089/ars.2011.3895 [DOI] [PubMed] [Google Scholar]
- 57.Moore GWK, Howell SEL, Brady M, et al. Anomalous collapses of Nares Strait ice arches leads to enhanced export of Arctic sea ice. Nat Commun 2021;12:1. 10.1038/s41467-020-20314-w [DOI] [PMC free article] [PubMed] [Google Scholar]
- 58.Gurzov EN, Stanley WJ, Pappas EG, et al. The JAK/STAT pathway in obesity and diabetes. FEBS J 2016;283:3002-15. 10.1111/febs.13709 [DOI] [PubMed] [Google Scholar]
- 59.Wan J, Fu AK, Ip FC, et al. Tyk2/STAT3 signaling mediates beta-amyloid-induced neuronal cell death: implications in Alzheimer's disease. J Neurosci 2010;30:6873-81. 10.1523/JNEUROSCI.0519-10.2010 [DOI] [PMC free article] [PubMed] [Google Scholar]
- 60.Ben Haim L, Ceyzériat K, Carrillo-de Sauvage MA, et al. The JAK/STAT3 pathway is a common inducer of astrocyte reactivity in Alzheimer's and Huntington's diseases. J Neurosci 2015;35:2817-29. 10.1523/JNEUROSCI.3516-14.2015 [DOI] [PMC free article] [PubMed] [Google Scholar]
Associated Data
This section collects any data citations, data availability statements, or supplementary materials included in this article.
Supplementary Materials
The article’s supplementary files as


