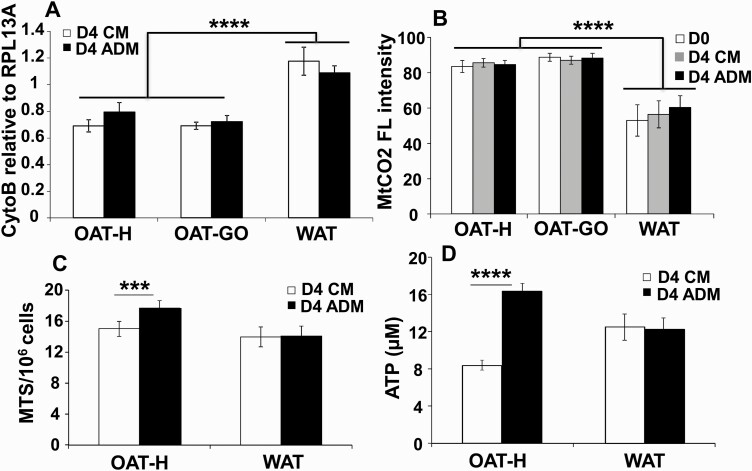
Figure 1.
Mitochondria analysis and cellular adenosine 5′-triphosphate (ATP) production of orbital adipose tissue preadipocytes/fibroblasts (OAT-PFs) in adipogenic-medium (ADM)-adipogenesis compared with white adipose tissue (WAT). Confluent PFs from healthy OAT (OAT-H), Graves orbitopathy (OAT-GO), or WAT were cultured in complete medium (CM) or ADM for 4 days. A, DNA extracted from OAT (n = 3) and OAT-GO (n = 3) or WAT-PFs (n = 4) on day 4, relative quantitative polymerase chain reaction of cytochrome b (Cytob, mitochondrial DNA) to RPL13A (reference genomic DNA) was performed. B, Mitochondrial-cytochrome-oxidase (MtCO2) antibody was analyzed by flow cytometry from confluent OAT (n = 4), OAT-GO (n = 4), and WAT-PFs (n = 7) at day 0 in CM or day 4 in CM and ADM, the percentage of flow cytometric (FL) intensity, positive mitochondrial-cytochrome-oxidase (MtCO2) staining, is shown referenced to negative control. C, MTS assay (indicating the production of NAD(P)H and mitochondrial oxidative-phosphorylation (OXPHOS) activity (26)) was performed on PFs from OAT-H (n = 3) and WAT-PFs (n = 4) on day 4 in CM and ADM, 490 nm absorbance normalized by cell number. D, Total level of cellular ATP (luminescent ATP detection assay kit) was measured from OAT-H (n = 7) and WAT-PFs (n = 4) on day 4 in CM and ADM. Histograms = mean ± SEM of all samples studied. T test was used for statistical analysis. ***P less than or equal to .001; ****P less than or equal to .0005.

