

Abstract
Introduction and Aims:
Wearable devices that obtain transdermal alcohol concentration (TAC) could become valuable research tools for monitoring alcohol consumption levels in naturalistic environments if the TAC they produce could be converted into quantitatively-meaningful estimates of BrAC (eBrAC). Our team has developed mathematical models to produce eBrAC from TAC, but it is not yet clear how a variety of factors affect the accuracy of the models. Stomach content is one factor that is known to affect BrAC, but its effect on the BrAC-TAC relationship has not yet been studied.
Design and Methods:
We examine the BrAC-TAC relationship by having two investigators participate in four laboratory drinking sessions with varied stomach content conditions: 1) no meal, 2) half and 3) full meal before drinking, and 4) full meal after drinking. BrAC and TAC were obtained every 10 minutes over the BrAC curve.
Results:
Eating before drinking lowered BrAC and TAC levels, with greater variability in TAC across person-device pairings, but the BrAC-TAC relationship was not consistently altered by stomach content. The mathematical model calibration parameters, fit indices, and eBrAC curves and summary score outputs did not consistently vary based on stomach content, indicating that our models were able to produce eBrAC from TAC with similar accuracy despite variations in the shape and magnitude of the BrAC curves under different conditions.
Discussion and Conclusions:
This study represents the first examination of how stomach content affects our ability to model eBrAC from TAC and indicates it is not a major factor.
Keywords: alcohol biosensor, transdermal alcohol concentration, BrAC estimation, stomach content, real-time assessment
Transdermal alcohol devices can monitor alcohol consumption continuously over extended periods of time in real-world environments, and therefore have the potential to be highly useful to researchers interested in studying naturalistic drinking behavior (see [1, 2]). The transdermal alcohol concentration (TAC) that the devices record is obtained at the surface of the skin, which means TAC is a combination of the subcutaneous blood alcohol concentration (BAC), the transdermal diffusion of the alcohol, and the absorption of the superfacial alcohol into the TAC device (see [3, 4, 5]). Thus, in relation to BAC, TAC is delayed by the time required to get from the blood into the device [6–10], and its concentration is altered by person-level factors such as skin thickness and hydration, device-specific factors, and environmental factors such as ambient temperature and humidity (see [2, 4, 5]). This reality—that raw TAC does not straightforwardly map (either temporally or quantitatively) onto BAC—makes it difficult to directly use TAC as a meaningful quantitative indicator of alcohol levels in the body (see [11, 12]). This is unlike breath alcohol concentration (BrAC), which does map well onto BAC [13] and is considered basically equivalent to BAC. Unfortunately, using breath analyzers in the field requires active participation, interferes with naturalistic conditions, and can produce inaccurate BrAC measurements (e.g., due to mouth alcohol while drinking). Thus, the need to passively obtain quantitatively- and temporally-accurate concentrations of alcohol during naturalistic drinking events may still be better met via TAC, if TAC can be reliably converted into estimated BAC/BrAC (eBAC/eBrAC).
Our research team has created the BrAC Estimator software, which utilizes physics- and physiological-based mathematical models we have developed to translate TAC into eBrAC [4, 8, 14–19, see 20]. We assume the dynamics of the process described by the model are common to every person. Then, variation in the BrAC-TAC relationship across each person-, environment-, and device-combination is captured by the unique parameters used in the model. There are two key parameters in the model—q1, the rate at which alcohol diffuses through the skin, and q2, the net rate at which alcohol enters and leaves the skin and is processed by the TAC device. The optimal parameter values for each person-device pairing (denoted q1* and q2*) can be obtained during an alcohol administration session where an individual wears a particular device and is monitored for both TAC and BrAC [8, 14, 15] or by using population-based parameter estimates [4, 17–19]. Once obtained, the optimal parameter values can be used to model all drinking episodes for that person-device pair. The most recent version of the BrAC Estimator software combines the deterministic approaches we have incorporated into software in the past (e.g., [8, 21]) with population-based statistical approaches (as have been examined by others, (e.g., [22]), which enables us to produce credible bands around the estimated BrAC and TAC curves [4, 17–19].
This mathematical system models the diffusion of alcohol from the subcutaneous blood through the skin and into TAC device (the forward phase of the model) and allows retrieval of only BrAC (the inversion phase of the model), not further back to oral ingestion or metabolism through the stomach, gut, or liver. Thus, it is not expected that drinking episode variations like stomach contents will affect our models, but we have yet to systematically examine this topic.
Effects of Stomach Content on Alcohol Metabolism and BAC/BrAC
Because alcohol is typically consumed orally, its bioavailability (i.e. the amount of alcohol that reaches the bloodstream) is affected by stomach content [5, 23]. Food in the stomach slows the gastric emptying rate at which stomach contents (including alcohol) are emptied into the duodenum, in which most alcohol (~80%) is absorbed into the bloodstream [5, 24–27]. This slowed rate of gastric emptying has been shown to cause the bulk of alcohol absorption to occur in the stomach at a slower rate of absorption than occurs in the duodenum [25, 28], and to increase the first pass metabolism of alcohol (i.e., the amount of alcohol that is metabolized before reaching the blood [29]. This increased first pass metabolism due to stomach contents has been ascribed to the extended exposure to alcohol metabolizing enzymes in the stomach [30] and to the improved ability of the liver to metabolize alcohol when it is delivered at a slower pace [31]. Even when alcohol is administered intravenously, research has shown a 30–45% increase in the rate of alcohol elimination from having food in the stomach [32, 33], which similarly has been attributed to both increased activity of alcohol metabolizing enzymes and increased hepatic blood flow [31, 32, see 5], with hepatic blood flow remaining elevated for over 3 hours after a meal [34].
Taken together, these studies indicate having food in the stomach when consuming alcohol slows the absorption of alcohol, reduces the amount of alcohol that reaches the bloodstream, and increases the rate of elimination. These effects of stomach content on alcohol pharmacokinetics in the body are consistent with studies that show eating prior to consuming alcohol reduces BAC/BrAC peak, timing of peak, and the area under the alcohol curve (AUC) [35–37]. Sadler and Fox [37] demonstrated that eating prior to drinking attenuated the BrAC peak and shortened the time to reach peak BrAC in a manner that was dependent upon the amount of food consumed, with the largest amount of food resulting in about two thirds (69%) of the fasting peak in half the time (22 vs. 44 minutes). In addition, Jones et al. [36] found AUC was reduced by ~45–60% after eating meals of various macronutrients compared with fasting, with it taking 1–2 hours longer to fully eliminate alcohol from the blood in the fasted condition.
Study Aims
In this study, we examine the possibility that stomach content affects the BrAC-TAC relationship and our ability to accurately produce eBrAC. We first compare raw BrAC and raw TAC peak ratios, time of peak difference scores, and AUC ratios from laboratory drinking sessions with varied eating protocols conducted by two investigators. We then examine the fit of our mathematical models as coded in our BrAC Estimator software. We compare the model optimization parameter values from the calibration phase for each person-device pair across the four eating conditions. If the BrAC-TAC relationship is not altered by stomach contents, q1* and q2* should be consistent across the four conditions within each person-device pair. Lastly, we examine the eBrAC curve fit indices and summary scores from the inversion phase compared with raw BrAC.
Methods
Participants
Two of the investigators (second author Asian male, last author non-Hispanic White female) collected BrAC and TAC data in the laboratory, which was not considered to be human subjects research by the University of Southern California Institutional Review Board. Participants were of similar height (within an inch), weight (within 10 lbs; BMI normal range), and age (within 10 years). Given the primary aim of the study was to examine within-person variation in the BrAC-TAC relationship data based on stomach content, utilizing investigators ensured the accuracy of participant reporting of eating/drinking prior to arriving in laboratory.
Devices
SCRAM-CAM® devices (Alcohol Monitoring Systems, AMS, Littleton, CO) were used to measure TAC, temperature, and infrared light (a measure of adherence) at the surface of the skin. BrAC measurements were obtained with Alco-Sensor IV breath analyzers (Intoximeters, Inc., St. Louis, MO).
Procedure
Participants each completed four drinking sessions following 4 hours of fasting: 1) No Meal, 2) Half Meal Prior: consumed half a meal 30 minutes prior to drinking, 3) Full Meal Prior: consumed a full meal 30 minutes prior to drinking, and 4) Full Meal After: consumed a full meal 30 minutes after drinking. The full meals consisted of 240 ml of water and a bagel with butter and jelly (~400 calories). The Half Meal Prior condition included half the water and food (~200 calories). The alcohol dose was held constant at 86ml of 80 proof alcohol, or two standard drinks, for all sessions for both participants.
Drinking sessions began in the late afternoon. Participants wore the same two TAC devices, one on each bicep, in all four sessions; this placement, as opposed to on the ankle, was selected with guidance by AMS and after pilot testing in order to increase signal strength and reliability. Devices were calibrated before drinking also in accordance with AMS recommendations. During each session, participants took ~5 minutes to consumed meals and 15 minutes to consume alcohol. BrAC and TAC readings were obtained every 10 minutes until BrAC returned to .000. To be consistent with our general laboratory alcohol administration procedure (e.g., [38, 39]), at 150 minutes after alcohol administration, participants ate a meal (in all sessions, this was a 480-calorie salad with chicken and 240ml of water). Once BrAC returned to .000, participants left the laboratory wearing the TAC devices, which continued to read automatically every 30 minutes, and proceeded with routine daily activities that did not include rigorous physical exercise (i.e. more than walking) while TAC was >.000.
Data Analysis
Raw Data.
Each participant had two sets of TAC data per drinking session and four drinking sessions, resulting in eight TAC-BrAC datasets per participant. We examined raw TAC:raw BrAC ratios for “Peak” and “AUC”, and we examined difference scores between “Time to Peak” of BrAC and simulated TAC (sTAC), which effectively is a smoothed (i.e. filtered) version of the TAC curve produced by the BrAC Estimator software (see black dotted lines in Figure 2).
Figure 2.
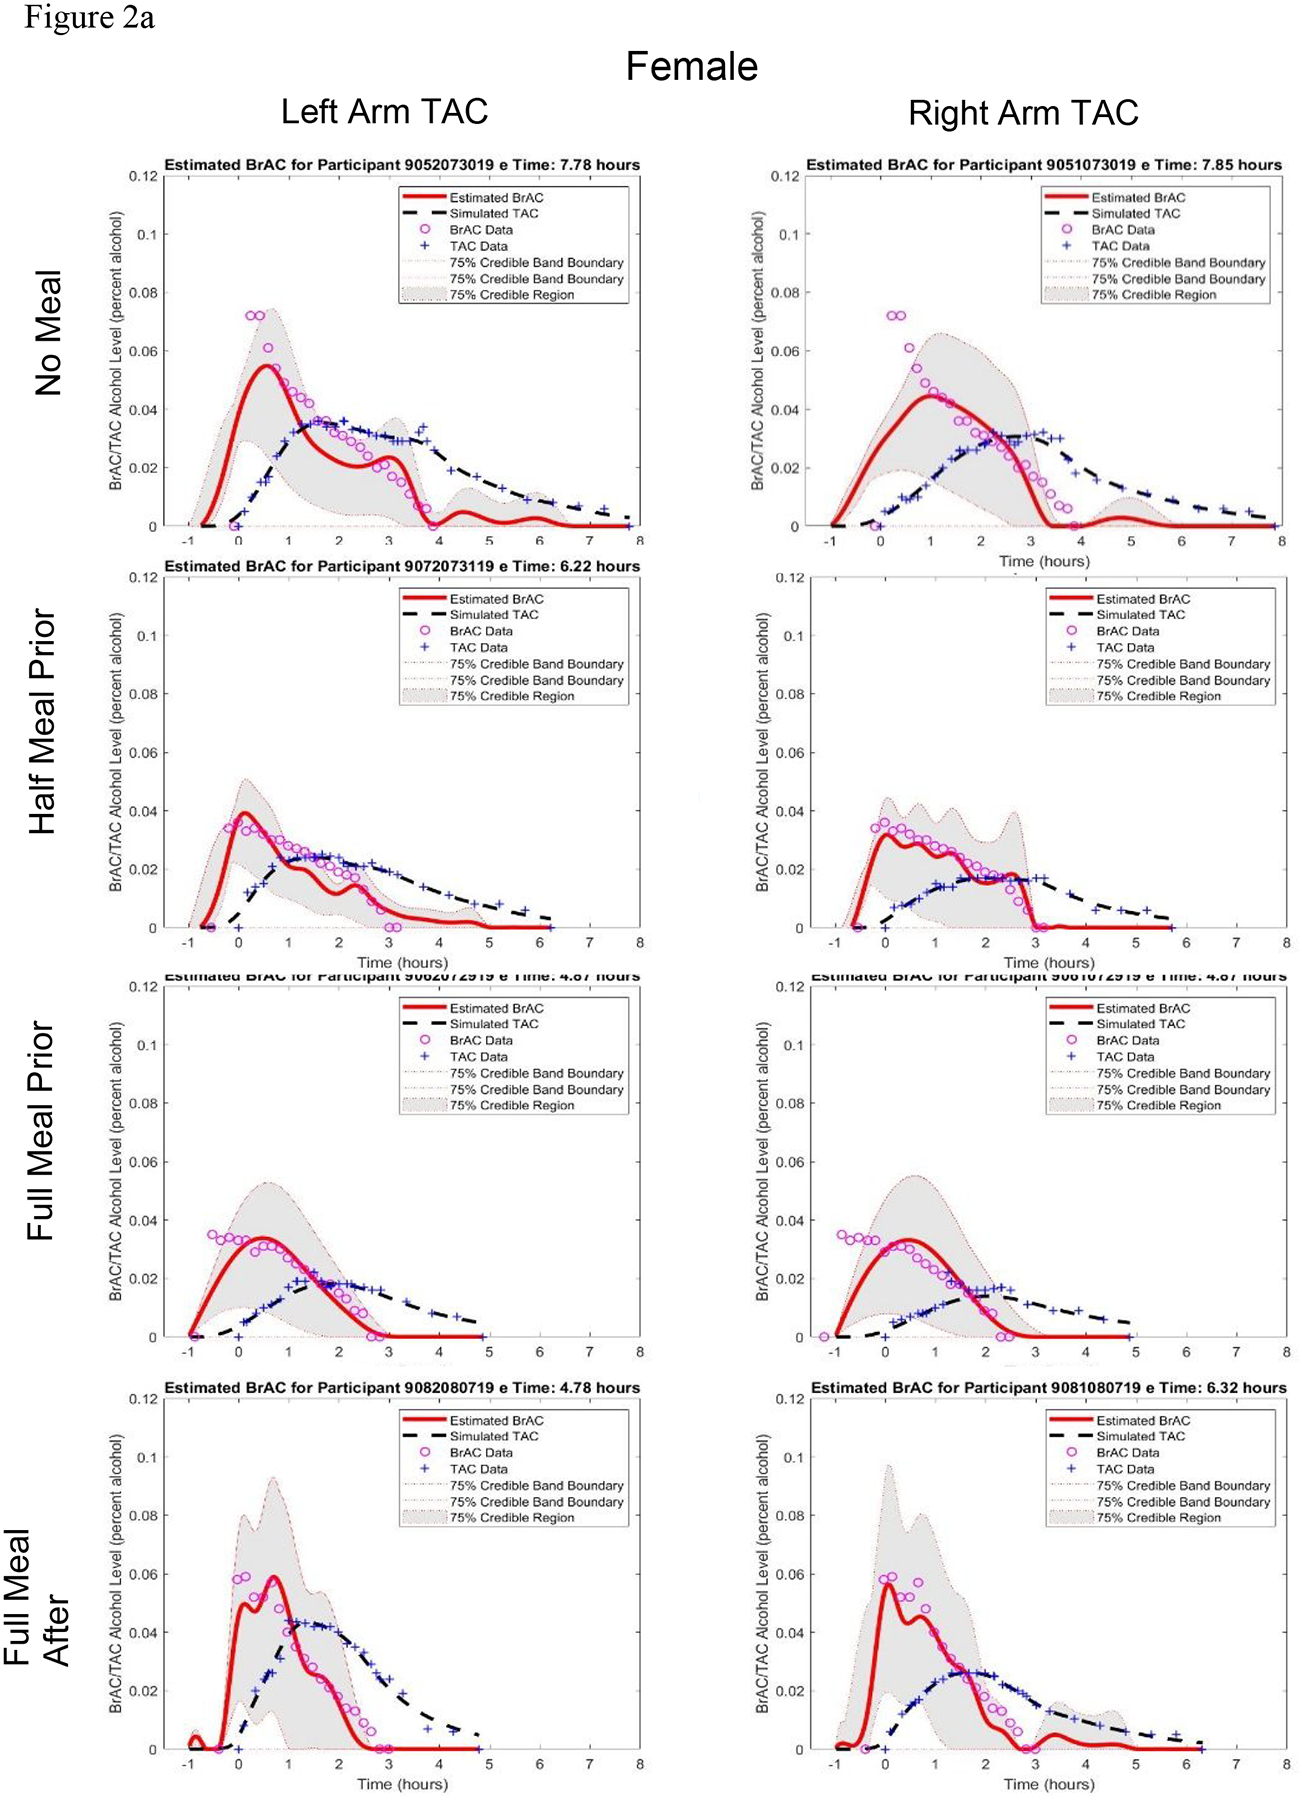
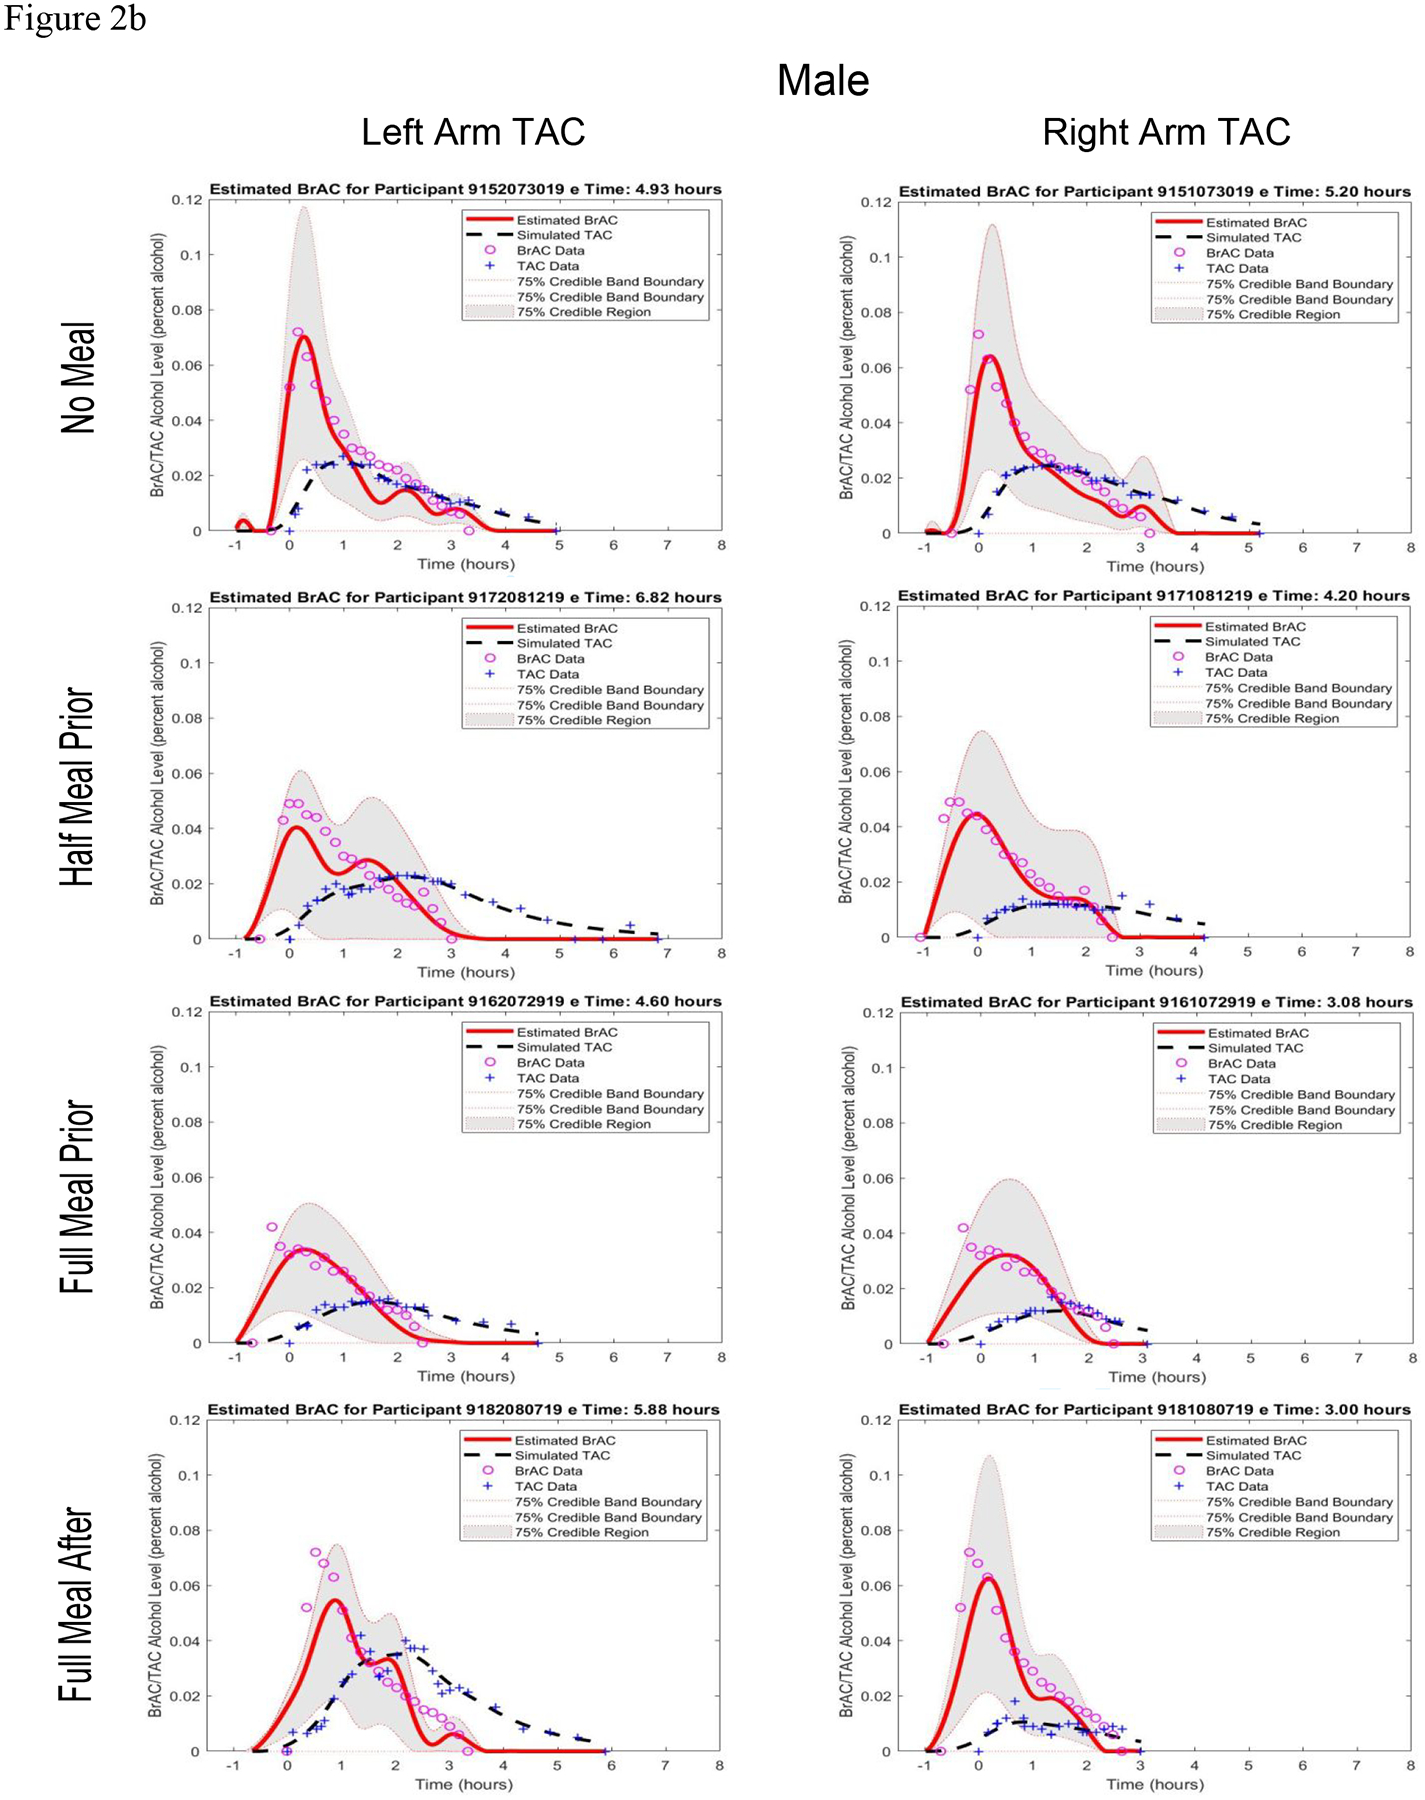
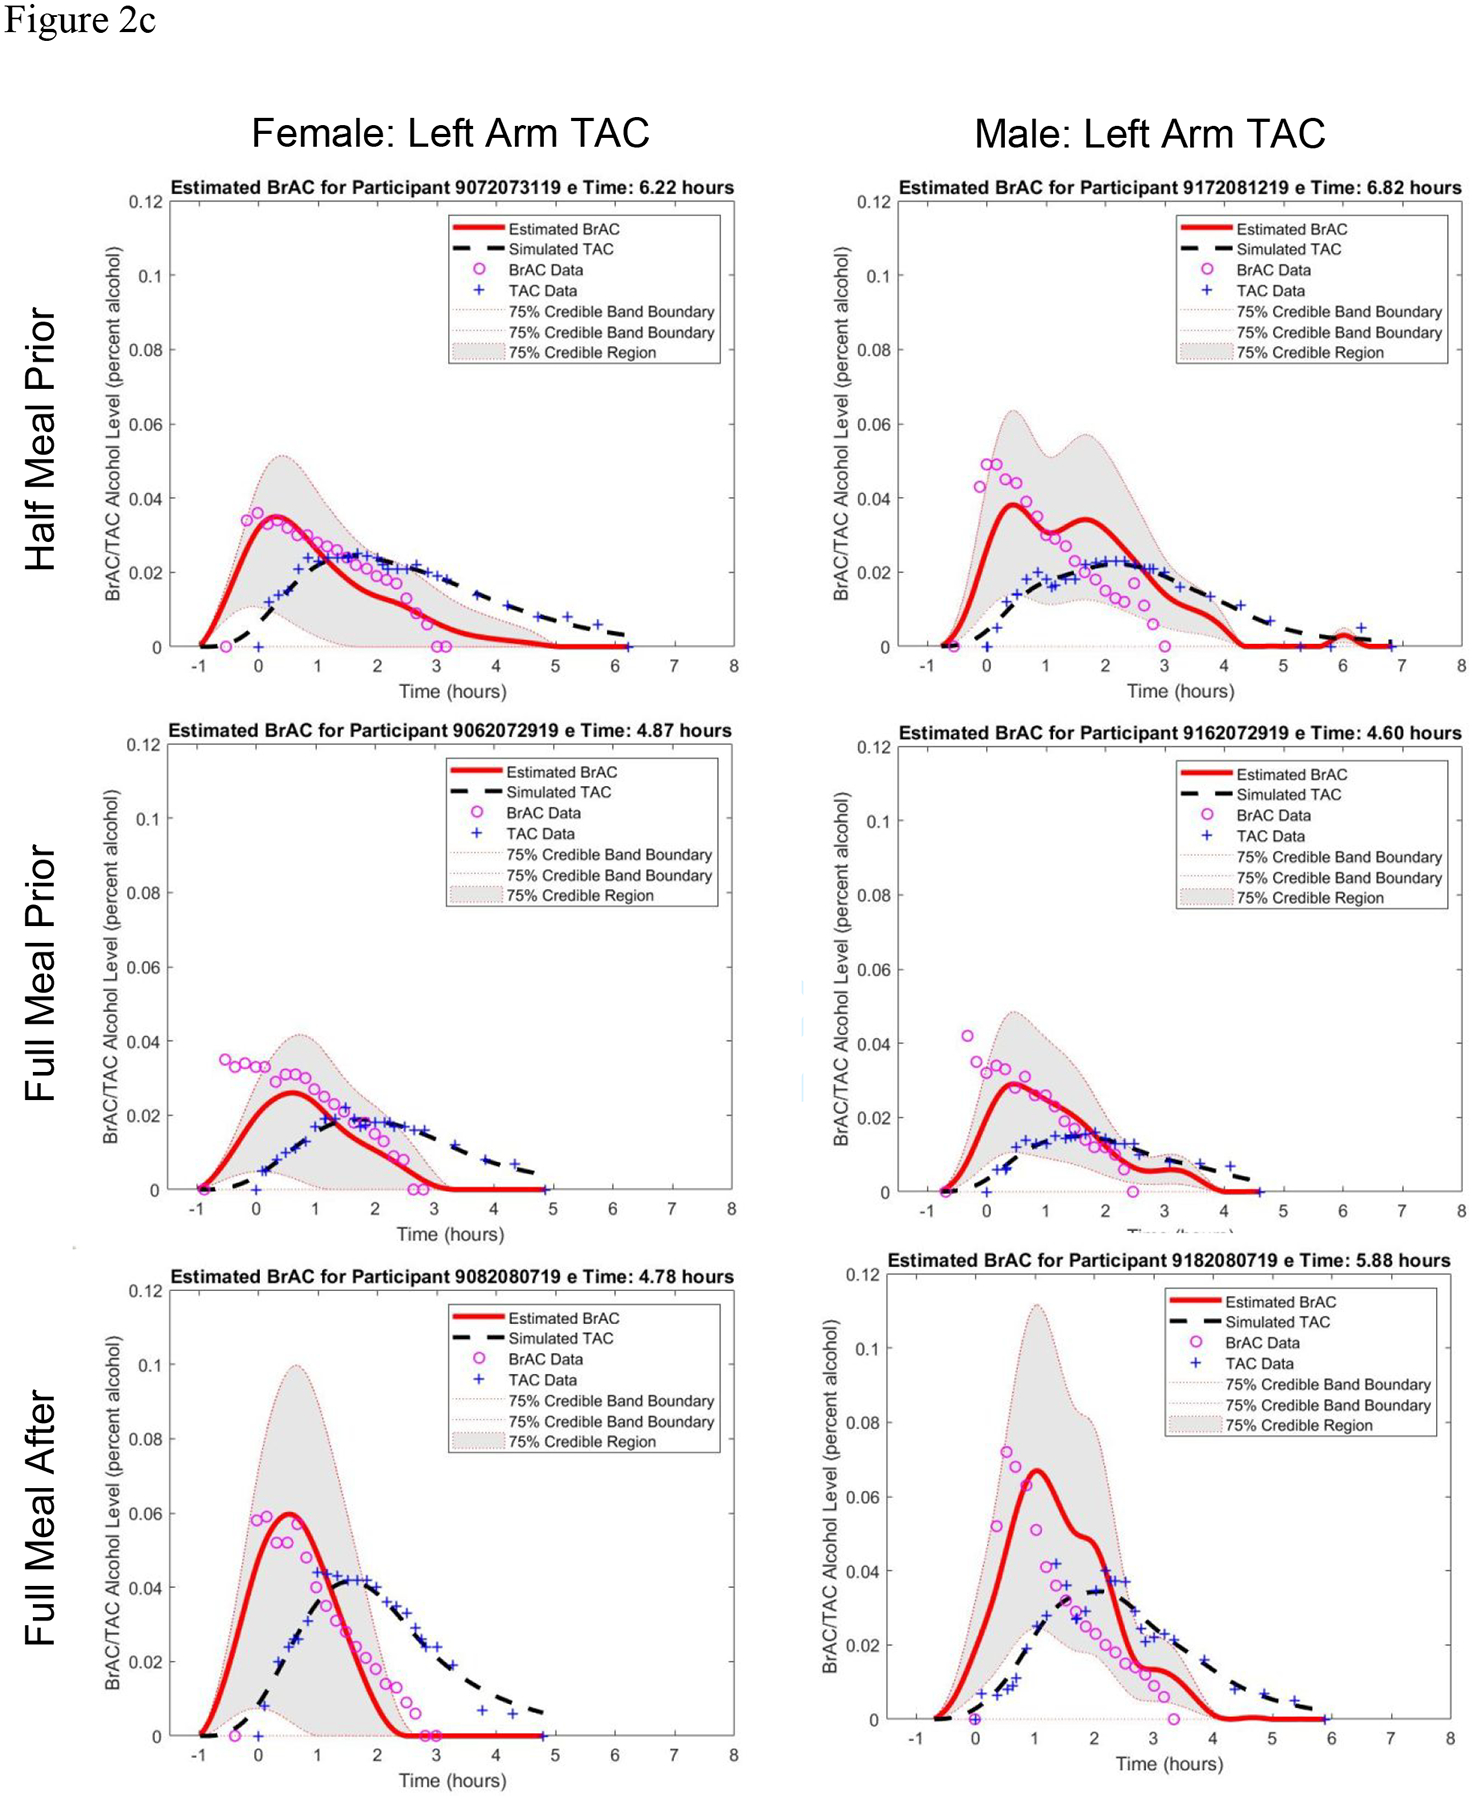
Estimated BrAC curve with 75% credible band and simulated TAC curve from the BrAC Estimator software compared with raw BrAC and raw TAC measurements in all sessions for a) the female participant and b) the male participant, and c) in the three eating conditions for both the female and male left arm TAC device when calibrated using the No Food condition parameter values for that person-device pair.
BrAC Estimator.
Each of the 16 BrAC-TAC datasets was entered into the BrAC Estimator software to obtain unique q1* and q2* parameter values, which were then used in the inversion phase to produce the eBrAC curve and summary scores. From the calibration phase, we compared q1* and q2* values across the four eating protocols within each person-device pair. From the inversion phase, we compared raw BrAC data points modeled as a spline function to obtain a curve [40] and eBrAC summary scores for Peak, AUC, and “Duration >.000”. We used three indicators of eBrAC curve fit: percent of raw BrAC captured by the 75% credible bands of the eBrAC curve, L2 error (the square root of the sum of the squares of the difference between the BrAC and eBrAC curves), and Relative L2 error (L2 error normalized by the square root of the sum of the squares of the BrAC curve).
Results
Raw BrAC and TAC
Figure 1 visualizes the raw BrAC and both sets of raw TAC for each of the eight drinking sessions. Raw TAC data from the two devices worn simultaneously align well in most conditions, with device differences being most notable in the Full Meal After condition for both participants (compare red and blue TAC data of each session in Figure 1). Table 1 shows the raw BrAC and raw TAC summary scores for Peak, Time to Peak, and AUC in all 16 pairs of BrAC-TAC data, along with TAC:BrAC ratios for Peak and AUC and the TAC-BrAC difference scores for Time to Peak. The table rows show that compared with the No Meal condition, raw BrAC Peak was reduced similarly for the Half and Full Meal Prior conditions (calculated as 50–51% in the female, 32–42% in the male). Raw BrAC Time of Peak occurred at either the 20- or 30-minute post-consumption BrAC reading in all conditions, which is prior to eating in the Full Meal After condition (see Table 1 for peak BrAC times). In the female participant, BrAC AUC was reduced by about one third (39%) in both the Half and Full Meal Prior conditions and by about one quarter (24%) in the Full Meal After condition compared with the No Meal condition. In the male participant, BrAC AUC also was reduced by about one third (33%) in the Full Meal Prior condition, but by less in the Half Meal Prior (13%) and not at all (0%) in the Full Meal After condition.
Figure 1.
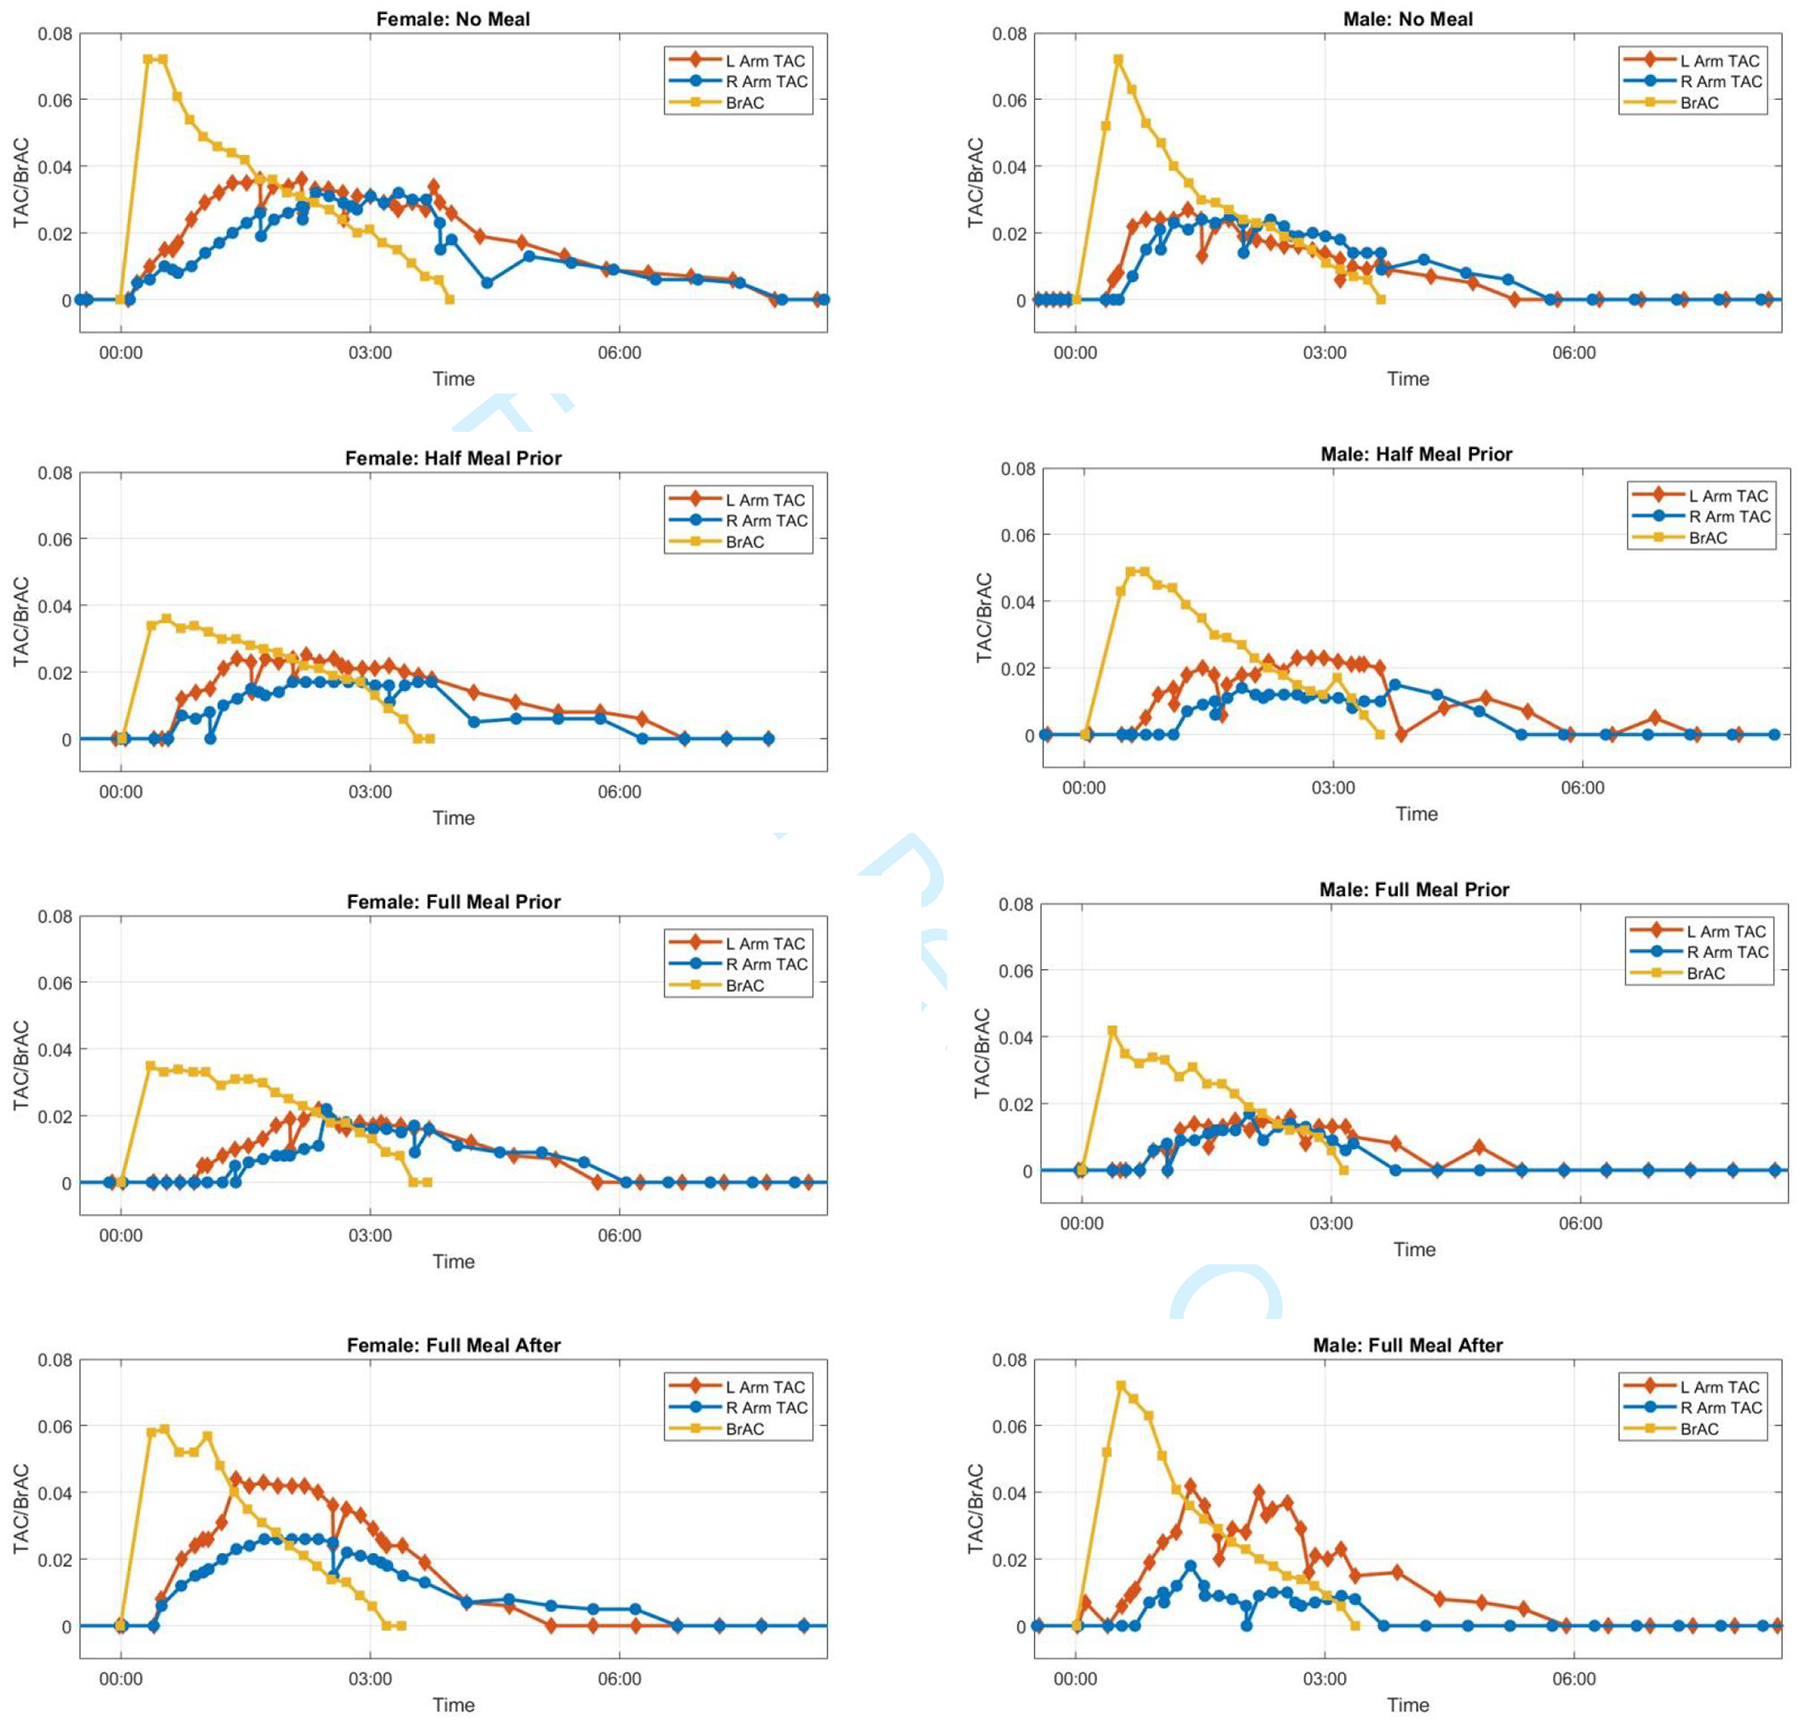
Raw BrAC and raw TAC curves for all eight drinking session.
Table 1.
Peak, Time to Peak, and Area Under the Curve (AUC) raw BrAC, raw TAC, and TAC:BrAC ratio or sTAC-BrAC difference score for each eating condition stratified by participant.
| Peak Level (% alcohol) | Time to Peak (minutes) | AUC (% alcohol × hours) | ||||||||||||||
|---|---|---|---|---|---|---|---|---|---|---|---|---|---|---|---|---|
| Participant | BrAC | Left Arm TAC | Right Arm TAC | Left TAC:BrAC | Right TAC:BrAC | BrAC | Left sTAC | Right sTAC | Left sTAC - BrAC | Right sTAC - BrAC | BrAC | Left Arm TAC | Right Arm TAC | Left TAC:BrAC | Right TAC:BrAC | |
| No Meal | .072 | .036 | .032 | 0.50 | 0.44 | 20 | 107 | 170 | 87 | 150 | 0.132 | 0.149 | 0.116 | 1.13 | 0.88 | |
| Female | ||||||||||||||||
| Half Meal Prior | .036 | .025 | .017 | 0.69 | 0.47 | 32 | 125 | 150 | 93 | 118 | 0.080 | 0.091 | 0.059 | 1.14 | 0.73 | |
| Full Meal Prior | .035 | .022 | .022 | 0.63 | 0.63 | 21 | 163 | 194 | 142 | 173 | 0.081 | 0.059 | 0.049 | 0.73 | 0.61 | |
| Full Meal After | .059 | .044 | .026 | 0.75 | 0.44 | 32 | 106 | 124 | 74 | 92 | 0.100 | 0.112 | 0.082 | 1.12 | 0.82 | |
| No Meal | .072 | .027 | .025 | 0.38 | 0.35 | 30 | 78 | 100 | 48 | 70 | 0.104 | 0.066 | 0.074 | 0.64 | 0.71 | |
| Male | ||||||||||||||||
| Half Meal Prior | .049 | .023 | .015 | 0.47 | 0.31 | 33 | 165 | 147 | 132 | 114 | 0.091 | 0.083 | 0.041 | 0.91 | 0.45 | |
| Full Meal Prior | .042 | .016 | .017 | 0.38 | 0.40 | 22 | 137 | 128 | 114 | 106 | 0.070 | 0.044 | 0.029 | 0.63 | 0.41 | |
| Full Meal After | .072 | .042 | .018 | 0.58 | 0.25 | 32 | 130 | 92 | 97 | 60 | 0.103 | 0.100 | 0.025 | 0.97 | 0.24 | |
Table 1 columns of Peak TAC:BrAC ratios show they were relatively consistent within person-device pairs. In the female participant, Peak ratios ranged from 0.50–0.75 for the left TAC device and from 0.44–0.63 for the right TAC device. In the male participant, Peak ratios also were relatively consistent across sessions albeit somewhat lower than in the female, ranging from 0.38–0.58 for the left TAC device and 0.25–0.40 for the right TAC device. AUC ratios also were relatively similar within person-device pair, ranging in the female from 0.73–1.14 for the left TAC device and 0.61–0.88 for the right TAC device, and in the male from 0.63–0.97 for the left TAC device and 0.24–0.71 for the right TAC device, with the 0.24 (from the Full Meal After condition) being slightly out of range. There was no clear trend in the ratio values among the eating conditions across the device-pairs.
Table 1 shows Time to Peak sTAC had a wider range than Time to Peak BrAC, with both Meal Prior conditions delaying the peak compared with No Meal, with the exception of female right TAC device. The Full Meal After condition either closely approximated the No Meal condition (e.g., female left TAC device, male right TAC device) or fell between it and the Meal Prior conditions (e.g., male left TAC device), with the exception of the female right TAC device.
BrAC Estimator Outcomes
The first two columns of Table 2 show the q1* and q2* parameter values produced by the BrAC Estimator software for each dataset. There was not a clear effect of stomach content on the parameters, with values being in a similar range (0.30–2.09, with the exception of one q1* value of 6.00 (from the male participant’s left arm No Meal condition, see panel 1 of Figure 2b) for each person-device pair across eating conditions. (Note that these scores can be magnitudes higher for some person-device pairs under varying conditions.)
Table 2.
BrAC Estimator output from calibration and inversion phases for each BrAC-TAC dataset.
| Parameter Values | Peak Level (% alcohol) | AUC (% alcohol × hrs) | Duration > .000 (hours) | Model Fit Indices | |||||||||||
|---|---|---|---|---|---|---|---|---|---|---|---|---|---|---|---|
| q1* | q 2 * | eBrAC | BrAC | BrAC - eBrAC | eBrAC | BrAC | BrAC - eBrAC | eBrAC | BrAC | BrAC - eBrAC | % BrAC captured | L2 Error | Relative L2 Error | ||
| Female | No Meal | 0.73 | 1.10 | .055 | .072 | .017 | 0.130 | 0.131 | 0.001 | 4.23 | 3.97 | −0.26 | 79 | 0.023 | 0.308 |
| Half Meal Prior | 0.86 | 1.15 | .039 | .036 | −.003 | 0.076 | 0.080 | 0.004 | 3.67 | 3.55 | −0.12 | 68 | 0.010 | 0.222 | |
| Left Arm | Full Meal Prior | 0.46 | 0.86 | .034 | .035 | .001 | 0.072 | 0.081 | 0.009 | 3.27 | 3.52 | 0.25 | 82 | 0.011 | 0.236 |
| Full Meal After | 1.47 | 1.22 | .059 | .059 | .000 | 0.092 | 0.100 | 0.008 | 2.62 | 3.20 | 0.58 | 80 | 0.011 | 0.175 | |
| Right Arm | No Meal | 0.45 | 0.96 | .045 | .072 | .027 | 0.123 | 0.131 | 0.008 | 3.95 | 3.97 | 0.02 | 63 | 0.029 | 0.381 |
| Half Meal Prior | 0.59 | 0.83 | .032 | .036 | .004 | 0.075 | 0.080 | 0.005 | 3.48 | 3.55 | 0.07 | 86 | 0.007 | 0.158 | |
| Full Meal Prior | 0.30 | 0.75 | .033 | .035 | .002 | 0.070 | 0.081 | 0.011 | 3.08 | 3.52 | 0.44 | 77 | 0.018 | 0.392 | |
| Full Meal After | 0.78 | 0.85 | .056 | .059 | .003 | 0.095 | 0.100 | 0.005 | 2.90 | 3.20 | 0.30 | 80 | 0.010 | 0.157 | |
| Male | No Meal | 6.00 | 0.70 | .070 | .072 | .002 | 0.093 | 0.104 | 0.011 | 3.75 | 3.67 | −0.08 | 73 | 0.013 | 0.203 |
| Half Meal Prior | 0.56 | 0.95 | .040 | .049 | .009 | 0.084 | 0.091 | 0.007 | 3.43 | 3.55 | 0.12 | 90 | 0.013 | 0.242 | |
| Left Arm | Full Meal Prior | 0.57 | 0.71 | .034 | .042 | .008 | 0.065 | 0.070 | 0.005 | 2.93 | 3.15 | 0.22 | 84 | 0.010 | 0.224 |
| Full Meal After | 1.15 | 1.08 | .055 | .072 | .017 | 0.093 | 0.103 | 0.010 | 3.63 | 3.35 | −0.28 | 60 | 0.020 | 0.304 | |
| Right Arm | No Meal | 1.15 | 0.81 | .064 | .072 | .008 | 0.093 | 0.104 | 0.011 | 3.78 | 3.67 | −0.11 | 91 | 0.014 | 0.21 |
| Half Meal Prior | 0.37 | 0.57 | .045 | .049 | .004 | 0.079 | 0.091 | 0.012 | 3.32 | 3.55 | 0.23 | 86 | 0.012 | 0.235 | |
| Full Meal Prior | 0.97 | 0.54 | .032 | .042 | .010 | 0.060 | 0.070 | 0.010 | 2.68 | 3.15 | 0.47 | 68 | 0.013 | 0.291 | |
| Full Meal After | 2.09 | 0.30 | .063 | .072 | .009 | 0.086 | 0.103 | 0.017 | 2.90 | 3.35 | 0.45 | 75 | 0.017 | 0.249 | |
Note. The BrAC AUC output from the BrAC Estimator software shown here vary slightly from the BrAC AUC in Table 1 due to rounding differences.
The middle columns of Table 2 show the three episode summary scores. Peak BrAC and Peak eBrAC matched closely, with difference scores being only >.010 in 3 of the 16 datasets. Moreover, the difference between Peak BrAC and eBrAC did not appear to depend on stomach content condition. The AUC difference scores also were consistently low in all datasets, with all 16 datasets below .020 % alcohol × hrs including 11 datasets <= .010. Finally, the Duration>.000 difference was <30 minutes in all datasets except one at 35 minutes (female, left arm, Full Meal After condition), including six within 10 minutes of each other, which was the time interval between raw BrAC readings in our protocol. As with Peak, the AUC and Duration>.000 difference scores showed no clear pattern of variation across the stomach content conditions.
The last three columns of Table 2 and Figures 2a (female) and 2b (male) show the eBrAC curves and fit indices. In most of the 16 datasets, the eBrAC curves mapped well onto the raw BrAC curve, and the sTAC curves mapped well onto the raw TAC curve. Goodness of fit across stomach content conditions were relatively similar, with percent of raw BrAC captured by the eBrAC 75% credible band ranging from 63–86% in the female and 60–91% in the male. L2 error showed the difference in the BrAC and eBrAC values was <=.020 in all but two datasets (female, left and right arms, No Meal condition), and Relative L2 error showed curve fits all below .40, including three below .20 and 9 datasets in the .20–.30 range. These results were consistent across the two devices worn by each participant. As with the summary scores, there was no indication the variability was linked to stomach content.
In a final set of analyses, we reran the BrAC Estimator software inversion phase for the three eating conditions using the q1* and q2* values obtained from the No Food condition for each of the four person-device pairs (see Figure 2c for the left arm TAC device results, which can be compared to the left columns of Figure 2a and 2b, and Supplemental Table 1 for numeric results). eBrAC curves and fits were largely consistent with fits when each session was run through the software separately, indicating the parameter values obtained in the fasting state, which is the protocol we have used in the past to calibrate the model parameters for each person-device pair, continue to produce relatively accurate eBrAC from TAC in drinking episodes with varied timing and quantities of stomach contents.
Discussion
This study examined the effect of stomach content on the BrAC-TAC relationship by comparing raw BrAC-TAC data, BrAC Estimator model parameters within device-person pair, and model output of eBrAC curves and summary scores. The confluence of evidence from these three approaches points to there not being a strong effect of stomach contents on the BrAC-TAC relationship or on our ability to model this relationship into eBrAC. Variation in peak BrAC across our eating conditions was consistent with well-established effects of stomach contents on peak BrAC [5, 23], although we did not see the expected delay in peak BrAC timing from eating [37] perhaps because of differences in our protocol that resulted in a steep ascending limb in all of our datasets.
As expected, we observed raw TAC score variations across the two participants and their devices, but the variability in TAC did not appear to be related to stomach content condition. Reductions in TAC Peak and AUC in the Meal Prior conditions mapped onto reductions in BrAC Peak and AUC, respectively, in most of the datasets. We also observed delayed time of peak TAC (but not BrAC) in some of the Meal Prior datasets. However, because the TAC curves often plateaued, which is expected due to diffusion process through the skin, it can be difficult to determine both the exact peak TAC time and its importance as a single time point. This effect of diffusion, along with different timing protocols for obtaining BrAC and TAC and use of different TAC device brands and models, also may explain some of the variability of peak BrAC-TAC lag times reported in prior studies [7, 9, 22]. Thus, comparing BrAC and TAC peak times may be a less meaningful indicator of how BrAC and TAC relate to one another than other summary scores such as peak and AUC.
The most important finding of this study is that, even with variations in TAC curves and TAC:BrAC ratios on summary scores across datasets for each person-device pair (including devices worn simultaneously), our mathematical models were able to produce relatively accurate eBrAC from raw TAC. The eBrAC curves accounted for variation in the shape and magnitude of the raw BrAC curves across drinking episodes, individuals, devices, and stomach content conditions, and model output eBrAC summary scores matched well with raw BrAC summary scores. Our models utilize the BrAC-TAC relationship for each person-device pair over the entire BrAC and TAC curves (both from .000 and back down to .000) to convert TAC into eBrAC, representing a loop from BAC to TAC and back only to estimates of BrAC, and thus do not include modeling the absorption of alcohol from the stomach and gut into the blood. Now, beyond the physiological rationale of the model, this study provides empirical evidence that our mathematical model is not substantially affected by BrAC variations that are due to stomach contents. The results of this study add to our confidence that our models do not need to be adjusted for stomach contents to produce temporally- and quantitatively-accurate eBrAC.
Given the small sample size of this study, we did not conduct statistical analyses, but future research with larger samples and sufficient power may reveal statistically significant differences across eating conditions. The effect sizes determined in these studies could then be used to understand the real-world importance of variations in stomach contents on the modeling of the BrAC-TAC relationship. This study serves as the first examination of this topic and provides initial evidence that stomach content does not appear to play a major role in the BrAC-TAC relationship or to greatly affect our ability to model TAC into eBrAC.
Our findings suggest that our efforts to model factors that substantially affect the BrAC-TAC relationship may be better focused on variables other than stomach content such as skin thickness and hydration, perspiration and electrodermal activity, and/or blood flow that may substantially change this relationship (see Figure 3 as an example of TAC increasing from 10 minutes of running). We also note, however, that some movement (e.g., walking) and changes in ambient conditions (e.g., going outside) that occurred after participants left the laboratory in this study did not greatly affect TAC levels or our model fit, indicating a robustness of the models for a given range of routine conditions. Additional research exploring factors that will vary outside of the laboratory is necessary to improve the accuracy of our mathematical models and BrAC Estimator software, especially given natural drinking conditions will introduce further variation and uncertainty into the model that must be captured for TAC to become a quantitative research tool.
Figure 3.
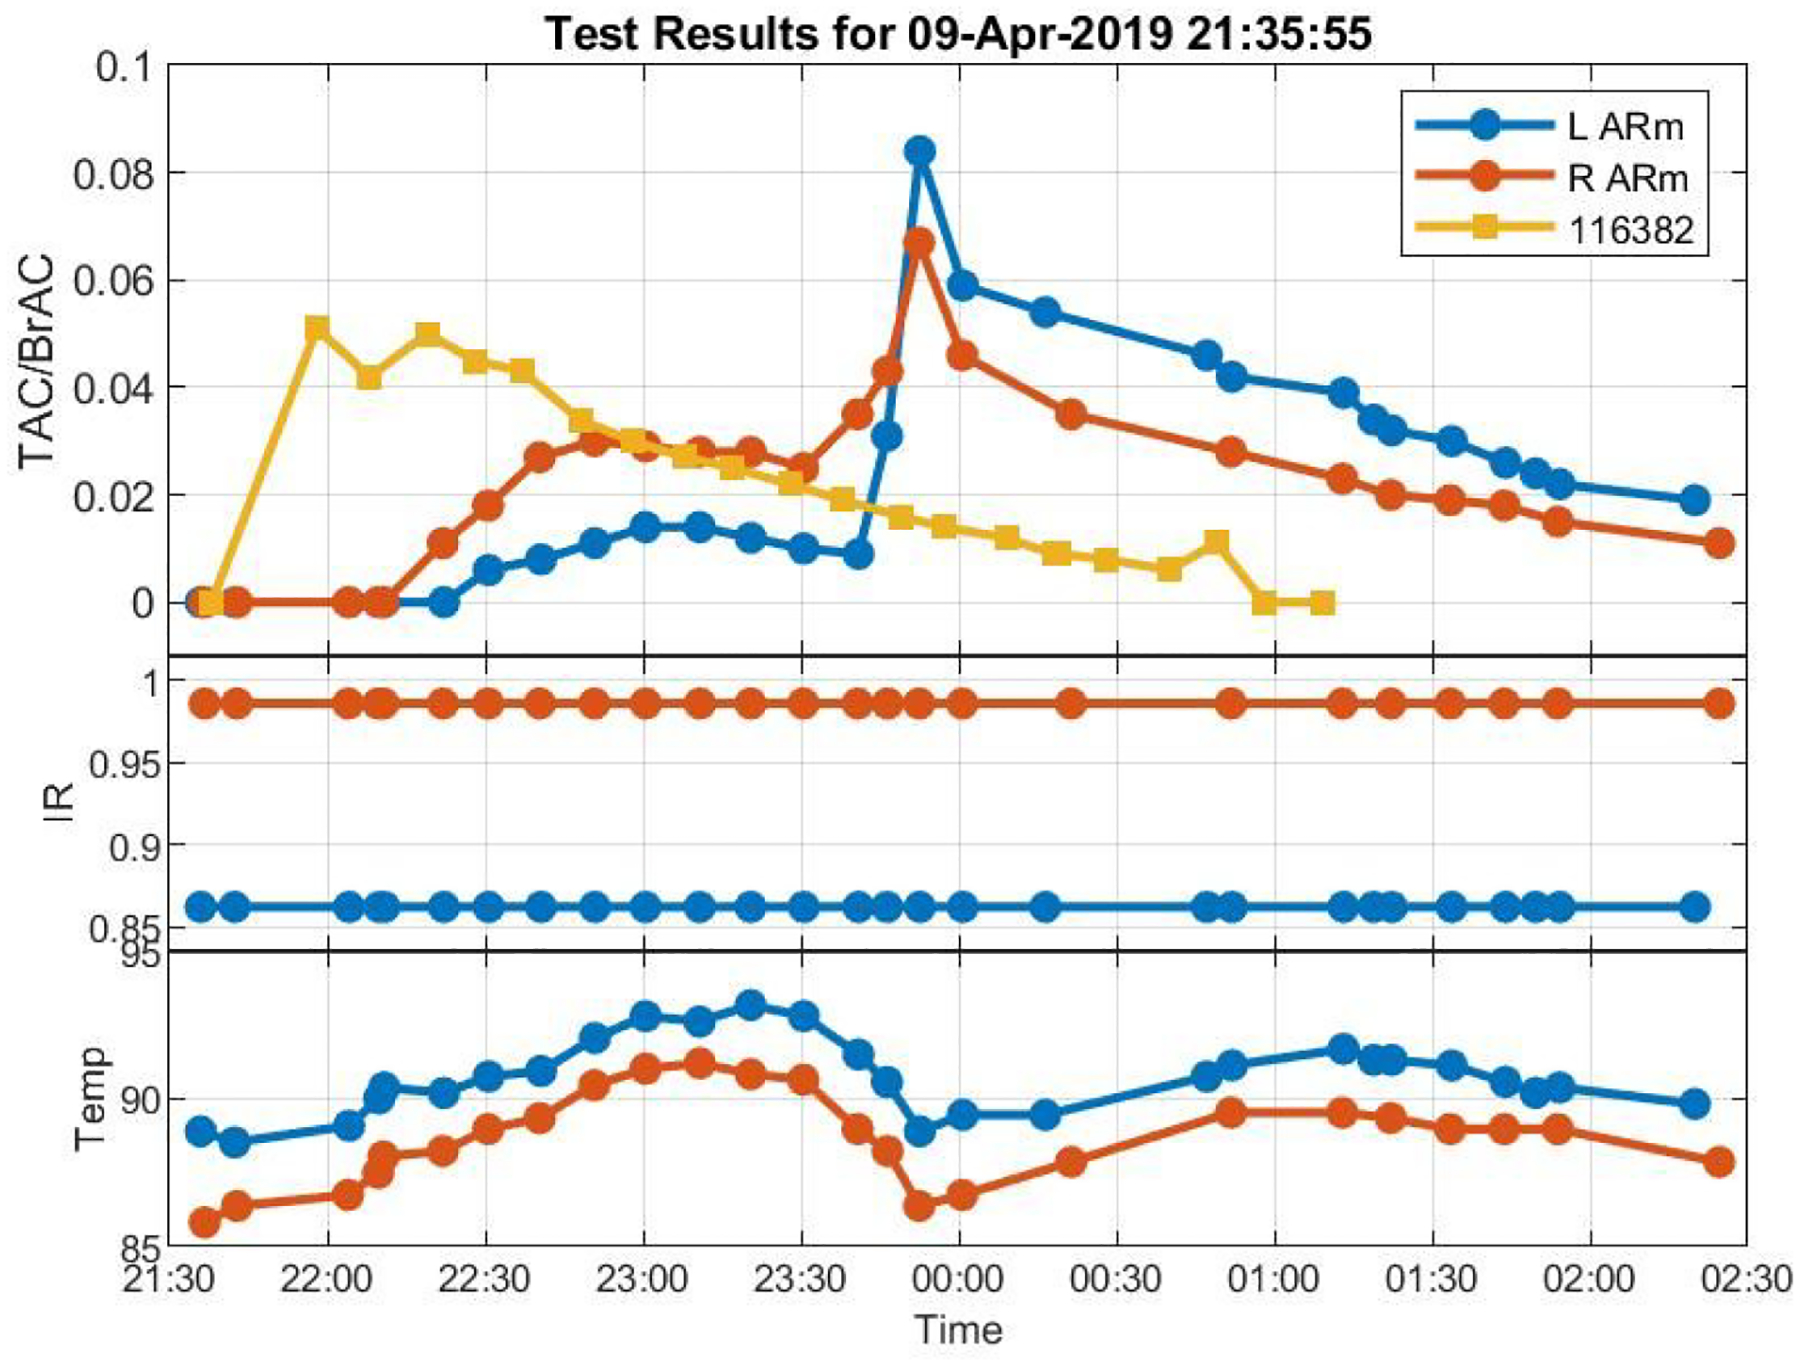
Raw BrAC and raw TAC curves showing an increase in TAC from 10 minutes of exercise half-way through descending limb of BrAC while infrared light (IR) indicates devices stayed properly adhered to the skin and ambient temperature (Temp) lowered from going outdoors.
Supplementary Material
Acknowledgments
This research was funded by National Institutes of Health grant R01AA26368. The funding source had no role in the study design; in the collection, analysis and interpretation of data; in the writing of the report; and in the decision to submit the article for publication. The authors alone are responsible for the content and writing of this paper. We thank Emma Ziegler for her earlier contributions to this study.
Declaration of interests:
This research was funded by National Institutes of Health grant R01AA026368.
Footnotes
Conflict of interest: None to declare.
Contributor Information
Emily B. Saldich, Department of Psychology, University of Southern California.
Chunming Wang, Department of Mathematics, University of Southern California.
I. Gary Rosen, Department of Mathematics, University of Southern California.
Jay Bartroff, Department of Mathematics, University of Southern California.
Susan E. Luczak, Department of Psychology, University of Southern California.
References
- [1].Luczak SE, Ramchandani VA. Special issue on alcohol biosensors: Development, use, and state of the field: Summary, conclusions, and future directions. Alcohol 2019;81:161–165. [DOI] [PubMed] [Google Scholar]
- [2].Swift RM, Swette L. Assessment of ethanol consumption with a wearable, electronic ethanol sensor/recorder. In: Litten RZ, Allen JP eds. Measuring alcohol consumption. Humana Press, Totowa, NJ. Totowa, NJ: Humana Press, 1992:189–202. [Google Scholar]
- [3].Cambell AS, Kim J, Wang J. Wearable electrochemical alcohol biosensors. Curr Opin Electrochem 2018;10:126–135. [DOI] [PMC free article] [PubMed] [Google Scholar]
- [4].Sirlanci M, Rosen IG, Wall TL, Luczak SE. Applying a novel population-based model approach to estimating breath alcohol concentration (BrAC) from transdermal alcohol concentration (TAC) biosensor data. Alcohol 2019;81:117–129. [DOI] [PMC free article] [PubMed] [Google Scholar]
- [5].Swift R. Direct measurement of alcohol and its metabolites. Addiction 2003;98:73–80. [DOI] [PubMed] [Google Scholar]
- [6].Fairbairn CE, Rosen IG, Luczak SE, Venerable WJ. Estimating the quantity and time course of alcohol consumption from transdermal alcohol sensor data: a combined laboratory-ambulatory study. Alcohol 2019;81:111–116. [DOI] [PMC free article] [PubMed] [Google Scholar]
- [7].Karns-Wright TE, Roache JD, Hill-Kapturczak N, Liang Y, Mullen J, Dougherty DM. Time delays in transdermal alcohol concentrations relative to breath alcohol concentrations. Alcohol Alcohol 2017; 52(1):35–41 [DOI] [PMC free article] [PubMed] [Google Scholar]
- [8].Luczak SE, Rosen IG. Estimating BrAC from transdermal alcohol concentration data using the BrAC Estimator software program. Alcohol Clin Exp Res 2014;38(8):2243–2252. [DOI] [PMC free article] [PubMed] [Google Scholar]
- [9].Marques PR, McKnight AS. Field and laboratory alcohol detection with 2 types of transdermal devices. Alcohol Clin Exp Res 2009;33(4):703–711. [DOI] [PubMed] [Google Scholar]
- [10].Sakai JT, Mikulich-Gilbertson SK, Long RJ, Crowley TJ. Validity of transdermal alcohol monitoring: fixed and self-regulated dosing. Alcohol Clin Exp Res 2006;30(1):26–33. [DOI] [PubMed] [Google Scholar]
- [11].Webster GD, Gabler HC. Feasibility of transdermal ethanol sensing for the detection of intoxicated drivers. Annu Proc Assoc Adv Automot Med 2007;51:449. [PMC free article] [PubMed] [Google Scholar]
- [12].Webster GD, Gabler HC. Modeling of transdermal transport of alcohol effect of body mass and gender. Biomed Sci Instrum 2008;44:361–6. [PubMed] [Google Scholar]
- [13].Labianca DA. The chemical basis of the breathalyzer, a critical analysis. J Chem Educ 1990;67:259–261. [Google Scholar]
- [14].Dumett M, Rosen IG, Sabat J, et al. Deconvolving an estimate of breath measured blood alcohol concentration from biosensor collected transdermal ethanol data. Appl Math Comput 2008;196:724–743. [DOI] [PMC free article] [PubMed] [Google Scholar]
- [15].Rosen IG, Luczak SE, Hu W, Hankin M. Discrete-time blind deconvolution for distributed parameter systems with dirichlet boundary input and unbounded output with application to a transdermal alcohol biosensor. Proceedings of 2013 SIAM Conference on Control and its Applications 2013;160–167. [Google Scholar]
- [16].Rosen IG, Luczak SE, Weiss J. Blind deconvolution for distributed parameter systems with unbounded input and output and determining blood alcohol concentration from transdermal biosensor data. Appl Math Comput 2014;231:357–376. [DOI] [PMC free article] [PubMed] [Google Scholar]
- [17].Sirlanci M, Rosen IG, Luczak SE, et al. Deconvolving the input to random abstract parabolic systems: a population model-based approach to estimating blood/breath alcohol concentration from transdermal alcohol biosensor data. Inverse Probl 2018;34(12):125006. [DOI] [PMC free article] [PubMed] [Google Scholar]
- [18].Sirlanci M, Luczak SE, Rosen IG. Estimation of the distribution of random parameters in discrete time abstract parabolic systems with un-bounded input and output: approximation and convergence. Commun Appl Anal 2019;23:287–329. [DOI] [PMC free article] [PubMed] [Google Scholar]
- [19].Sirlanci M, Luczak SE, Fairbairn CE, et al. Estimating the distribution of random parameters in a diffusion equation forward model for a transdermal alcohol biosensor. Automatica 2019;106:101–109. [DOI] [PMC free article] [PubMed] [Google Scholar]
- [20].Okubo A. Diffusion and ecological problems: mathematical models. New York: Springer-Verlag, 1980. [Google Scholar]
- [21].Barnett NP, Souza T, Rosen IG, Luczak SE, Glynn TR, Swift R. Transdermal Alcohol Sensor Data Macro (Version 1.3) Brown University, 2015. [Google Scholar]
- [22].Hill-Kapturczak N, Roache JD, Liang Y, Karns TE, Cates SE, Dougherty DM. Accounting for sex-related differences in the estimation of breath alcohol concentrations using transdermal alcohol monitoring. Psychopharmacol 2015; 232:115–123. [DOI] [PMC free article] [PubMed] [Google Scholar]
- [23].Gentry RT. Effect of food on the pharmacokinetics of alcohol absorption. Alcohol Clin Exp Res 2000;24(4):403–404. [PubMed] [Google Scholar]
- [24].Holt S Observations on the relation between alcohol absorption and the rate of gastric emptying. CMAJ 1981;124(3):267. [PMC free article] [PubMed] [Google Scholar]
- [25].Levine RR. Factors affecting gastrointestinal absorption of drugs. Am J Dig Dis 1970;15(2):171–188. [DOI] [PubMed] [Google Scholar]
- [26].Norberg Å, Jones AW, Hahn RG, et al. Role of variability in explaining ethanol pharmacokinetics. Clin Pharmacokinet 2003;42:1–31. [DOI] [PubMed] [Google Scholar]
- [27].Horowitz M, Maddox A, Bochner M, et al. Relationships between gastric emptying of solid and caloric liquid meals and alcohol absorption. Am J Physiol Gastrointest Liver Physiol 1989;257(2):G291–G298. [DOI] [PubMed] [Google Scholar]
- [28].Cortot A, Jobin G, Ducrot F, et al. Gastric emptying and gastrointestinal absorption of alcohol ingested with a meal. Dig Dis Sci 1986;31(4):343–348. [DOI] [PubMed] [Google Scholar]
- [29].Oneta CM, Simanowski UA, Martinez M, et al. First pass metabolism of ethanol is strikingly influenced by the speed of gastric emptying. Gut 1998;43(5):612–619. [DOI] [PMC free article] [PubMed] [Google Scholar]
- [30].Lim RT, Gentry RT, Ito D, et al. First-pass metabolism of ethanol is predominantly gastric. Alcohol Clin Exp Res 1993;17(6):1337–1344. [DOI] [PubMed] [Google Scholar]
- [31].Levitt MD, Levitt DG. The critical role of the rate of ethanol absorption in the interpretation of studies purporting to demonstrate gastric metabolism of ethanol. J Pharmacol Exp Ther 1994;269(1):297–304. [PubMed] [Google Scholar]
- [32].Hahn RG, Norberg Å, Gabrielsson J, et al. Eating a meal increases the clearance of ethanol given by intravenous infusion. Alcohol Alcohol 1994;29(6):673–677. [PubMed] [Google Scholar]
- [33].Ramchandani VA, Kwo PY, Li TK. Effect of food and food composition on alcohol elimination rates in healthy men and women. J Clin Pharmacol 2001;41(12):1345–1350. [DOI] [PubMed] [Google Scholar]
- [34].Svensson CK, Edwards DJ, Mauriello PM, et al. Effect of food on hepatic blood flow: implications in the “food effect” phenomenon. Clin Pharmacol Ther 1983;34(3):316–323. [DOI] [PubMed] [Google Scholar]
- [35].DiPadova C, Worner TM, Julkunen RJ, Lieber CS. Effects of fasting and chronic alcohol consumption on the first-pass metabolism of ethanol. Gastroenterology 1987;92(5):1169–1173. [DOI] [PubMed] [Google Scholar]
- [36].Jones AW, Jönsson KÅ, Kechagias S. Effect of high-fat, high-protein, and high-carbohydrate meals on the pharmacokinetics of a small dose of ethanol. Br J Clin Pharmacol 1997;44(6):521–526. [DOI] [PMC free article] [PubMed] [Google Scholar]
- [37].Sadler DW, Fox J. Intra-individual and inter-individual variation in breath alcohol pharmacokinetics: the effect of food on absorption. Sci Justice 2011;51(1):3–9. [DOI] [PubMed] [Google Scholar]
- [38].Luczak SE, Elvine-Kreis BJ, Shea SH, Carr LG, Wall TL. Genetic risk for alcoholism relates to level of response to alcohol in Asian-American men and women. J Stud Alcohol 2002;63:74–82. [PubMed] [Google Scholar]
- [39].Luczak SE, Rosen IG, Wall TL. Development of a real-time repeated-measures assessment protocol to capture change over the course of drinking episodes. Alcohol Alcohol 2015;50:1–8. [DOI] [PMC free article] [PubMed] [Google Scholar]
- [40].Schultz M. Spline analysis. Englewood Cliffs, NJ: Prentice Hall, 1973. [Google Scholar]
Associated Data
This section collects any data citations, data availability statements, or supplementary materials included in this article.