Abstract
Mass spectrometry imaging (MSI) of tissue implanted with silver nanoparticulate (AgNP) matrix generates reproducible imaging of lipids in rodent models of disease and injury. Gas-phase production and acceleration of size-selected 8 nm AgNP is followed by controlled ion beam rastering and soft-landing implantation of 500 eV AgNP into tissue. Focused 337 nm laser desorption produces high quality images for most lipid classes in rat brain tissue (in positive mode: galactoceramides, diacylglycerols, ceramides, phosphatidylcholines, cholesteryl ester, and cholesterol, and in negative ion mode: phosphatidylethanolamides, sulfatides, phosphatidylinositol, and sphingomyelins). Image reproducibility in serial sections of brain tissue is achieved within <10% tolerance by selecting argentated instead of alkali cationized ions. The imaging of brain tissues spotted with pure standards was used to demonstrate that Ag cationized ceramide and diacylglycerol ions are from intact, endogenous species. In contrast, almost all Ag cationized fatty acid ions are a result of fragmentations of numerous lipid types having the fatty acid as a subunit. Almost no argentated intact fatty acid ions come from the pure fatty acid standard on tissue.
Introduction
The use of metal particles as a matrix [1] was introduced at the inception of the MALDI technique using a microparticle powder of cobalt suspended in glycerol. Our group’s interest in using metal nanoparticulates as matrices emerged when implantation of 40 Kev Au4004+, (2.3 nm AuNP) from a liquid metal cluster ion source, was shown to enable reproducible SIMS and matrix implantation laser desorption/ionization (MILDI)-MS from standard films of lipids, peptides, and proteins [2–4]. MILDI-MS also detected lipids, blood related proteins, and peptides in brain tissue sections that had not been transcardially perfused prior to removal from rats [2–4]. Gold cluster ion currents, although proving the potential of the technique, were insufficient for implantation of the large areas necessary for organ imaging. More recently, an alternative method for homogeneous implantation of metal nanoparticulate ions into tissue enables reproducible MILDI-MS imaging after 500 eV implantation of 8 nm AgNP into heart [5], kidney [6], and brain [7, 8] unfixed cryostat sections. In the brain studies, MILDI-MS imaging was used to study injury and pathology in controlled cortical impact [7] and alcoholism [8] using rodent models.
Silver cation, a strong Lewis acid, has long been known to have a high affinity toward π-orbitals (such as in double bonds and aromatic π-clouds) when used in mass spectrometric techniques such as SIMS [9], MALDI [10, 11], ESI [12], and DESI [13]. Silver salt was used in laser desorption/ionization (LDI) by depositing a small layer of AgNO3 for the analysis of hydrocarbons in oil [14, 15]. In the past few years, several reviews demonstrated growing interest in silver nanoparticles (AgNP) [16] and gold nanoparticles (AuNP) [17] to facilitate LDI. AgNP were previously used in surface-assisted laser desorption imaging (SALDI) [18, 19] for drug analysis. Colloidal AgNP have been used to ionize peptides [20], and to separate and ionize small molecules from human plasma samples [21]. Application of silver nanoparticulate by mixing a solution of AgNP and a complex lipid mixture showed a preference for LDI of certain lipids, in particular, cholesterol [22]. Colloidal AuNP [23, 24] and AgNP [25] solutions have been sprayed on tissue sections to image several lipid classes, in particular cerebroside. However, metallic particles aggregate during and after spraying suspensions onto a tissue, so a uniform deposition necessary for imaging can be challenging. Evaporation of metal atoms (Ag or Au) onto tissue has recently been demonstrated as another technique for imaging lipids [26, 27].
Here we report the use of AgNP implantation for imaging rodent brains with emphasis on the use of brain tissue as a substrate for deposition of lipid standards prior to AgNP implantation. This procedure enables assignment of exact masses and structural fragmentation pathways of molecular and fragment ions produced for each brain lipid class. Adduct formation and fragmentation have been reported in positive and negative ion modes and may be used to determine if an ion represents an intact lipid species or is a fragment from a more complex lipid. MSI analysis of brain tissue implanted with AgNP shows the reproducibility and effectiveness of this technique for a wide range of lipid classes in the brain. Listings of proposed lipid identifications and corresponding ion masses are published in the Supplemental Materials for use by the imaging community in future studies.
Materials and methods
Chemicals:
Ethanol, methanol, and chloroform were from Sigma-Aldrich (St. Louis, MO). All solvents used were HPLC grade. Silver targets were 2” diameter x 0.125” thick disk of 99.99% pure silver, and purchased from Kurt J. Lesker Company (Clairton, PA). All lipid standards were from Avanti Polar Lipids (Alabaster, AL).
Tissue preparation:
All the animal works in this study abide by the Guide for the Care and Use of Laboratory Animals (NIH). Adult Sprague Dawley male rat brains were removed from the skull and frozen in dry ice chilled in pentane after perfusion with saline solution (Hospira, Lake Forest, IL, USA). The brain was attached to the cryostat specimen disk using ice slush made from distilled water. Frozen brain tissue was cut into thin sections (18 μm thickness) using a cryostat (Leica Microsystems CM3050S; Bannockburn, IL, USA) at −18 °C (cryochamber temperature) and −16 °C (specimen cooling temperature). Coronal tissue slices were directly deposited on a microscope slide (Thermo Fisher, Pittsburgh, PA, USA) and brought to room temperature in a nitrogen atmosphere to eliminate water condensation before transfer to the NPlanter (Ionwerks, Houston, TX, USA).
Lipid standards preparation:
Ceramide (Cer) 12:0/d18:1, galactoceramide (GalCer) 12:0/d18:1, sulfatide (ST)12:0/d18:1, sphingomyelin (SM) 12:0/d18.1, diacylglycerol (DAG) 14:0a/14:0, phosphatidic acid (PA)14:0a/14:0, phosphatidylcholine (PC)14:0a/14:0, phosphatidylethanolamine (PE)14:0a/14:0, phosphatidylglycerol (PG)14:0a/14:0, and phosphatidylserine (PS)14:0a/14:0, were purchased from Avanti Polar Lipids (Alabaster, AL, USA). Myristic acid (14:0) and triacylglycerol (TAG) 14:0a/14:0/14:0 were purchased from Sigma-Aldrich (St. Louis, MO, USA). These chains have been chosen because they are not abundant in brain tissue. Stock solutions were prepared at 5 mg/mL in chloroform:methanol (2:1 v/v); 0.5 μL of each lipid standard was deposited directly on brain tissue or on glass slide.
NP formation and implantation:
Tissue was implanted with an NPlanter utilizing argon as the process gas. A distribution of AgNP centered at 8 nm diameter (±1 nm FWHM) was produced in the device shown in Figure 1a. A 2 nanoampere ion current, rastered across 17 × 17 mm for 18 min, produces approximately four monolayers of 8 nm Ag nanoparticles, which are uniformly implanted at 500 eV into a tissue section. Typically, two tissue sections are implanted per run. NPlanter parameters (system vacuum and Argon flows, AgNP ion current, and particles size) are maintained from run to run to minimize variance in the amount of Ag implanted.
Figure 1.
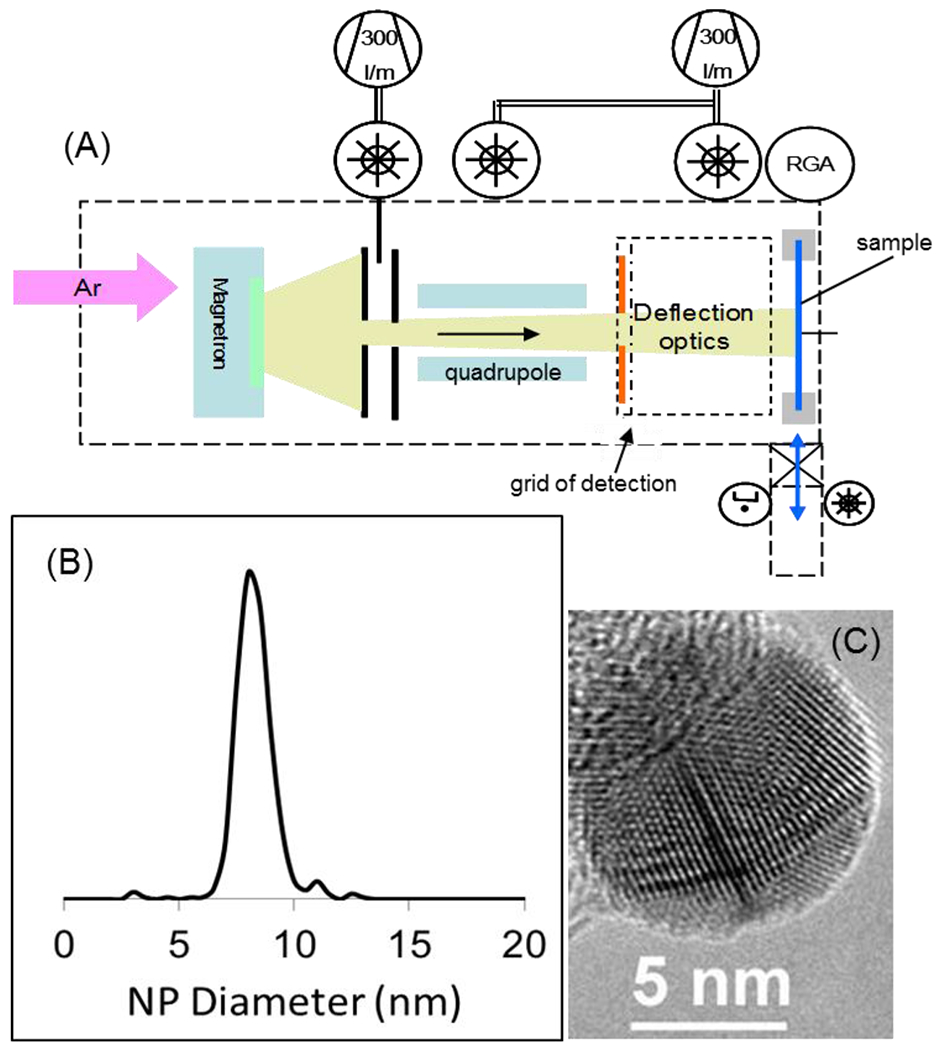
(A) Schematic of the Ionwerks nanoparticle implanter (NPlanter) system, (B) histogram of AgNP size (nm) derived from the diameters of 400 particles measured by TEM, and (C) a transmission electron microscope image of a typical AgNP on the edge of a Lacey Carbon film (Scale bar = 5 nm).
Mass Spectrometry:
A MALDI LTQ-XL-Orbitrap (Thermo-Scientific, San Jose, CA, USA) coupled with Imagequest and Xcalibur software was used for MALDI-MSI data acquisition and analysis. Images were collected in both negative and positive ion mode. The positive and negative ion mode mass range was 600–950 Da. The laser energy was adjusted to obtain a maximum normalized intensity of 1E7 counts (13 to 19 microjoule laser energy output through 2 or 3 neutral density filters) in the Orbitrap using a representative section of tissue. Three to four laser shots per pixel were used for positive and negative ion modes. No modifications to laser optics were made to correct for N2 laser beam profile inhomogeneity. The target plate stepping distance was set to 50 μm for both the X and Y directions by the MSI image acquisition software. Although there is possible overlap of laser shots across sample stage steps, we did not observe signs of oversampling such as smearing of pixels even with a step of 30 μm. Similar results were shown with organic matrices [28]. For the LTQ-XL-Orbitrap runs, the mass resolution was set to 30,000 for negative ion mode and to 60,000–100,000 for positive ion mode. All assignments were done with an error of less than 5 ppm and the major peaks for each lipid class were fragmented by MS/MS.
Transmission Electron Microscopy:
A JEOL JSM 2010F Transmission electron microscope fitted with a Gatan CCD camera, Gatan single point detector, and Oxford energy dispersive spectrometer operating at 200 KV was utilized to confirm the Ag nanoparticle size distribution and elemental content. Samples were prepared by concurrent AgNP deposition with specimens onto Lacey Carbon support films (Electron Microscopies Sciences, Inc., Hatfield, PA, USA). Particle size distributions were computed from a minimum of 400 individual particle diameters.
Results and Discussion
Characterization of AgNP and Implantation
Figure 1a shows a schematic of the NPlanter. For the implantation of Ag nanoparticles (NP) into tissue, the differentially pumped magnetron was fitted with a 2″ Ag magnetron target; ultra-high purity (UHP) argon serves as the process gas in which Ag atoms are ejected from the target by Ar+ ion bombardment, after which the Ag atoms condense with others into negatively charged nanoparticles. Instrument conditions are set to emphasize a 8-nm-AgNP diameter nanoparticle size distribution which is further sharpened by eliminating small AgNP ions with a quadrupole mass filter (shown in Figure 1a). The average size distribution histogram (Figure 1b) of the nanoparticles used in this study is derived from the diameters of 400 particles measured by TEM. Figure 1c shows a magnified TEM image of a representative 8 nm diameter AgNP demonstrating the typical sphericity and the single crystalline nature of the AgNP nanoparticles routinely used in these studies. The implication of these measurements is that the implantedNPs are pure Ag single crystalline structures when they enter the tissue. The particle beam can be deviated with electro-optics over 17 × 17 mm to cover coronal rat brain tissue sections. The measure of the negative current from the AgNP– arriving at a grid placed before the sample allows ±2% control of the AgNP ion current during implantation. Variations in the current and particle size during implantation of multiple samples is likely the largest contribution to the coefficient of variation when comparing lipid resolved successive images obtained on different days. The dryness of the method and lack of turbulent flow above the sample surface helps to maintain very high spatial resolution by avoiding any physical movement of molecules whether by diffusion or external force.
Lipid Ionization
In order to highlight the fragmentation and ionization pattern of lipids with AgNP, MILDI imaging experiments were conducted on thin sections of rat brain tissue spotted with lipid standard solutions and implanted with AgNP. The total ion image is obtained and then mass resolved images are numerically reconstructed. By setting regions of interest around the spotted lipid standard, the origin of a molecular ion uniquely are shown as either coming from the standard or coming from some larger precursor lipid ions. Standard solutions of ceramide (Cer), galactoceramide (GalCer), sphingomyelin (SM), sulfatide (ST), diacylglycerol (DAG), triacylglycerol (TAG). Phosphatidic acid (PA), phosphatidylcholine (PC), phosphatidylethanolamine (PE), phosphatidylglycerol (PG), phosphatidylinositol (PI), phosphatidylserine (PS), and myristic acid were deposited on a brain tissue section prior to silver implantation. Deposition of standards onto tissue better mimics the conditions of ionization for native brain lipids than when lipids are deposited directly on glass/stainless steel. We have observed more fragmentation and different ionization when standards were directly deposited on glass [5]. Table 1 contains the results from the standard deposited on the brain. The mass spectra for each lipid species is supplied in the Supplementary Data section (positive ion mode in Supplementary Figure 1 and negative ion mode in Supplementary Figure 2). As can be seen in Table 1, in positive ion mode lipids are detected mainly as cationized Na, K, and Ag peaks, whereas [M – H]− ions are the dominant species in negative ion mode. In the case of the positive ion, the main fragment observed has been reported.
Table 1.
Ions observed from analysis of lipids standards deposited on a brain tissue section after implantation of 4 monolayers of 8 nm AgNP.
| Lipid | Positive | Negative | |
|---|---|---|---|
| species | Positive ion Fragment | Cationization | |
| Cer | [Cer-H2O] Ag+ | Ag+ | ND |
| GalCer | [Cer-H2O] Ag+ | Na+, K+, Ag+ | ND |
| SM | [Cer-H2O] Ag+ | ND | (−CH2-H)− |
| ST | ND | ND | −H |
| DAG | ND | Na+, K+, Ag+ | −H |
| TAG* | [DAG-H2O] Ag+ | Ag+ | −H |
| PA** | ND | (−H+AgK)+ | −H |
| PC | [DAG-H2O] Ag+ | K+, Ag+ | (−CH2-H)− |
| PE | [DAG-H2O] Ag+ | K+, (−H+NaK)+, (−H+2K)+, (−H+AgK)+ | (−H)−, (+AgCl-H)− |
| PG* | [DAG-H2O] Ag+ | (−H+2K)+, (−H+AgK)+ | ND |
| PI | ND | ND | −H |
| PS | ND | ND | ND |
| Myristic acid** | ND | Ag+ | (−H)− |
PG and TAG are observed only from standards because their levels in brain tissue are typically below the limit of detection.
PA and myristic acid can also be a fragment from other lipids.
ND means not detected.
Unsuitablity of [M-H2O] Ag+ water loss ion for imaging Endogenous Cer and DAG and M Ag+ for imaging endogenous free fatty acids
Figure 2 shows the fragmentation of each of the lipid standards in separate MALDI-MSI images from the same standard spotted rat brain section. The fatty acid (acyl group) for each lipid standard was 14:0 (myristic acid). As seen in Figure 2a, ovals schematically show the locations of all spotted lipid standards: myristic acid (FA), DAG, TAG, PC, PE, PA, PG, and PS standard. FA 14:0+Ag (Figure 2b) was detected at every lipid standard spot, indicating that its origin is not from free fatty acids but as a fragment from any complex lipid species that has this acyl group in its fatty acid backbone. A similar result was obtained in negative ion mode (Supplementary Figure 3) except that the mass peak was FA 14:0-H. Therefore, images of intact fatty acids using implanted AgNPs do not represent the distribution of free fatty acids since these ions arise as fragments from the numerous complex lipids with the fatty acids in their backbone. The Ag cationized fatty acid ions were previously detected with sprayed AgNP [23] tissue; however, the authors, using appropriate caution, deferred from claiming an image of free fatty acids and pointed out the possibility of the fragmentations, which we have documented in Figure 2. One solution to imaging free fatty acids may be on-tissue derivatization of the endogenous free fatty acid [28] prior to AgNP implantation.
Figure 2.
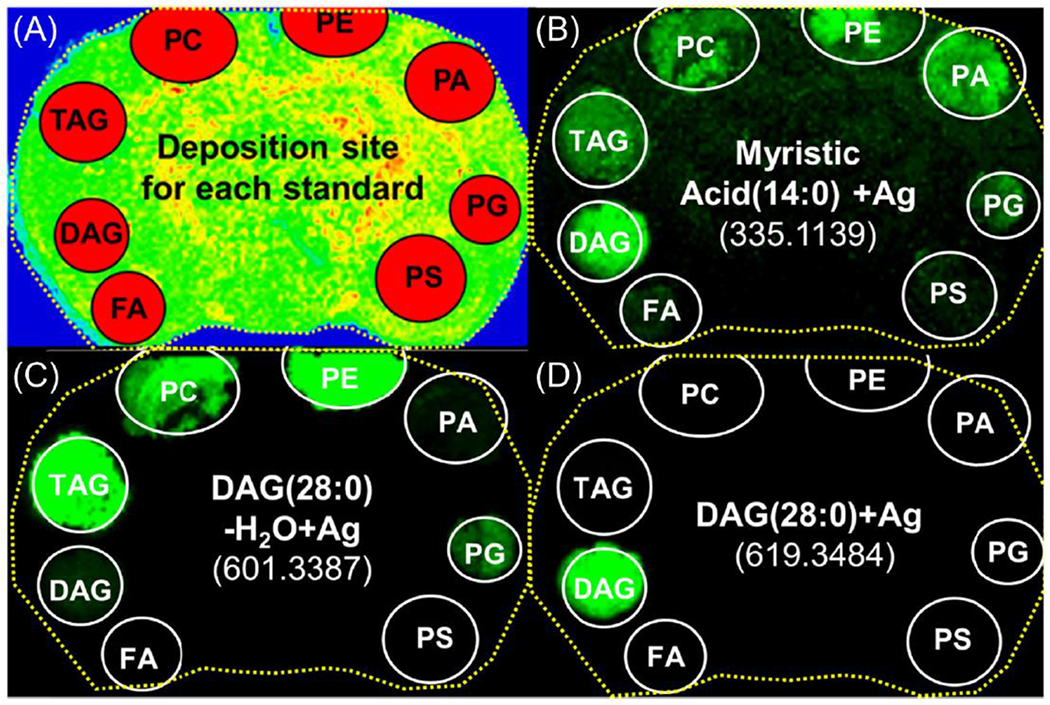
Positive ion mode MALDI images from deposited lipids on a rat brain section. (A) Shows the deposition site of each standard. Images were extracted: (B) myristic acid (14:0) Ag+, m/z 335.1139, (C) [DAG(28:0)-H20] Ag+, m/z 601.3387, and (D) DAG(28:0) Ag+, m/z 619.3484.
DAG is the backbone for glycerophospholipids. Figure 2c shows the MALDI image for [DAG-H2O] Ag+ (m/z = 601.3387). This fragment ion can be produced by three different mechanisms: (1) the loss of the head group from any glycerophospholipids (PC, PE, PA, PG, PS), (2) the loss of an acyl chain from TAG, (3) the loss of water directly from DAG that yields a very minor peak. However, the mass peak corresponding to DAG Ag+ (m/z = 619.3484) is only observed in the DAG standard spot (Figure 2d), thus allowing for the imaging of intact endogenous DAG species. PAs have also been studied in positive and negative ion mode and can be produced from other glycerophospholipids, in particular PE, PC, and PG (Supplementary Figures 1E and 2C).
A second MSI lipid standard experiment for Cer is documented in Figure 3. The tissue was spotted with equimolar amounts of four major classes of sphingolipids with the same 12:0/d18:1 backbone. The location of the pure Cer, GalCer, SM, and ST films are shown schematically by ovals in Figure 3a. In Figure 3b, a MALDI image of the ion at m/z 750.4069 [GalCer 12:0/d18:1] Ag+ shows that this ion is only detected where the GalCer standard was deposited, which eliminates the possibility that any of the GalCer Ag+ ion came from ST fragmenting to GalCer (by loss of sulfate from ST). In Figure 3c, by contrast, Cer 12:0/d18:1-H2O Ag+ at m/z 570.3425 has three different origins in order of decreasing intensity: (1) water from Cer, (2) fragmentation of GalCer in which Cer is a subunit, and (3) the loss of the phosphocholine head group from SM.
Figure 3.
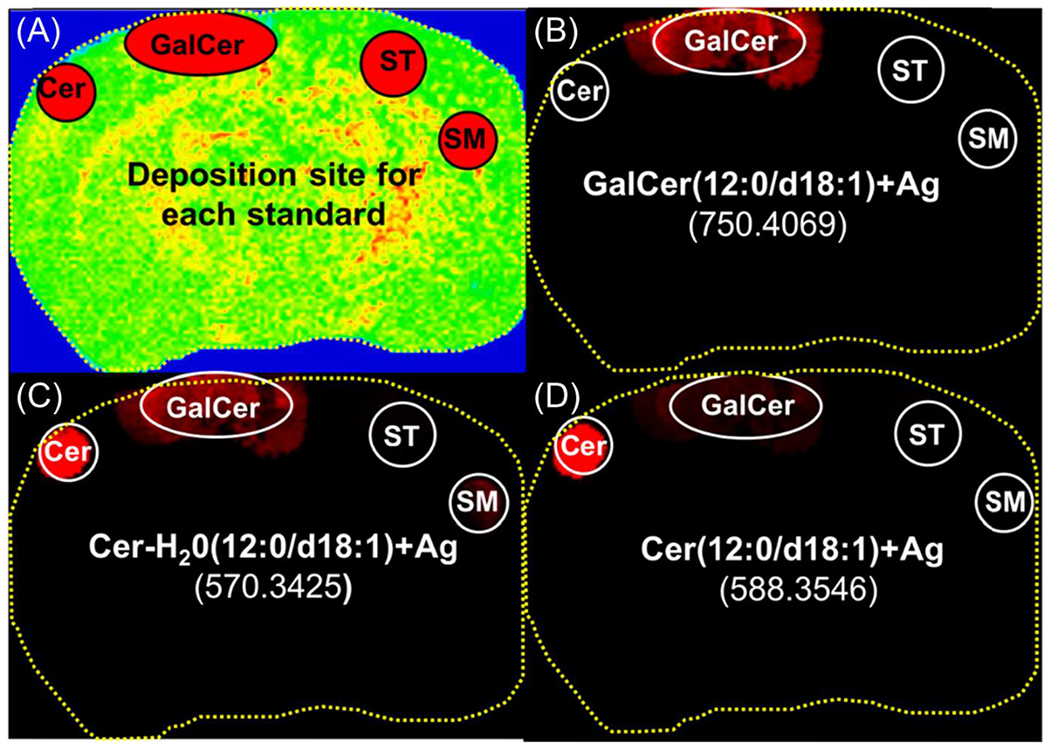
Positive ion mode MALDI images from deposited lipids on a rat brain section. (A) shows the deposition site of each standard. Three images were extracted: (B) GalCer (12:0/d18:1)+Ag, m/z 750.4069 (C) [Cer (12:0/d18:1)-H2O] Ag+, m/z 570.3425 and (D) Cer (12:0/d18:1)+Ag, m/z 588.3546
Figure 3d contains the MALDI image for [Cer 12:0/d18:1] Ag+ (m/z = 588.3546), which comprises most of the intensity from that Cer standard spot. However, a small intensity of Cer Ag+ (less than 4% integrated intensity compared with the base peak Cer+Ag) comes from fragmentation of GalCer. Nevertheless, [Cer 24:0(OH)/d18:1] Ag+ is not observed from the most intense GalCer in brain, indicating that there is little fragmentation of native GalCer to Cer in tissue sections. However, additional caution is necessary when hydroxylated GalCers are considered, as these species may form a structural isomer of a ceramide by losing galactose while remaining hydroxylated. This point will be emphasized later by comparing MS imaging of Cer 24:1/d18:1 and interference from Galcer24:0(OH)/d18:1 fragment in brain tissue.
Assignment of Lipid Species Detected by AgNPs in Rat Brain
Rat brain tissue sections were implanted with AgNPs and analyzed in both positive and negative ion mode. Average mass spectra were generated by summing all the pixels in the MSI run and were used for lipid assignments. Figure 4 shows the positive ion mode spectrum of a rat brain tissue section that has been divided into two different mass ranges. In the 770–950 Da mass range (Figure 4a), the major lipid species observed are PEs and GalCers formed by cation adduction of silver, sodium, or potassium. GalCers are highly localized in white matter and are primarily detected as silver adducts, but are also detected as sodium and potassium adducts formed from the endogenous salt concentration in brain tissue. PEs are distributed in both white and grey matter depending on their fatty acids chain length. PEs were mainly detected as mass peaks with the loss of hydrogen and the addition of two cations (−H+2K, −H+2Na, −H+NaK, −H+AgK, etc.). The structure of PE may not easily accommodate two cations as large as silver; therefore, it ionizes better using endogenous salts that are smaller and present in high concentrations in brain tissue. Ionization of PE with two cations and a loss of hydrogen has been reported with a number of cations, such as lithium [29] or cesium [30]. A few of the most abundant PCs were observed as +Ag and +K adducts. However, despite the high abundance of PCs in brain tissue, these mass peaks were very low in intensity due to nanoparticle matrices preference for ionizing more neutral lipids [5, 6, 23].
Figure 4.
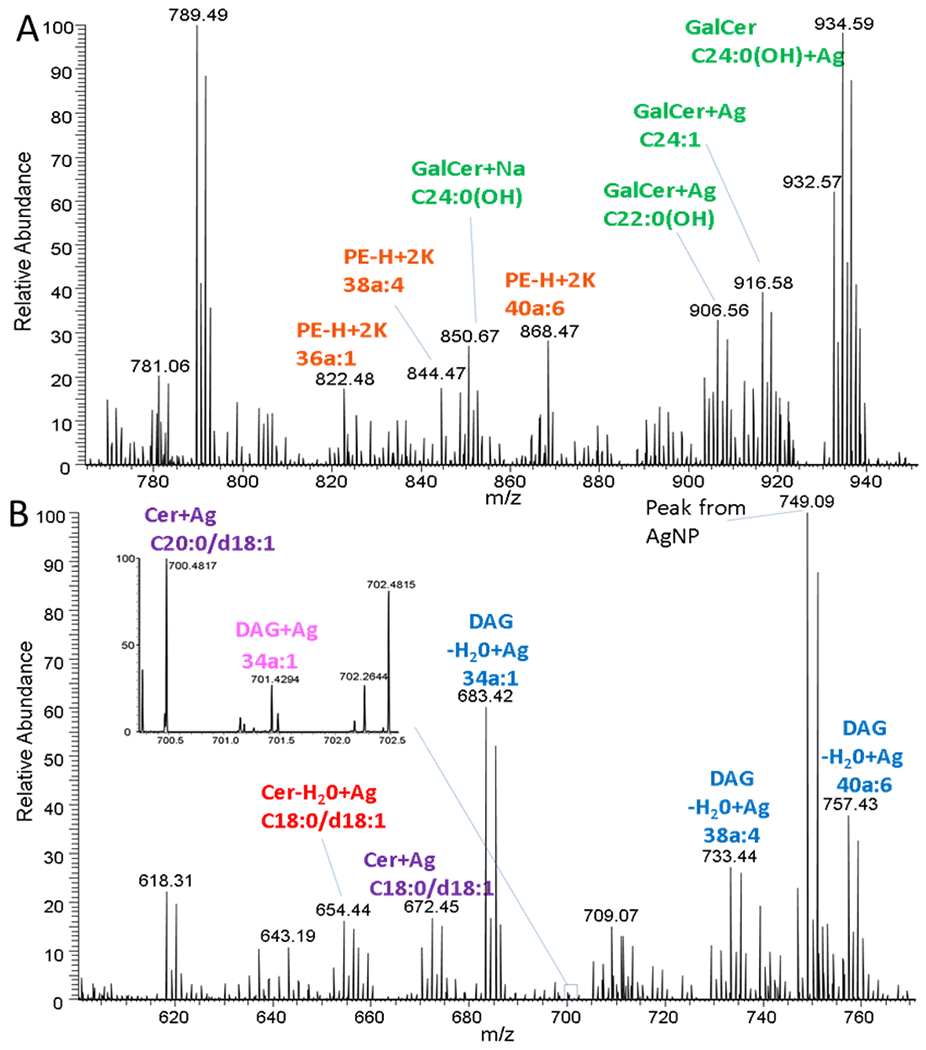
MALDI average mass spectrum from a rat brain, implanted with silver nanoparticles, acquired in positive ion mode with a MALDI-LTQ-Orbitrap-XL at different mass ranges. (A) 770-950 Da (B) 600-770 Da. GalCers have been consider as sphingosine base d18:1 only the fatty acid chain has been reported in the figure.
In the 600–770 Da range, Cer, DAG, Cer-H2O, and DAG-H2O were detected as silver adducts (Figure 4b). Additionally, cholesterol adducted with three silver atoms and cholesteryl esters (CE) plus one silver atom were observed as minor peaks. The assignment of M+Ag3 for cholesterol has been discussed in an earlier study [6]. The major peak for cholesterol is a plus one silver atom adduct. However, due to acquisition software memory limitations, the m/z range for cholesterol +Ag was omitted during imaging to reduce file size. Globally, in positive ion mode, 14 Galcer, 9 DAG, 5 Cer, 2 CE, 2 PC, and cholesterol were imaged (Supplementary Figure 4). A list of all species identified in the mass range 600–950 can be found in supplementary data (Supplementary Table 1). From this list, numerous peaks were not imaged for several reasons: they gave redundant information (e.g., PE imaged in negative, Galcer cationization with sodium and potassium), fragments from different origin (e.g.,DAG-H2O, Cer-H2O) or too low intensity to be imaged (e.g., PC 34:0 Ag+).
In negative ion mode, numerous lipids were identified, such as STs, PIs, Pes, and SMs. The average mass spectrum from the negative ion mode for a rat brain section is shown in Supplementary Figure 5. As with organic matrices, the lipid species are mainly deprotonated ions with only a few species (PAs and PEs) forming adducts with silver and chloride (M+AgCl−H)−. The species detected with AgNP are similar to those previously imaged by ion mobility MS using sprayed 5 nm gold nanoparticles matrices [23]. However, silver nanoparticles also ionize PE and SM fragments [e.g., SM-(CH2)]. This fragmentation of SM has been reported in MALDI negative ion mode using 9-aminoacridine matrix [31]. Globally, 25 PEs, 15 STs, 5 PIs, and 9 SMs were imaged and are presented in the supplementary data (Supplementary Figure 4) along with a list of peaks assignments in negative ion mode (Supplementary Table 2).
Reproducibility
One of the major challenges of MALDI imaging is the deposition of a reproducible matrix coating on the tissue. If the coating is not reproducible and homogenous, it introduces high variability in signal intensity from section to section. One way to diminish variation in signal intensity is to divide by the total ion count (TIC); however, this method can over-amplify the intensity in regions with a general low level of lipids [32] and, in addition, dividing by TIC becomes problematic if there is asymmetry in the tissue caused by disease or injury. In the following images, we plot the raw intensity of each of the mass resolved lipid ion signals under the assumption that we implant the same amount of AgNP into the near surface region of each tissue. To test the reproducibility of ion signal from AgNP implanted tissues, four successive rat brain tissue sections from level +1.6 mm re: bregma were implanted with AgNPs and imaged in positive ion mode, using the same parameters to test the repeatability of the AgNP implantation. The intensities of peaks across the whole brain section (raw counts without normalization by TIC) were extracted and a variability was calculated for each of the major species in each lipid class.
Table 2 shows the average variability by lipid class and cationization. An expanded table is provided in the supplementary data (Supplementary Table 3). For all lipid classes and cationization, the variation of the statistical distribution of ion species across tissue section sampling sites was relatively low, so that there was less than 20% variation in the mean, median, 75th percentile, or 90th percentile of the observations. The major factor inducing variation was the type of cationization of the lipid. Species consisting of potassium or sodium adducts had the highest amount of variation, whereas species with silver adducts had lower variation (<10%). Images of PE and GalCer with different cationization are shown, respectively, in Figures 5 and 6. Both potassium and sodium are native elements in the brain and the increase of variation can most likely be attributed to biological or surface impurity variation of alkali. However, silver is not native to the brain and is only being introduced by implantation; thus, the variation for silver adducts can only be attributed to variation in the implantation and/or the analysis (MILDI) method. This result shows the high reproducibility of AgNP implantation and the advantage of using silver adducts instead of potassium and sodium adducts.
Table 2.
Variation in mean and quantiles of peak intensity distributions from four serial tissue sections, by lipid class (three lipids/classification) and by cationization.
| Lipid Class | Average Coefficient of Variation of Mean | Average Coefficient of Variation of Median | Average Coefficient of Variation of 75th Percentile | Average Coefficient of Variation of 90th Percentile |
|---|---|---|---|---|
|
| ||||
| Cer-H20(Ag) | 8.2 % ± 1.8 % | 8.5% ± 1.9% | 6.8% ± 1.6 % | 6.0% ± 1.9 % |
|
| ||||
| Cer (Ag) | 9.5 % ± 3.5 % | 11.5% | 11.8% ± 1.7 % | 11.8% ± 1.0 % |
|
| ||||
| DAG (Ag) | 9.0 % ± 0.8 % | [zeros] | 8.9% ± 5.4 % | 3.5% ± 0.4 % |
|
| ||||
| GalCer(Ag) | 3.6 % ± 1.0 % | 4.5% ± 0.6 % | 3.3% ± 0.5 % | 3.2% ± 0.6 % |
|
| ||||
| GalCer(Na) | 17.1% ± 4.5 % | 15.4%± 1.0 % | 15.4 %± 1.9 % | 14.4%± 1.0 % |
|
| ||||
| GalCer(K) | 16.3 % ± 4.7 % | 12.8%± 0.5 % | 11.2 %± 2.1 % | 13.8%± 0.5 % |
|
| ||||
| PE(AgK) | 9.6 % ± 2.9 % | 11.1%± 3.1 % | 9.6%± 2.5 % | 9.4%± 1.5 % |
| PE(NaK) | 15.0 % ± 0.8 % | 17.0%± 1.8 % | 12.7%± 0.8 % | 12.9%± 1.0 % |
| PE(2K) | 15.0 % ± 2.0 % | 16.6%± 2.4 % | 15.3%± 2.0 % | 15.5%± 1.6 % |
The mean, median, 75th percentile and 90th percentile were calculated for single ion species in the imaging data set from each section (n=39517, 40930, 41473, or 43341 samples/section). Coefficients of variation were then calculated for each metric across sections. This table contains the mean and standard deviation of the coefficients of variation across three species in each lipid class
Figure 5.
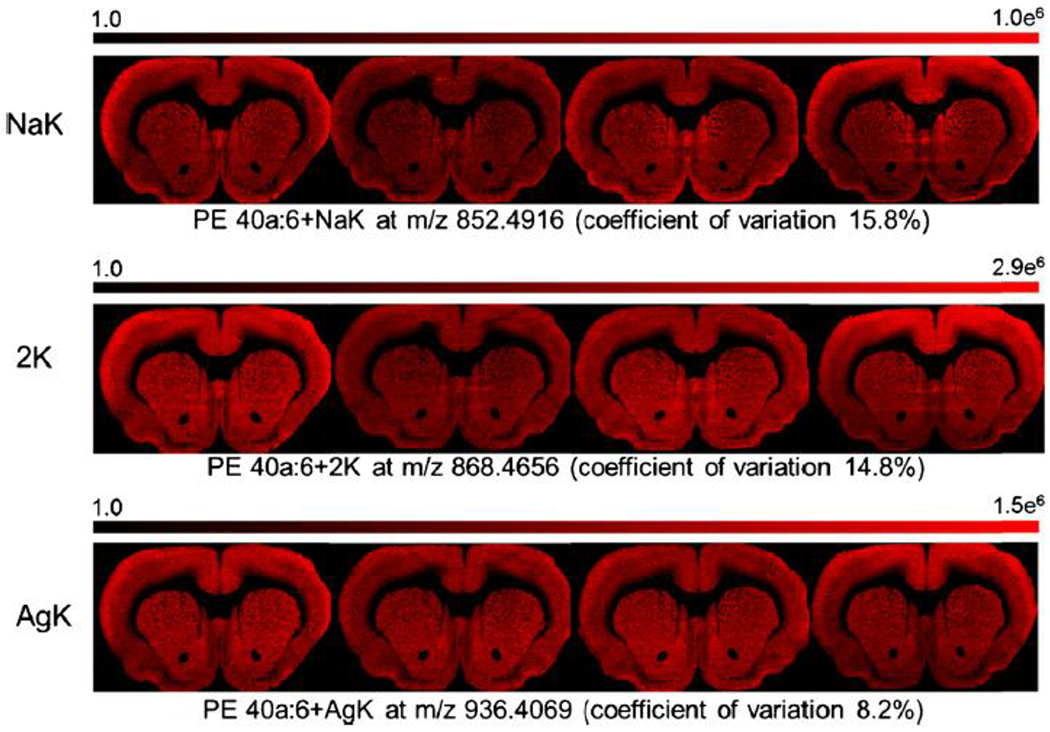
Distribution of PE 40a:6 with different cationization for four serial tissue sections and coefficient of variation calculated on the average signal of the section.
Figure 6.
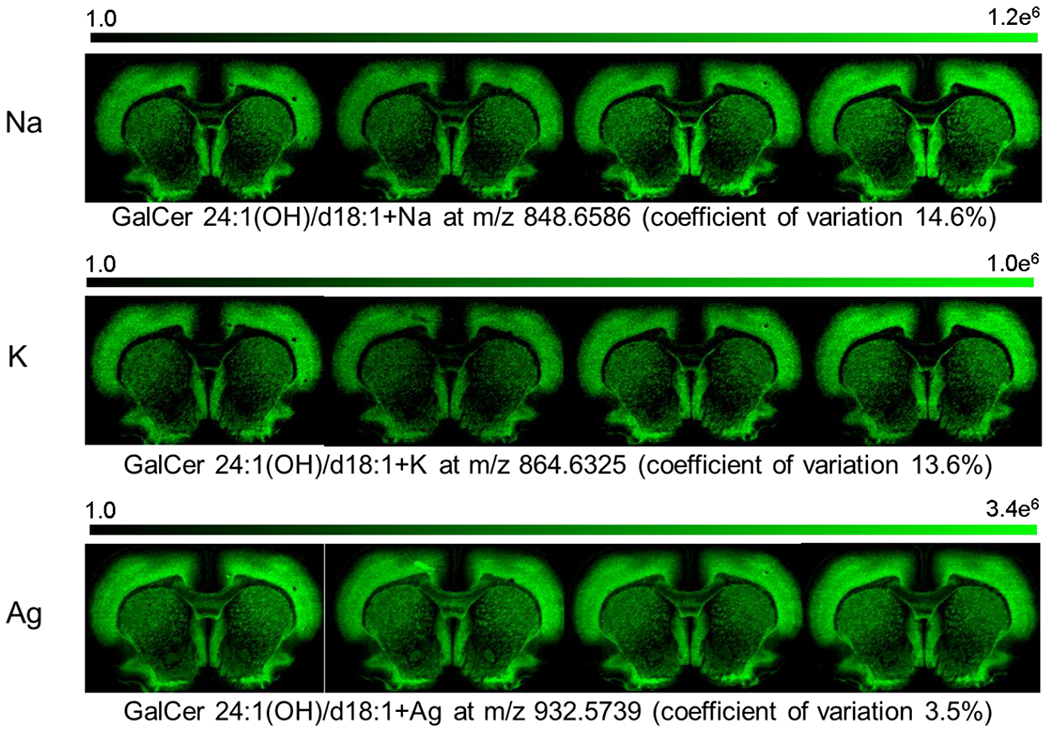
Distribution of GalCer 24:1(OH)/d18:1 or 24:0(OH)/d18:2 with different cationization for four serial tissue sections and coefficient of variation calculated on the average signal of the section.
Imaging
In combination with histology, mass spectrometry provides information about the molecular composition of brain regions. Figure 7 shows images from two consecutive rat brain sections, at level −2.04mm re: bregma. They were implanted with AgNP and one was imaged in positive (Figure 7a–e) and the other in negative ion mode (Figure 7f–l).
Figure 7.
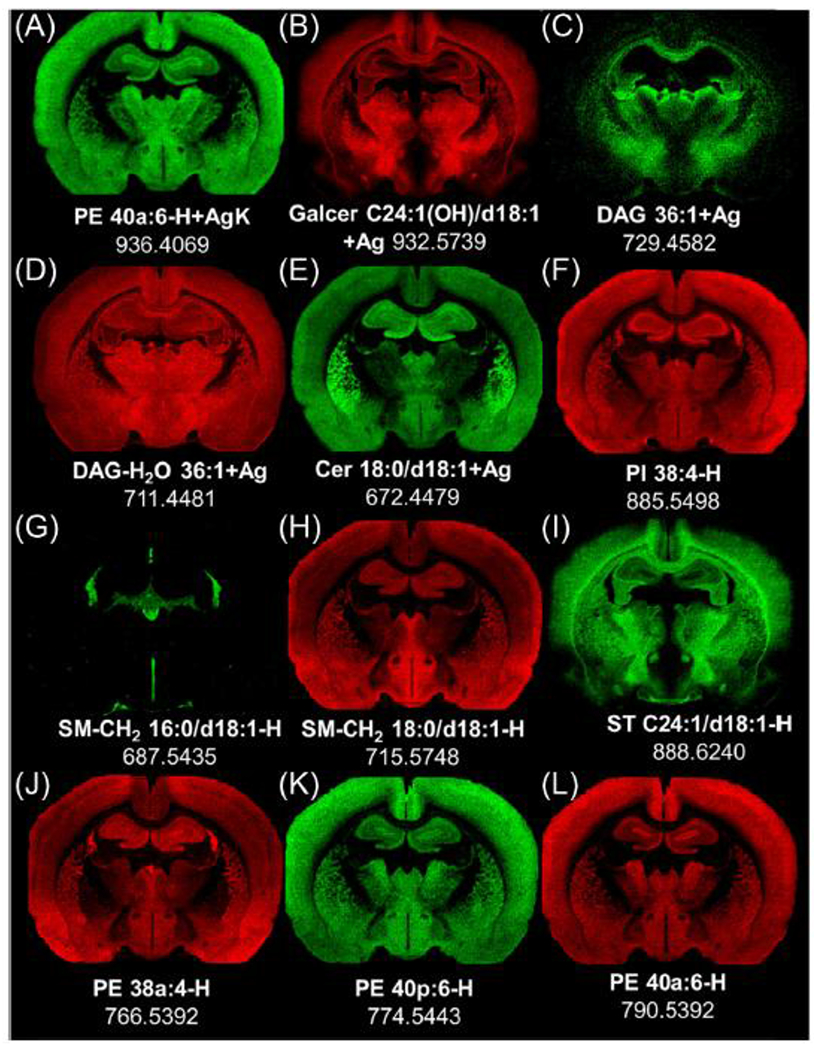
Distribution of different lipids by mass imaging in positive (A-E) and negative (F-L) ion mode images from two serial rat brain frozen sections at level −2.0 mm re: Bregma.
The ion species PE 40a:6 is distributed in the same pattern in both positive (Figure 7a) and negative (Figure 7l) ion modes. Note its confinement to grey matter of the cortex, part of the hippocampus, thalamus, and hypothalamus, and its conspicuous absence in white matter. Thus, MILDI with AgNPs demonstrates an identical pattern of PE40a:6 in positive and negative ion modes in adjacent sections.
All of the identified GalCer species showed a distribution that overlapped partially with the PE species in the cerebral cortex and caudate-putamen, but with considerably greater distribution in regions associated with the medial forebrain bundle and diagonal band of Broca and corpus callosum (e.g., GalCer 24:1(OH)/d18:1 (Figure 7b). DAG 36:1 (Figure 7c) and DAG-H2O 36:1 (Figure 7d) are found in different regions of the brain. This is consistent with the results from DAG standards on brain in Figure 3 and confirms that DAG-H2O does not result from the fragmentation of the DAG but rather from other glycerophospholipids (mainly PE and PC in the brain). For example, in the specific case of DAG-H2O 36:1, PC 36:1 is mainly found in white matter [33, 34] and has the same distribution of DAG-H2O 36:1. Therefore, the distribution of DAG-H2O 36:1 can be mainly attributed to the fragment from PC 36:1. In positive mode, Cer was observed as an intact species (see Figure 7e) with a conspicuous concentration in the caudate-putamen.
An adjacent section of the same brain was imaged in negative ion mode (Figure 7f–l). PI 38:4 (Figure 7f) is localized predominantly in grey matter lipid, but is more abundant in the choroid plexus of the lateral ventricle, the dentate gyrus granular layer, and the pyramidal layer of the hippocampus. SMs have different distributions, depending on the chain length of their fatty acid. SM 16:0/d18:1 (Figure 7g) is relatively abundant in regions associated with ventricular system, such as ependyma and choroid plexus, whereas SM 18:0/d18:1 (Figure 7h) has a grey matter distribution. STs are located, independently of their chain length, in the major myelinated fiber tracts of the brain. The distribution of ST C24:1/d18:1 (Figure 7i) is representative. Finally, different PE species were localized differentially in gray matter and the choroid plexus, as illustrated by images for PE 38a:4 (Figure 7j), PE 40p:6 (Figure 7k), and PE 40a:6 (Figure 7l). The three PEs show different regional abundances in the cerebral cortex, piriform lobe, hypothalamus, and dorsal thalamus; PE 38a:4 is also present in the choroid plexus of the lateral ventricles. PE distribution varies depending of the chain length and how the chain is attached (p = plasmalogen, a = diacyl). The distributions of almost 90 lipids in these images are provided in the supplementary data Figure 4.
Imaging of Ceramides
Ceramides are one of the most important classes of lipids as they are precursors and lipid breakdown products of sphingolipids, gangliosides, and cerebrosides [35]. Cers have also been implicated in a broad range of cellular processes associated with inflammation [8], tumor [36], and cell death [37]. Obtaining their distribution can be difficult due to their low abundance in the brain. Furthermore, using organic matrices is challenging because the intact molecular ions [Cer+H]+ are not readily observed in brain tissue, which requires investigators to infer the Cer location from [Cer−H20+H]+ water loss ions [38–40].
The regional distribution of brain ceramides (Figure 8) varies with the chain length of their fatty acid (similar to the SM-CH2 results in Figure 7g and h, and Supplementary Figure 4 of the supplementary data). The short chain length Cer (16 carbons) are associated with choroid plexus and tela choroidea in the ventricles (Figure 8a). The ceramide species with 18–20 carbon fatty acid chains are distributed in grey matter, Cer 18:0/d18:1 (Figure 8b), and Cer 18:1/d18:1 or 18:0/d18:2 (Figure 8c) have a high abundance in the hippocampus and caudate putamen. Cer 20:0/d18:1 (Figure 8d) is more evenly distributed in the thalamus, cortex, and hippocampus. The observed distribution for these ceramides is different than the distinct spatial distribution in white matter of the GalCers species (Figure 7b and Supplementary Figure 4 of the supplementary data); thus, they are highly unlikely to be fragments from GalCers species.
Figure 8.
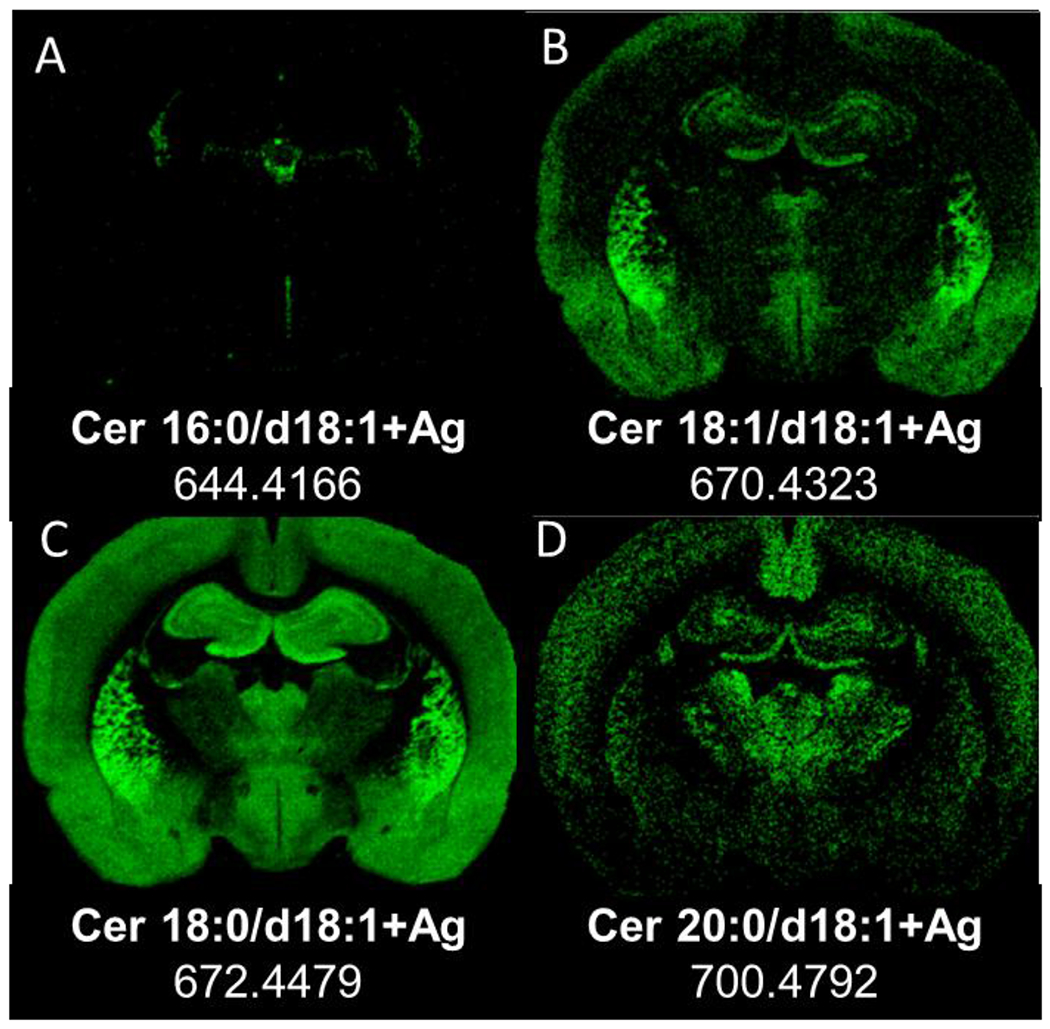
Distribution of ceramides by mass imaging at level −2.0 mm re:Bregma in positive ion mode in a rat brain section, resolution 60,000 at 400 u. Images were extracted: (A) Cer 16:0/d18:1+Ag, 644.4166, (B) Cer 18:1/d18:1+Ag, m/z 670.4323 (C) Cer 18:0/d18:1+Ag m/z 672.4479 and (D) Cer 20:0/d18:1+Ag, m/z 700.4792.
Imaging of Cer 24:1/d18:1 and interference from Galcer24:0(OH)/d18:1 fragment.
Figure 9a shows that Cer 24:0/d18:1 m/z 756.5420 is distributed mainly in the choroid plexus. The highly vascular choroid plexus is easily recognizable after implantation (Supplementary Figure 6). Surprisingly, the signal at m/z 754.5262 (Figure 9b) supposedly from the intact Cer 24:1/d18:1 or 24:0/d18:2, is mainly localized in white matter. However, another form of this species is possible with the same m/z, corresponding to [Cer 24:0(OH)/d18:1-H2O] Ag+. This structure could be produced by the loss of galactose head group from GalCer 24:0(OH)/d18:1. As seen from the GalCer standard tested Figure 3c, Cer-H2O+Ag fragment is easily produced. Hence, GalCer 24:0(OH)/d18:1, the most abundant GalCer detected in the brain with AgNP, would be expected to form [Cer 24:0(OH)/d18:1-H2O] Ag+.
Figure 9.
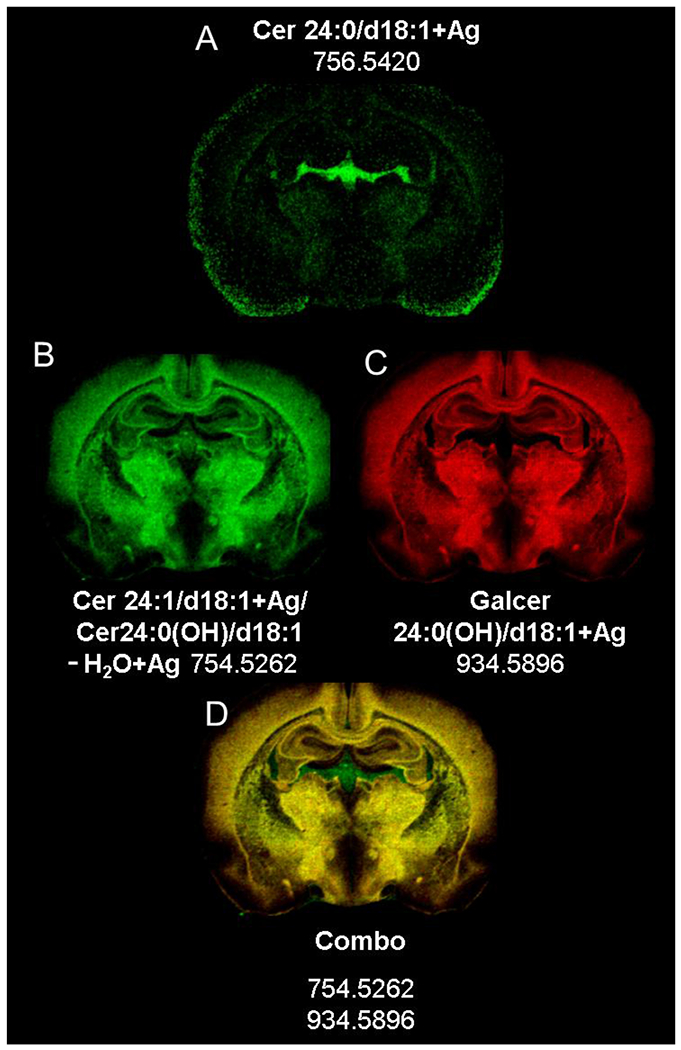
Distribution of ceramides at a level of −2.0 mm re: Bregma by MS imaging in positive ion mode in a rat brain section, resolution 60,000 at 400 Da.
Figure 9c shows the distribution of [GalCer24:0(OH)/d18:1] Ag+ at m/z 934.5896. A combined plot image (Figure 9d) was prepared for m/z 754.5262 (green) and 934.5896 (red) to compare the distributions of these two mass peaks. Note the extensive overlap of the mass peaks, which appears as yellow areas in the image. The one exception is the exclusive distribution of m/z 754.5262 in association with the velum interpose tum, transverse cerebral fissure, and choroid plexus, which appears to be the native distribution of the intact Cer 24:1/d18:1+Ag. Furthermore, the distribution in of m/z 754.5262 in these regions (Figure 9d) is similar to the distribution of m/z 756.5420 ceramide 24:0/d18:1 in Figure 9a. Unfortunately, even at a 100,000 mass resolution, the signal from the Cer 24:1/d18:1 Ag+ and [Cer 24:0/d18:1(OH)-H2O] Ag+ cannot be separated by m/z as they are structural isomers. Ion mobility coupled with MSI might distinguish between the two structures [23].
Long Time Acquistions at 100,000 m/z resolutions
A section of rat brain at level −3.24 mm bregma was also implanted and imaged with a mass resolution of 100,000 and a limited mass range (550–750 Da). This single MSI run took 57 h of acquisition on the LTQ XL Orbitrap. Despite the lengthy time of acquisition, high spatial resolution of ceramides was obtained (Supplementary Figure 7). Importantly, the signal intensity and mass measurement accuracy were maintained across the acquisition.
Conclusion
This work highlights both technical improvements and caveats for MS imaging accomplished with the AgNP implanted matrices. Although the utility of metal nanoparticles as MALDI matrices were previously established, the implantation of nanoparticles eliminates the problems inherent in solution spraying any matrix type, organic or particle. Implantation is a uniquely dry and uniform deposition technique generating reproducible images from whole organ section. One of the significant advantages of the silver nanoparticles is the ability to ionize intact Cer, DAG, GalCer, and cholesterol. Our work with lipid standards deposited onto brain sections demonstrates the efficiency of silver for ionizing a large variety of lipids, in particular, neutral lipid such as free intact ceramides and diacylglycerols. However, it was observed that major fragment peaks can be produced from lipids when using the AgNP matrices. In particular, glycerophospholipids can fragment by losing their unique head group to form a diacylglycerol minus water mass peak (DAG-H2O+Ag), while sphingolipids can also lose their head group to produce a fragment corresponding to ceramide minus water (Cer-H2O+Ag). Additionally, peaks assigned as silver adduct fatty acids are overwhelmingly produced by fragmentation of the fatty acid backbone in glycerophospholipids and sphingolipids. Thus, great care should be taken when using these fragment peaks for constructing images because of the likelihood that they represent multiple species/classes of larger lipids, especially in organs with complex lipidomes such as the brain.
Tissues implanted with silver nanoparticles consistently generate high quality images with anatomical details. The controlled uniformity of the NPlanter matrix deposition has allowed a high reproducibility (variation below 10%) of raw lipid ion signal between serial sections implanted on separate days. This reproducibility makes AgNP ideally suited for imaging tissues from disease or injury models within the brain such as blunt trauma, stroke, cancer, or heart disease in which the injury or diseased areas are histologically asymmetric. We reiterate that the images shown in this study are obtained with the raw lipid pixel counts without further normalization by the total ion count of the image (TIC). This is an especially important feature for comparing images within animal models of asymmetric disease or injury states.
AgNP and AuNP implanted matrix are the best characterized metal NPs used with this technique: however, guided by known ion molecule chemistry and the ability to make these NPs within the magnetron, othermetal NP candidates such asMg, Cu, Al, Ti, and Fe and controlled mixtures of NPs can be qualified using the experimental approaches outlined in this work
Supplementary Material
Acknowledgements
This research was supported by the Intramural Research Program of the National Institute on Drug Abuse, NIH. Ionwerks and the University of Pittsburgh gratefully acknowledge support through NIDA phase II SBIR grants 1RC3DA031431-01 (ARRA), 5R44DA030853-03, and 5R44DA0362263-03. The authors gratefully acknowledge Rice University’s Shared Equipment Authority for the use of their instrumentation suite. The authors acknowledge Dr. Mari Prieto and the Thermo Corporation for technical advice and instrumentation support.
References
- 1.Tanaka K, Waki H, Ido Y, Akita S, Yoshida Y, Yoshida T, Matsuo T: Protein and polymer analyses up to m/z 100 000 by laser ionization time-of-flight mass spectrometry. Rapid Commun. Mass Spectrom 2, 151–153 (1988) [Google Scholar]
- 2.Tempez A, Schultz JA, Della-Negra S, Depauw J, Jacquet D,Novikov A, Lebeyec Y, Pautrat M, Caroff M, Ugarov M, Bensaoula H, Gonin M, Fuhrer K, Woods A: Orthogonal time-of-flight secondary ion mass spectrometric analysis of peptides using large gold clusters as primary ions. Rapid Commun. Mass Spectrom 18, 371–376 (2004) [DOI] [PubMed] [Google Scholar]
- 3.Novikov A, Caroff M, Della-Negra S, Depauw J, Fallavier M, Le BY, Pautrat M, Schultz JA, Tempez A, Woods AS: The Au(n) cluster probe in secondary ion mass spectrometry: influence of the projectile size and energy on the desorption/ionization rate from biomolecular solids. Rapid Commun. Mass Spectrom 19, 1851–1857 (2005) [DOI] [PubMed] [Google Scholar]
- 4.Tempez A, Ugarov M, Egan T, Schultz JA, Novikov A, Della-Negra S, Lebeyec Y, Pautrat M, Caroff M, Smentkowski VS, Wang HY, Jackson SN, Woods AS: Matrix implanted laser desorption/ionization (MILDI) combined with ion mobility-mass spectrometry for bio-surface analysis. J. Proteome Res 4, 540–545 (2005) [DOI] [PubMed] [Google Scholar]
- 5.Jackson SN, Baldwin K, Muller L, Womack VM, Schultz JA, Balaban C, Woods AS: Imaging of lipids in rat heart by MALDI-MS with silver nanoparticles. Anal. Bioanal. Chem 406, 1377–1386 (2014) [DOI] [PMC free article] [PubMed] [Google Scholar]
- 6.Muller L, Kailas A, Jackson SN, Roux A, Barbacci DC, Schultz JA, Balaban CD, Woods AS: Lipid imaging within the normal rat kidney using silver nanoparticles by matrix-assisted laser desorption/ionization mass spectrometry. Kidney Int. 88, 186–192 (2015) [DOI] [PMC free article] [PubMed] [Google Scholar]
- 7.Roux A, Muller L, Jackson SN, Post J, Baldwin K, Hoffer B, Balaban CD, Barbacci D, Schultz JA, Gouty S, Cox BM, Woods AS: Mass spectrometry imaging of rat brain lipid profile changes over time following traumatic brain injury. J. Neurosci. Methods 272, 19–32 (2016) [DOI] [PMC free article] [PubMed] [Google Scholar]
- 8.Roux A, Muller L, Jackson SN, Baldwin K, Womack V, Pagiazitis JG, O’Rourke JR, Thanos PK, Balaban C, Schultz JA, Volkow ND, Woods AS: Chronic ethanol consumption profoundly alters regional brain ceramide and sphingomyelin content in rodents. ACS Chem. Neurosci 6, 247–259 (2014) [DOI] [PMC free article] [PubMed] [Google Scholar]
- 9.Grade H, Cooks RG: Secondary ion mass spectrometry. Cationization of organic molecules with metals. J. Am. Chem. Soc 100, 5615–5621 (1978) [Google Scholar]
- 10.Schriemer DC, Li L: Detection of high molecular weight narrow polydisperse polymers up to 1.5 million daltons by MALDI mass spectrometry. Anal. Chem 68, 2721–2725 (1996) [DOI] [PubMed] [Google Scholar]
- 11.Bahr U, Deppe A, Karas M, Hillenkamp F, Giessmann U: Mass spectrometry of synthetic polymers by UV-matrix-assisted laser desorption/ionization. Anal. Chem 64, 2866–2869 (1992) [Google Scholar]
- 12.Harvey DJ: Ionization and fragmentation of N-linked glycans as silver adducts by electrospray mass spectrometry. Rapid Commun. Mass Spectrom 19, 484–492 (2005) [DOI] [PubMed] [Google Scholar]
- 13.Jackson AU, Shum T, Sokol E, Dill A, Cooks RG: Enhanced detection of olefins using ambient ionization mass spectrometry: Ag+ adducts of biologically relevant alkenes. Anal. Bioanal. Chem 399, 367–376 (2011) [DOI] [PubMed] [Google Scholar]
- 14.Grace LI, Abo-Riziq A, de Vries MS: An in situ silver cationization method for hydrocarbon mass spectrometry. J. Am. Soc. Mass Spectrom 16, 437–440 (2005) [DOI] [PubMed] [Google Scholar]
- 15.Dutta TK, Harayama S: Time-of-flight mass spectrometric analysis of high-molecular-weight alkanes in crude oil by silver nitrate chemical ionization after laser desorption. Anal. Chem 73, 864–869 (2001) [DOI] [PubMed] [Google Scholar]
- 16.Sekula J, Niziol J, Rode W, Ruman T: Silver nanostructures in laser desorption/ionization mass spectrometry and mass spectrometry imaging. Analyst 140, 6195–6209 (2015) [DOI] [PubMed] [Google Scholar]
- 17.Pilolli R, Palmisano F, Cioffi N: Gold nanomaterials as a new tool for bioanalytical applications of laser desorption ionization mass spectrometry. Anal. Bioanal. Chem 402, 601–623 (2012) [DOI] [PubMed] [Google Scholar]
- 18.Shrivas K, Wu HF: Applications of silver nanoparticles capped with different functional groups as the matrix and affinity probes in surfaceassisted laser desorption/ionization time-of-flight and atmospheric pressure matrix-assisted laser desorption/ionization ion trap mass spectrometry for rapid analysis of sulfur drugs and biothiols in human urine. Rapid Commun. Mass Spectrom 22, 2863–2872 (2008) [DOI] [PubMed] [Google Scholar]
- 19.Chiu TC, Chang LC, Chiang CK, Chang HT: Determining estrogens using surface-assisted laser desorption/ionization mass spectrometry with silver nanoparticles as the matrix. J. Am. Soc. Mass Spectrom 19, 1343–1346 (2008) [DOI] [PubMed] [Google Scholar]
- 20.Hua L, Chen J, Ge L, Tan S: Silver nanoparticles as matrix for laser desorption/ionization mass spectrometry of peptides. J. Nanopart. Res 9, 1133–1138 (2007) [Google Scholar]
- 21.Lin PC, Tseng MC, Su AK, Chen YJ, Lin CC: Functionalized magnetic nanoparticles for small-molecule isolation, identification, and quantification. Anal. Chem 79, 3401–3408 (2007) [DOI] [PubMed] [Google Scholar]
- 22.Sherrod SD, Diaz AJ, Russell WK, Cremer PS, Russell DH: Silver nanoparticles as selective ionization probes for analysis of olefins by mass spectrometry. Anal. Chem 80, 6796–6799 (2008) [DOI] [PubMed] [Google Scholar]
- 23.Jackson SN, Ugarov M, Egan T, Post JD, Langlais D, Albert SJ, Woods AS: MALDI-ionmobility-TOFMSimaging of lipids in rat brain tissue. J. Mass Spectrom 42, 1093–1098 (2007) [DOI] [PMC free article] [PubMed] [Google Scholar]
- 24.Goto-Inoue N, Hayasaka T, Zaima N, Kashiwagi Y, Yamamoto M, Nakamoto M, Setou M: The detection of glycosphingolipids in brain tissue sections by imaging mass spectrometry using gold nanoparticles. J. Am. Soc. Mass Spectrom 21, 1940–1943 (2010) [DOI] [PubMed] [Google Scholar]
- 25.Hayasaka T, Goto-Inoue N, Zaima N, Shrivas K, Kashiwagi Y, Yamamoto M, Nakamoto M, Setou M: Imaging mass spectrometry with silver nanoparticles reveals the distribution of fatty acids in mouse retinal sections. J. Am. Soc. Mass Spectrom 21, 1446–1454 (2010) [DOI] [PubMed] [Google Scholar]
- 26.Lauzon N, Dufresne M, Chauhan V, Chaurand P: Development of laser desorption imaging mass spectrometry methods to investigate the molecular composition of latent fingermarks. J. Am. Soc.Mass Spectrom 26, 878–886 (2015) [DOI] [PubMed] [Google Scholar]
- 27.Dufresne M, Thomas A, Breault-Turcot J,Masson JF, Chaurand P: Silver-assisted laser desorption ionization for high spatial resolution imaging mass spectrometry of olefins from thin tissue sections. Anal. Chem 85, 3318–3324 (2013) [DOI] [PubMed] [Google Scholar]
- 28.Holle A, Haase A, Kayser M, Hohndorf J: Optimizing UV laser focus profiles for improved MALDI performance. J. Mass Spectrom 41, 705–716 (2006) [DOI] [PubMed] [Google Scholar]
- 29.Hsu FF, Turk J: Characterization of phosphatidylethanolamine as a lithiated adduct by triple quadrupole tandem mass spectrometry with electrospray ionization. J. Mass Spectrom 35, 595–606 (2000) [DOI] [PubMed] [Google Scholar]
- 30.Jackson SN, Ugarov M, Post JD, Egan T, Langlais D, Schultz JA, Woods AS: A study of phospholipids by ion mobility TOFMS. J. Am. Soc. Mass Spectrom 19, 1655–1662 (2008) [DOI] [PMC free article] [PubMed] [Google Scholar]
- 31.Eibisch M, Schiller J: Sphingomyelin is more sensitively detectable as a negative ion than phosphatidylcholine: a matrix-assisted laser desorption/ionization time-of-flight mass spectrometric study using 9-aminoacridine (9-AA) as matrix. Rapid Commun. Mass Spectrom 25, 1100–1106 (2011) [DOI] [PubMed] [Google Scholar]
- 32.Chaurand P, Cornett DS, Angel PM, Caprioli RM: From whole-body sections down to cellular level, multiscale imaging of phospholipids by MALDI mass spectrometry. Mol. Cell Proteom 10, O110 (2011) [DOI] [PMC free article] [PubMed] [Google Scholar]
- 33.Wang HY, Jackson SN, Woods AS: DirectMALDI-MS analysis of cardiolipin from rat organs sections. J.Am. Soc.Mass Spectrom 18, 567–577 (2007) [DOI] [PMC free article] [PubMed] [Google Scholar]
- 34.Wang HY, Jackson SN, Post J, Woods AS: A minimalist approach to MALDI imaging of glycerophospholipids and sphingolipids in rat brain sections. Int. J. Mass Spectrom 278, 143–149 (2008) [DOI] [PMC free article] [PubMed] [Google Scholar]
- 35.Merrill AH Jr., Schmelz EM, Dillehay DL, Spiegel S, Shayman JA, Schroeder JJ, Riley RT, Voss KA, Wang E: Sphingolipids—the enigmatic lipid class: biochemistry, physiology, and pathophysiology. Toxicol. Appl. Pharmacol 142, 208–225 (1997) [DOI] [PubMed] [Google Scholar]
- 36.Reynolds CP, Maurer BJ, Kolesnick RN: Ceramide synthesis and metabolism as a target for cancer therapy. Cancer Lett. 206, 169–180 (2004) [DOI] [PubMed] [Google Scholar]
- 37.Obeid LM, Linardic CM, Karolak LA, Hannun YA: Programmed cell death induced by ceramide. Science 259, 1769–1771 (1993) [DOI] [PubMed] [Google Scholar]
- 38.Wang HY, Wu HW, Tsai PJ, Liu CB: MALDI-mass spectrometry imaging of desalted rat brain sections reveals ischemia-mediated changes of lipids. Anal. Bioanal. Chem 404, 113–124 (2012) [DOI] [PubMed] [Google Scholar]
- 39.Hankin JA, Farias SE, Barkley RM, Heidenreich K, Frey LC, Hamazaki K, Kim HY, Murphy RC: MALDI mass spectrometric imaging of lipids in rat brain injury models. J. Am. Soc. Mass Spectrom 22, 1014–1021 (2011) [DOI] [PMC free article] [PubMed] [Google Scholar]
- 40.Goto-Inoue N, Hayasaka T, Zaima N, Nakajima K, Holleran WM, Sano S, Uchida Y, Setou M: Imaging mass spectrometry visualizes ceramides and the pathogenesis of dorfmanchanarin syndrome due to ceramide metabolic abnormality in the skin. PLoS One 7, e49519 (2012) [DOI] [PMC free article] [PubMed] [Google Scholar]
Associated Data
This section collects any data citations, data availability statements, or supplementary materials included in this article.


