

Abstract
One of the major challenges associated with modeling the influence of the cellular microenvironment on cell growth and differentiation is finding suitable substrates for growing the cells in a manner that recapitulates the cell–cell and cell–microenvironmental interactions in vitro. As one approach to address this challenge, we have developed graphene oxide (GO)-3D mesh with tunable hardness and porosity for application in cell culture systems. The synthetic method of GO-3D mesh is simple, easily reproducible, and low cost. The foundation of the method is the combination of poly(ethylene)(glycol) (PEG) and GO together with a salt-leaching approach (NaCl) in addition to a controlled application of heat during the synthetic process to tailor the mechanical properties, porosity, and pore-size distribution of the resulting GO-3D mesh. With this methodology, the hydrogel formed by PEG and GO generates a microporous mesh in the presence of the NaCl, leading to the formation of a stable 3D scaffold after extensive heating and washing. Varying the ratio of NaCl to GO controls porosity, pore size, and pore connectivity for the GO-3D mesh. When the porosity is less than 90%, with an increasing ratio of NaCl to GO, the number of pores increases with good interconnectivity. The 3D-mesh showed excellent biocompatibility with vascular cells which can take on a morphology comparable to that observed in vessels in vivo. Cell proliferation and gene expression can be determined from cells grown on the GO-3D scaffold, providing a valuable tool for investigating cell–microenvironmental changes. The GO-3D mesh described results from the synergy of the combined chemical properties of the PEG and GO with the salt-leaching methodology to generate a unique and flexible mesh that can be modified and optimized for a variety of in vitro applications.
Keywords: graphene oxide, 3D mesh, poly(ethylene) (glycol), salt leaching, vascular cell microenvironment
Graphical Abstract

INTRODUCTION
In recent years, a wide variety of natural materials and synthetic polymers have been recognized and developed as biocompatible materials for effective cultivation of cells that are sensitive to microenvironmental influences, particularly in the field of tissue engineering and high-throughput drug testing.1 The reported natural materials include chitosan,2–4 collagen,5,6 gelatin,7,8 silk fibroin,9 fibrinogen,10 elastin,11 laminin, alginate,12 hyaluronic acid,13 and cellulose acetate.14 The synthetic polymers mainly consist of poly(l-lactic acid) (PLLA), polycaprolactone (PCL), poly(glycolide) (PGA), poly(lactide-co-glycolide) (PLGA), poly(ethylene oxide) (PEO), poly(vinyl alcohol) (PVA), segmented poly(esterurethane) (SPEU), poly(vinylpyrrolidone) (PVP), and poly(N-isopropylacrylamide) (PNIPAM).11,14,15 While these materials have been adapted for a range of bioapplications, drawbacks remain that limit their broad applicability.16 For example, the surface properties of PGA, PLLA, PLGA, PCL, and SPEU are hydrophobic, generating a challenge for cellular applications in tissue engineering. Meanwhile, the surface modification of synthetic polymers and some natural materials can result in poor interactions of cell surface proteins and receptors with modified groups, further complicating cellular interactions at the biomaterial interface.15,17 More importantly, it is difficult to keep their 3D structures stable during the cellular application process due to the limitations in mechanical strength of some of these biomaterials, such as PVA, PEO, PVP, and collagen.18
To overcome these limitations, the development of new biocompatible materials is needed. Graphene-based nanomaterials are an emerging field, with graphene being used in a variety of applications ranging from 2D in vitro cell culture, to anticorrosive coatings, or as anchoring structures for calcium carbonate.19,20 The cell culture applications for graphene have shown great potential due to several features: (1) tunable mechanical properties via combining graphene and polymer and adjusting their ratio; (2) available hydrophilic and chemically functional surface area for easy cell attachment, proliferation and differentiation; (3) tunable porosity for culturing a variety of cell types;21–23 and (4) superior electrical conductivity24 providing an electrically compatible surface for cells, the latter feature being critical for establishing a conductive microenvironment for a variety of cell functions.25–27 The current graphene materials are graphene, graphene oxides (GOs), and reduced graphene oxides (RGOs) that possess beneficial mechanical properties. For example, graphene’s Young’s modulus, a measurement of the stiffness of a solid material, is about 1.02 ± 0.03 TPa with a Poisson’s ratio of 0.167,28,29 reflecting the elastic potential of graphene-based structures.
The combination of graphene-based materials with polymer can further improve their properties.30,31 The combination of graphene-based materials with chitosan,32 collagen,33 or other polymers has shown improved properties for adhesion and differentiation of neural stem cells, for example. Graphene with a polymer composite structure, such as PLGA-collagen, has been developed for culturing human mesenchymal stem cells33 and neural stem cells.34 Recently, PEG has been used to modify graphene or GO nanosheets to improve the biodistribution, aqueous stability, and biocompatibility of the resulting composite.35,36 Therefore, while the incorporation of graphene with a polymer provides improved properties, the disadvantage of composite structures generated to date is the lack of tensile strength required to maintain a 3D structure, hydrogen bond linkage, variable stability, and consequent biotoxicity.37,38 However, tensility analysis for a mixture of graphene/poly(vinyl alcohol) revealed that increasing graphene volume content could effectively enhance the composite mechanical properties, thereby increasing the Young’s modulus of the graphene-polymer composite (graphene wt % = 1.8%) by 150% relative to polymer alone.39
Indeed, in order to address the challenge of developing a strong, tunable 3D mesh biomaterial, we have taken advantage of graphene and the biocompatible oligomer, PEG. Because PEG is an oligomer of ethylene oxide, it presents with several different molecular weights including a range of increments: 200, 400, 600, 800, 1000, 1500, 2000, 4000, 6000, 8000 Da, and above. It readily forms a hydrogel through the cross-linking of the PEG hydroxyl groups to carboxyl groups of other compounds via a stable hydrogen bond. We have taken advantage of this linkage property of PEG to cross-link the oligomer with GO to form a complex hydrogel. In addition, we have utilized a salt-leaching method (sodium chloride, NaCl) to introduce and frame a microporous structure generating a GO-3D mesh. We have optimized the use of PEG to facilitate the GO-3D mesh formation and incorporated a salt-leaching method to generate stable porosity. To optimize our scaffold structure and composition, we have combined PEG oligomers of different molecule weights while also varying the ratio of PEG to GO to adjust tensility. Moreover, we have varied the concentration and amount of NaCl to control porosity and pore size for the GO-3D mesh. In our system, the hydrogel formed by PEG and GO generates a microporous mesh in the presence of the NaCl that is a stable 3D structure even after extensive heating and washing. The GO-3D mesh generated with our approach provides a novel and ideal scaffold that can be modified and optimized for a variety of in vitro applications with a range of cell types in order to investigate cell–cell and cell–microenvironmetal applications.
MATERIALS AND METHODS
Synthesis of GO-3D Mesh.
Graphene oxide (GO, dispersed in ethanol; ACS materials) and PEG (Sigma) were used to generate the 3D mesh. Briefly, a 7.5 mg aliquot of GO was mixed with 15 mg of PEG (MW 6000 g/mol; plus additional tested MW forms as indicated). The mixture was vortexed for 1 min followed by sonication for 20 min. Postsonication, 60 mg of NaCl was added to the mixture that was subsequently heated at 80 °C for 24 h to fully integrate the components and to allow NaCl crystal formation. Next, the coalesced mixture was washed to remove NaCl from the porous graphene mesh that had formed. In the final step to stabilize the 3D structure obtained, the mesh was dried overnight at 65 °C. Prior to use in cell culture, the mesh was sterilized with ultraviolet light exposure in a cell culture hood for 30 min on each side, within 8 in. of the light source or by autoclaving. Upon immersion in gelatin-coating solution or cellculture media, the mesh was saturated and remained stably positioned in the bottom of the culture dishes over time.
Quantification of Nanomechanical Properties.
Nanomechanical properties of the GO-3D mesh were measured using a nanoindentation device (TI700Ubi, Hysitron Inc., Minneapolis, MN, U.S.A.) equipped with a Berkovich diamond indenter. The two physical coefficients, hardness and Young’s modulus, were assessed to characterize the mechanical properties of the mesh and determine variations associated with changing a single variable, the percentage of PEG content. The GO-3D mesh samples were prepared in the format of a thin film with a series of GO weight percentages (100 wt %, 66.7 wt %, 50 wt %, 40 wt %, 33.3 wt %, 28.6 wt %). The Poisson ratio was 0.17, and each sample was analyzed using 18 indentations by tip to determine the tensility by Young’s modulus. The load peak force was 500 μN and loading time was 60 s at all measurement points.
Imaging the 3D Mesh Using Scanning Electron Microscopy (SEM).
A scanning electron microscope, SEM SU8000 (Hitachi High Tech. Co., Tokyo, Japan) attached with Quartz PCI software (version 5), was used to image and analyze the surface and cross-section of GO-3D mesh in the presence or absence of vascular-derived primary cell cultures. The accelerating voltage of 10 kV and the current of 5 mA were applied during the imaging and analysis process. The samples were sputtered with Plattium to enhance surface conductivity prior to imaging. The cross section of GO-3D mesh was prepared by cutting the mesh in half to obtain the interior cross-sectional view. The GO-3D mesh with the cells was prepared by fixation in 2.5% glutaraldehyde in pH 7.4 phosphate buffer solution (PBS) for 15 min at room temperature (RT). Then the mesh was washed two times with PBS buffer and distilled water. Afterward, the dehydration process was performed with graded concentrations of ethanol of 50%, 60%, 70%, 80%, 90%, and 99%. Postdehydration, the samples were heated at 65 °C overnight and then stored dry prior to use in nanomechanical or biocompatibility assays. In addition, the pore diameter of a subset of representative samples were quantified using a calibrated scale on the SEM images and Image Pro Plus 6.0 Software (Media Cybernetics, Rockville, MD).
Porosity and Swelling Test for GO-3D Mesh.
The porosity of the GO-3D mesh was measured by the liquid displacement method34,40,43 with ethanol as the displacement liquid based on its strong penetration ability and high polarity. After heating at 65 °C overnight, the dry weights of the mesh (Wd) were immediately measured using an electronic balance (OHAUS Corporation, Pine Brook, NJ). Afterward, the GO-3D mesh was infused in ethanol for 5 min and the wet weights (Ww) were quantified based on the following formula for liquid displacement: porosity = (Ww − Wd)/(ρ×π× (D/2).2 Here Ww and Wd are the wet and dry weights, respectively, of the scaffold, ρ is the density of ethanol (0.789 g/cm3), π is the discrete value of pi (3.14), D is the diameter of the scaffold, and H is the height of the scaffold as described.34,43,40 The values graphed are the mean ± standard deviation for four replicates of each mesh type with the experiment repeated two times with two different sets of preparations.
The swelling ratio of the GO-3D mesh and the swelling stability over time were determined by immersing the dry mesh in a PBS solution maintained at 37 °C, comparable to the temperature conditions associated with a standard cell culture incubator. We conducted two separate assessments with four different mesh preparations each on two different time courses. The mesh was weighed in a short-term series to determine the wet weights (WwPBS) upon initial exposure to aqueous solution through 4 h with the WwPBS determined by placing the wet scaffold onto filter paper to remove excess fluid and then weighing the wet material following the procedure of Unnithan et al.,.43 The swelling percentage of the mesh was calculated by the formula: swelling % = [(WwPBS − Wd)/Wd] × 100% where Wd is the dry weight of the scaffold with the wet weight (WwPBS) determined at each time point. The mean ± the standard deviation are shown for four replicate samples of each mesh type. A separate set of assessments was conducted to determine the long-term swelling properties with the terminal point at 3 weeks after the initial immersion and the swelling percentage determined as previously described.
Vascular Cell Culture.
Primary cultures of mouse-brain-derived vascular endothelial cells and mouse-brain-derived vascular fibroblast cells were obtained from CD1 adult mouse brain (Cell Biologics, Chicago, IL) and maintained in complete Dulbecco’s Modification of Eagle’s Medium with Glutamax and 4.5 g/L glucose (Gibco BRL, Grand Island, NY) supplemented with 10% fetal bovine serum, penicillin solution (100 U/ml), and streptomycin (100 μg/mL). The vascular endothelial cells and the perivascular fibroblasts were plated at a density of 2500 and 5000 cells/well on gelatin-coated (Gelatin-based coating 0.2% solution, Cell Biologics) 4-well plates in complete DMEM medium. Cells were used through passage 4, and the specific culture times for each experiment are indicated in the figure legends. Cell counts for assay plating were determined by counting a diluted suspension with an EVE automated cell counter (NanoEn Tek, Waltham, MA); specific plating densities are indicated in the legends.
Cell Proliferation.
Cell proliferation was assessed by the MTT assay according to the manufacturer’s instructions (Vybrant MTT Cell Proliferation Assay Kit, ThermoFisher) with minor modifications to accommodate the GO-3D mesh. The cells were also seeded on gelatin-coated plastic as a control group for comparison. Mouse brain vascular-derived endothelial cells and fibroblast cells were seeded at a density of 2.5 × 10³ and 5 × 10³, respectively, in parallel cultures (5 replicates each) on GO-3D mesh and plastic in 48-well tissue culture plates and cultured for 3, 5, and 7 days. The GO-3D meshes were first washed with DMEM medium to fully saturate the mesh prior to coating it with gelatin (0.2% solution, Cell Biologics) for 30–45 min at RT, based on manufacturer’s recommendations and our experience with the coating solution. The two types of cells were incubated in 37 °C with 5% CO2 atmosphere and with standard humidity control (NuAire, Plymouth, MN). The proliferation was determined following standard manufacturer’s protocols for the MTT Assay (Invitrogen, ThermoFisher, U.S.A.) with 10 μL of MTT added per well and incubated at 37 °C. In the case where we wanted to assay the GO-3D mesh cells and the plastic adherent cells from within the same plated well, the mesh was moved to a new well prior to completing the assay. After 4 h, 100 μL of sodium-dodecyl-sulfide (SDS)/HCl solution (Invitrogen) was added into each well. The absorbances were measured at 570 nm using a microplate reader (BioTek, Winooski, U.S.A.). Values were collected for the plastic (control), the cells on GO-3D mesh, and the cells that were in the same well as the mesh but not adhered to the mesh (referred to as “plastic-adherent” population). The mean and standard deviation for replicate values were assessed by two-way ANOVA with culture condition and time in culture as the primary variables in the analysis. Sidak’s adjustment for multiple comparisons was used for all paired-wise comparisons (JMP version 10; SAS Institute Software and Prism GraphPad, GraphPad Prism Software, San Diego, CA); results were graphed using Prism GraphPad and composites generated in Adobe Photoshop (CS6, Version 13, Adobe Systems Incorporated, San Jose, CA).
Vascular Cell Immunolabeling and Imaging in Vivo and in Vitro.
In Vivo Immunolabeling.
The brain-derived blood vessels were imaged from embryonic day 11.5 mouse forebrain. The tissue was collected under an IACUC approved protocol and fixed in phosphate-buffered saline (PBS) solution with 4% paraformaldehyde. The tissue was then equilibrated to 30% sucrose solution and cryosectioned at 10 μm intervals using a Leica HM550 cryostat. The sections were blocked and permeabilized in 3% donkey serum (Vector Laboratories, Burlingame, CA), 0.1% Triton X-100, 1% bovine serum albumin (BSA) in PBS for 1 h at RT. The antibody incubation was 2 h at RT. The sections were immunolabeled to detect perivascular fibroblasts using NG2 proteoglycan polyclonal antibody (Abcam, Cambridge, MA) and G. simplicifolia lectin conjugated to fluorescein isothiocyanate (lectin-FITC, 1:200 dilution; Vector Laboratories, Burlingame, CA) to label the vascular endothelial cells. The nuclei were labeled with DAPI and the images collected with an Olympus BX51 equipped with three channel fluorescence using a 40× objective (1.4 numerical aperture). The images were postprocessed with Photoshop to generate composites with scales indicated in the figure legends.
In Vitro Immunolabeling.
The brain-vascular-derived perivascular fibroblasts and endothelial cells were cultured solo or together in GO-3D mesh for 9 days and were then fixed in 4% paraformaldehyde-PBS. The GO-3D mesh was cryosectioned at 10 μm thickness, and sections were blocked and permeabilized as above and the antibody incubation was 2 h at RT. The antibodies used were the following: smooth muscle actin conjugated to Cy3 (1:2000 dilution, Sigma Immunochemicals, St. Louis, MO) to label brain-derived perivascular (fibroblast) cells and G. simplicifolia lectin conjugated to FITC (1:200 dilution; Vector Laboratories, Burlingame, CA) to label the endothelial cells. Nuclei were labeled with To-Pro3 iodide (Molecular Probes, Eugene, OR). Antibody dilutions were made in block solution as described above. Slides were permanently mounted with Vectashield mounting medium (Vector Laboratories). For acquiring images, alpha Plan-Fluar 63X/1.4 numerical aperture or 100×/1.45 numerical aperture oil objective lenses were used on a Zeiss LSM 510-Meta confocal microscope equipped with Zen-Software (Zeiss, Germany). The confocal pinhole was adjusted to 1 Airy Unit (AU) and z-series stacks were collected with 4 average passes in 1 μm intervals at a 1024 × 1024 resolution. The 2D images, the 3D Z-stack images, and orthogonal projections were processed using the Zen-Software (Zeiss, Germany) and postprocessed to generate composites using Photoshop.
RNA Isolation, cDNA Synthesis, and PCR.
Total RNA was extracted from endothelial and fibroblast cells cultured on plastic, GO-3D mesh, and any cells that adhered to the plastic surrounding the GO-3D mesh (plastic-adherent). The Arcturus PicoPur RNA Isolation Kit (Applied Biosystems) was used to isolate and purify the RNA. The RNase-free DNase kit was used as an on-column DNase I digestion (Qiagen, 3 Kunitz units per column isolation). RNA was extracted from cells cultured on plastic using 100 μL extraction buffer applied directly to the cell culture well. GO-3D mesh was placed in 1.5 mL tubes, then submerged in 100 μL extraction buffer. After the mesh was removed from the well, the remaining plastic-bound cells were extracted with 100 μL extraction buffer and processed as a separate sample for comparison (plastic-adherent). Total RNA was quantified using the Nanodrop DS-11 Spectrophotometer (DeNovix Wilmington, DE), and sample quality ensured with A260/280 ratios between 1.8 and 2.0. The cDNA was generated via reverse transcription of 150–200 ng of total RNA using the GeneAmp RNA PCR Core Kit (Applied Biosystems). Total RNA was incubated with Murine Leukemia Virus (MuLV)-derived Reverse Transcriptase (50U/μL), RNase Inhibitor (20U/μL), PCR Buffer II (500 mM KCL and 100 mM Tris-HCl), MgCl2 (25 mM), Random Hexamers (50 μM), Oligo d(T) (50 μM), dATP (100 μM), dTTP (100 μM), dGTP (100 μM), dCTP (100 μM), and nuclease-free water in a C1000 Touch Thermal Cycler (BioRad Laboratories, Hercules, CA) at 42 °C for 15 min followed by 5 min at 99 °C. For the PCR amplification, 1–2 μL of cDNA were combined with 0.25 μm forward and reverse primers, up to 10 μL with Platinum PCR Supermix (Invitrogen) and amplified using standard PCR cycling: 95 °C, 5 min [(95 °C, 1 min; 53–58 °C, 30 s; 72 °C, 1 min X 30); 4 °C, ∞]. Primer sequences and amplicon sizes are provided in Table 1.
Table 1.
Primer Sequences and Amplicon Sizes for PCR
| gene name | forward/reverse primers (mouse) | amplicon size |
|---|---|---|
| 18S | (F) 5′-GACACGGACAGGATTGACAGATTGATAG-3′ (R) 5′-GTTAGCATGCCAGAGTCTCGTTCGTT-3′ |
129 bp |
| Gapdh | (F) 5′-GTGGCAAAGTGGAGATGGTTGCC-3′ (R)5′-GATGATGACCCGTTTGGCTCC-3′ |
288 bp |
| Pdgfß | (F) 5′-GATCTCTCGGAACCTCATCGAT-3′ (R)5′-GGCTTCTTTCGCACAATCTCA-3′ |
173 bp |
| Akap12/Gravin | (F) 5′-CCGAGAAGAGAAAGGAGCAA-3′ (R)5-AAGGCAACTCCACCTTCTCA-3′ |
147 bp |
RESULTS
Design and Development of the 3D Mesh.
The objective of this work is to develop a biocompatible GO-3D mesh with a tunable porosity and tensility for its use in cell culture. The design of the GO-3D mesh synthesis process and basic procedure are laid out in schematic form (Figure 1). First, the commercially available single-layer graphene oxide (2D) and polyethylene glycol (PEG) with a molecular weight of 6000 Da are mixed to form a GO-PEG gel (Figure 1A). While one specific example is shown in the cartoon, different ratios of GO:PEG were altered and tested independently. The combination of GO with PEG as a biocompatible material has been reported previously, although the synthesis methods and structural outcome were quite different than those presented in the current study.35 The next step is critical for forming the porous structure, and it represents a novel modification in this synthesis procedure: addition of sodium chloride (NaCl) to the GO:PEG gel (Figure 1B). The NaCl (in varying concentrations) establishes and maintains a crystalline shape in the GO:PEG mixture during its transition from liquid to hydrogel solid. With the application of sustained heat at 80 °C for 24 h, the components including the GO, PEG6000, and NaCl, become fully integrated (Figure 1C). The pore size and pore frequency, therefore, are determined by NaCl crystal formation in the hydrogel. The next critical step is the removal of NaCl crystals from the GO-3D mesh with repetitive distilled water flushing to reveal the stable pores left behind (Figure 1D). The final step involves drying of the porous scaffold overnight to stabilize the GO-3D mesh obtained (Figure 1E). Compared with other methods of preparing graphene 3D structure, such as chemical vapor deposition of GO coating on nickel foams,41 this method is simpler and has lower toxicity during the preparation process, with the added advantages of tunable pore size and adjustable tensility for the final product.
Figure 1.

Schematic diagram of GO-3D mesh synthesis. (A) Graphene oxide and PEG were mixed to form a gel after which (B) NaCl was added to the gel. (C) The addition of heat to the mixture at 80 °C for 24 h results in component integration and NaCl crystal formation. (D) Repeated distilled water rinses are used to resolubilize and flush out the NaCl leaving behind a stable porous structure. (E) Water is removed and the mesh dried at 65 °C overnight prior to UV sterilization for further use in cell culture.
Manipulating Mechanical Properties of Mesh Complex Material.
In order to adapt to the different microenvironmental requirements of tissues and cells, it is critical for the 3D scaffold to display sufficient flexibility and to efficiently support various in vitro culture systems. Therefore, to manipulate the mechanical properties of the 3D mesh, we added PEG to the GO-mesh with the expectation that PEG could enhance the tensile property of the mixed materials. PEGs are well-known biocompatible materials that are an oligomer of ethylene oxide and present with several different molecular weights such as 400, 1000, 6000, and 8000 Da. We had previously conducted preliminary tests on a range of PEG molecular weights in our synthesis and found that the 6000 Da form provided the best structural integrity and stability. Therefore, we chose this for oligomer weight for further investigation with regard to nanomechanical properties and biocompatibility in the current study. We took advantage of the chemical reactivity of PEG whereby it readily forms a hydrogel through the cross-linking of the PEG hydroxyl groups to carboxyl groups of other compounds forming a stable hydrogen bond.42 In the current study, this linking characteristic of PEG was critical to cross-link the oligomer with GO to form a complex hydrogel of GO-PEG.
To verify the effect of PEG on the mechanical properties of the GO, we tested the Young’s modulus and hardness of meshes with various percentages of PEG. We examined a range of GO:PEG ratios, while keeping the GO proportion constant, to determine the relationship between Young’s modulus and hardness and the different PEG percentages (Figure 2). For ease of quantification by nanoindentation (Hysitron TI 700 Ubi), a film of GO-PEG mixed materials was prepared at each ratio. The thickness of the GO-PEG film is 2 ± 0.5 μm. In order to establish a baseline measurement without the presence of PEG, a pure GO film without PEG was prepared and tested to determine Young’s Modulus (Figure 2A) and Hardness (Figure 2B) in Gigapascals (GPa). A series of GO-PEG ratios with different percentages of PEG were synthesized and tested in parallel, with the percentage of PEG relative to GO being the only variable (Figure 2). When the maximum constant load was 500 μN and load time was 60 s, the Young’s modulus of the pure GO film was 15.83 ± 2.55 GPa (Figure 2A). With increasing PEG content relative to constant GO content, the Young’s modulus and hardness values declined, reflecting the reduced hardness of the structure associated with the proportion of PEG. When the content of PEG was set at 71.4% relative to the GO, Young’s modulus was 5.75 ± 1.05 GPa which is a 3-fold reduction relative to 100% GO content. Therefore, PEG introduced into the GO-3D mesh makes the mesh more flexible. Because PEG has excellent biocompatibility and no biotoxicity,36 this GO-3D mesh has sufficient structural flexibility to be compatible for in vitro applications. For all remaining analyses in our study, 66.7% of the PEG 6000 Da was chosen for generating the GO-3D mesh.
Figure 2.

Changes in GO:PEG ratio alter nanomechanical properties of GO-3D mesh. Tensility (A) and hardness (B) were measured using nanoindentation with Gigapascals (GPa) as the pressure metric. The Poisson ratio was 0.17 with each sample being analyzed with 18 indentation events by tip to determine the tensility by Young’s modulus. The load peak force was 500 μN and loading time was 60 s for each sample. The PEG weight percentage (wt %) is graphed relative to tensility or hardness based on a range from 0 to 71.4% PEG. The values shown here are the mean and standard deviation of the mean from n = 18 tests for each GO:PEG ratio.
Tailoring Porosity of the 3D Mesh Based on NaCl Crystalline Formation.
One of the major challenges associated with biocompatible 3D scaffolds is tailoring the porosity and pore size distribution to ensure efficient mass transfer, sufficient oxygen and nutrient availability, and sufficient interior space for cells in culture. Varying pore sizes within the GO-3D mesh may provide a reservoir for nutrients and oxygen for cultured cells; however, metabolic wastes may also be entrapped in micropores and affect the survival, differentiation, or proliferation of the cells. Therefore, the pore size, porosity, and pore interconnectivity of the GO-3D mesh must be analyzed and optimized for cells grown in a 3D matrix. Furthermore, depending on the cell type or application, the porosity and pore interconnectivity should also be optimized accordingly.43 Therefore, to obtain flexible GO-3D mesh that can be utilized in multiple bioapplications, we fabricated GO-3D meshes with a range of porosity by modulating the amount of NaCl added to the GO:PEG mixture.
Although PEG and GO mixed alone are able to form a porous mesh, the porosity and pore size are challenging to tailor without additional modifications to the hydrogel mix. Because the PEG6000 has high molecular weight and a long molecular structure, the hydrogen bonds between the PEG and the GO sheets are not strong enough to form and hold pores of sufficient size or stability to sustain a physical environment for cell growth over time. Therefore, we introduced a salt-leaching method to incorporate a porous scaffold within the stable gel bond structure of the GO:PEG gel. The combined features of both PEG and NaCl have a synergistic effect to improve and stabilize the 3D structure based on the flexible properties of GO. The addition of NaCl to the GO:PEG establishes the formation of NaCl crystals in the GO:PEG mixture as it transitions from liquid to gel solid. The size and the number of the NaCl crystals can be controlled by changing the ratio of NaCl relative to GO:PEG. The pores are revealed as the crystals are removed after washing with distilled water. With increasing NaCl concentration, there is a corresponding increase in the porosity of the GO-3D mesh. Therefore, we changed the amount of NaCl to modulate porosity of the GO-3D mesh. Because the GO-3D mesh with 66.7% PEG content was selected as the optimal PEG concentration based on our earlier results, we mixed 7.5 mg GO and 15 mg PEG6000 first, and then incorporated different amounts of NaCl into the mixture. The resultant ratios of GO:PEG:NaCl were 1:2:2, 1:2:4, 1:2:8, 1:2:12, and 1:2:16, respectively (Figure 3). When the ratio of GO to NaCl is lower than 1:12 or porosity is over 90%, the GO-3D mesh tends to be fragile because there are numerous, large pores within the mesh structure. With increasing porosity, there is a corresponding reduction in structural density, stable surface area, and network structure complexity of the GO-3D mesh based on the displacement approach used to quantify porosity. Previous studies from others have also indicated that a porosity range from 60% to 90% can be widely used for tissue engineering using different polymers and substrates.42,44 Therefore, the GO-3D mesh with 75% porosity was targeted for further investigation to test the swelling ratio, determine stability over time, image the GO-3D mesh structure (surface and interior), and determine the biocompatibility of the mesh.
Figure 3.

Changes in NaCl ratios relative to GO: PEG alter the porosity of the GO-3D mesh. For each sample measurement, the porosity was determined using the liquid displacement method, and the sample was immersed in ethanol for 5 min. The porosity was determined by the following formula: porosity = (Ww − Wd)/(ρ×π×(D/2) following the methods described43 for each of 4 replicates of each mesh type with the primary variable being a change in NaCl. Data shown are the mean and standard deviation for n = 4 replicates at each ratio with the experiment repeated two times.
Swelling Capacity of the 3D Mesh.
The swelling capacity of the GO-3D mesh is absolutely critical for bioapplications so that the material can be compatible with the aqueous microenvironment of cells. This aspect of traditional graphene-polymer scaffolds has been a challenge with regard to the synthetic methods that resulted in material that was too brittle or was insufficiently able to absorb and retain aqueous solutions. In order to determine whether or not our GO-PEG mesh could overcome this challenge, we conducted a swelling test on the GO-PEG 3D mesh (Figure 4) and quantified the swelling response to PBS over a short time frame (4 h, Figure 4A). The GO-3D mesh structures were immersed in PBS solution maintained at 37 °C (pH 7.4) under standard cell culture conditions. It was determined that the 3D mesh generated by our technique has rapid and stable swelling properties, reaching peak, stable absorption within 10 min and maintaining that stability over the course of a 4-h assay. Moreover, the material has outstanding swelling capacity as the GO-3D mesh absorbed a solution weight that was seven times more than that of the 3D mesh itself, based on initial dry weight measurements. There was no statistical difference in swelling or stability over the period of the assay. In order to determine whether or not the swelling properties were stable over longer time frames, a second assessment over 3 weeks was conducted (Figure 4B). Swelling measurements were measured daily for 5 days, followed by interval steps through a 3-week window. There was no statistical difference in swelling or stability over the period of the assay.
Figure 4.
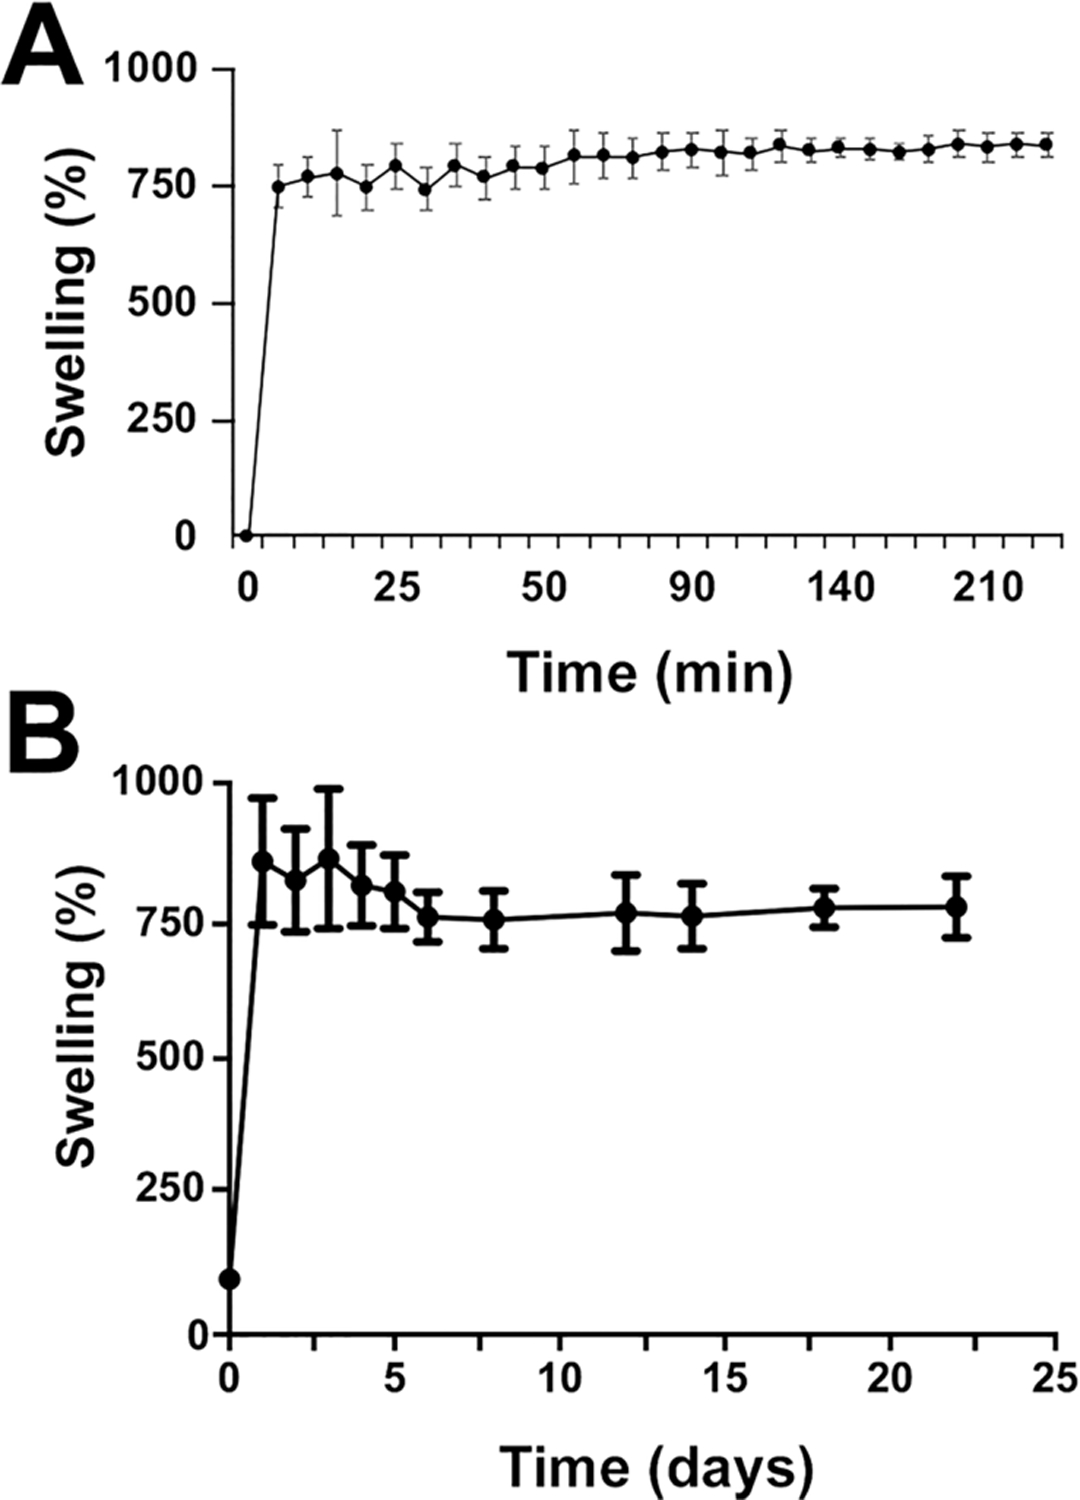
GO-3D mesh displays rapid and stable swelling properties. The GO-3D mesh at a ratio of GO:PEG:NaCl of 1:2:8 were immersed into PBS solution at 37 °C. The percent swelling was determined by the formula: swelling % = [(WwPBS − Wd)/Wd] × 100% (Wd means dry 3D mesh weight). (A) The points represent the mean and standard deviation of 4 replicates with individual mesh preparations. No statistical differences in stable swelling properties were observed after 5 min through completion of the assay at 4 h. (B) The assay was repeated with a separate set of GO-3D mesh material (same ratios as for A) with the assay maintained over 3 weeks. Each point represents the mean and standard deviation of 4 replicates with initial values collected daily for the first 5 days and at intervals thereafter. No statistical differences in stable swelling properties were observed once maximal swelling was achieved.
Morphological Study of GO-3D Mesh.
Scanning electron microscopy (SEM) was used to analyze the GO-3D mesh surface and inner interconnectivity structure. With the integrative synthetic approach developed, the GO-3D mesh was clearly formed with extensive porosity. Changing the ratio of NaCl in the GO-PEG mixture altered the sample porosity of the GO-3D mesh. The surface structure and cross-sectional SEM images of representative GO-3D mesh samples is shown to reflect the distinct features associated with the surface versus the in-depth view of the mesh (Figure 5). The pores showed good interconnectivity when the porosity was less than 90%. Cross-sectional comparison revealed that the interior pores in the mesh were larger and more interconnected with a higher NaCl concentration. Note that the pore size inside the GO-3D mesh ranges from 5 to 30 μm in diameter. However, irregularly shaped pores with reduced interconnectivity are formed when the porosity is over 90%, (compare panels D and E of Figure 5). The average pore diameter and standard deviation were quantified for a representative sample from each of the ratios with the number of measured pores indicated for each: 1:2:2 (10.14 ± 3.03 μm; n = 35 pores); 1:2:4 (7.34 ± 2.67 μm; n = 80 pores); 1:2:8 (12.83 ± 5.22 μm; n = 80 pores); 1:2:10 (18.79 ± 5.17 μm; n = 80 pores); 1:2:12 (30.62 ± 6.80 μm; n = 80 pores); and 1:2:16 (31.31 ± 8.57 μm; n = 80 pores). The average pore size increased with increasing NaCl content. Therefore, a balance of GO-3D mesh porosity less than 90% with a ratio of NaCl higher than 1:12 (GO: NaCl) provides a stable structure with regular porosity.
Figure 5.

Surface and cross-sectional features of GO-3D mesh are modified with changes in NaCl ratio. SEM imaging was conducted on GO-3D mesh with different ratios of GO:PEG to NaCl were fixed with glutaraldehyde and sputtered with Plattium to enhance surface conductivity prior to imaging. The acceleration voltage (10 kV) and the current (5 mA) were applied consistently during the imaging and analysis process. The cross sections of GO-3D mesh were obtained by cutting the mesh in half to reveal the interior cross section view. Qualitative assessment of the surface area and internal porous landscape shows that these features vary with altered NaCl composition in the hydrogel. For each surface ratio view, a representative cross-section view is indicated with “prime” annotation. With NaCl as the primary variable relative to the GO:PEG, the ratios shown include (A) 1:2; (B) 1:4; (C)1:8; (D)1:12; and (E) 1:16. The scale bars are 20 μm for the images in A–D and 50 μm in E.
Evaluating Biocompatibility of the GO-3D Mesh.
In order to determine the biocompatibility of the GO-3D mesh, brain-derived vascular endothelial cells and perivascular fibroblast cells were used for all cell culture assays (Figure 6A). The vascular cell populations were chosen to test the mesh for two reasons: (1) the use of heterotypic populations more closely reflects the heterogeneity and complexity of an in vivo system and (2) vascularization of any engineered tissue is required for tissue stability and successful incorporation. Because perivascular fibroblasts mature into vascular pericytes in coculture with endothelial cells,45,46 this combination provides a unique opportunity to test biocompatibility and the morphological alterations in the cells together in the 3D microenvironment. The endothelial and fibroblast cells were trypsinized to a single cell suspension and then transferred to two GO-3D meshes and allowed to colonize the mesh over the course of 7 days in solo culture. The goal was to determine whether the GO-3D mesh could be used to establish microenvironment conditions that support cell growth in vitro. After 7 days, the populations grown in solo culture on the GO-3D mesh were collected and fixed for SEM analysis to visualize the distribution and morphology of the cells in the porous structure. The endothelial cells grown in solo culture (Figure 6A–D) form tightly associated layers (white arrows) that cover the interior of the GO-3D mesh. The cells line the interior pores and layer across the intercalated regions between pores. The perivascular fibroblasts have a distinct morphology reflecting the highly migratory behavior often displayed by this cell type. The perivascular fibroblasts send cell projections across distances, often with extensive fiber formation (Figure 6E–H). Both types of cells grew and adhered well on GO-3D mesh even after 7 days in culture.
Figure 6.

GO-3D mesh supports survival and normal morphology in brain-derived vascular cells. Mouse-brain-derived vascular endothelial cells (A–D) and perivascular fibroblast cells (E–H) are able to adhere and survive in the GO-3D mesh. (A) Endothelial cells (white arrows) aggregate together and grow on the mesh with cell bodies piling to form an inner cellular sheath or form adjacent clusters of cells on the edges of the mesh and inside the pores. (B) Fibroblast cells (red arrows) adhere to the mesh and inside the pores and extend processes to connect with other cells and interior pore regions. Regions of open graphene are indicated by blue asterisks for comparison. The scale bar is 10 μm in A–D, F and G, 40 μm in E, and 5 μm in H.
In order to quantify vascular cell proliferation on the GO-3D mesh, an MTT assay was conducted on both cell types to determine population effects over time and to compare the responses of the two cell types on the mesh. Cells were plated on standard tissue culture plastic wells and, in parallel, on GO-3D mesh in plastic wells. This constituted three conditions: (1) baseline growth on plastic, (2) growth on GO-3D mesh, and (3) residual cell growth on the plastic in the GO-3D mesh well for cells not adhering to the mesh (plastic-adherent). Two sets of analyses were conducted comparing growth on 2D plastic versus GO-3D (Figure 7) and the difference in population distribution between the cells in the same well but adhered to the GO-3D mesh versus the residual cells in the well (Figure 8). Two initial plating densities and three time points were compared for each cell type using two-way ANOVA, and the statistical results for growth condition, time in culture, and the interaction of the two variables are presented in Table 2. The endothelial cells cultured on GO-3D mesh plastic had higher values in the MTT assay relative to the cells grown on plastic alone. This difference was particularly apparent at the higher plating density. A different growth pattern was observed in the perivascular fibroblasts that had initial improved growth on the GO-3D mesh relative to the 2D plastic at 3 and 5 days in culture. However, the cells showed reduced values in the MTT assay by 7 days in culture for both growth substrates with the most pronounced negative effect observed on the GO-3D mesh. In comparing the assessment of cells within the same well (plastic-adherent versus GO-3D) it was clear that the two cell types showed distinct distribution and growth patterns. The endothelial cells were largely restricted to the GO-3D mesh with minimal residual cells detected on the plastic in the same well (Figure 8A,B) with no major differences observed with initial plating density. In contrast, the perivascular fibroblasts grew well on both the 2D plastic and the GO-3D, although the MTT assay values from GO-3D mesh were consistently larger, compared with the plastic-adherent population at the 3 and 5 day time points, regardless of initial plating density (Figure 8C,D).
Figure 7.

GO-3D mesh supports cell proliferation in brain-derived vascular cells. MTT assay quantification is shown for endothelial cells (A,B) and perivascular fibroblasts (C,D) assessed at 3 days (d), 5 days, and 7 days postplating at low (2500 cells/well) and high (5000 cells/well) initial cell density. Cells were grown in standard tissue culture plastic wells (open bars) and on the GO-3D mesh (black bars). Data shown are the average and standard deviation of 5 replicates for each condition and the experiment was repeated twice. The two-way ANOVA with culture condition (plastic versus GO-3D) and days in culture (3, 5, or 7) showed distinct differences between and among populations, although the culture condition accounted for a significant amount of the variation in endothelial cells plated at low density. ANOVA values are provided in Table 2. In contrast, the time in culture accounted for a significant portion of the variation in the perivascular fibroblasts, plated at low density with less impact associated with the GO-3D mesh, overall. The paired-wise analysis with Sidak’s multiple comparisons posthoc test showed significance with bars indicating a comparison: p < 0.05 was presented as *, p < 0.01 was presented as **, and p < 0.001 was presented as ***.
Figure 8.

Vascular endothelial cells and perivascular fibroblasts respond differently to growth in the GO-3D or plastic-adherent populations. MTT assay quantification is shown for endothelial cells (A,B) and perivascular fibroblasts (C,D) assessed at 3 days (d), 5 days, and 7 days postplating at low (2500 cells/well) and high (5000 cells/well) initial cell density. The data were collected from the GO-3D mesh (black bars) or the plastic-adherent cell population from that same well (open bars) to compare the same cell source population and the differential distribution and outcome onto GO-3D mesh versus the plastic-adherent in the same well. Data shown are the average and standard deviation of 5 replicates for each condition and the experiment was repeated twice. The two-way ANOVA with plastic-adherent versus GO-3D and days in culture (3, 5, or 7) showed distinct differences between and among populations, with the presence of the mesh accounting for a significant amount of the variation in endothelial cells plated at low density with a similar effect observed over time in culture at low density. ANOVA values are provided in Table 2. The GO-3D mesh also accounted for a significant portion of the variation relative to the plastic adherent cells in the same well for the perivascular fibroblasts. The paired-wise analysis with Sidak’s multiple comparisons posthoc test showed significance with bars indicating a comparison: p < 0.05 was presented as *, p < 0.01 was presented as **, and p < 0.001 was presented as ***.
Table 2.
Two-Way ANOVA Analysis of MTT Proliferation Assay on Endothelial Cells and Perivascular Fibroblasts Grown on Plastic versus GO-3D Mesha
| I. comparison: plastic versus GO-3D | ||
| interaction (condition × time) | growth condition | time in culture |
| (Dfn = 1, Dfd = 24) | (Dfn = 1, Dfd = 24) | (Dfn = 2, Dfd = 24) |
| EC2500 12.85%, F = 11.61, p = 0.003 | 11.7%, F = 21.15, p = 0.0001 | 62.15%, F = 56.13, p < 0.0001 |
| EC5000 23.53%, F = 55.87, p < 0.0001 | 8.49%, F = 40.3, p < 0.0001 | 62.93%, F = 144.44, p < 0.0001 |
| Fb2500 6.73%, F = 3.09, p = 0.0638 | 0.71%, F = 0.65, p = 0.4269 | 66.47%, F = 30.57, p < 0.0001 |
| Fb5000 8.53%, F = 4.72, p = 0.0186 | 3.75%, F = 4.15, p = 0.0528 | 66.04%, F = 36.57, p < 0.0001 |
| II. comparison: plastic-adherent (same well) versus GO-3D | ||
| interaction (condition × time) | growth condition | time in culture |
| (Dfn = 1, Dfd = 24) | (Dfn = 1, Dfd = 24) | (Dfn = 2, Dfd = 24) |
| EC2500 24.71%, F = 35.41, p < 0.0001 | 59.33%, F = 170.04, p < 0.0001 | 7.59%, F = 10.88, p = 0.0004 |
| EC5000 38.07%, F = 55.87, p < 0.0001 | 34.61%, F = 132.49, p < 0.0001 | 21.05%, F = 40.29, p < 0.0001 |
| Fb2500 14.06%, F = 6.54, p = 0.0054 | 23.61%, F = 21.96, p < 0.0001 | 36.54%, F = 17.00, p < 0.0001 |
| Fb5000 10.89%, F = 8.26, p = 0.0019 | 44.26%, F = 67.10, p < 0.0001 | 29.02%, F = 22.00, p < 0.0001 |
Data are reported as % variance with the F ratio, degrees of freedom for the numerator (Dfn) and the denominator (Dfd), and the calculated p value for each of the two variables (growth condition and time in culture) and are linked to the results in Figure 7 and Figure 8.
As part of the GO-3D mesh biocompatibility assessment, it was important to determine whether or not gene expression studies could be conducted on cells grown on the mesh; specifically, whether or not the system was amenable to RNA isolation. This is a critical requirement for any 3D scaffold material since gene expression changes could then be linked to single or multi-cell type culture parameters. The vascular-derived endothelial cells and perivascular fibroblast cells were cultured separately on plastic and on GO-3D mesh. RNA was isolated from both populations (Figure 9) as well as the plastic-adherent population derived from the well containing the GO-3D mesh. Expression of targeting two different reference genes (18S and Gapdh) and vascular cell markers (PdgfβR and Akap12/Gravin) was detected in the treatment conditions, and the specific primers and amplicon sizes are provided in Table 1. As an additional assessment of biocompatibility, it was important to characterize the vascular cells grown together on the GO-3D mesh because these two cell types are closely associated in blood vessels in vivo. Because the GO-3D mesh is coated with gelatin prior to cell plating, the distribution of collagen Type IV was immunolabeled across cryosections of the mesh, revealing a punctate pattern of labeling (Figure 10A,B). The endothelial cells and perivascular fibroblasts were in close apposition to one another in the mesh, often localized to the edges of the mesh or on the interiors of the pores. A bright field image of the GO-3D mesh with cells is shown (Figure 10D) with open areas (no mesh scaffold, bright zone) in which the cells adhered to the edge of the mesh. In a normal blood vessel, the endothelial cells form the lumen of the vessel and the perivascular fibroblasts are positioned ablumenally, as seen for blood vessels in embryonic mouse forebrain shown in sagittal and cross-section view (Figure 11A–C). Confocal imaging of the vascular cells grown together on GO-3D mesh revealed morphological features akin to those of vessels in vivo, with the two distinct cell populations not only closely associated, but forming cords reminiscent of capillaries. The orthogonal views of the z-series confocal stack in the GO-3D mesh revealed that the cells were closely intertwined on the mesh pores (Figure 11E), reflecting the suitability of the 3D microenvironment as a growth scaffold for these distinct vascular populations.
Figure 9.
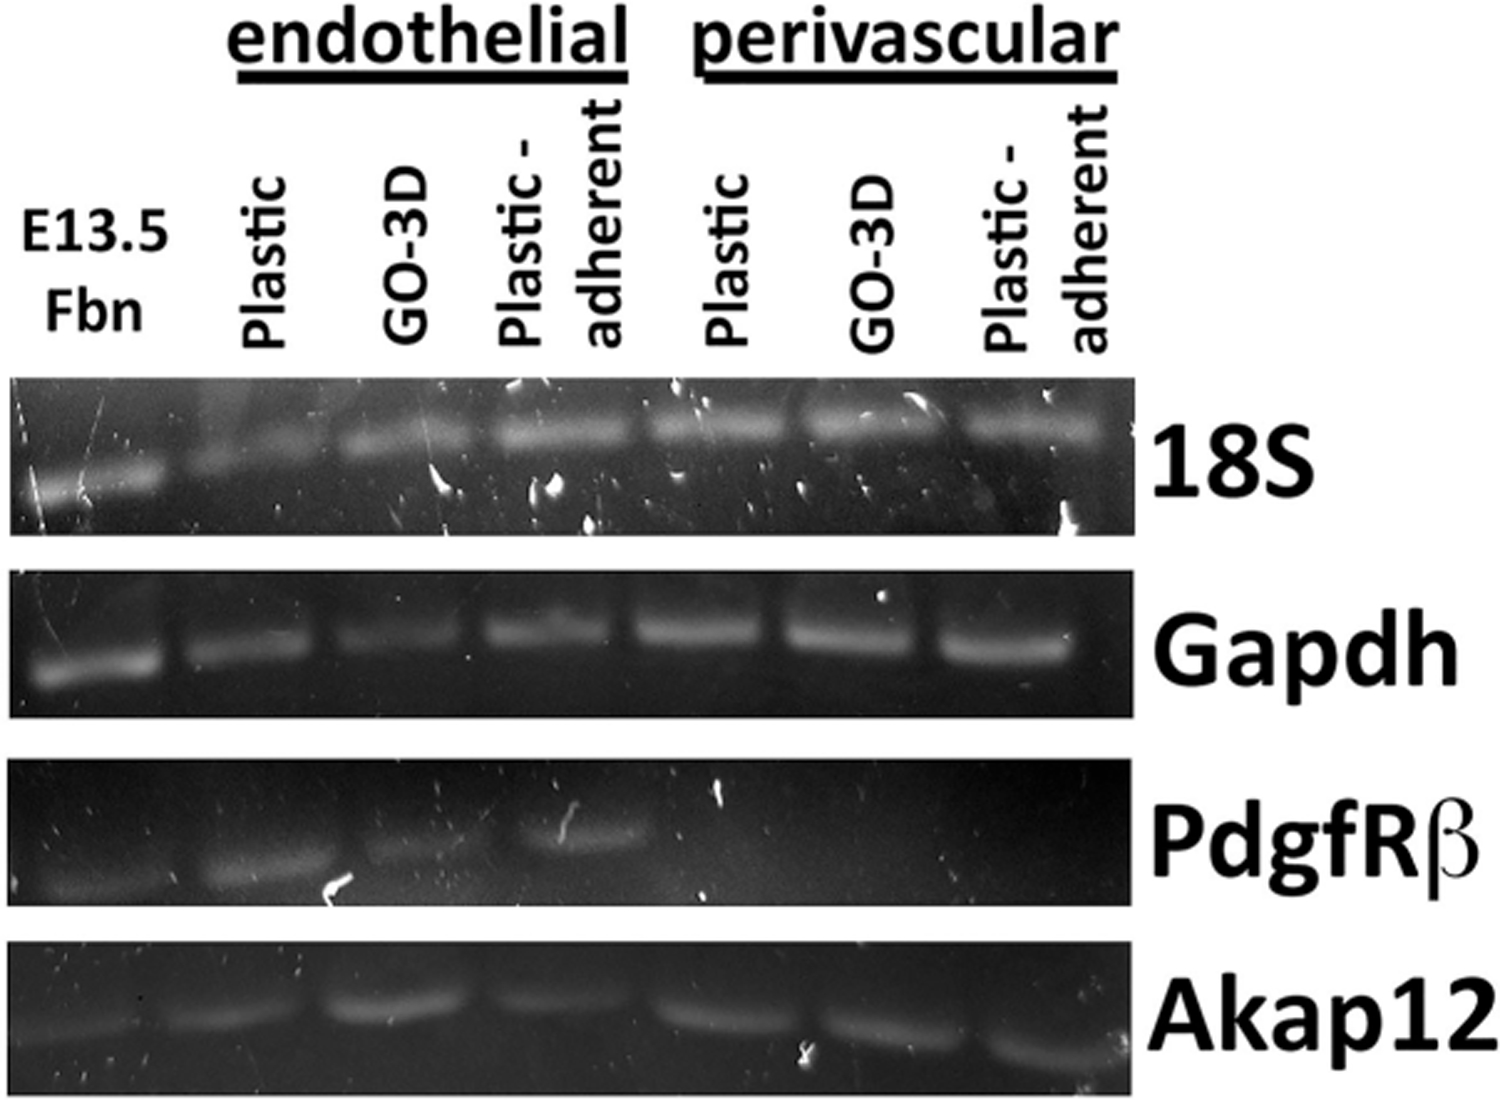
GO-3D mesh is compatible with RNA isolation and gene expression analysis. Brain-derived vascular endothelial cells and perivascular fibroblasts were cultured on gelatin-coated tissue culture plastic (Plastic) or on GO-3D mesh (GO-3D). RNA was isolated from both populations as well as from the cells that remained in the well after the GO-3D mesh was removed (plastic-adherent). RNA was converted to cDNA and then qualitatively screened for expression of two reference genes (18S and Gapdh) and two genes associated with vascular cells (PdgfRβ and Akap12/Gravin). Vascularized embryonic day 13.5 dorsal forebrain (E13.5 Fbn) tissue from mouse was used as a positive control tissue source for comparison. Cell-type-specific labels are shown above the different growth conditions and bands for individual genes are indicated to the right.
Figure 10.

Gelatin coating supports growth of brain-derived vascular cells grown on GO-3D mesh. GO-3D mesh was coated with gelatin and then vascular-derived endothelial and fibroblast cells were grown in heterotypic direct coculture for 7 days. GO-3D mesh was fixed and cryosectioned at 10 μm intervals. A representative section is shown that was threshold inverted to depict the graphene (A, white areas) with the blue line marking the edge of the section. The section was immunolabeled for collagen (B) to identify areas of protein coating on the mesh. The white arrows point to areas of concentrated collagen deposition, although the protein is present throughout the section shown. The vascular cell-GO-3D mesh sections were also labeled for cell-type specific markers (C) and confocal fluorescence Z- stack images generated of the endothelial cells (isolectin G4, green), perivascular fibroblasts (smooth muscle α-actin, red), and nuclei (ToPro3, blue). Bright field imaging of the fluorescence Z stack series is shown for comparison (D). The green arrows indicate the zones with pores inside the GO-3D mesh, and the red arrows indicate the cells growing in the GO-3D mesh. The scale is 50 μm in A and B, 20 μm in C and D.
Figure 11.

Brain-derived vascular cells form capillary-like structures on GO-3D mesh. To provide a comparison of vessels in vivo, embryonic day 11.5 mouse forebrain was fixed, cryosectioned at 10 μm intervals and labeled for cell-type specific markers. Endothelial cells were labeled with isolectin G4 (A, green) and perivascular fibroblasts were labeled for NG2 proteoglycan as a pericyte marker (B, red). The overlay of the two channels with nuclei localized with DAPI (C, blue) is shown for comparison. The arrows indicate a sagittal view of a branched capillary blood vessel and the asterisks indicates the lumen of a larger vessel in cross-section. The brain-derived vascular endothelial cells and perivascular fibroblasts were grown in heterotypic direct coculture for 7 days on the GO-3D mesh. The cells and mesh were fixed, cryosectioned at 10 μm intervals, and immunolabeled for cell-type specific markers. Confocal fluorescence Z- stack images were generated from cryosections of fixed cells in mesh. Endothelial cells were labeled with isolectin G4 (green) and perivascular fibroblasts were labeled for smooth muscle α-actin (red). The compressed z-stack shows the intercalated morphology of the two cell types (C) with the rotated, orthogonal plane shown (D) to demonstrate the variation across the x and y axes. The scale is 50 μm in A–C and 20 μm in D,E.
DISCUSSION
One of the major challenges with investigating tissue cellular complexity and the changes in gene expression linked to form, fate, and function is that tissues develop in a 3D context in which different cell types develop, interact, migrate and connect over time. There is an increasing need to develop tools to investigate the cellular and integrative complexity of tissues in a controlled in vitro environment. Historically, there have been a number of 3D models utilized to investigate tissue formation to identify the relevant spatial, fluid dynamic, and matrix components required to recapitulate tissue development in vitro. Recent primary research and review articles have highlighted a variety of compositional and structural resources available, ranging from the traditional matrix-based collagen or matrigel approaches to biomimetic substrates, engineered spheroids, and “organs-on-a-chip”.47–53 A few of these physical models are beginning to approach providing an environmental resource (or matrix) in addition to a complex cellular environment to tackle the challenge of recapitulating cell structure/function during tissue formation. The 3D graphene-based materials are among the most promising sources for “bottom-up” nanotechnology and these materials have found novelty as catalysts, sensors, biomaterials, and photonic materials in many technological applications.54 Most recently, increasing attention has been paid to graphene-based 3D nanomaterials for in vitro cultures, particularly in the nervous system.55–57 Herein we describe a method for synthesizing a stable, tunable porous mesh generated from GO-PEG using a salt-leaching approach and test the basic biocompatibility of the resultant 3D scaffold. One of the most valuable features of the GO-3D mesh is that the porosity and tensility of the scaffold are tunable, based on the component ratios and synthesis method used. PEG plays an important role for effectively adjusting the mechanical properties of the 3D mesh and adapting the final structure for a range of in vitro applications. The addition of the salt-leaching method to our synthesis approach synergizes well with the GO:PEG ratio synthetic process and allows us to tailor the porosity and pore-size distribution of the GO-3D mesh. Finally, we successfully cultured brain-derived vascular endothelial cells and perivascular fibroblast cells using the developed GO-3D mesh and purified RNA from GO-3D mesh cells. The experimental results demonstrate the tremendous potential of the developed GO-3D mesh to be used in cell culture applications.
Hydrogen bond formation is one of the most well-known and widely used physical interactions in preparation methods for physical gels (or hydrogels). In our model of how the GO-3D mesh forms (shown in schematic, Figure 1), the hydrogel likely forms through hydrogen bonds established between carboxyl groups of the GO sheets and the hydroxyl groups of the PEG polymer. The long and flexible PEG hydroxyl side chain could connect to GO by hydrogen bonds to form a spatial network structure. We determined that a porosity less than 90% provides sufficient interior pores and pore connectivity to be stable and still flexible enough to be utilized in cell culture applications. The results demonstrated the feasibility of cell culture application of the GO-3D mesh since biocompatible nanomaterial would need to be able to absorb fluids sufficiently well to mimic the aqueous cellular microenvironment. The GO-3D mesh described herein is fully capable of absorbing aqueous fluids and remaining stable over time. Stability and a biocompatible aqueous interface will be a critical feature of any scaffold that might be used to investigate cell–cell or cell–microenvironmental interactions associated with tissue engineering.
Previous studies investigating 3D scaffolds in tissue engineering have determined that varying scaffold pore size can impact different cellular functions with the micropore size (<10 μm) improving the cell proliferation and the macropore size (>50 μm) promoting the migration, interaction, and differentiation of a variety of cell types.40,58 The porosity and pore interconnectedness that we have optimized with our GO-3D mesh is, therefore, within this range and supports the applicability of our 3D mesh to cell culture approaches. Moreover, recent evidence suggests that the shapes of cells, particularly shape changes that influence nuclear shape, may play a critical role in regulating gene expression, thereby linking the nucleosome structure and the cellular microenvironment.59–61 In agreement with these data, we observed a different response in cell proliferation for growth on GO-3D mesh versus plastic wells depending on cell type, thereby validating our rationale for testing both cell types. The cells cultured in plastic alone were spatially limited to the plastic surface area only. In contrast, the porous structure of GO-3D mesh increased the surface area to permit more cells growing at the surface and the interior. Our results demonstrated that the GO-3D mesh had sufficient biocompatibility to support cells, albeit with a different response time for the two cell types. For endothelial cells, for example, contact-based inhibition routinely occurs as cells become confluence over time in culture, while fibroblasts continue to divide in culture.45,46 Similar to previously reported data, neural stem cells and human mesenchymal stem cells (hMSC) were studied on graphene scaffold,62 in which the cells preferentially grew and had good differentiation performance on a graphene scaffold. We were able to successfully culture two distinct types of cells on the GO-3D mesh, brain vascular-derived perivascular fibroblast, and endothelial cells, which is promising for future application with a variety of cell types. Taken together, our results support the applicability of our mesh for use in cell culture with the added advantage of tunable properties that can be adjusted for different cell types.
Naturally, the different types of cells growing in vivo do not always grow as a homogeneous population, but rather contact and share microenvironmental signals with surrounding heterotypic cell types. Therefore, studying interactions among multiple types of cells is beneficial for investigating the microenvironmental and gene regulatory mechanisms associated with cell–cell contact/interactions in vivo. Multiple cells types have been utilized in tissue engineering applications, such as organ formation63 and blocking angiogenesis in cancer.64,65 Indeed, graphene-based scaffolds have been tested for their potential use in generating neuronal cells from NSC.66 The merger between in vitro synthesis and growth paradigms with applications to in vivo bioengineering and drug delivery has significantly changed how we approach in vitro culture models. Recently, extrusion-based bioprinting has been explored as an approach for generating cell-infused scaffolds, with the potential to generate a 3D tissue for implantation.67 In addition, functionalized natural products such as spider silk, have been investigated for generating fiber-based drug delivery tools in vivo.68 With our 3D system, we observed close apposition of the vascular endothelial cells and perivascular fibroblasts grown on GO-3D mesh, showing similar morphology to their heterotypic interactions in vivo. Therefore, GO-3D mesh may prove to be a valuable addition to the toolkit for investigating cell–cell interactions in vitro. Indeed, tissue engineering in vitro for subsequent implantation may benefit from a merger of the graphene-based 3D scaffold approach and extrusion bioprinting, although considerably more investigation toward modifying scaffold structure and biocompatibility will be required to take full advantage of both approaches.
ACKNOWLEDGMENTS
This research was supported by the NIH–COBRE on Epigenomics of Development and Disease 4P20GM104360-04 (K.M., R.T., D.D.), NIH-R15/AREA 2R15NS057807-02 (K.M., D.D.), UND Vice President for Research & Economic Development Postdoctoral Funding Program (Y.Z., X.W.), NSF grant CHE 1709160 (J.X.Z.), North Dakota Industrial Commission (G-041-081, J.X.Z.), and Hebei Natural Science Foundation, China C2016106056 (Y.Z.). The authors acknowledge the use of the Edward C. Carlson Imaging and Image Analysis Core Facility which is supported in part by NIH grant 1P30GM103329. We thank Elvira Tkach, Jadyn Cox, Grace Hill, Steven Russell, Jeremy Martin, and Iman Said for their technical help. We also thank Mr. Zijun Wang (UND Chemistry Department, Dr. Xiaodong Hou (UND Center), and Dr. Frank Feng Xiao (UND Civil Engineering) for helpful comments on the content of the manuscript.
Footnotes
The authors declare no competing financial interest.
REFERENCES
- (1).Matricardi P; Di Meo C; Coviello T; Hennink WE; Alhaique F Interpenetrating polymer networks polysaccharide hydrogels for drug delivery and tissue engineering. Adv. Drug Delivery Rev. 2013, 65 (9), 1172–1187. [DOI] [PubMed] [Google Scholar]
- (2).Crompton KE; Goud JD; Bellamkonda RV; Gengenbach TR; Finkelstein DI; Horne MK; Forsythe JS Polylysine-functionalised thermos-responsive chitosan hydrogel for neural tissue engineering. Biomaterials 2007, 28, 441–449. [DOI] [PubMed] [Google Scholar]
- (3).Leipzig ND; Wylie RG; Kim H; Shoichet MS Differentiation of neural stem cells in three-dimensional growth factor-immobilized chitosan hydrogel scaffolds. Biomaterials 2011, 32, 57–64. [DOI] [PubMed] [Google Scholar]
- (4).Wen S; Wang Z; Zheng X; Wang X Improved mechanical strength of porous chitosan scaffold by graphene coatings. Mater. Lett. 2017, 186, 17–20. [Google Scholar]
- (5).Adams RD; Rendell SR; Counts LR; Papke JB; Willits RK; Harkins AB Electrical and neurotrophin enhancement of neurite outgrowth within a 3D collagen scaffold. Ann. Biomed. Eng. 2014, 42, 1282–1291. [DOI] [PMC free article] [PubMed] [Google Scholar]
- (6).Chen CH; Kuo SM; Liu GS; Chen WNU; Chuang CW; Liu LF Enhancement of neurite outgrowth in neuron cancer stem cells by growth on 3-D collagen scaffolds. Biochem. Biophys. Res. Commun. 2012, 428, 68–73. [DOI] [PubMed] [Google Scholar]
- (7).Baiguera S; Del Gaudio C; Lucatelli E; Kuevda E; Boieri M; Mazzanti B; Bianco A; Macchiarini P Electrospun gelatin scaffolds incorporating rat decellularized brain extracellular matrix for neural tissue engineering. Biomaterials 2014, 35, 1205–1214. [DOI] [PubMed] [Google Scholar]
- (8).Canas AI; Delgado JP; Gartner C Biocompatible scaffolds composed of chemically crosslinked chitosan and gelatin for tissue engineering. J. Appl. Polym. Sci. 2016, 133, 43814. [Google Scholar]
- (9).Zhang Q; Yan S; Li M; Wang J Growth of primary hippocampal neurons on multichannel silk fibroin scaffold. Fibers Polym. 2014, 15, 41–46. [Google Scholar]
- (10).Meng F; Modo M; Badylak SF Biologic scaffold for CNS repair. Regener. Med. 2014, 9, 367. [DOI] [PubMed] [Google Scholar]
- (11).Walker PA; Aroom KR; Jimenez F; Shah SK; Harting MT; Gill BS; Cox CS Jr Advances in progenitor cell therapy using scaffolding constructs for central nervous system injury. Stem Cell Rev. and Rep. 2009, 5, 283–300. [DOI] [PMC free article] [PubMed] [Google Scholar]
- (12).Wang Y; Wei YT; Zu ZH; Ju RK; Guo MY; Wang XM; Xu QY; Cui FZ Combination of hyaluronic acid hydrogel scaffold and PLGA microspheres for supporting survival of neural stem cells. Pharm. Res. 2011, 28, 1406. [DOI] [PubMed] [Google Scholar]
- (13).Yim EKF; Leong KW Proliferation and differentiation of human embryonic germ cell derivatives in bioactive polymeric fibrous scaffold. J. Biomater. Sci., Polym. Ed. 2005, 16, 1193–1217. [DOI] [PubMed] [Google Scholar]
- (14).Voicu SI; Condruz RM; Mitran V; Cimpean A; Miculescu F; Andronescu C; Miculescu M; Thakur VK Sericin covalent immobilization onto cellulose acetate membrane for biomedical applications. ACS Sustainable Chem. Eng. 2016, 4 (3), 1765–1774. [Google Scholar]
- (15).Sudo Y; Sakai H; Nabae Y; Hayakawa T; Kakimoto M Preparation of hyperbranched polystyrene-g-poly-(Nisopropylacrylamide) copolymers and its application to novel thermo-responsive cell culture dishes. Polymer 2015, 70, 307–314. [Google Scholar]
- (16).Aldana AA; Abraham GA Current advances in electrospun gelatin-based scaffolds for Tissue engineering applications. Int. J. Pharm. 2017, 523, 441. [DOI] [PubMed] [Google Scholar]
- (17).Regis S; Youssefian S; Jassal M; Phaneuf M; Rahbar N; Bhowmick S Integrin a5b1-mediated attachment of NIH/3T3 fibroblasts to fibronectin adsorbed onto electrospun polymer scaffolds. Polym. Eng. Sci. 2014, 54, 2587–2594. [Google Scholar]
- (18).JunHan Z; Rider AE; Ishaq M; Kumar S; Kondyurin A; Bilek MMM; Levchenko I; Ostrikov K Carbon nanostructures for hard tissue engineering. RSC Adv. 2013, 3, 11058–11072. [Google Scholar]
- (19).Menaa F; Abdelghani A; Menaa B Graphene nanomaterials as biocompatible and conductive scaffolds for stem cells: impact for tissue engineering and regenerative medicine. J. Tissue Eng. Regener. Med. 2015, 9, 1321–1338. [DOI] [PubMed] [Google Scholar]
- (20).Di H; Yu Z; Ma Y; Pan Y; Shi H; Lv L; Li F; Wang C; Long T; He Y Anchoring calcium carbonate on graphene oxide reinforced with anticorrosive properties of composite epoxy coatings. Polym. Adv. Technol. 2016, 27, 915–921. [Google Scholar]
- (21).Akhavan O; Ghaderi E; Shirazian SA Near infrared laser stimulation of human neural stem cells into neurons on graphene nanomesh semiconductors. Colloids Surf., B 2015, 126, 313–321. [DOI] [PubMed] [Google Scholar]
- (22).Goenka S; Sant V; Sant S Graphene-based nanomaterials for drug delivery and tissue engineering. J. Controlled Release 2014, 173, 75–88. [DOI] [PubMed] [Google Scholar]
- (23).Bressan E; Ferroni L; Gardin C; Sbricoli L; Gobbato L; Ludovichetti FS; Tocco I; Carraro A; Piattelli A; Zavan B Graphene based scaffolds effects on stem cells commitment. J. Transl. Med. 2014, 12, 296–310. [DOI] [PMC free article] [PubMed] [Google Scholar]
- (24).Akhavan O; Ghaderi E; Shirazian SA; Rahighi R Rolled graphene oxide foams as three-dimensional scaffolds for growth of neural fibers using electrical stimulation of stem cells. Carbon 2016, 97, 71–77. [Google Scholar]
- (25).Mycielska ME; Djamgoz MB Cellular mechanisms of direct-current electric field effects: galvanotaxis and metastatic disease. J. Cell Sci. 2004, 117, 1631–1639. [DOI] [PubMed] [Google Scholar]
- (26).Huang YJ; Samorajski J; Kreimer R; Searson PC The influence of electric field and confinement on cell motility. PLoS One 2013, 8, e59447. [DOI] [PMC free article] [PubMed] [Google Scholar]
- (27).Tang M; Song Q; Li N; Jiang Z; Huang R; Cheng GS Enhancement of electrical signaling in neural networks on graphene films. Biomaterials 2013, 34, 6402–6411. [DOI] [PubMed] [Google Scholar]
- (28).Lee C; Wei X; Kysar JW; Hone J Measurement of the elastic properties and intrinsic strength of monolayer graphene. Science 2008, 321, 385–388. [DOI] [PubMed] [Google Scholar]
- (29).Byrne DP; Lacroix D; Planell JA; Kelly DJ; Prendergast PJ Simulation of tissue differentiation in a scaffold as a function of porosity, Young’s modulus and dissolution rate: Application of mechanobiological models in tissue engineering. Biomaterials 2007, 28, 5544–5554. [DOI] [PubMed] [Google Scholar]
- (30).Cai D; Jin J; Yusoh K; Rafiq R; Song M High performance polyurethane/functionalized graphene nanocomposites with improved mechanical and thermal properties. Compos. Sci. Technol. 2012, 72, 702–707. [Google Scholar]
- (31).Cano M; Khan U; Sainsbury T; O’Neill A; Wang Z; McGovern IT; Maser W; Benito AM; Coleman JN Improving the mechanical properties of graphene oxide based materials by covalent attachment of polymer chains. Carbon 2013, 52, 363–371. [Google Scholar]
- (32).Kim J; Kim YR; Kim Y; Lim KT; Seonwoo H; Park S; Cho SP; Hong BH; Choung PH; Chung TD; Choung YH; Chung JH Graphene-incorporated chitosan substrata for adhesion and differentiation of human mesenchymal stem cells. J. Mater. Chem. B 2013, 1, 933–938. [DOI] [PubMed] [Google Scholar]
- (33).Shin YC; Lee JH; Jin L; Kim MJ; Kim YJ; Hyun JK; Jung TG; Hong SW; Han DW Stimulated myoblast differentiation on graphene oxide-impregnated PLGA-collagen hybrid fibre matrices. J. Nanobiotechnol. 2015, 13, 21–31. [DOI] [PMC free article] [PubMed] [Google Scholar]
- (34).Yang F; Murugan R; Ramakrishna S; Wang X; Ma YX; Wang S Fabrication of nano-structured porous PLLA scaffold intended for nerve tissue engineering. Biomaterials 2004, 25, 1891–1900. [DOI] [PubMed] [Google Scholar]
- (35).Zhou T; Zhang B; Wei P; Du Y; Zhou H; Yu M; Yan L; Zhang W; Nie G; Chen C; Tu Y; Wei T Energy metabolism analysis reveals the mechanism of inhibition of breast cancer cell metastasis by PEG-modified graphene oxide nanosheets. Biomaterials 2014, 35, 9833–9843. [DOI] [PubMed] [Google Scholar]
- (36).Xu Z; Wang S; Li Y; Wang M; Shi P; Huang X Covalent functionalization of graphene oxide with biocompatible poly(ethylene glycol) for delivery of paclitaxel. ACS Appl. Mater. Interfaces 2014, 6, 17268–17276. [DOI] [PubMed] [Google Scholar]
- (37).Mendonça MC; Soares ES; de Jesus MB; Ceragioli HJ; Batista ÂG; Nyúl-Tóth Á; Molnár J; Wilhelm I; Marostica MR; Krizbai I; da Cruz-Hofling MA PEGylation of reduced graphene oxide induces toxicity in cells of the blood-brain barrier: an in vitro and in vivo study. Mol. Pharmaceutics 2016, 13, 3913. [DOI] [PubMed] [Google Scholar]
- (38).Majeed W; Bourdo S; Petibone DM; Saini V; Vang KB; Nima ZA; Alghazali KM; Darrigues E; Ghosh A; Watanabe F; Casciano D; Ali SF; Biris AS The role of surface chemistry in the cytotoxicity profile of graphene. J. Appl. Toxicol. 2017, 37, 462–470. [DOI] [PubMed] [Google Scholar]
- (39).Sun X; Sun H; Li H; Peng H Developing polymer composite materials: carbon nanotubes or graphene? Adv. Mater. 2013, 25, 5153–5176. [DOI] [PubMed] [Google Scholar]
- (40).Karageorgiou V; Kaplan D Porosity of 3D biomaterial scaffolds and osteogenesis. Biomaterials 2005, 26, 5474–5491. [DOI] [PubMed] [Google Scholar]
- (41).Cao X; Yin Z; Zhang H Three-dimensional graphene materials: preparation, structures and application in supercapacitors. Energy Environ. Sci. 2014, 7, 1850–1865. [Google Scholar]
- (42).Roohani-Esfahani SI; Newman P; Zreiqat H Design and Fabrication of 3D printed Scaffolds with a Mechanical Strength Comparable to Cortical Bone to Repair Large Bone Defects. Sci. Rep. 2016, 6, 19468. [DOI] [PMC free article] [PubMed] [Google Scholar]
- (43).Unnithan AR; Park CH; Kim CS Nanoengineered bioactive 3D composite scaffold: A unique combination of graphene oxide and nanotopography for tissue engineering applications. Composites, Part B 2016, 90, 503–511. [Google Scholar]
- (44).Izadifar Z; Chen X; Kulyk W Strategic Design and Fabrication of Engineered Scaffolds for Articular Cartilage Repair. J. Funct. Biomater. 2012, 3, 799–838. [DOI] [PMC free article] [PubMed] [Google Scholar]
- (45).Darland DC; D’Amore PA TGFβ is required for the formation of capillary-like structures in three-dimensional cocultures of 10T1/2 and endothelial cells. Angiogenesis 2001, 4, 11–20. [DOI] [PubMed] [Google Scholar]
- (46).Darland DC; Massingham LJ; Smith SR; Piek E; Saint-Geniez M; D’Amore PA Pericyte production of cell-associated VEGF is differentiation-dependent and is associated with endothelial survival. Dev. Biol. 2003, 264, 275–288. [DOI] [PubMed] [Google Scholar]
- (47).Adams CF; Dickson AW; Kuiper JH; Chari DM Nanoengineering neural stem cells on biomimetic substrates using magnetofection technology. Nanoscale 2016, 8 (41), 17869–17880. [DOI] [PubMed] [Google Scholar]
- (48).Balasubramanian S; Packard JA; Leach JB; Powell EM Three-dimensional environment sustains morphological heterogeneity and promotes phenotypic progression during astrocyte development. Tissue Eng., Part A 2016, 22 (11–12), 885–898. [DOI] [PMC free article] [PubMed] [Google Scholar]
- (49).Kutys ML; Chen CS Forces and mechanotransduction in 3D vascular biology. Curr. Opin. Cell Biol. 2016, 42, 73–79. [DOI] [PMC free article] [PubMed] [Google Scholar]
- (50).Maclean FL; Williams RJ; Horne MK; Nisbet DR A Commentary on the need for 3D-biologically relevant In vitro environments to investigate astrocytes and their role in central nervous system inflammation. Neurochem. Res. 2016, 41 (3), 589–592. [DOI] [PubMed] [Google Scholar]
- (51).Madl CM; Katz LM; Heilshorn SC Bio-orthogonally crosslinked, engineered protein hydrogels with tunable mechanics and biochemistry for cell encapsulation. Adv. Funct. Mater. 2016, 26 (21), 3612–3620. [DOI] [PMC free article] [PubMed] [Google Scholar]
- (52).Picollet-D’hahan N; Dolega ME; Liguori L; Marquette C; Le Gac S; Gidrol X; Martin DKA 3D toolbox to enhance physiological relevance of human tissue models. Trends Biotechnol. 2016, 34 (9), 757–769. [DOI] [PubMed] [Google Scholar]
- (53).Wang JD; Khafagy E-S; Khanafer K; Takayama S; ElSayed ME Organization of endothelial cells, pericytes, and astrocytes into a 3D microfluidic in vitro model of the blood-brain barrier. Mol. Pharmaceutics 2016, 13 (3), 895–906. [DOI] [PubMed] [Google Scholar]
- (54).Nardecchia S; Carriazo D; Ferrer ML; Gutierrez MD; deĺ Monte, F. Three dimensional macroporous architectures and aerogels built of carbon nanotubes and/or graphene: synthesis and applications. Chem. Soc. Rev. 2013, 42, 794–830. [DOI] [PubMed] [Google Scholar]
- (55).Li N; Zhang Q; Gao S; Song Q; Huang R; Wang L; Liu L; Dai J; Tang M; Cheng G Three-dimensional graphene foam as a biocompatible and conductive scaffold for neural stem cells. Sci. Rep. 2013, 3, 1604. [DOI] [PMC free article] [PubMed] [Google Scholar]
- (56).Ma Q; Yang L; Jiang Z; Song Q; Xiao M; Zhang D; Ma X; Wen T; Cheng GS Three-dimensional stiff graphene scaffold on neural stem cells behavior. ACS Appl. Mater. Interfaces 2016, 8 (50), 34227–34233. [DOI] [PubMed] [Google Scholar]
- (57).Jiang Z; Song Q; Tang M; Yang L; Cheng Y; Zhang M; Xu D; Cheng G Enhanced migration of neural stem cells by microglia grown on a three-dimensional graphene scaffold. ACS Appl. Mater. Interfaces 2016, 8 (38), 25069–25077. [DOI] [PubMed] [Google Scholar]
- (58).Wei Z; Yang JH; Zhou J; Xu F; Zrınyi M; Dussault P; Osada Y; Chen YM Self-healing gels based on constitutional dynamic chemistry and their potential applications. Chem. Soc. Rev. 2014, 43, 8114. [DOI] [PubMed] [Google Scholar]
- (59).Jacobson E; Perry JK; Long DS; Vickers MH; O’Sullivan JM A potential role for genome structure in the translation of mechanical force during immune cell development. Nucleus 2016, 7 (5), 462–475. [DOI] [PMC free article] [PubMed] [Google Scholar]
- (60).Paul CD; Hung WC; Wirtz D; Konstantopoulos K Engineered models of confined cell migration. Annu. Rev. Biomed. Eng. 2016, 18, 159–180. [DOI] [PMC free article] [PubMed] [Google Scholar]
- (61).Konry T; Sarkar S; Sabhachandani P; Cohen N Innovative tools and technology for analysis of single cells and cell-cell interaction. Annu. Rev. Biomed. Eng. 2016, 18, 259–284. [DOI] [PubMed] [Google Scholar]
- (62).Zhang T; Li N; Li K; Gao R; Gu W; Wu C; Su R; Liu L; Zhang Q; Liu J Enhanced proliferation and osteogenic differentiation of human mesenchymal stem cells on biomineralized three-dimensional graphene foams. Carbon 2016, 105, 233–243. [Google Scholar]
- (63).Levenberg S; Rouwkema J; MacDonald M; Garfein ES; Kohane D; Darland DC; Marini R; van Blitterswijk CA; Mulligan RC; D’Amore PA; Langer R Engineering vascularized skeletal muscle tissue. Nat. Biotechnol. 2005, 23 (7), 879–884. [DOI] [PubMed] [Google Scholar]
- (64).Zervantonakis IK; Kothapalli CR; Chung S; Sudo R; Kamm RD Microfluidic devices for studying heterotypic cell-cell interactions and tissue specimen cultures under controlled microenvironments. Biomicrofluidics 2011, 5 (1), 013406. [DOI] [PMC free article] [PubMed] [Google Scholar]
- (65).Theberge AB; Yu J; Young EWK; Ricke WA; Bushman W; Beebe DJ Microfluidic Multiculture Assay to Analyze Biomolecular Signaling in Angiogenesis. Anal. Chem. 2015, 87 (6), 3239–3246. [DOI] [PMC free article] [PubMed] [Google Scholar]
- (66).Akhavan O Graphene scaffolds in progressive nanotechnology/stem cell-based tissue engineering of the nervous system. J. Mater. Chem. B 2016, 4, 3169–3190. [DOI] [PubMed] [Google Scholar]
- (67).Ning L; Chen X A brief review of extrusion-based tissue scaffold bio-printing. Biotechnol. J. 2017, 12, 1600671. [DOI] [PubMed] [Google Scholar]
- (68).Brooks AE The potential of silk and silk-like proteins as natural mucoadhesive biopolymers for controlled drug delivery. Front. Chem. 2015, 3, 65. [DOI] [PMC free article] [PubMed] [Google Scholar]