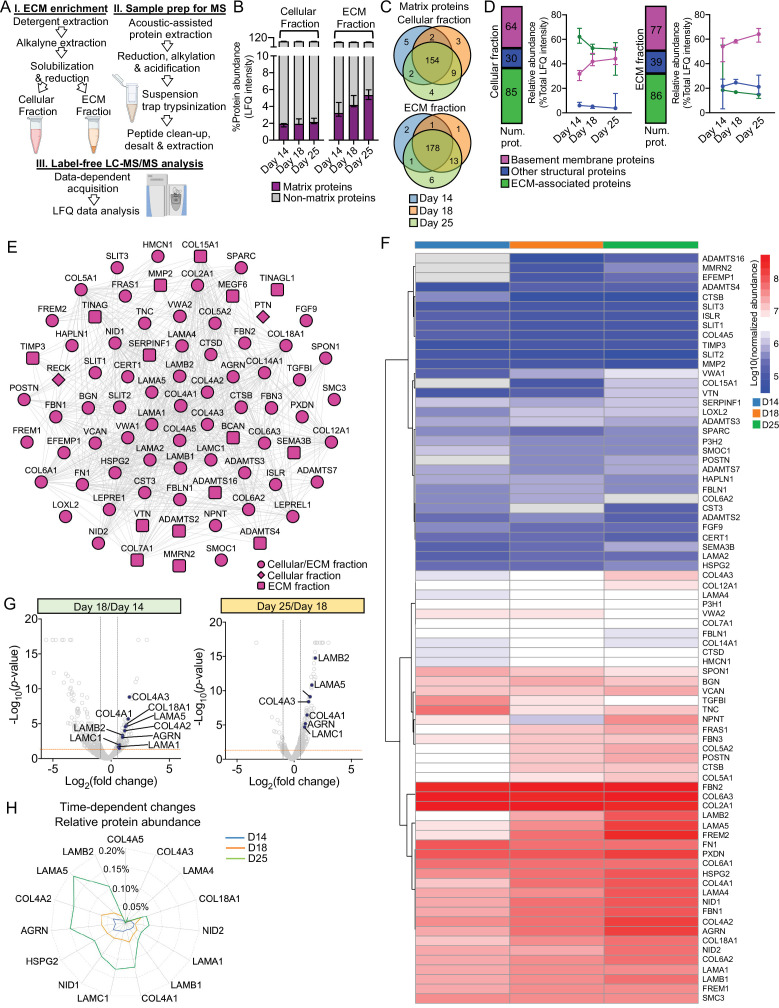
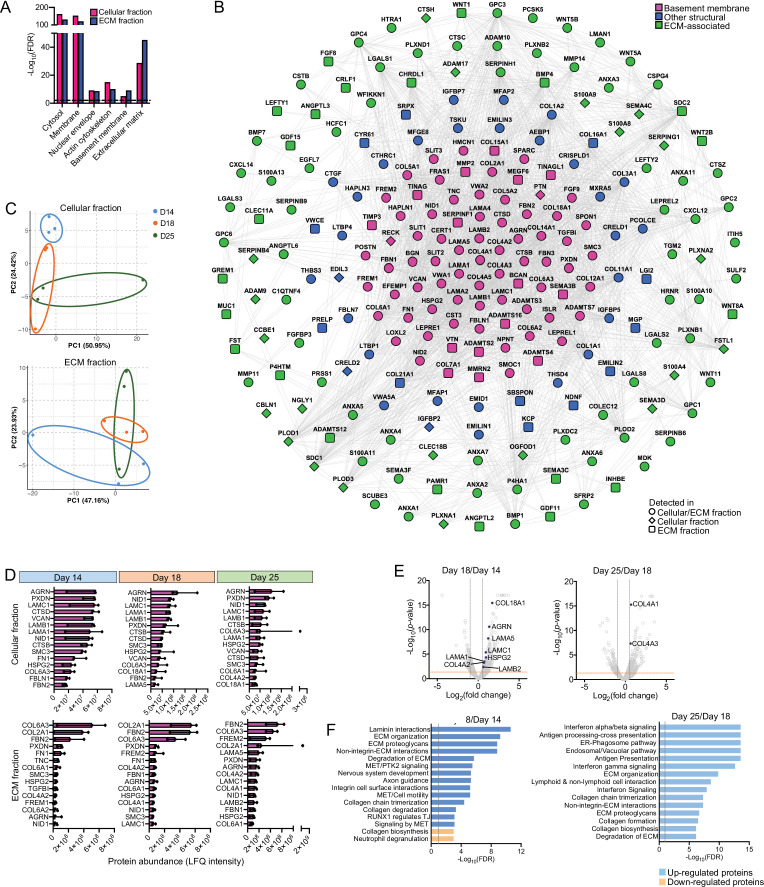
Figure 3. Time course proteomics reveals complex dynamics of basement membrane assembly.
(A) Schematic of sample enrichment for matrix (ECM) proteins for tandem mass spectrometry (MS) analysis (created with BioRender.com). (B) Bar charts show the relative abundance of matrix and non-matrix proteins identified by MS analysis in the cellular and ECM fractions of kidney organoids at days 14, 18, and 25 (n = 3 pools per time point). Pooled data are presented as median, and error bars indicate the 95% confidence interval for the median. (C) Venn diagrams showi the identification overlap for matrix proteins detected in kidney organoids at days 14, 18, and 25. (D) Matrix proteins are classified as basement membrane, other structural and ECM-associated proteins. Bar charts show the number of matrix proteins per matrix category in both cellular and ECM fractions, and line charts show the changes in their relative abundance (percentage of total matrix abundance) over the time course differentiation. Pooled data are presented as median, and error bars indicate the 95% confidence interval for the median. (E) Protein interaction network showing all basement membrane proteins identified over the kidney organoid time course MS study (nodes represent proteins and connecting lines indicate reported protein-protein interactions). (F) Heat map showing the log10-transformed abundance levels of basement membrane proteins identified in the ECM fraction along kidney organoid differentiation time course (proteins detected only at one time point are not shown). (G) Volcano plots show the log2-fold change (x-axis) versus -log10-p-value (y-axis) for proteins differentially expressed in the ECM fraction of kidney organoids from day 14 to day 18, and from day 18 to day 25 (n = 3 per time point). Key basement membrane proteins significantly upregulated (FC > 1.5, p-value<0.05, two-way ANOVA test, n = 3) are indicated. (H) Time-dependent changes in the relative abundance (percentage of total protein intensity) of key basement membrane proteins in the ECM fraction of kidney organoids during differentiation. Pooled data are presented as median. See Figure 3—figure supplement 1.


