Abstract
PARPi efficacy in BRCA1-deficient cells depends on 53BP1 and shieldin, which have been proposed to limit single-stranded DNA at DSBs by blocking resection and/or through CST/Polα/primase-mediated fill-in. We show that—like 53BP1/shieldin and CST/Polα—primase promotes radial chromosome formation in PARPi-treated BRCA1-deficient cells and demonstrate shieldin/CST/Polα/primase-dependent incorporation of BrdU at DSBs. In the absence of 53BP1 or shieldin, radial formation in BRCA1-deficient cells was restored by tethering of CST near DSBs, arguing that in this context shieldin acts primarily by recruiting CST. Furthermore, a SHLD1 mutant defective in CST binding (SHLD1Δ) was non-functional in BRCA1-deficient cells and its function was restored upon reconnecting SHLD1Δ to CST. Interestingly, at dysfunctional telomeres and DNA breaks in class switch recombination where CST has been implicated, SHLD1Δ was fully functional, perhaps because these DNA ends carry CST recognition sites that afford SHLD1-independent binding of CST. The data establish that in BRCA1-deficient cells, CST/Polα/primase is the major effector of shieldin-dependent DSB processing.
Keywords: DSB repair, 5’ end resection, 53BP1, shieldin, CST, BRCA1, PARPi, Polymerase α/primase, fill-in synthesis
Introduction
53BP1 and BRCA1 are multifaceted DNA damage response proteins that participate in the repair of double-strand breaks (DSBs), in part by affecting the length of 3’ single-stranded (ss) DNA overhangs1. In classical non-homologous end-joining (cNHEJ), minimally-processed ends are ligated by Ligase 4, a rapid and largely accurate process which is active throughout the cell cycle2. Homology-directed repair (HDR), in contrast, requires a 3’ ss overhang and its coating by RAD51 for strand invasion of a homologous template3,4. BRCA1-deficient cells show minimal RAD51 loading at DSBs and are sensitive to poly(ADP)-ribose polymerase 1 inhibition (PARPi)5-7. In the absence of BRCA1-mediated HDR, some PARPi-induced DSBs are mis-rejoined into characteristic “radial” chromosomes through the action of 53BP18,9.
53BP1 has been proposed to control DSB repair pathway choice and/or the fidelity of DSB repair1,10. The role of 53BP1 in limiting the formation of 3’ overhangs depends on RIF1 and the shieldin complex (REV7, SHLD1, SHLD2, and SHLD3)11-22. As with loss of 53BP1 or RIF1, disruption of shieldin components reverses the hallmarks of PARPi in BRCA1-deficient cells. Purified SHLD2/SHLD1 complexes can bind ssDNA oligos of 60-100 nt21-24, an activity which has been proposed to underlie the ability of the 53BP1 pathway to limit the formation of ssDNA overhangs by blocking nucleases that attack the 5’ end10,22. Nevertheless, direct evidence that shieldin blocks 5’ end resection is lacking.
In a second model, shieldin limits ssDNA at DSBs by recruiting CST/Polα/primase to counteract resection via fill-in synthesis. Supporting this model, shieldin directly interacts with CST (CTC1, STN1, and TEN1), a Polα-associated complex. Furthermore, depletion of CST or pharmacological inhibition of Polα reduced the formation of radial chromosomes in BRCA1-deficient cells treated with PARPi19.
We set out to distinguish between these two models in BRCA1-deficient cells. We demonstrate a role for primase in promoting PARPi-induced radial chromosomes using auxin-induced degradation of PRIM1. Consistent with fill-in synthesis, incorporation of bromodeoxyuridine (BrdU) occurred at FOKI-induced DSBs and a proximity ligation assay (PLA) for BrdU and γH2AX allowed direct visualization of shieldin- and Polα/primase-mediated fill-in synthesis at chromosome breaks in BRCA1-deficient cells. Artificially targeting the STN1 subunit of CST to DSBs induced radial chromosome formation in PARPi-treated BRCA1-deficient cells despite the absence of 53BP1 and shieldin. To further test the involvement of CST downstream of shieldin, we generated a separation of function mutation in SHLD1 that disrupts its interaction with CTC1 and its ability to recruit CST to DSBs. This SHLD1Δ mutant completely abrogated the function of shieldin in BRCA1-deficient cells and its function could be restored by SNAP-HALO tagging of SHLD1Δ and CTC1 and forcing their interaction by chemical-induced dimerization. Remarkably, SHLD1Δ appeared fully functional in processing DSBs in class switch recombination (CSR) and at dysfunctional telomeres, a result we explain based on the unique feature of these DNA ends in that they carry CST recognition sites. These results demonstrate that CST/Polα/primase fill-in synthesis is a major determinant of shieldin-dependent DSB processing in BRCA1-deficient cells.
Results
Primase affects radial formation and RAD51 loading in BRCA1-deficient cells
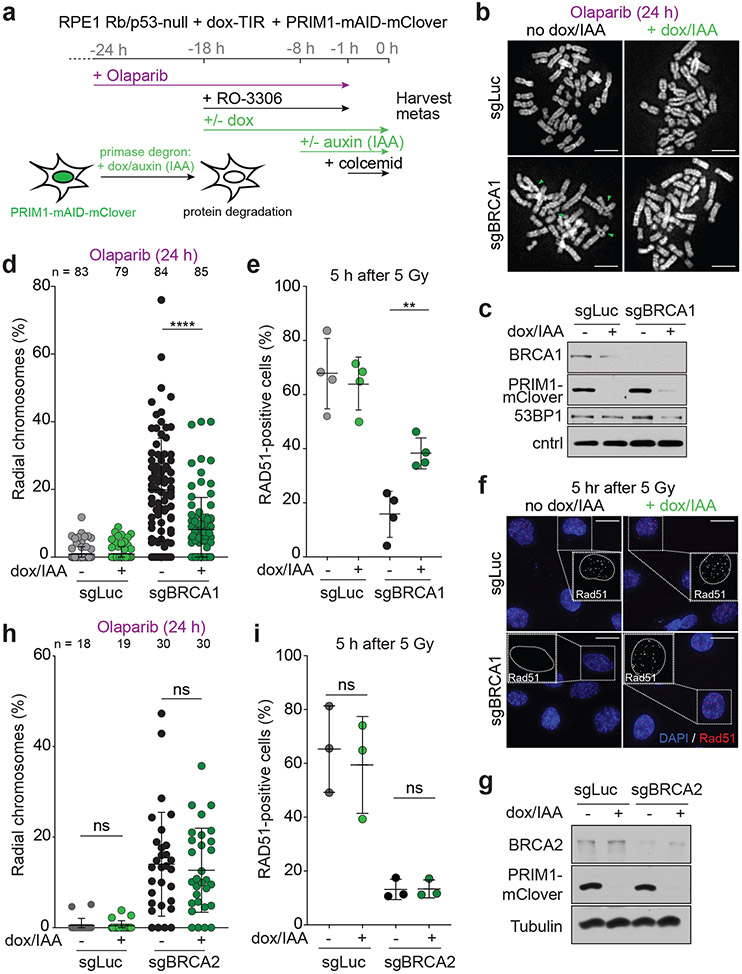
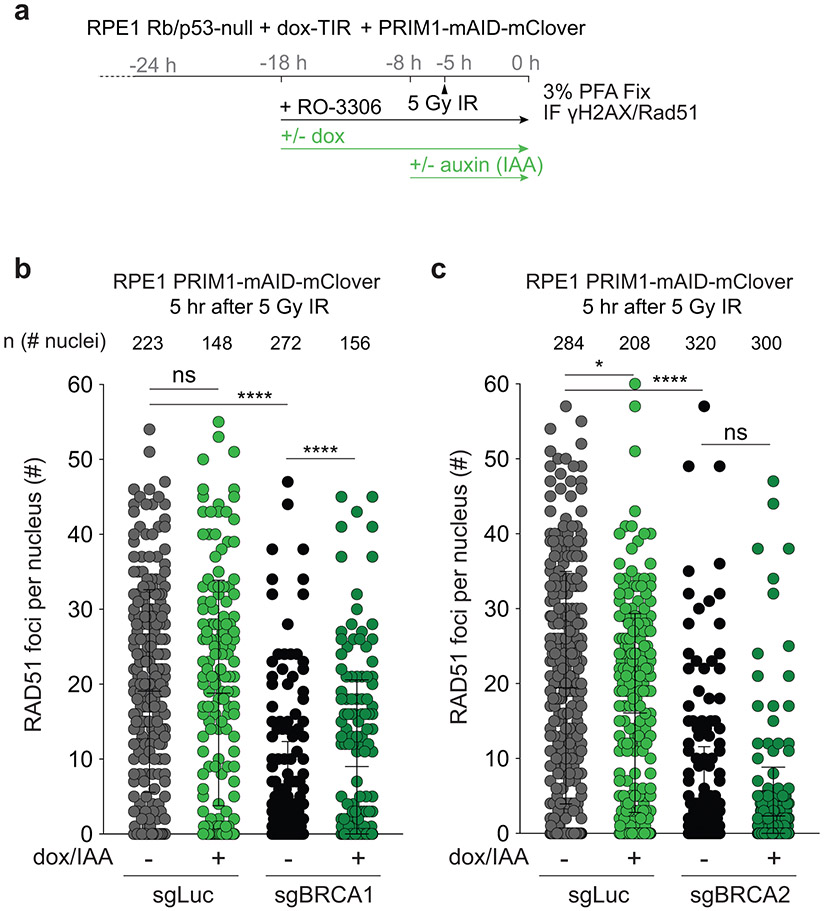
To determine whether primase, like CST and Polα, is involved in the processing of DSBs downstream of 53BP1/shieldin, we generated p53/Rb-deficient RPE1 cells in which the endogenous PRIM1 subunit of primase can be degraded rapidly using the TIR/auxin system25(Extended Data Fig. 1). After CRISPR targeting of BRCA1, PRIM1 was degraded in G2-arrested cells (Fig. 1a). BRCA1-deficient cells, but not the luciferase CRISPR-targeted control, showed characteristic PARPi-induced radial chromosomes. PRIM1 degradation significantly diminished radial formation in the BRCA1-deficient cells (Fig. 1b-d) and restored their ability to form RAD51 foci after ionizing radiation (IR) (Fig. 1e, f; Extended Data Fig. 2a, b). As a control, we monitored the effect of PRIM1 degradation in the setting of BRCA2 deficiency, where 53BP1 deletion does not reverse the effects of BRCA2 loss8. While PARPi treatment induced radial chromosomes in BRCA2-deficient cells, these were not diminished by loss of PRIM1 (Fig. 1g, h). Furthermore, PRIM1 degradation did not restore RAD51 loading in BRCA2-deficient cells (Fig. 1i; Extended Data Fig. 2c). These results establish that primase, like CST/Polα, contributes to the processing of DSBs in BRCA1-deficient cells.
Fig. 1. Primase promotes radials and blocks RAD51 loading in BRCA1-deficient cells.
a, Schematic of the timeline of auxin-induced degradation of PRIM1 in G2-arrested RPE1 cells treated with PARPi. b, Representative images of DAPI-stained metaphase spreads from RPE1 PRIM1-mAID-mClover cells with the indicated treatments. Green arrows: aberrant radial chromosomes. Scale bars: 5 μm. c, Immunoblot for BRCA1 and GFP (mClover-PRIM1) in cells as in a treated with control (sgLuc) or BRCA1 (sgBRCA1) bulk CRISPR KO. ctrl, non-specific band from GFP blot. d, Quantification of the percent of chromosomes involved in radial structures. Number of metaphases analyzed per condition (n) is indicated. e, Quantification of the percent of RAD51-positive cells (with 10 or more RAD51 foci per nucleus) 5 h after 5 Gy. n = four independent experiments. f, Representative images of IF for RAD51 in cells as in e with the indicated treatments. Scale bars: 20 μm. g, Immunoblot for BRCA2 and GFP (mClover-PRIM1) in cells as in a treated with control (sgLuc) or BRCA2 (sgBRCA2) bulk CRISPR KO. h, Quantification of the percent of chromosomes involved in radial structures (as in d). Number of metaphases analyzed per condition (n) is indicated. i, Quantification of the percent of RAD51-positive cells as in e, in the indicated cells. n = three independent experiments. Data shown in b-d, and f-i are representative of three independent experiments. All statistical analysis based on two-tailed Welch’s t-test. *, p<0.05; **, p<0.01; ***, p<0.001; ****, p<0.0001; ns, not significant. All means are indicated with center bars and SDs with error bars.
Direct evidence for shieldin/CST/Polα/primase-dependent fill-in synthesis
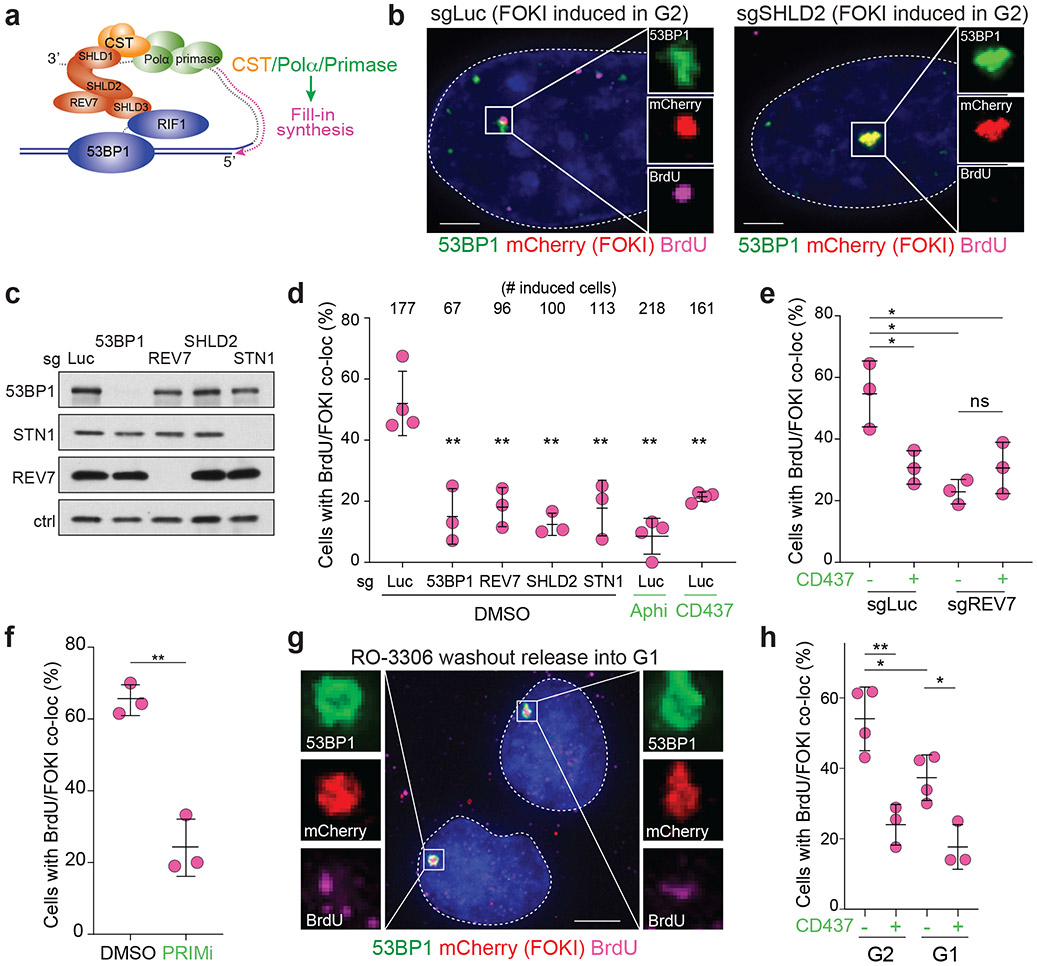
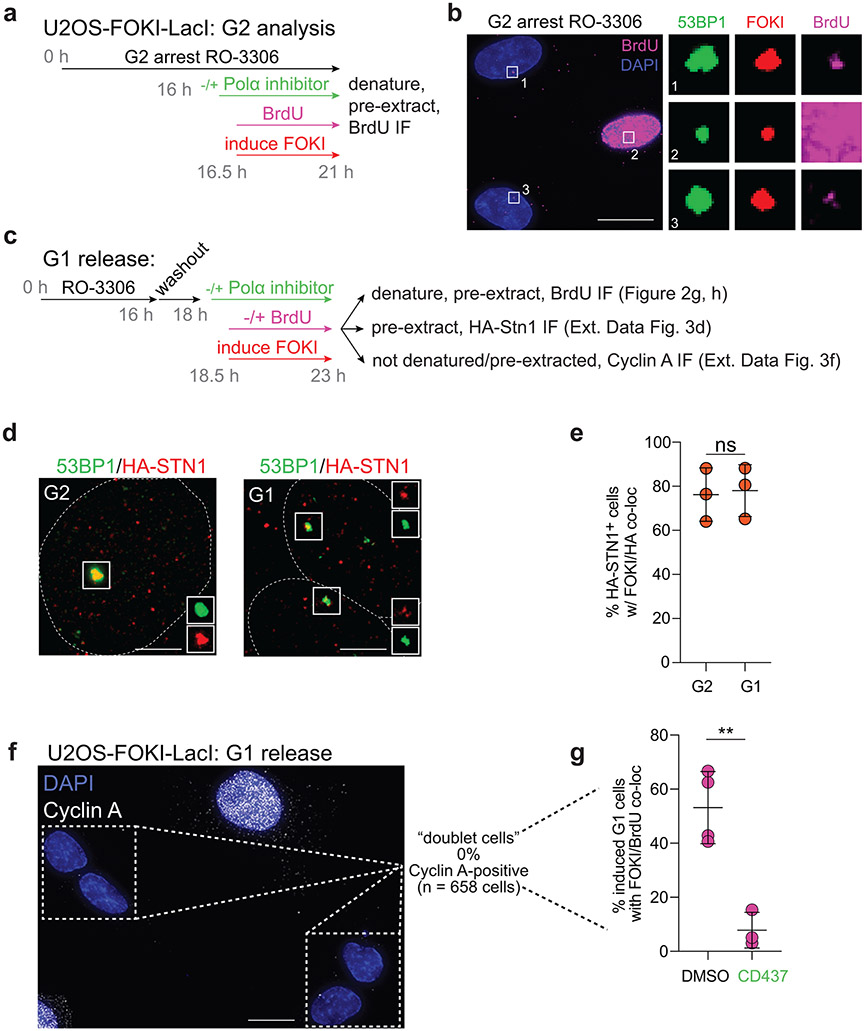
A prediction of the fill-in model is that nucleotides are incorporated at DSBs (Fig. 2a). To test this prediction, we used the inducible mCherry-FOKI-LacI nuclease targeting a LacO array in U2OS cells26. Using this system, we previously observed recruitment of CST and Polα to DSBs in G2-arrested cells19. Incubation with BrdU during DSB induction in G2-arrested cells (Extended Data Fig. 3a) followed by denaturation and IF for BrdU revealed incorporation of nucleotides at DSBs marked by mCherry-FOKI and 53BP1 (Fig. 2b). S phase cells were easily distinguished by their global BrdU incorporation and excluded from this analysis (Extended Data Fig. 3b). The incorporation of BrdU at DSBs depended on the 53BP1/shieldin/CST/Polα axis (Fig. 2c, d) as revealed by CRISPR bulk targeting or inhibition of Polα by aphidicolin (a B-family polymerase inhibitor) or CD437 (a specific Polα inhibitor27). Polα inhibition did not further reduce BrdU incorporation when REV7 was targeted (Fig. 2e), consistent with BrdU incorporation reflecting 53BP1/shieldin/CST-dependent fill-in synthesis by Polα. In addition, treatment with a selective inhibitor of primase, vidarabine triphosphate28, strongly reduced BrdU incorporation at FOKI-induced DSBs (Fig. 2f).
Fig. 2. 53BP1/shieldin/CST/Polα/primase-dependent fill-in synthesis at FOKI-induced DSBs.
a, Schematic of the fill-in synthesis model. Shieldin recruits the CST complex and Polα/primase to counteract resection by copying the 3’ overhang. b, Representative IF of U2OS-FOKI-LacI cells with control (sgLuc) or SHLD2 (sgSHLD2) CRISPR knockout, in which a single DSB has been induced. Cells were arrested in G2 with RO-3306 (9 μM overnight). Scale bar, 5 μm. Representative of three independent experiments. c, Immunoblots showing bulk CRISPR-mediated disruption of the indicated 53BP1 pathway components. No validated antibody to SHLD2 is available. ctrl, non-specific band from REV7 blot. Representative of two independent experiments. d, Quantification of BrdU colocalization with FOKI-induced DSBs as in b and c, in cells treated with the indicated bulk CRISPR or Polα inhibitors, aphidicolin (Aphi) or CD437. n = three or four independent experiments as indicated. S phase cells, identified based on BrdU labeling pattern, were excluded (for sample image, see Extended Data Fig. 3b). e, Quantification of BrdU colocalization with FOKI-induced DSBs as in d to determine epistasis of REV7 knockout and Polα inhibition. f, Quantification of BrdU colocalization with FOKI-induced DSBs as in d upon inhibition of primase with vidarabine triphosphate. In e and f, n = three independent experiments. g, Representative IF of U2OS cells with FOKI-induced DSB in G2-arrested cells (9 μM RO-3306 overnight) or cells released from RO-3306 into G1 (2 h washout before induction of FOKI, see Extended Data Fig 3c). Scale bar, 5 μm. h, Quantification of BrdU colocalization with FOKI-induced DSBs as in g, with or without Polα inhibitor. n = three (CD437+) or four (CD437−) independent experiments. Statistical analyses as in Fig. 1. All means are indicated with center bars and SDs with error bars.
Although global BrdU incorporation during DNA synthesis prevents testing whether fill-in synthesis occurs at DSBs in S phase, we tested whether it can occur in G1. HA-STN1 localized to FOKI-induced DSBs in cells released from CDKi into G1 (Extended Data Fig. 3c-e). Cells released into G1—but not yet displaying the BrdU pattern of S phase cells—showed BrdU enrichment at FOKI-induced DSBs in a manner dependent on Polα (Extended Data Fig. 3c, Fig. 2g, h). The level of incorporation of BrdU at DSBs in this G1-enriched population was slightly lower than in G2-arrested cells (Fig. 2h). Analysis of Cyclin A-negative cells revealed that a majority of G1 cells display BrdU/FOKI colocalizations and this BrdU incorporation was suppressed by treatment with CD437 (Extended Data Fig. 3f, g). Given the strong suppression of fill-in in G1 by CD437, we infer that some of the residual BrdU signal in G2-arrested cells treated with CD437 (Fig. 2c) is likely due to other DNA repair pathways (e.g., HDR) that are inactive in G1.
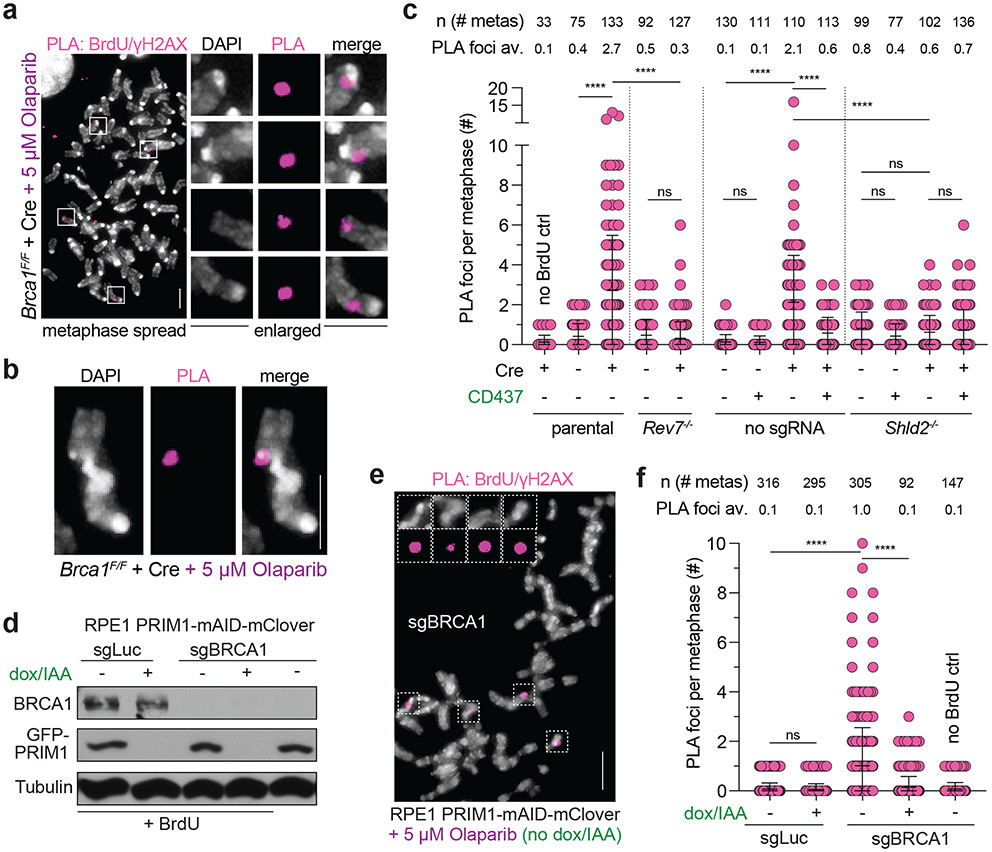
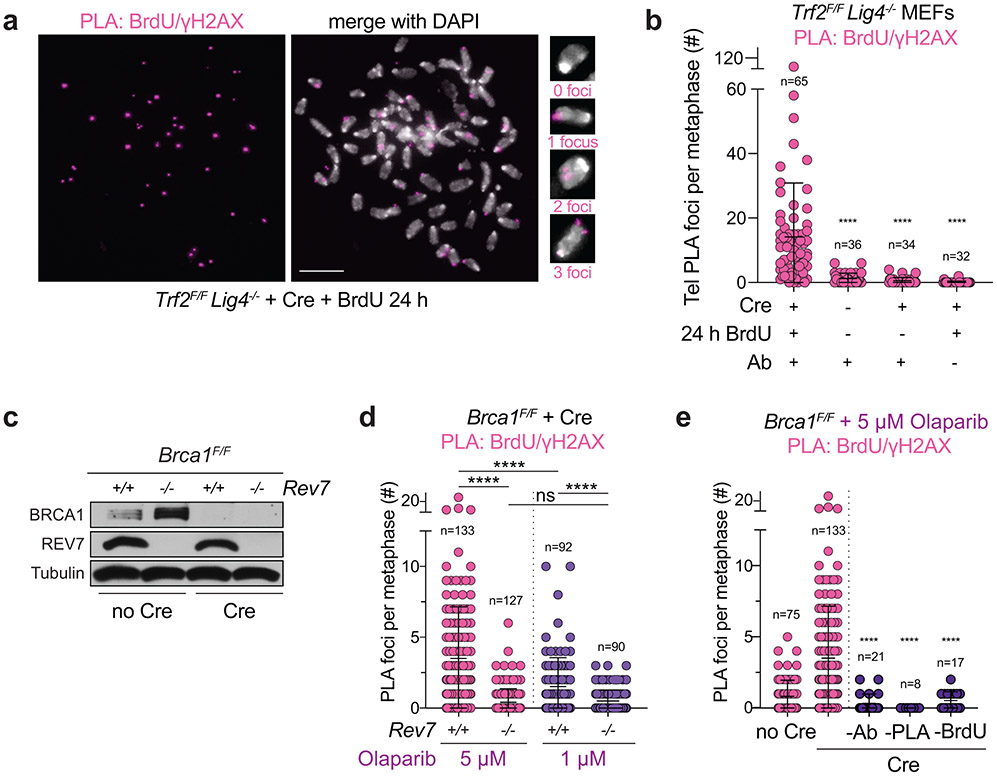
We next aimed to detect BrdU incorporation at chromosome breaks in metaphase spreads of BRCA1-deficient, PARPi-treated cells. To this end, we combined a protocol for γH2AX IF on metaphase spreads29-31 with PLA for detecting γH2AX and BrdU antibodies in close proximity (< 40 nm). To test this “metaPLA” protocol, we used the induction of γH2AX foci at dysfunctional telomeres in Trf2F/F Lig4−/− MEFs treated with Cre32. After BrdU incubation for 24 h to label all DNA, numerous BrdU-γH2AX PLA foci were observed at chromosome ends (Extended Data Fig. 4a, b), demonstrating that this assay is specific for sites of DNA damage and does not yield false positive signals in MEFs.
To monitor fill-in at DSBs in PARPi-treated BRCA1-deficient cells, metaphases were harvested after a short pulse (1 h) of BrdU, thereby avoiding confounding signals derived from S phase cells. BRCA1-deficient PARPi-treated metaphase spreads showed BrdU-γH2AX PLA foci co-localizing with DAPI-stained chromosomal material (Fig. 3a; Extended Data Fig. 4c). PLA foci were dependent on the PARPi dose, BrdU, primary antibodies, and PLA probes (Extended Data Fig. 4d, e). Many PLA foci co-localized with gaps in DAPI staining or were present at the ends of broken chromosomes (Fig. 3a, b). BrdU-γH2AX metaPLA foci did not form in cells lacking REV7 or SHLD2 or when Polα was inhibited (Fig. 3c; Extended Data Fig. 4c, d). Similarly, BrdU-γH2AX metaPLA foci at breaks and gaps were eliminated by auxin-mediated degradation of primase in human cells (Fig. 3d-f). These results indicate that shieldin and its downstream effectors CST/Polα/primase mediate the incorporation of nucleotides at FOKI- and PARPi-induced DSBs.
Fig. 3. Detection of shieldin-dependent fill-in synthesis in BRCA1-deficient cells.
a, Representative image from metaPLA of BrdU/γH2AX on metaphase spreads in Brca1F/F MEFs treated as indicated. b, Example of a dicentric chromosome from a metaphase spread showing a PLA signal at a break. c, Quantification of BrdU/γH2AX metaPLA foci at chromatin breaks as in a from cells with the indicated genotypes and treatments. Number of metaphases analyzed per condition (n) and the average number of PLA foci at breaks per metaphase are indicated. d, Immunoblots for BRCA1 and GFP (mClover-PRIM1) in the indicated cells lines. a-d are representative of three independent experiments. e, Representative image from metaPLA of BrdU/γH2AX on metaphase spreads in RPE1 PRIM1-mAID-mClover cells treated with sgBRCA1, BrdU, and Olaparib. f, Quantification of BrdU/γH2AX metaPLA foci at chromatin breaks in cells as in d with the indicated genotypes and treatments. Data and representative image from three independent experiments. Number of metaphases analyzed per condition (n) and the average number of PLA foci at breaks per metaphase are indicated. Statistical analyses as in Fig. 1, except in c, where ordinary one-way ANOVA with Tukey’s multiple comparisons test was used. p values are as in Fig. 1. All means are indicated with center bars and SDs with error bars. All scale bars, 5 μm.
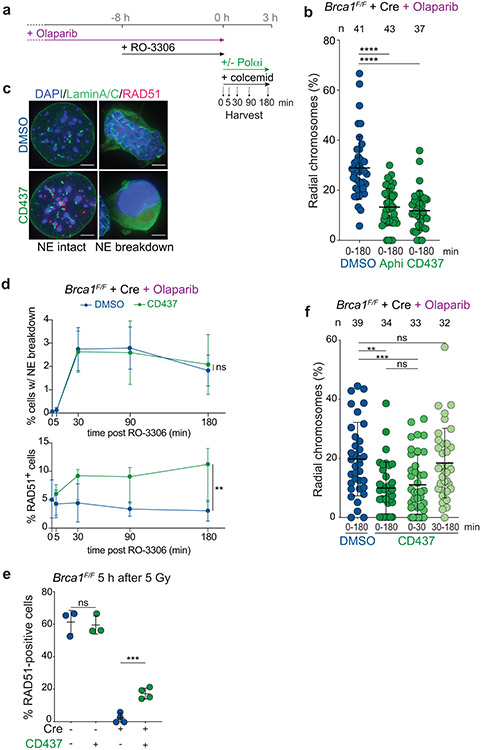
The incorporation of BrdU at chromosome breaks in the 1 h time interval before metaphase indicated that fill-in synthesis occurs in late G2 or early M. Consistent with this finding, Polα inhibition after CDKi removal significantly diminished the formation of radial chromosomes (Extended Data Fig. 5a, b). We next determined whether Polα acts before or after nuclear envelope (NE) breakdown, which reaches a plateau at 30 min after release from CDKi as did the formation of RAD51 foci in cells treated with CD437 (Extended Data Fig. 5c-e). This suggests that most cells that exit G2 arrest in this protocol do so within 30 min after release from CDKi. Polα inhibition within this short window reduced radial chromosome formation, while Polα inhibition after NE breakdown had no effect on radial chromosome formation (Extended Data Fig. 5f), indicating that the Polα-dependent DNA repair steps take place in G2 right before or during NE breakdown, but not after.
Tethering of CST to DSBs can bypass the requirement for 53BP1/shieldin in BRCA1-deficient cells
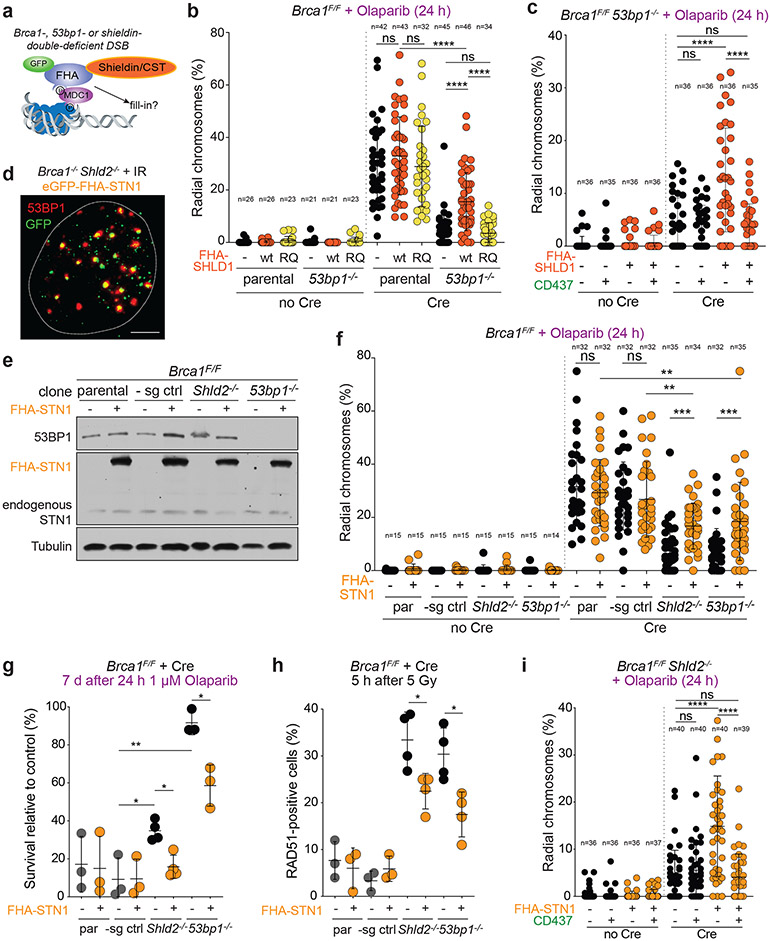
It was previously shown that targeting human SHLD2 to DSBs using the forkhead-associated (FHA) domain of RNF8 (which targets proteins to phosphorylated MDC1 at DSBs) could bypass the need for recruitment of shieldin by 53BP122. We first confirmed that tethered shieldin can function in the absence of 53BP1 in BRCA1-deficient MEFs (Fig. 4a). As expected, FHA-tethering of SHLD1 induced radial formation in BRCA1/53BP1 double-deficient cells, and this effect was abolished when the FHA domain was mutated (R61Q) to abrogate the interaction with MDC1 (Fig. 4b; Extended Data Fig. 6a). Strikingly, Polα inhibition completely reversed the radial chromosomes induced by FHA-SHLD1 (Fig. 4c; Extended Data Fig. 6b).
Fig. 4. Bypass of 53BP1/shieldin by artificial tethering of CST.
a, Schematic of 53BP1/shieldin-independent recruitment of FHA-fusions to phosphorylated MDC1 at DSBs. b, Quantification of the percent of chromosomes involved in radial structures in the indicated cell lines with wt FHA-SHLD1 or FHA-SHLD1 with an FHA domain mutation (R61Q) which prohibits recruitment to DSBs. c, Quantification as in b in Brca1F/F 53bp1−/− cells with or without FHA-SHLD1 and Polα inhibitor. d, Representative image of irradiated Brca1−/− Shld2−/− cells harboring eGFP-FHA-STN1, which colocalizes with 53BP1 IR-induced foci. The nucleus is demarcated by the dashed white line. Representative of three independent experiments. Scale bar, 5 μm. e, Immunoblots for BRCA1, 53BP1, and (FHA-)STN1 in the indicated MEFs. Representative of two independent experiments. f, Quantification as in b in the indicated cell lines with or without FHA-STN1. g, Quantification of colony formation by MEFs of the indicated genotype with or without FHA-STN1 and treated with 1 μM Olaparib for 24 h. Survival after PARPi was compared to undrugged cells. Each dot represents one of three or four independent experiments. h, Quantification of the percent of RAD51-positive cells in irradiated MEFs of the indicated genotype with or without FHA-STN1. Each dot represents one of three or four independent experiments. i, Quantification of radial chromosome formation as in c in Brca1F/F Shld2−/− cells with or without FHA-STN1 and Polα inhibitor. In b ,c, f, and i, the number of metaphases (n, each represented by a dot) pooled from three independent experiments is indicated in the figure. Statistical analyses as in Fig. 1. All means are indicated with center bars and SDs with error bars.
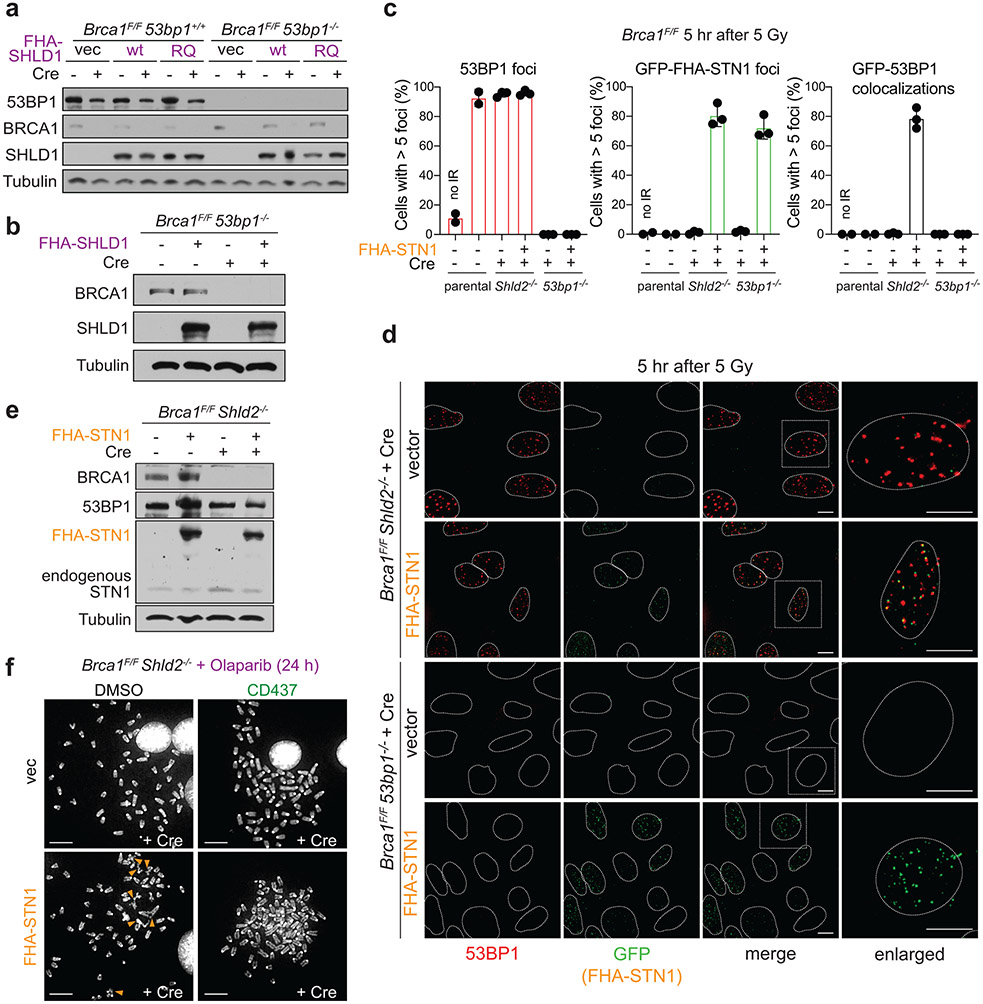
Next, we tested whether CST could promote radial formation in BRCA1-deficient cells independently of 53BP1/shieldin. Expression of FHA-STN1, which localized to DSBs (Fig. 4d, Extended Data Fig. 6c, d), restored radial formation in PARPi-treated Brca1−/− 53bp1−/− and Brca1−/− Shld2−/− clones, indicating the CST can function independently of 53BP1 and shieldin (Fig. 4e, f; Extended Data Fig. 6e). FHA-STN1 also increased sensitivity of these cells to PARPi and reduced RAD51 loading (Fig. 4g, h). Shieldin-independent radial formation by FHA-STN1 was fully dependent on Polα activity (Fig. 4i; Extended Data Fig. 6f). The frequency of radials induced by both FHA-STN1 and FHA-SHLD1 in these experiments was slightly lower than what is observed when the endogenous 53BP1, shieldin, and CST were present (Fig. 4b, f). This may indicate that the FHA fusion proteins are somewhat impaired in their function and/or recruitment. Collectively, the FHA-tethering experiments show that CST/Polα/primase can promote DSB processing in the absence of 53BP1 and shieldin.
SHLD1 function in BRCA1-deficient cells requires its interaction with CTC1
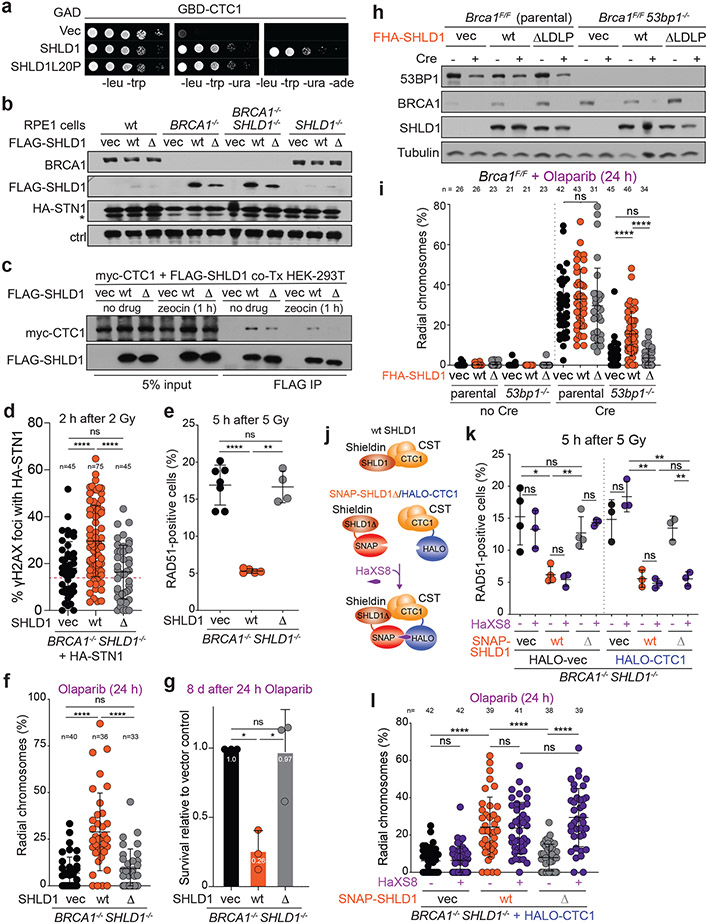
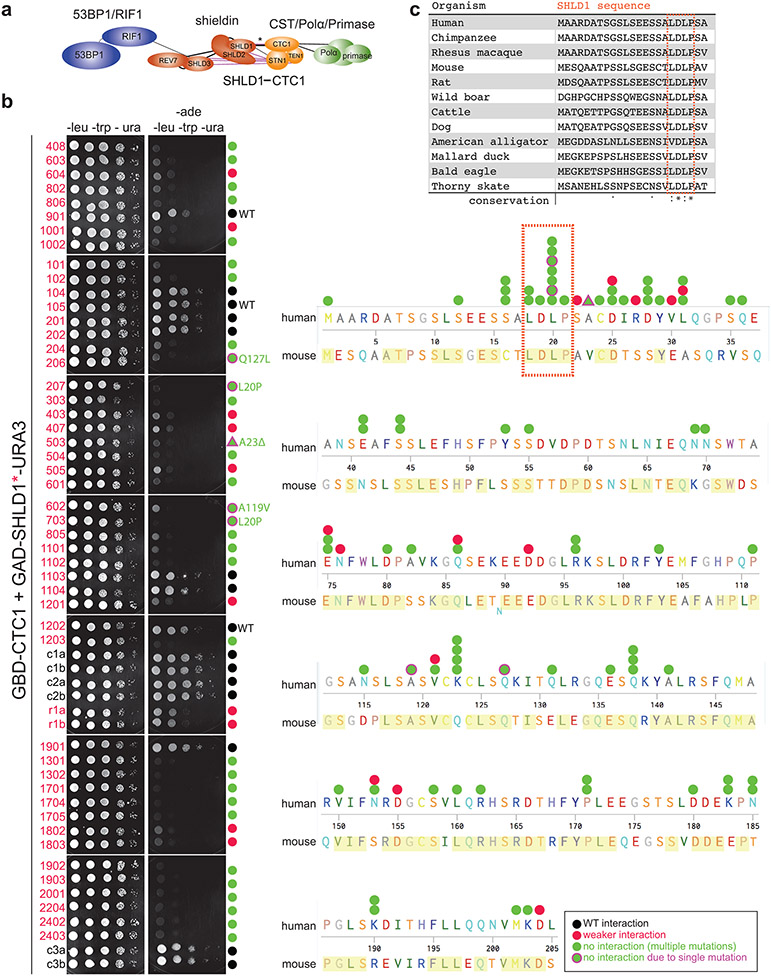
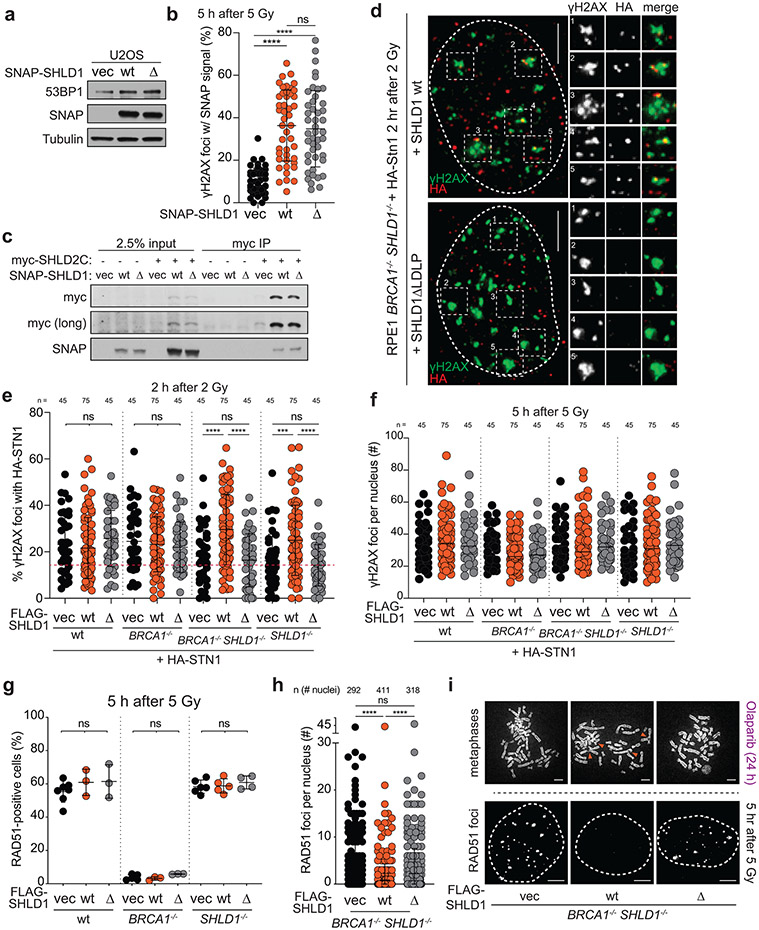
To determine the importance of the shieldin-CST interaction in BRCA1-deficient cells, we used a yeast two-hybrid random mutagenesis screen to identify a SHLD1 mutant (SHLD1ΔLDLP or SHLD1Δ) with impaired CTC1 interaction (Extended Data Fig. 7, Fig. 5a). SHLD1Δ was expressed at the same level as wild-type (wt) SHLD1, was recruited to IR-induced DSBs equally, and retained its interaction with the C-terminus of SHLD222 yet showed a diminished interaction with CTC1 by co-immunoprecipitation (Fig. 5b, c; Extended Data Fig. 8a-c). Importantly, SHLD1Δ was defective in the recruitment of CST to IR-induced DSBs (Fig. 5d, Extended Data Fig. 8d-f).
Fig. 5. Shieldin function in BRCA1-deficient cells depends on the SHLD1-CTC1 interaction.
a, Yeast-two hybrid assay demonstrating lack of interaction between human SHLD1L20P and CTC1 proteins. Colony growth on permissive (-leucine, -tryptophan, -uracil), but not selective (-leucine, -tryptophan, -uracil, -adenine) media indicates lack of interaction. b, Immunoblots in the indicated cells. SHLD1Δ (Δ) has a deletion of aa 18-21. ctrl, non-specific band from STN1 blot. a and b are representative of two independent experiments. c, Immunoprecipitation of FLAG-SHLD1 and immunoblot for myc-CTC1 co-expressed in 293T cells. Representative of four independent experiments. d, Quantification of IR-induced γH2AX foci with HA-STN1 signal in BRCA1/SHLD1 DKO cells as in b. Number of nuclei (n, each represented by a dot) pooled from three independent experiments is indicated. Red dotted line: the average background level due to randomly overlapping γH2AX and HA foci (see Materials and Methods). e, Quantification of the percent of RAD51-positive cells in irradiated BRCA1/SHLD1 DKO RPE1 cells complemented with the indicated FLAG-SHLD1 construct or an empty vector (vec). Each dot represents an independent experiment (n = four-seven experiments involving >60 cells each). f, Quantification of the percent of chromosomes in radial structures in cells as in e. Number of metaphase spreads (n, each represented by a dot) pooled from three independent experiments is indicated. g, Quantification of colony formation by BRCA1/SHLD1 DKO cells as in e treated with 5 μM Olaparib for 24 h. Survival after PARPi was compared to undrugged cells and normalized to empty vector. n = three independent experiments. h, Immunoblot for BRCA1, 53BP1, and SHLD1 detecting FHA-tagged SHLD1 in the indicated cells. Representative of three independent experiments. i, Quantification of the percent of chromosomes in radial structures in the indicated MEFs expressing FHA-SHLD1Δ (Δ). Empty vector (vec) and FHA-SHLD1 (wt) conditions from Fig. 4b are provided again here. Number of metaphase spreads (n, each represented by a dot) pooled from three independent experiments is indicated. j, Schematic of HaXS8-induced dimerization of SNAP-SHLD1Δ with HALO-CTC1. k, Quantification of RAD51-positive cells in irradiated BRCA1/SHLD1 DKO cells, complemented with the indicated SNAP-SHLD1 or empty vector, and HALO-CTC1 or empty vector, then treated with HaXS8 or vehicle prior to irradiation. n = three or four independent experiments as indicated. l, Quantification of the percent of chromosomes in radial structures in BRCA1/SHLD1 DKO cells with the indicated treatments. Number of metaphase spreads (n, each represented by a dot) pooled from three independent experiments is indicated. Statistical analyses as in Fig. 1. All means are indicated with center bars and SDs with error bars.
To test the role of the SHLD1-CTC1 interaction in BRCA1-deficient cells, SHLD1Δ was introduced into BRCA1/SHLD1 DKO RPE1 cells. Whereas wt SHLD1 prevented RAD51 loading, SHLD1Δ failed to repress RAD51 foci (Fig. 5e; Extended Data Fig. 8g-i). Concordantly, wt SHLD1 induced radial chromosome formation and PARPi sensitivity, but SHLD1Δ did not (Fig. 5f, g; Extended Data Fig. 8i). Furthermore, whereas FHA-tagged SHLD1 induced radial chromosomes in Brca1−/− 53bp1−/− cells treated with PARPi (Fig. 4b, c), FHA-tagged SHLD1Δ was completely deficient in promoting radials in this setting (Fig. 5h, i).
To verify that the defect of SHLD1Δ in BRCA1-deficient cells is solely in the recruitment of CTC1, the interaction between CTC1 and SHLD1Δ was restored through a SNAP-HALO chemical-induced dimerization (CID) system33 (Fig. 5j). Addition of the chemical dimerizer (HaXS8) fully restored the ability of SHLD1Δ to suppress RAD51 loading in BRCA1/SHLD1 DKO cells and rescued PARPi-induced radial chromosome formation (Fig. 5j-l). This result indicates that at DSBs in BRCA1-deficient cells, the primary function of SHLD1 is recruitment of CTC1. The sufficiency of CST recruitment for radial formation (Fig. 4) combined with these SHLD1 separation of function studies supports a central role for CST/Polα/primase downstream of 53BP1/shieldin in BRCA1-deficient cells.
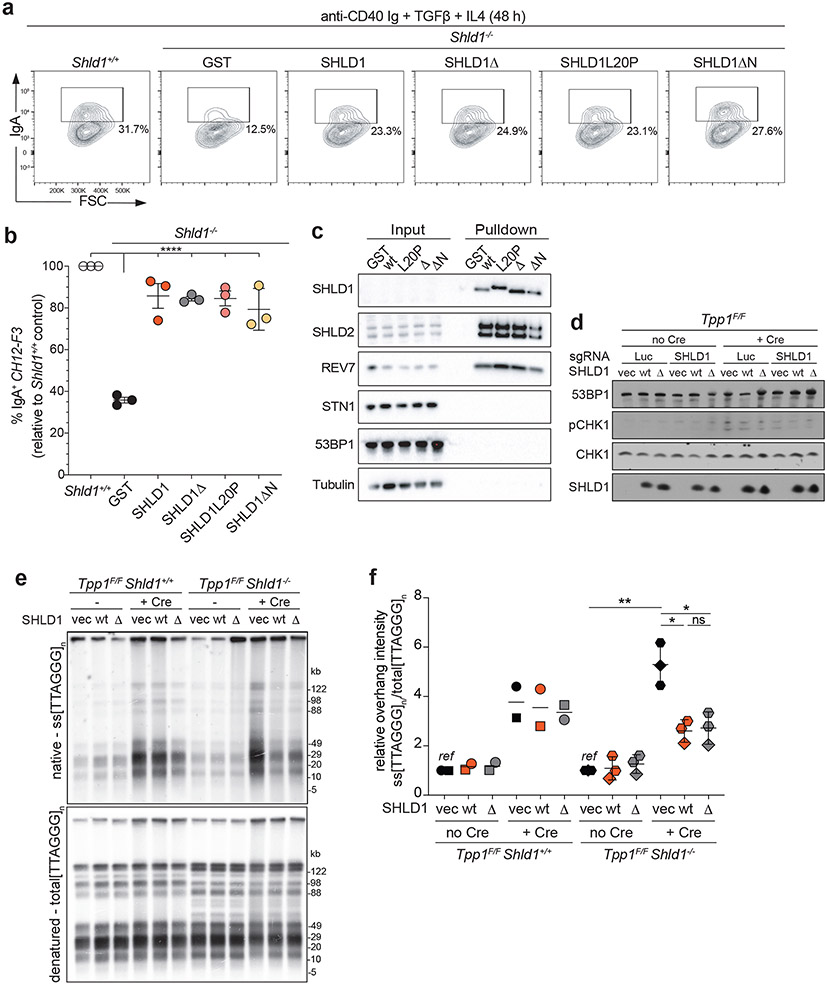
53BP1/shieldin also promotes CSR18,20,34,35. We therefore introduced SHLD1Δ into SHLD1-deficient CH12F3 cells, a murine B cell lymphoma line that upon stimulation undergoes highly efficient IgM to IgA class switching. Unexpectedly, expression of SHLD1Δ—or a large N-terminal truncation of SHLD1 that includes the LDLP motif deleted in SHLD1Δ—restored CSR to the same extent as wt SHLD1 (Fig. 6a, b). In this context, no interaction was detected between immunoprecipitated wt SHLD1 or SHLD1Δ and CST (as judged by STN1 immunoblot as no validated antibody to mouse CTC1 is available) (Fig. 6c). Therefore, we have no information on whether the mutants abrogate the interaction of SHLD1 with CTC1 in these cells.
Fig. 6. SHLD1Δ supports class switch recombination and suppresses long telomeric overhang formation.
a, Representative flow cytometry plots of IgM to IgA CSR in indicated parental Shld1+/+, Shld1−/− and transgene-complemented CH12-F3 cell line derivatives. Representative of three independent experiments. b, Quantification of CSR in cells as in a. CSR efficiency is normalized to wild-type cells. Statistical analysis (n = 3 independent experiments) performed using ordinary one-way ANOVA with Dunnett’s correction for multiple comparisons. All comparisons are made to Shld1−/− cells complemented with wt SHLD1. c, TwinStrep-HA-SHLD1 wt, L20P, ΔLDLP, or ΔN immunocomplexes were isolated from whole cell extracts prepared from untreated CH12-F3 cultures. Western blots were probed for the indicated targets. Data represent three independent experiments. d, Immunoblot showing CHK1 activation after Tpp1 deletion and SHLD1 construct expression in the indicated cells. Representative of two independent experiments. e, Quantitative analysis of telomeric ss overhang intensity in cells as in d using in-gel hybridization to detect the 3’ overhang followed by rehybridization to the denatured DNA in the same gel, allowing the ratio of ss to total TTAGGG signal to be determined. Representative of three independent experiments. f, Quantification of overhang intensity from cells as in e in n = two (Shld1+/+) or three (Shld1−/−) independent experiments using two independent clones for each genotype (represented by circle and square, diamond and hexagon symbols). Statistical analysis was performed using two-tailed ratio-paired t-test. *, p<0.05; **, p<0.01; ****, p<0.0001; ns, not significant. All means are indicated with center bars and SDs with error bars.
We next examined SHLD1Δ function at telomeres lacking the end-protection afforded by shelterin36, where 53BP1/shieldin/CST have been shown to counteract 5’ end resection19. As determined by a quantitative assay for changes in the relative amount of ss telomeric DNA, deletion of the shelterin subunit TPP1 from Tpp1F/F Shld1−/− MEFs induced a greater 3’ overhang signal compared to deletion of TPP1 from SHLD1-proficient cells (Fig. 6d-f). As was the case for CSR, SHLD1Δ appeared to behave like wt SHLD1, suppressing the increase of the 3’ overhang signal to the same extent (Fig. 6e, f). SHLD1Δ was expressed at the same level as wt SHLD1 and did not affect the expression of other proteins relevant to 53BP1 function (Fig. 6d; Extended Data Fig. 9a). We tested whether the SHLD1 LDLP motif has a function that is particular to the BRCA1-deficient context by CRISPR targeting Brca1 in Tpp1F/F Shld1−/− MEFs and complementing them with wt SHLD1 or SHLD1Δ. However, deletion of BRCA1 did not alter the ability of SHLD1Δ to behave like wt SHLD1 in TPP1-deficient MEFs (Extended Data Fig. 9b, c). As was the case for the B cells used for CSR, we were unable to verify that the shieldin-CST interaction was diminished in MEFs expressing SHLD1Δ (Extended Data Fig. 9d).
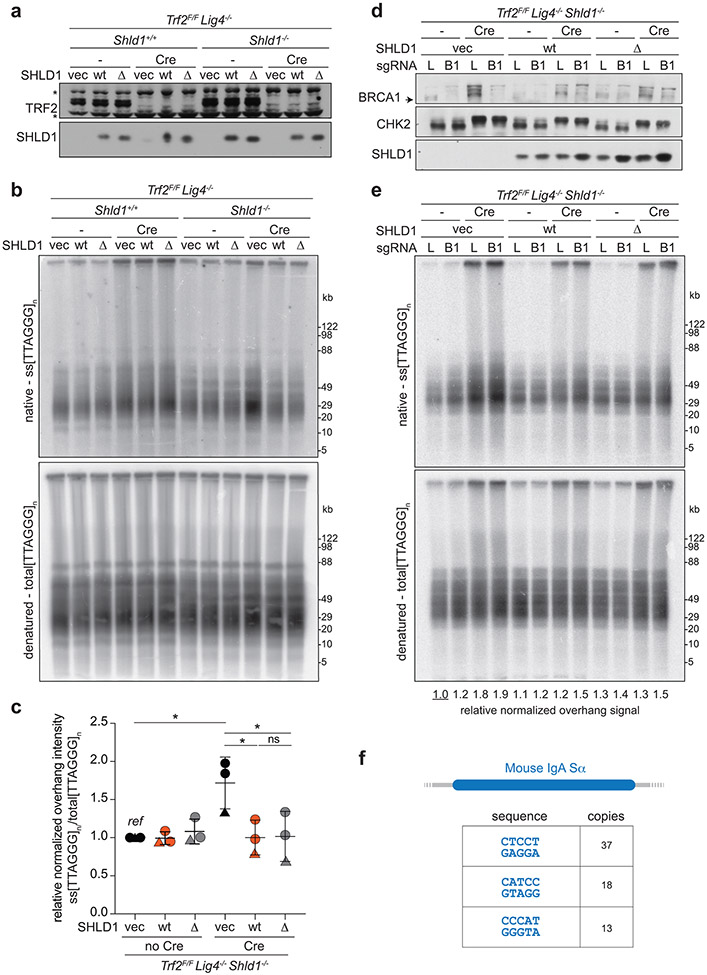
We tested the possibility that ATM signaling (as presumably elicited by DSBs in PARPi-treated BRCA1-deficient cells) affects the shieldin-CST interaction. Deletion of TPP1 results in activation of ATR signaling, whereas ATM signaling is activated at telomeres when the shelterin subunit TRF2 is deleted36. At telomeres lacking TRF2, 53BP1 and REV7 repress the formation of excessive ss 3’ telomeric DNA, although the phenotype is not as strong as when TPP1 is absent19,37. Therefore, we used Trf2F/F Shld1−/− MEFs to compare the effect of SHLD1Δ and wt SHLD1 on the formation of excessive ss telomeric DNA. The MEFs also lacked Ligase 4, thereby avoiding the confounding effect of telomere fusion after TRF2 deletion. In this context as well, SHLD1Δ repressed the 3’ telomeric overhang phenotype comparably to wt SHLD1 (Extended Data Fig. 10a-c). This finding held even when BRCA1 was co-deleted from the cells (Extended Data Fig. 10d, e). Thus, the SHLD1Δ mutant behaves differently in the context of dysfunctional telomeres and CSR than at the random DSBs in the BRCA1-deficient cells studied above. A possible reason for this distinction is discussed below.
Discussion
Determining how the RIF1/shieldin axis of 53BP1 prevents long 3’ overhangs in DSB repair has been a subject of intensive research, and recently two (non-mutually-exclusive) models arose—that 5’ end resection is blocked, or that resection is counteracted by fill-in synthesis. The data presented here provide direct evidence for the fill-in reaction in BRCA1-proficient and BRCA1-deficient cells in the form of incorporation of nucleotides at nuclease- or PARPi-induced DSBs in a 53BP1/shieldin/CST/Polα/primase-dependent manner (Figs. 2, 3). We also highlight the critical role of fill-in synthesis in BRCA1-deficient cells. In this setting, we show the involvement of primase in promoting radial chromosomes (Fig. 1); the ability of DSB-tethered CST to bypass the need for 53BP1/shieldin (Fig. 4); and, based on a SHLD1 mutant (SHLD1Δ) that lacks CST binding, the requirement of CST recruitment for the function of shieldin in suppressing RAD51 loading and promoting radial formation (Fig. 5). These hallmarks of shieldin loss in BRCA1-deficient cells were reversed when CST was force-tethered to shieldin containing SHLD1Δ by chemical-induced dimerization. Collectively, the data argue that shieldin function in BRCA1-deficient cells requires the interaction of shieldin with CST.
CST has been implicated both in CSR and at dysfunctional telomeres19,35, two systems that have been used extensively as surrogates for DSB processing. Our previous work showed that shieldin recruits CST to dysfunctional telomeres, and that shieldin and CST are epistatic in their control of excessive 3’ ss telomeric DNA19. Yet, the SHLD1Δ mutant that does not bind CTC1 was fully functional in promoting CSR and preventing excessive ss 3’ overhangs at dysfunctional telomeres. The difference in function of SHLD1Δ at random DSBs in BRCA1-deficient cells and at DNA ends in CSR and at dysfunctional telomeres was not due to the presence of BRCA1 in the cells nor was it related to the activation of ATM versus ATR signaling.
What might account for the discordant behavior of SHLD1Δ? It is possible that SHLD1Δ behaves differently in CSR and at dysfunctional telomeres versus random DSBs due to a difference in cell-cycle phase of repair events, cell type (B cells for CSR), or chromatin context. However, we favor the explanation that SHLD1Δ is less deleterious to CST recruitment at DNA ends that bear CST recognition sites. The preferred substrates of CST are tandem repeats containing runs of 3 or more G residues (e.g. TTAGGG), but it also binds ssDNA containing multiple copies of GG dinucleotides38. The DNA ends formed during CSR have many tandem G-rich repeats39 and the TTAGGG repeats of telomeres represent the optimal CST binding site. In particular, the mouse IgA switch region studied here contains more than 60 copies of tandem five nucleotide repeats containing GG or GGG (Extended Data Fig. 10f) and it is likely that these repeats can be bound by CST. The presence of these CST binding sites, together with the additional interactions between STN1 and TEN1 in CST and SHLD2, SHLD3, and REV7 in shieldin19 may make up for the lack of CTC1-SHLD1 interaction in the context of SHLD1Δ. In contrast, repeated runs of G residues will be less frequent at many of the random DNA ends created by IR or PARP inhibition, diminishing the CST-DNA interaction and making CST more reliant on its binding to SHLD1. We therefore propose that the behavior of SHLD1Δ in CSR and at dysfunctional telomeres represents an exception rather than the norm.
This idea that shieldin is important to facilitate the association of CST with DNA ends that lack preferred CST binding sites is consistent with the results of our bypass experiments in which tethering of FHA-STN1 to DSBs did not fully complement the loss of SHLD2 (Fig. 4f-h). Although this finding could be due to suboptimal function and/or recruitment of FHA fusion proteins, it is also possible that the shieldin-CST interaction improves the binding of CST to A-T rich overhangs, perhaps allowing CST to compete with RPA despite its lower affinity38. The in vitro binding affinity of SHLD2-C/SHLD1 (10 nM) is low compared to RPA22, but the binding affinity of a complex formed by shieldin and CST (while undetermined) is likely to be much higher. It will be of interest to study the biochemistry and structural biology of CST/Polα/primase in complex with shieldin bound to ssDNA with and without runs of G-residues. We have previously suggested that shieldin might function analogously to shelterin, which uses its TPP1 and POT1 subunits to recruit CST to fully protected telomeres36. A comparison of CST in complex with shieldin and with TPP1/POT1 would therefore be particularly informative. Finally, mutations in CST are responsible for the rare developmental disorder Coats plus40 and the impact of these mutations on DSB repair warrants analysis. We and others have raised the possibility that 53BP1 acts primarily to ensure the fidelity of DSB repair1,41. If so, the major outcome of inherited mutations that affect how shieldin and CST cooperate at DSB repair could be an increase in mutagenic repair and perhaps an associated increase in cancer risk.
While this manuscript was in revision, two reports were published in support of the idea that fill-in synthesis is a general phenomenon at DSBs. A broad role for Polα-mediated fill-in at genome-wide DSBs was noted at CRISPR/Cas9-induced DSBs42 and at DSBs induced by AsiSI43. These results are in keeping with our finding of CST/Polα/primase-dependent fill-in at FOKI-induced DSBs and further highlight the critical role of this mode of DSB processing.
Materials and Methods
Cell culture and expression constructs
Immortalized Brca1F/F, Tpp1F/F, and Trf2F/F Lig4−/− MEFs have been previously described 19,32,44. MEFs were cultured in Dulbecco’s Modified Eagle Medium (DMEM, Corning) supplemented with 15% fetal bovine serum (FBS) (Gibco), non-essential amino acids (Gibco), 2 mM L-glutamine (Gibco), 100 U/ml penicillin, 100 μg/ml streptomycin (Gibco), 50 μM β-mercaptoethanol (Sigma). Cre-mediated gene deletion experiments used retroviral infections with pMMP Hit&Run Cre three times32. Cells were harvested 96 hr after the second Cre infection unless otherwise indicated.
U2OS cells containing a LacO array and a tamoxifen- and Shield1-ligand-regulated mCherry-FOKI-LacI fusion were used as described26 and cultured as above. Cells were harvested 4.5 h after induction of FOKI by addition of 0.1 μM Shield1 and 10 μg/ml 4-OHT. BrdU was added during FOKI induction, and S-phase cells displaying global BrdU incorporation were excluded from BrdU/FOKI colocalization analysis. When Polα inhibitors were used in the U2OS-FOKI cell line, they were added for 30 m before induction of FOKI and remained in the media for the duration of DSB induction.
RPE1 cells were cultured in DMEM/F-12 media (Gibco) supplemented with 10% FBS and penicillin/streptomycin as above. B cell culture conditions for class switch recombination experiments are described below. 293FT and Phoenix cells were cultured in DMEM supplemented with 10% bovine calf serum (BCS), non-essential amino acids, L-glutamine, and penicillin/streptomycin as above.
Retroviral gene delivery was performed as described45. pWZL-GFP-FHA-mSTN1 and pWZL-GFP-mFHA-mSHLD1 were cloned using pENTR-eGFP-FHA-SHLD2C22 and pWZL-mSTN1 or pLPC-mSHLD119. For the purpose of complementation experiments, human SHLD1 plasmids were made sgRNA-resistant by site-directed mutagenesis of the target site TCAGCGTGTGACATAAGAGA changed to TCgGCcTGTGACATAAGAGA. Untagged mouse SHLD1 or SHLD1ΔLDLP was expressed from pWZL plasmids. Wild-type mSHLD1 was made sgRNA-resistant by site-directed mutagenesis of the site TTGGATCTACCCGCGGTGTG changed to TTGGATCTACCCGCTGTGTG. Site-directed mutagenesis was also used to delete amino acids 18-21 (ΔLDLP) or mutate the FHA domain (R61Q). Human STN1 tagged at the N-terminus with a 6xHA tag was delivered using the pLPC vector19.
For coimmunoprecipitations, pCDNA5-FLAG-SHLD119 was modified by site-directed mutagenesis to delete amino acids 18-21 (ΔLDLP), and pLPC-myc-SHLD2C was generated by site directed mutagenesis based on22. pLPC-myc-CTC1 has been previously described19. These plasmids were used to clone pQCNeo-SNAP-SHLD1, and pLPC-Puro-HALO-CTC1, respectively, using Gibson assembly.
Drug treatments were as follows. Olaparib (Selleck Chemicals): 1 μM unless otherwise noted; RO-3306 (Sigma): 9 μM; CD437 (Sigma): 10 μM; Aphidicolin (Sigma): 2 μM. Doxycycline (dox, Sigma): 2 μg/ml. IAA (auxin, 3-indole-acetic acid sodium salt dissolved in H2O, Abcam): 500 μM. Vidarabine triphosphate (Jena Biosciences): 10 μM. BrdU: 10 μM; Zeocin (Invitrogen): 100μg/ml. For chemical-induced dimerization, cells were treated with 0.5 μM HaXS8 (Tocris) 5 min before irradiation and harvested 5 h later to examine RAD51 loading; or 2 hr before colcemid for harvesting metaphases.
CRISPR-Cas9 gene disruption
Brca1F/F 53bp1−/− and Brca1F/F Rev7−/− MEFs were previously described19. Brca1F/F Shld2−/− MEFs were generated by CRISPR/Cas9 targeting exon 4 using the guide 5’-ATCAGTCAGATCCCTGCGTTCGG-(PAM)-3’. Tpp1F/F and Trf2F/F Lig4−/− MEFs were targeted for SHLD1 knockout using the guide 5’-CTGTACCTTGGATCTACCCG-(PAM)-3’. Human SHLD1 knockout RPE1 cells were generated by targeting exon 2 of SHLD1 using the guide 5’-TCTCTTATGTCACACGCTGA-(PAM)-3’ in BRCA1 KO p53−/− hTERT Cas9 RPE1 cells or an isogenic BRCA1-proficient control22. For all CRISPR-generated clones, bi-allelic gene disruption was verified by Sanger sequencing of Topo-cloned PCR products of the relevant locus (sequences available on request). Human 53BP1, REV7, SHLD2, and STN1 were targeted for bulk CRISPR KOs using the following sgRNAs in the lentiCRISPR v2 plasmid with selection in blasticidin: 53BP1-sgRNA1 (5’-CAGAATCATCCTCTAGAACC-(PAM)-3’), 53BP1-sgRNA2 (5’-TTGATCTCACTTGTGATTCG-(PAM)-3’), SHLD2-sgRNA1 (5’-TCTGGAGAACCAATAGATTC-(PAM)-3’), SHLD2-sgRNA2 (5’-TTTGAGCTAAAAAAGCAACC-(PAM)-3’), REV7-sgRNA1 (5’-CCTCAACTTTGGCCAAGGTA-(PAM)-3’), REV7-sgRNA2 (5’-TATACTGATTCAGCTCCGGG-(PAM)-3’). STN1-sgRNA1 (5’-GGCGGGACTCCTTCATGTCC(PAM)-3'). STN1-sgRNA2 (5’-GAGACCCCTTCCCTCTTGTG(PAM)-3'). Human BRCA1 and BRCA2 were targeted for bulk CRISPR KOs using the following sgRNAs in the lentiCRISPR v2 Puro plasmid (see experimental timeline). BRCA1-sgRNA (5’-GGCTCAGGGTTACCGAAGAG-(PAM)-3’). BRCA2-sgRNA1 (5’-GCAGGTTCAGAATTATAGGG-(PAM)-3’), BRCA2-sgRNA2 (5’-GTCTACCTGACCAATCGATG-(PAM)-3’) with two days selection in puromycin. For each gene, the two sgRNAs were either used individually or together. Mouse BRCA1 exon 10 was targeted for bulk CRISPR KO using the guide (5’-GTATGCCAGAGAAAGCGGAG-(PAM)-3’).
For the generation of RPE1 PRIM1-mAID-mClover cells, p53- and RB-deficient RPE1-hTERT cells46 were nucleofected with a donor template plasmid and two CRISPR/Cas9 plasmids targeting the last coding exon of PRIM125. Following selection in G418, mClover-positive cells were subcloned after flow-sorting for Clover and biallelically targeted clones were identified by PCR. HA-tagged OsTIR1 under the control of a dox-responsive promoter was introduced into PRIM1-AID-mClover clone #10 using lentiviral integration followed by selection in blasticidin and single cell cloning. Eleven clones were picked and treated with 2 ug/ml dox for 24 h and harvested for detection of HA-OsTIR1. Two clones expressing TIR1 at high levels were grown in the presence or absence of IAA and dox for 24 h and harvested for immunoblot. Efficient degradation of PRIM1-AID-mClover was seen in both clones. PRIM1 was completely degraded after 4 h treatment with 0.5 mM of IAA in both clones. Clone #9 was selected for future experiments. Gene targeting reagents were designed using Benchling.
Immunoblotting
Immunoblotting was performed as described19 with the following antibodies: 53BP1 (175933, Abcam; 1:1000; 100-304, Novus Biological; 1:1000); BRCA1 (MAB22101, R+D systems; 1:500); BRCA2 (OP95, Millipore; 1:500); CHK1 (8408, Santa Cruz; 1:1000); pCHK1 (2341, Cell Signaling Technology; 1:1000); CHK2 (611570, BD; 1:1000); Flag-tag (M2, Sigma; 1:1000); γ-Tubulin (GTU488, Sigma; 1:20,000); GFP (11814460001, Sigma; 1:1000); HA (3724, Cell Signaling Technology; 1:20,000); HSP70 (610608, BD; 1:1000); MAD2L2/REV7 (180579, Abcam; 612266, BD; 1:1000); Myc-tag (9B11, Cell Signaling Technology; 1:1000); OBFC1/STN1 (89250, Abcam; 1:1000; SC-376450, Santa Cruz; 1:1000); PRIM1 (10773-1-AP, Proteintech; 1:1000); RIF1 (#1240, de Lange Lab; 1:1000); SHLD1 (PA5-59280, Thermo-Fisher; 1:1000); SNAP tag (9310, NEB; 1:1000); TRF2 (#1254, de Lange Lab; 1:5,000). Affinity-purified peptide antibodies against mouse SHLD1 and SHLD2 proteins (Chapman Lab, unpublished; 1:1000) were generated by Eurogentec.
Immunoprecipitation
Immunoprecipitation was carried out as described19. Co-transfection in 293FT cells was performed using calcium phosphate co-precipitation. Lysates were prepared in lysis buffer containing 50 mM Tris-HCl (pH 7.4), 300 mM NaCl, 10% glycerol, 0.1% NP-40, 1 mM PMSF, complete protease inhibitor without EDTA (Roche), and PhosSTOP phosphatase inhibitor mix (Roche). Samples were treated with 50 U Benzonase (Sigma) for 30 min at room temperature.
Immunofluorescence
Previously published procedures were followed for IF45. IF for BrdU (152095, Abcam; 1:500) with 53BP1 (612522, BD Biosciences; 1:1000) or γH2AX (05636, Millipore; 1:1000), HA-tagged STN1 (3724, Cell Signaling Technology; 1:5,000), or SNAP-tagged SHLD1 (9310, NEB; 1:1000) was carried out using the cytoskeleton extraction protocol47. Cyclin A (611269, BD; 1:1000); or Lamin A/C (4200236, Sigma; 1:1000) or γH2AX (05636, Millipore; 1:1000) with RAD51 (70-001, Bioacademia; 1:1000) were detected in cells fixed in 3% PFA. Anti-mouse highly cross-absorbed Alexa fluor plus 488 (1:500) and anti-rabbit highly cross-absorbed Alexa fluor plus 647 (1:500) secondary antibodies were used (Thermo Fisher). Imaging was performed on a DeltaVision (Applied Precision) equipped with a cooled charge-coupled device camera (DV Elite CMOS Camera), a PlanApo 60x 1.42 NA objective (Olympus America, Inc.), and SoftWoRx software. For HA-STN1/γH2AX colocalization, a random overlap background level was determined by splitting the two image channels, rotating one channel 90 degrees, and merging the channels. Colocalizations were then scored to determine the average overlap of foci by random chance due to telomeric (non-DSB) HA-STN1 foci or other spurious foci. For RAD51 foci studies, cells were considered RAD51 positive when the cell exhibited ten or more RAD51 foci colocalizing with 53BP1 or γH2AX foci. Image analysis was conducted using FIJI.
Metaphase chromosome analysis and PLA
Analysis of misrejoined chromosomes was carried out as described on DAPI-stained metaphase spreads after telomeric FISH19. The metaPLA protocol was developed based on a protocol for immunofluorescence on metaphase spreads29-31. Cells were treated with BrdU for a total of 1 h (except where otherwise noted), during which colcemid was added for the final 45 minutes. For Polα inhibition, CD437 (10 μM) was added directly to the media for 30 min before addition of BrdU and kept in the media during colcemid treatment. For metaPLA in RPE1 PRIM1-mAID cells, the experimental protocol in Figure 1a was followed, with addition of BrdU 15 min before washout. The PBS and FBS-containing media used for washout contained BrdU, dox, or IAA as appropriate, and cells were released into media containing colcemid, BrdU, dox, or IAA as appropriate for 50 min. Media was then replaced with warm hypotonic buffer (10 mM Tris-HCl, 40 mM glycerol, 20 mM NaCl, 1 mM CaCl2, 0.5 mM MgCl2) for 15 minutes at 37°. Cells were then harvested by mitotic shakeoff and cytospinning (Shandon Cytospin3) for 10 min at 470 x g. Slides were immediately fixed in 2% PFA in PBS. For metaPLA, cytospin spreads on glass slides were permeabilized in cold Triton X-100 buffer with 0.5% Triton47 for 5 min, rinsed with H2O, denatured in 1 N HCl for 10 min, and rinsed again before proceeding with PLA. Mouse γH2AX (05636, Millipore; 1:1000) and rabbit BrdU (152095, Abcam; 1:1000) antibodies were used with − and + probes and Duolink Orange kit (Sigma). PLA foci were only scored at breaks, gaps, or other aberrant chromosome structures. In Trf2F/F Lig4−/− MEFs, only PLA foci at chromosome termini were scored. The number of PLA foci observed in Trf2F/F Lig4−/− cells is consistent with not every dysfunctional telomere exhibiting a γH2AX focus in metaphase48, and/or may reflect inefficiency in proximity labeling.
Yeast two-hybrid and SHLD1 mutagenesis screen
GBD-hCTC1 has been previously described19 and was transformed into budding yeast strain PJ69-4A (MATa trp1-901 leu2-3,112 ura3-52 his3-200 gal4 gal80 LYS2::GAL1-HIS3 GAL2-ADE2 met2::GAL7-lacZ) and selected on synthetic complete drop-out media lacking tryptophan. To recover only full length SHLD1 variants in the screen, GAD-hSHLD119 was modified to contain a C-terminal ScUra3 gene. SHLD1 was then amplified by error-prone PCR (Taq, NEB) using the following conditions: 2.5 mM each dNTP; 7 mM MgCl2; 0.1 mM MnCl2 in 10x Buffer with MgCl2. GAD-SHLD1WT-Ura3 was digested with Nde1/Age1 to remove the SHLD1 ORF, and the linearized vector was co-transformed with the SHLD1 variant library at a molar ratio of 1 vector: 3 insert into yeast harboring GBD-hCTC1 and plated on synthetic complete drop-out media lacking tryptophan, leucine, and uracil (SC-LTU). Colonies were then replica plated onto drop-out media also lacking adenine (SC-LTUA). Colonies that failed to grow on selective (SC-LTUA) media were picked from permissive media and spot dilutions were plated on selective and permissive media for validation. SHLD1 variant sequences were amplified by colony PCR, column purified, and sequenced.
Survival assays
For PARPi survival assays cells were seeded in 12-well or 6-well plates in duplicate. After 24 h, cells were treated with Olaparib at the indicated concentrations for 24 h. Cells were then provided with media without Olaparib for the remainder of the experiment. Colonies were fixed and stained with 50% methanol, 2% methylene blue, rinsed with water, and dried before counting. The survival percentage compared to untreated cells was calculated. Two technical replicates at two cell concentrations were scored for each condition in three independent experiments.
Class switch recombination assay
CH12-F3 cells and CRISPR-Cas9 edited Shld1−/− derivatives18 were cultured in RPMI supplemented with 5% NCTC-109 medium, 10% FCS, 100 U/ml penicillin, 100 ng/ml streptomycin and 2 mM l-glutamine at 37 °C with 5% CO2 under ambient oxygen conditions. Complemented cell lines were generated by lentivirus-mediated transduction, using viral supernatants collected from 293T cells co-transfected with third generation packaging vectors and pLenti-PGK-PURO-DEST (Addgene #19068) containing cloned transgene inserts. Typically, cells were spinoculated with polybrene (8 μg/ml) and HEPES (20 mM)-supplemented viral supernatants (480 x g, 90 min at 25 °C). Stable cell-lines were subsequently selected and maintained in the presence of puromycin (0.5 μg/ml). To stimulate CSR to IgA, CH12-F3 cells were stimulated with agonist anti-CD40 antibody (0.5 μg/ml; Miltenyi Biotec; FGK45.5), mouse IL-4 (5 ng/μl; R&D Systems) and TGFβ1 (2.5 ng/μl; R&D Systems). Cell-surface IgA expression was determined by flow cytometric staining with anti-mouse IgA-FITC antibody (Thermo Fisher; 11-4204-82; MA-6E1). Pellets collected from cultures of ~4 × 10⁷ CH12-F3 cells were lysed in BLB (Benzonase Lysis Buffer: 20 mM HEPES pH 7.9, 40 mM KCl, 2 mM MgCl2, 10% glycerol, 0.5% NP40, 50 U/ml Benzonase (Novagen), 0.05% (v/v) phosphatase inhibitors (Sigma-Aldrich) and protease inhibitors (Complete EDTA-free, Roche)) and were incubated on ice for 10 min before a second incubation with adjusted salt (450 mM KCl). TwinStrep-HA-SHLD1 wt, SHLD1ΔLDLP, L20P, or ΔN complexes were isolated from clarified lysates, following their dilution in NSB (no-salt buffer: 20 mM HEPES (pH 7.9), 10% glycerol, 0.5 mM DTT, 0.5 mM EDTA, 0.05% (v/v) phosphatase inhibitors (Sigma-Aldrich) and protease inhibitors (Roche)) to a final salt concentration of 125 mM. Complexes were immunopurified on Strep-Tactin®XT coated magnetic beads (IBA Life Sciences) and washed extensively in wash buffer (BLB supplemented with 125 mM KCl and 0.1% NP-40).
In-gel analysis of single-stranded telomeric DNA
Mouse telomeric overhangs were analyzed 96-120 h after Cre treatment by in-gel hybridization with a γ-32P-ATP end-labeled [AACCCT]4 probe, as previously described32. After background subtraction, the signal from the native gel was compared to the signal from total telomeric DNA in the same lane obtained by rehybridization of the probe after in situ denaturation of the DNA in the gel. The ratios between ss/ds telomeric signals in each lane were then normalized to the ratio of vector control cells not treated with Cre.
Data availability
All data that were generated and/or analyzed in this study are included in the published paper and its Supplementary Information. All other data supporting the findings of this study are available from the corresponding author upon reasonable request. Conservation symbols according to Uniprot can be found at https://www.uniprot.org/.
Statistics and reproducibility
All statistical analyses and p values are described in the figure legends. No statistical methods were used to predetermine sample size. Sample size was determined based on previous, similar experiments in the lab. No data was excluded from the experiments presented in the study. All immunoblots and sample images are representative of at least three independent experiments (unless otherwise indicated) with similar results. Our in vitro experiments are randomized as much as possible in the sense that culture dishes seeded with identical parental populations of cells were then chosen at random for the various biological perturbations. The investigators were not blinded to allocation during experiments and outcome assessment. Data was analyzed using Microsoft Excel and Graphpad Prism.
Extended Data
Extended Data Fig. 1. Generation and validation of p53/Rb-deficient RPE1 cells with mAID knocked into both PRIM1 loci. Related to Fig. 1.
a, Experimental scheme used to tag endogenous PRIM1 with AID-mClover. b, PCR genotyping of mClover-positive clones. Location of primer sets and the expected PCR band sizes are shown in a. c, Immunoblot for mClover-PRIM1 with PRIM1 or anti-GFP antibody. Clone #10, with both copies of PRIM1 tagged with AID-mClover, was selected for the experiments. d, Schematic of HA-OsTIR1 and immunoblot confirming dox-induced HA-OsTIR1 in subclones of PRIM1-AID-mClover clone #10. e, Immunoblot for GFP showing efficient PRIM1 degradation after the indicated IAA (auxin)/dox treatments in two subclones. f, Immunoblot as in e but testing timing and concentration of IAA. g, IF showing loss of EdU incorporation in subclone #6 after auxin/dox-induced PRIM1-AID degradation indicating the expected inhibition of DNA replication. In g, the number of fields of view (n, each represented by a dot) is indicated. In b-g, the experiment has been performed once. Means are indicated with center bars and SDs with error bars.
Extended Data Fig. 2. Primase blocks RAD51 loading in BRCA1-deficient cells. Related to Fig. 1.
a, Experimental timeline of auxin-induced degradation of PRIM1 in G2-arrested RPE1 cells. 5 hr after 5 Gy IR, cells were harvested for RAD51 IF. b, c, Quantification of number of RAD51 foci per nucleus for cells with the indicated treatments. This data is summarized in Fig. 1 panels e and i. Number of nuclei (n, each represented by a dot) pooled from four independent experiments is indicated. Statistical analyses as in Fig. 1. All means are indicated with center bars and SDs with error bars.
Extended Data Fig. 3. Experimental setup for detection of fill-in synthesis in U2OS-FOKI cells. Related to Fig. 2.
a, Experimental timeline for IF to detect BrdU incorporation at DSBs in G2-arrested U2OS cells. b, Representative IF images of cells as in a visualizing DAPI, 53BP1, mCherry-FOKI, and BrdU. The middle cell displays a global BrdU incorporation pattern, indicative of S phase. Image representative of four independent experiments. Scale bar, 20 μm. c, Experimental timeline and IF protocols for U2OS-FOKI-LacI cells released into G1. d, Representative IF images of HA-STN1 detected in U2OS-FOKI-LacI cells arrested in G2 with RO-3306 or released into G1 (9 μM RO-3306 overnight followed by washout into fresh media for 2 h before induction of FOKI). Nuclear outlines are demarcated by dashed white lines. Scale bars, 5 μm. e, Quantification of HA-STN1 colocalization with FOKI/53BP1 foci in cells as in d. n = three independent experiments. f, Representative IF for Cyclin A in cells as in c. Note the two pairs of small, neighboring, “doublet” cells, which in all cases were Cyclin A-negative. Such cell pairs are likely to represent the two daughter cells from a recent mitosis. Scale bar, 20 μm. g, Quantification of FOKI/BrdU colocalizations in induced, non-S-phase, “doublet” cells as in f after CDKi washout with or without Polα inhibitor. Data from three (CD437) or four (DMSO) independent experiments. Statistical analyses as in Fig. 1. All means are indicated with center bars and SDs with error bars.
Extended Data Fig. 4. MetaPLA for detection of fill-in synthesis in BRCA1-deficient cells. Related to Fig. 3.
a, Representative images from metaPLA of BrdU/γH2AX on metaphase spreads in Trf2F/F Lig4−/− MEFs with the indicated treatment that were used to validate the technique. Scale bar, 10 μm. b, Quantification of terminal, chromatin-associated BrdU/γH2AX PLA foci for cells as in a. c, Immunoblot for BRCA1 and REV7 in the indicated cells with or without Cre treatment as in Fig. 3c. Representative of three independent experiments. d, Quantification of chromatin-associated BrdU/γH2AX PLA foci on metaphase spreads in Brca1F/F MEFs of the indicated genotype, with 5 or 1 μM Olaparib. e, BrdU/γH2AX PLA controls quantified as in d. In b, d, and e, n = the number of metaphases scored in each condition as indicated (n) pooled from three independent experiments. Statistical analyses as in Fig. 1. All means are indicated with center bars and SDs with error bars.
Extended Data Fig. 5. Fill-in synthesis occurs late in G2 in BRCA1-deficient cells.
a, Experimental timeline for Polα inhibition in PARPi-treated, BRCA1-deficient MEFs released from G2 into prolonged (180 min) metaphase arrest. b, Quantification of the percent of chromosomes involved in radial structures. Number of metaphases (n, each represented by a dot) pooled from three independent experiments is indicated. c, Representative sample images of nuclei with intact or broken-down nuclear envelopes (NE) as assessed by Lamin A/C IF. Scale bars, 5 μm. d, Top, analysis of NE breakdown timing after release from G2 in cells as in a and c assessed at the indicated time points. Bottom, analysis of RAD51 foci formation in the same population of cells. Data from three independent experiments. For NE breakdown, Lamin A/C integrity was visually assessed in at least 800 cells per condition per experiment. For RAD51 foci formation, 50-136 nuclei were analyzed per condition per experiment. e, Quantification of RAD51-positive nuclei in Brca1F/F MEFs following treatment with Cre and IR. n = three (no Cre) or four (+ Cre) independent experiments. f, Quantification of percent of chromosomes involved in radial structures after the indicated treatment. Number of metaphases (n, each represented by a dot) pooled from four independent experiments is indicated. Statistical analyses as in Fig. 1. All means are indicated with center bars and SDs with error bars.
Extended Data Fig. 6. Bypass of 53BP1/shieldin by artificial tethering of CST. Related to Fig. 4.
a, Immunoblots for BRCA1, 53BP1, and SHLD1 detecting FHA-SHLD1 in the indicated MEFs expressing FHA-R61Q-SHLD1 (RQ), corresponding to Fig. 4b. b, Immunoblots for BRCA1 and SHLD1 detecting FHA-SHLD1 in the indicated MEFs, corresponding to Fig. 4c. c, Quantification of 53BP1 and GFP-FHA-STN1 foci at DSBs in the indicated MEFs after IR (n = 3 independent experiments, except for the first two columns, where n = 2 independent experiments. d, Representative images of irradiated Brca1F/F Shld2−/− or Brca1F/F 53BP1−/− MEFs as in c. Nuclear outlines are demarcated by dashed white lines. e, Immunoblots for BRCA1, 53BP1, and STN1 detecting endogenous and FHA-STN1 in Brca1F/F Shld2−/− MEFs as in Fig. 4i. f, Representative images of DAPI-stained metaphase spreads from cells as in e, corresponding to Fig. 4i. All scale bars, 10 μm. All panels are representative of three independent experiments. All means are indicated with center bars and SDs with error bars.
Extended Data Fig. 7. Identification of a SHLD1 mutant with impaired CTC1 interaction. Related to Fig. 5.
a, Schematic of 53BP1 and its downstream effectors. Interactions (lines) based on previous reports13,18-23. Black lines, interactions demonstrated by coimmunoprecipitation; purple lines, interactions demonstrated by yeast two-hybrid19. Asterisk denotes the SHLD1-CTC1 interaction targeted for disruption in the random mutagenesis screen in b. b, Mutants identified in a yeast two-hybrid screen for loss of CTC1 binding executed with randomly mutagenized human SHLD1 ORFs. Left, candidate GAD-SHLD1-URA3 variants (red numbers) grow on permissive (-leucine, -tryptophan, -uracil) media. Expression of full-length SHLD1 variants is ensured by growth on media lacking uracil. Several controls are also shown (black numbers, e.g., c1a). Variants that fail to grow on selective (-leucine, -tryptophan, -uracil, -adenine) media are indicated with a green circle (or triangle for deletion). Five sequenced variants were attributable to a single mutation (green shape with magenta border). Mutation L20P, deletion of nearby A23, or the mutations A119V or Q127L severely diminished the SHLD1-CTC1 interaction. Right, sequence alignment of human and mouse SHLD1 with conserved residues highlighted in yellow. SHLD1 sequence variants are represented graphically by shapes above the sequence (see legend at bottom). The experiment has been performed once. c, Multiple sequence alignment of SHLD1. Conservation symbols are according to Uniprot: asterisks, fully conserved; colon, strong similarity; period, weak similarity. The orange outline highlights the conserved LDLP motif deleted in the SHLD1Δ mutant used in this study.
Extended Data Fig. 8. Characterization of SHLD1Δ. Related to Fig. 5.
a, Immunoblots showing expression of SNAP-SHLD1 or SNAP-SHLD1ΔLDLP (Δ) in U2OS cells. b, Quantification of SNAP-SHLD1 localization to IR-induced γH2AX foci in cells as in a. n = 45 nuclei pooled from three independent experiments. c, Immunoprecipitation of myc-SHLD2C (aa 421-904) and immunoblot for SNAP-SHLD1 co-expressed in 293T cells. d, Representative IF images showing γH2AX co-localizing with HA-STN1 in irrradiated BRCA1/SHLD1 DKO cells complemented with wt SHLD1 or SHLD1Δ. Nuclear outlines are demarcated by dashed white lines. Scale bars, 5 μm. Five sample foci are shown for each nucleus. e, Quantification of IR-induced γH2AX foci with HA-STN1 signal in the indicated cells. Red dotted line: the average background level across multiple conditions of random overlaps between γH2AX and HA foci (see Materials and Methods). f, Quantification of γH2AX foci in the indicated RPE1 cells with HA-STN1 as in d and e. Center bar indicates median. g, Quantification of RAD51 foci as in Fig. 5e in parental (wt), BRCA1 KO, or SHLD1 KO RPE1 cells. n = 3-7 independent experiments (as indicated by the number of data points). Ordinary one-way ANOVA was performed with Tukey’s correction for multiple comparisons in g. h, Quantification of the number of RAD51 foci per nucleus for cells as in Fig. 5e with the indicated FLAG-SHLD1 constructs. In e, f, and h, the number of nuclei (n, each represented by a dot) pooled from three independent experiments is indicated. i, Representative images of DAPI-stained metaphase spreads (top; orange arrows denote aberrant radial chromosomes) or RAD51 foci (bottom; nuclear outlines demarcated by dashed white lines) in BRCA1/SHLD1 DKO cells complemented with an empty vector control, wt SHLD1, or SHLD1Δ. Scale bars, 5 μm. a and c are representative of two independent experiments.. Statistical analyses as in Fig. 1. All means are indicated with center bars (unless otherwise noted) and SDs with error bars.
Extended Data Fig. 9. SHLD1Δ suppresses overhang length at TPP1-deficient telomeres. Related to Fig. 6.
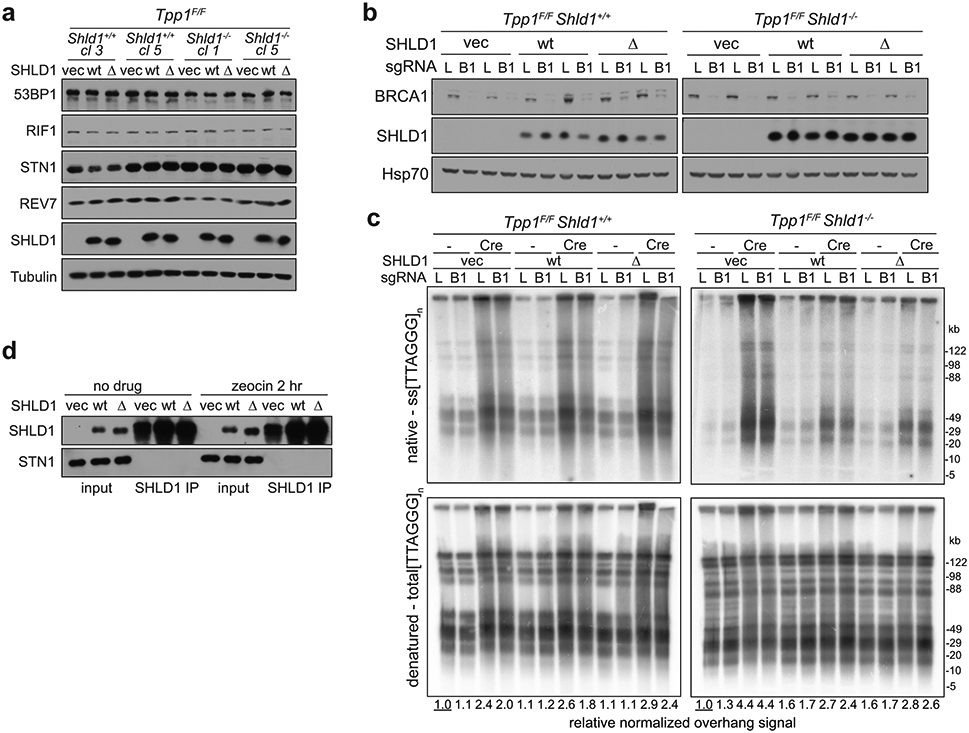
a, Immunoblot showing expression of 53BP1 pathway components and SHLD1 construct expression in Tpp1F/F Shld1+/+ or Shld1−/− clones. b, Immunoblot showing bulk CRISPR KO of BRCA1 and SHLD1 construct expression in cells of the indicated genotype with SHLD1 construct expression. c, Quantitative analysis of telomeric ss overhang intensity in cells as in b using in-gel hybridization to detect the 3’ overhang followed by rehybridization to the denatured DNA in the same gel, allowing the ratio of ss to total TTAGGG signal to be determined. d, Immunoprecipitation of SHLD1 in Tpp1F/F MEFs with the indicated treatments and STN1 immunoblot. Experiments in a-d have been performed once.
Extended Data Fig. 10. SHLD1Δ suppresses overhang length at TRF2-deficient telomeres. Related to Fig. 6.
a, Immunoblot showing SHLD1 construct expression and TRF2 deletion by Cre in Trf2F/F Lig4−/− Shld1+/+ or Shld1−/− clones. Asterisks indicate non-specific bands. b, Quantitative analysis of telomeric ss overhang intensity in cells as in a. c, Quantification of overhangs from Trf2F/F Lig4−/− Shld1−/− cells (n = 3 independent experiments. a-c represent data from three independent experiments using two independent clones (circles and triangle). d, Immunoblot showing bulk CRISPR KO of BRCA1 (arrow), phosphorylation of CHK2 after TRF2 deletion, and SHLD1 construct expression. e, Telomeric overhang analysis on cells as in d. Statistical analysis was performed using two-tailed ratio-paired t-test. *, p<0.05; **, p<0.01; ns, not significant. Experiments in d, e have been performed once. f, Schematic of mouse IgA Switch region with several five nucleotide repeat sequences and their number of repeats in the region (4.4 kb). All means are indicated with center bars and SDs with error bars.
Supplementary Material
Supplementary Figure 1: Gating strategy used in Figure 6a.
Acknowledgements
We thank Alessandro Bianchi and Fred Cross for help designing the yeast-two hybrid SHLD1 mutagenesis screen. Zhe Yang is thanked for generating p53/RB-null RPE1 cells, and Hiro Takai for designing CRISPR/Cas9 gene targeting reagents. We thank Franziska Stoof for help with the metaIF protocol which was adapted for metaPLA. Brooke Conti and Agata Smogorzewska provided vidarabine triphosphate, and Roger Greenberg is thanked for sharing U2OS-FOKI-LacI cells. We thank Dan Durocher for BRCA1 KO and isogenic control RPE1 cells. Z.M. is supported by an NCI F99 award (1F99CA245720-01). A.K. is funded by an EMBO Long-Term Fellowship (ALTF 542-2020) and MRC grant (MR/R017549/1) to J.R.C. J.R.C is supported by Cancer Research UK (C52690/A19270) and Lister Institute Fellowships. This work was supported by grants from the NCI (5 R35 CA210036), the Breast Cancer Research Foundation (BCRF-19-036) and the Melanoma Research Alliance (MRA#577521) to T.d.L. T.d.L. is an American Cancer Society Rose Zarucki Trust Research Professor.
Footnotes
Competing Interests
T.d.L. is a member of the Scientific Advisory Board of Calico Life Sciences. The remaining authors declare no competing interests.
References
- 1.Mirman Z & de Lange T 53BP1: a DSB escort. Genes Dev 34, 7–23 (2020). [DOI] [PMC free article] [PubMed] [Google Scholar]
- 2.Pannunzio NR, Watanabe G & Lieber MR Nonhomologous DNA end-joining for repair of DNA double-strand breaks. J Biol Chem 293, 10512–10523 (2018). [DOI] [PMC free article] [PubMed] [Google Scholar]
- 3.Wright WD, Shah SS & Heyer WD Homologous recombination and the repair of DNA double-strand breaks. J Biol Chem 293, 10524–10535 (2018). [DOI] [PMC free article] [PubMed] [Google Scholar]
- 4.Hustedt N & Durocher D The control of DNA repair by the cell cycle. Nat Cell Biol 19, 1–9 (2016). [DOI] [PubMed] [Google Scholar]
- 5.Bhattacharyya A, Ear US, Koller BH, Weichselbaum RR & Bishop DK The breast cancer susceptibility gene BRCA1 is required for subnuclear assembly of Rad51 and survival following treatment with the DNA cross-linking agent cisplatin. J Biol Chem 275, 23899–23903 (2000). [DOI] [PubMed] [Google Scholar]
- 6.Farmer H et al. Targeting the DNA repair defect in BRCA mutant cells as a therapeutic strategy. Nature 434, 917–921 (2005). [DOI] [PubMed] [Google Scholar]
- 7.Roy R, Chun J & Powell SN BRCA1 and BRCA2: different roles in a common pathway of genome protection. Nat Rev Cancer 12, 68–78 (2011). [DOI] [PMC free article] [PubMed] [Google Scholar]
- 8.Bouwman P et al. 53BP1 loss rescues BRCA1 deficiency and is associated with triple-negative and BRCA-mutated breast cancers. Nat Struct Mol Biol 17, 688–695 (2010). [DOI] [PMC free article] [PubMed] [Google Scholar]
- 9.Bunting SF et al. 53BP1 inhibits homologous recombination in Brca1-deficient cells by blocking resection of DNA breaks. Cell 141, 243–254 (2010). [DOI] [PMC free article] [PubMed] [Google Scholar]
- 10.Setiaputra D & Durocher D Shieldin - the protector of DNA ends. EMBO Rep 20, (2019). [DOI] [PMC free article] [PubMed] [Google Scholar]
- 11.Zimmermann M, Lottersberger F, Buonomo SB, Sfeir A & de Lange T 53BP1 regulates DSB repair using Rif1 to control 5’ end resection. Science 339, 700–704 (2013). [DOI] [PMC free article] [PubMed] [Google Scholar]
- 12.Escribano-Díaz C et al. A cell cycle-dependent regulatory circuit composed of 53BP1-RIF1 and BRCA1-CtIP controls DNA repair pathway choice. Mol Cell 49, 872–883 (2013). [DOI] [PubMed] [Google Scholar]
- 13.Feng L, Fong KW, Wang J, Wang W & Chen J RIF1 counteracts BRCA1-mediated end resection during DNA repair. J Biol Chem 288, 11135–11143 (2013). [DOI] [PMC free article] [PubMed] [Google Scholar]
- 14.Chapman JR et al. RIF1 is essential for 53BP1-dependent nonhomologous end joining and suppression of DNA double-strand break resection. Mol Cell 49, 858–871 (2013). [DOI] [PMC free article] [PubMed] [Google Scholar]
- 15.Di Virgilio M et al. Rif1 prevents resection of DNA breaks and promotes immunoglobulin class switching. Science 339, 711–715 (2013). [DOI] [PMC free article] [PubMed] [Google Scholar]
- 16.Boersma V et al. MAD2L2 controls DNA repair at telomeres and DNA breaks by inhibiting 5’ end resection. Nature 521, 537–540 (2015). [DOI] [PMC free article] [PubMed] [Google Scholar]
- 17.Xu G et al. REV7 counteracts DNA double-strand break resection and affects PARP inhibition. Nature 521, 541–544 (2015). [DOI] [PMC free article] [PubMed] [Google Scholar]
- 18.Ghezraoui H et al. 53BP1 cooperation with the REV7-shieldin complex underpins DNA structure-specific NHEJ. Nature 560, 122–127 (2018). [DOI] [PMC free article] [PubMed] [Google Scholar]
- 19.Mirman Z et al. 53BP1-RIF1-shieldin counteracts DSB resection through CST- and Polα-dependent fill-in. Nature 560, 112–116 (2018). [DOI] [PMC free article] [PubMed] [Google Scholar]
- 20.Gupta R et al. DNA Repair Network Analysis Reveals Shieldin as a Key Regulator of NHEJ and PARP Inhibitor Sensitivity. Cell 173, 972–988.e23 (2018). [DOI] [PMC free article] [PubMed] [Google Scholar]
- 21.Dev H et al. Shieldin complex promotes DNA end-joining and counters homologous recombination in BRCA1-null cells. Nat Cell Biol 20, 954–965 (2018). [DOI] [PMC free article] [PubMed] [Google Scholar]
- 22.Noordermeer SM et al. The shieldin complex mediates 53BP1-dependent DNA repair. Nature 560, 117–121 (2018). [DOI] [PMC free article] [PubMed] [Google Scholar]
- 23.Gao S et al. An OB-fold complex controls the repair pathways for DNA double-strand breaks. Nat Commun 9, 3925 (2018). [DOI] [PMC free article] [PubMed] [Google Scholar]
- 24.Findlay S et al. SHLD2/FAM35A co-operates with REV7 to coordinate DNA double-strand break repair pathway choice. EMBO J 37, (2018). [DOI] [PMC free article] [PubMed] [Google Scholar]
- 25.Natsume T, Kiyomitsu T, Saga Y & Kanemaki MT Rapid Protein Depletion in Human Cells by Auxin-Inducible Degron Tagging with Short Homology Donors. Cell Rep 15, 210–218 (2016). [DOI] [PubMed] [Google Scholar]
- 26.Tang J et al. Acetylation limits 53BP1 association with damaged chromatin to promote homologous recombination. Nat Struct Mol Biol 20, 317–325 (2013). [DOI] [PMC free article] [PubMed] [Google Scholar]
- 27.Han T et al. The antitumor toxin CD437 is a direct inhibitor of DNA polymerase α. Nat Chem Biol 12, 511–515 (2016). [DOI] [PMC free article] [PubMed] [Google Scholar]
- 28.Holzer S et al. Structural Basis for Inhibition of Human Primase by Arabinofuranosyl Nucleoside Analogues Fludarabine and Vidarabine. ACS Chem Biol 14, 1904–1912 (2019). [DOI] [PMC free article] [PubMed] [Google Scholar]
- 29.Nakamura A et al. Techniques for gamma-H2AX detection. Methods Enzymol 409, 236–250 (2006). [DOI] [PubMed] [Google Scholar]
- 30.Cesare AJ et al. Spontaneous occurrence of telomeric DNA damage response in the absence of chromosome fusions. Nat Struct Mol Biol 16, 1244–1251 (2009). [DOI] [PubMed] [Google Scholar]
- 31.Cesare AJ, Heaphy CM & O’Sullivan RJ Visualization of Telomere Integrity and Function In Vitro and In Vivo Using Immunofluorescence Techniques. Curr Protoc Cytom 73, 12.40.1–12.40.31 (2015). [DOI] [PMC free article] [PubMed] [Google Scholar]
- 32.Celli GB & de Lange T DNA processing is not required for ATM-mediated telomere damage response after TRF2 deletion. Nat Cell Biol 7, 712–718 (2005). [DOI] [PubMed] [Google Scholar]
- 33.Erhart D et al. Chemical development of intracellular protein heterodimerizers. Chem Biol 20, 549–557 (2013). [DOI] [PubMed] [Google Scholar]
- 34.Franco S et al. H2AX prevents DNA breaks from progressing to chromosome breaks and translocations. Mol Cell 21, 201–214 (2006). [DOI] [PubMed] [Google Scholar]
- 35.Barazas M et al. The CST Complex Mediates End Protection at Double-Strand Breaks and Promotes PARP Inhibitor Sensitivity in BRCA1-Deficient Cells. Cell Rep 23, 2107–2118 (2018). [DOI] [PMC free article] [PubMed] [Google Scholar]
- 36.de Lange T Shelterin-Mediated Telomere Protection. Annu Rev Genet 52, 223–247 (2018). [DOI] [PubMed] [Google Scholar]
- 37.Lottersberger F, Bothmer A, Robbiani DF, Nussenzweig MC & de Lange T Role of 53BP1 oligomerization in regulating double-strand break repair. Proc Natl Acad Sci U S A 110, 2146–2151 (2013). [DOI] [PMC free article] [PubMed] [Google Scholar]
- 38.Hom RA & Wuttke DS Human CST Prefers G-Rich but Not Necessarily Telomeric Sequences. Biochemistry 56, 4210–4218 (2017). [DOI] [PMC free article] [PubMed] [Google Scholar]
- 39.Chaudhuri J & Alt FW Class-switch recombination: interplay of transcription, DNA deamination and DNA repair. Nat Rev Immunol 4, 541–552 (2004). [DOI] [PubMed] [Google Scholar]
- 40.Anderson BH et al. Mutations in CTC1, encoding conserved telomere maintenance component 1, cause Coats plus. Nat Genet 44, 338–342 (2012). [DOI] [PubMed] [Google Scholar]
- 41.Ochs F et al. 53BP1 fosters fidelity of homology-directed DNA repair. Nat Struct Mol Biol 23, 714–721 (2016). [DOI] [PubMed] [Google Scholar]
- 42.Schimmel J, Muñoz-Subirana N, Kool H, van Schendel R & Tijsterman M Small tandem DNA duplications result from CST-guided Pol α-primase action at DNA break termini. Nat Commun 12, 4843 (2021). [DOI] [PMC free article] [PubMed] [Google Scholar]
- 43.Paiano J et al. Role of 53BP1 in end protection and DNA synthesis at DNA breaks. Genes Dev 35, 19–20 (2021). [DOI] [PMC free article] [PubMed] [Google Scholar]
- 44.Xu X et al. Centrosome amplification and a defective G2-M cell cycle checkpoint induce genetic instability in BRCA1 exon 11 isoform-deficient cells. Mol Cell 3, 389–395 (1999). [DOI] [PubMed] [Google Scholar]
- 45.Wu P, Takai H & de Lange T Telomeric 3’ overhangs derive from resection by Exo1 and Apollo and fill-in by POT1b-associated CST. Cell 150, 39–52 (2012). [DOI] [PMC free article] [PubMed] [Google Scholar]
- 46.Yang Z, Maciejowski J & de Lange T Nuclear Envelope Rupture Is Enhanced by Loss of p53 or Rb. Mol Cancer Res 15, 1579–1586 (2017). [DOI] [PMC free article] [PubMed] [Google Scholar]
- 47.Mirzoeva OK & Petrini JH DNA damage-dependent nuclear dynamics of the Mre11 complex. Mol Cell Biol 21, 281–288 (2001). [DOI] [PMC free article] [PubMed] [Google Scholar]
- 48.Cesare AJ, Hayashi MT, Crabbe L & Karlseder J The telomere deprotection response is functionally distinct from the genomic DNA damage response. Mol Cell 51, 141–155 (2013). [DOI] [PMC free article] [PubMed] [Google Scholar]
Associated Data
This section collects any data citations, data availability statements, or supplementary materials included in this article.
Supplementary Materials
Supplementary Figure 1: Gating strategy used in Figure 6a.
Data Availability Statement
All data that were generated and/or analyzed in this study are included in the published paper and its Supplementary Information. All other data supporting the findings of this study are available from the corresponding author upon reasonable request. Conservation symbols according to Uniprot can be found at https://www.uniprot.org/.


