Abstract
Background:
The effect of bone marrow (BM) blasts on outcome of patients with MF is poorly understood, unless they are ≥10% and represent more aggressive accelerated phase. Similarly, the role of JAK inhibitor ruxolitinib (RUX) has not been assessed in correlation with BM blasts.
Patients and methods:
Herein, we present clinical characteristics and outcomes of 1412 patients with MF stratified by BM blasts and therapy.
Results:
Seven and 4 percent of patients had 5–9% and ≥10% BM blasts, respectively. Forty four percent of patients were treated with RUX throughout their disease course. Overall survival (OS) differed among patients with 0–1%, 2–4% and 5–9% BM blasts with median of 64, 48 and 22 months, respectively (p< 0.001). Patients with 5–9% BM blasts had similar OS as patients with ≥10% BM blasts (22 vs 14 months, p = 0.73). All patients with <10% blasts who were treated with RUX showed superior OS to patients who did not receive RUX.
Conclusions:
Our results indicate that MF patients with ≥ 5% BM blasts represent a high risk group with adverse clinical characteristics and inferior outcome. However, they still appear to derive substantial survival benefit from therapy with RUX.
Keywords: myelofibrosis, bone marrow blasts, ruxolitinib, outcome
Micro Abstract
We retrospectively analyzed the outcomes of 1412 patients with myelofibrosis stratified by bone marrow blasts and exposure to ruxolitinib (RUX). Patients with 5–9% and 10–19% blasts had similar clinical characteristics and outcome. All patients with <10% blasts had superior survival if treated with RUX. In summary, myelofibrosis patients with 5–9% BM blasts have adverse clinical course, yet still benefit from RUX.
Introduction:
Myelofibrosis (MF) is a Philadelphia chromosome (BCR-ABL1)-negative myeloproliferative neoplasm that is characterized by thickening and distortion of bony trabeculae, deposition of reticulin and collagen fibers, and megakaryocytic proliferation and atypia. Clinically, it is characterized by splenomegaly, variable degrees of cytopenia, a leucoerythroblastic blood picture, constitutional symptoms and, occasionally, extramedullary hematopoiesis 1. The prognosis of MF is variable; however, the median survival of affected individuals is around 6 years 2. Several models have been developed to predict overall survival as well transformation risk to blast phase (≥20% blasts; i.e. acute myeloid leukemia [AML]) 3,4. Patients with accelerated phase (AP) MF (10–19% blasts in bone marrow [BM] or peripheral blood [PB]) have a higher risk of leukemic transformation and shorter overall survival (OS) than those in the chronic phase (CP; <10% BM/PB blasts) MF 5. A peripheral blast percentage of ≥1%, ≥2% or ≥3% in various studies were associated with inferior OS and increased risk of leukemic transformation 6–10. However, detailed data on the prognostic role of BM blasts or further stratification of patients based on blast percentage (0–9% blasts) are not available. This is in contrast to situation with myelodysplastic syndromes (MDS), a set of related chronic neoplasms of the bone marrow, where BM blasts percentage have been used for years to separate patients into different prognostic groups, and >5% BM blasts classifies a higher risk category with excess blasts 11.
The JAK1/2 inhibitor ruxolitinib (RUX, INCB018424; Incyte; Wilmington, Delaware, USA) was the first approved JAK1/2 inhibitor for patients with symptomatic MF. RUX initially showed rapid reduction in splenomegaly and significant improvement in MF-related symptoms and quality of life in 2 phase III studies comparing RUX to either placebo (Controlled Myelofibrosis Study With Oral JAK Inhibitor Treatment - 1, COMFORT-1) 12 or best available therapy (BAT) (COMFORT-II) 13, respectively, which was followed by demonstration of significant OS benefit with RUX over placebo or BAT 14,15. The effect of RUX in patients with MF and different BM blasts percentage has not been studied previously.
In this retrospective study, we aimed to evaluate the clinical characteristics and survival outcomes, as well as the effect of RUX therapy in MF patients seen at our institution, as it relates to different percentages of BM blasts.
Patients and Methods:
The medical charts of 1571 patients with MF who presented to MD Anderson Cancer Center between 1984 and 2018 were retrospectively evaluated. Among them, 1412 had available BM blast percentages and represent the current study population. Patients with discordant peripheral and bone marrow blasts (e.g. higher peripheral blasts than targeted BM cutoffs of 5%−9% and ≥ 10% blasts) were excluded. Blasts were assessed by immunohistochemistry and confirmed by flow cytometry if ≥ 5%. Primary myelofibrosis (PMF) was diagnosed according to 2016 World Health Organization (WHO) criteria 11, and post-polycythemia vera and post-essential thrombocytosis myelofibrosis (PPV/PET-MF) were diagnosed according to The International Working Group for Myelofibrosis Research and Treatment (IWG-MRT) criteria 16. Unfavorable karyotype was defined as per Caramazza et al 17. Molecular testing (28 or 81 gene panel; done as per tests availability and year of presentation) was performed by real time PCR-based sequencing, using a next generation sequencing (NGS) platform, as previously described 18. Overall survival (OS) was calculated from the date of referral to the date of last follow-up or death, whichever came first, using the Kaplan–Meier method with log-rank test (also calculated as censored at the time of stem cell transplantation [SCT]). Leukemia free survival (LFS) used death as a competing risk. Clinico-pathological parameters (categorical and continuous variables) were analyzed using the Fisher’s exact, Kruskal–Wallis or Mann–Whitney U tests, as appropriate; and their associations with OS was assessed by Cox proportional hazard model. All p-values are two-sided and p < 0.05 was considered to be statistically significant. All statistical computations were performed using SPSS, version 23.0 (Chicago, IL).
Results:
Overall demographics and clinical characteristics
Despite the referral time of 34 years (1984–2018), 1327 patients (94%) presented to our institution after the year of 2000. Fifty three percent (n = 755) of patients presented at diagnosis, and another 373 patients (total n = 1128, 80%) presented within the first 15 months of MF diagnosis. Forty nine percent of patients (n = 693) had PMF. The median age of the entire group was 66 years (range, 20–90 years), and 867 (61%) were males. Over the median follow-up of 25 months (range, 10–251), 710 patients (50%) have died.
Overall, significant anemia (hemoglobin <10g/dL) and thrombocytopenia (platelets <100 ×109/L) were present in 605 (43%) and 356 (25%) patients, respectively. Fifty percent of patients (n=670) had palpable spleen of > 5 cm below costal margin, and 76% (n=1068) had ECOG (Eastern Co-operative Oncology Group) performance status >1 with some constitutional symptoms. Forty seven percent (n = 665) of patients had intermediate 2 or high risk DIPSS. Sixty eight percent of tested patients (n = 819 out of 1202 tested) were JAK2V617F positive. Among 628 patients (44% of the total) analyzed for additional non-driver mutations by NGS, 164 (26%), 80 (12.7%), and 35 (5.51%) had one, two, or ≥ three mutations. Abnormal karyotype was detected in 494 patients (37% of 1324 patients with available cytogenetic analysis), with 76 patients (5.7%) having complex karyotype (≥ 3 abnormality). Fifty six patients (3.9%) had ≥ 10% blasts in BM/PB (AP), the remaining patients were in chronic phase (CP) with < 10% blasts.
Definition of risk groups by BM blasts percentage, overall survival and disease progression
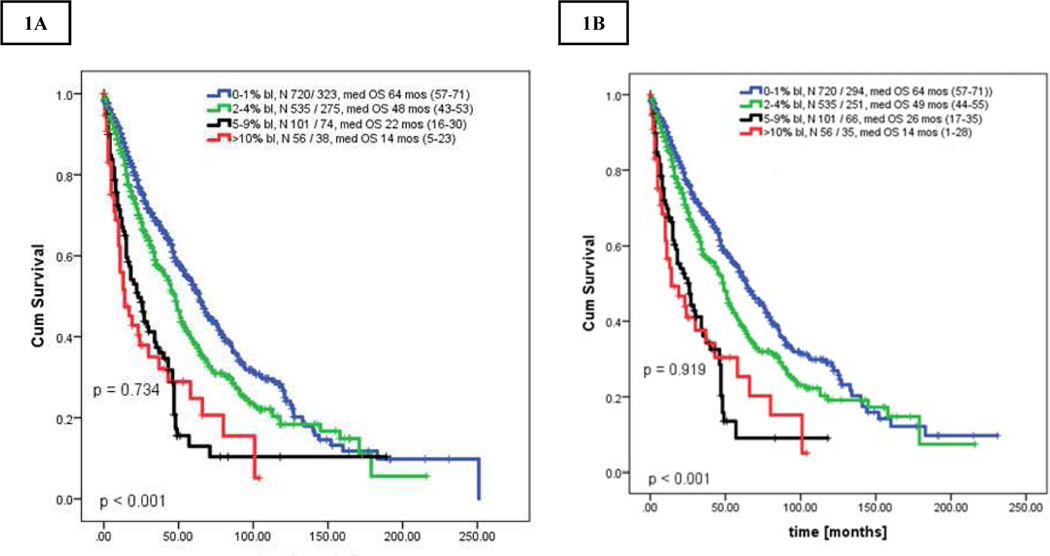
First we compared OS of patients in chronic phase MF based on BM blasts percentages (separately for 0% to 9%; Supplemental Table 1). Patients with similar OS were grouped together and created the final 3 groups of 0–1% (CP, n=720, 51%), 2–4% (CP-1, n=535, 37.9%), and 5–9% blasts (n=101, 7.2%). The respective OS for CP, CP-1, CP-2 and AP patients were 64 months (range, 57–71), 48 months (range, 43–53), 22 months (range, 16–30), and 14 months (range, 5–23); p < 0.001 (Figure 1A). Survival of patients with CP-2 was inferior to those in CP and CP-1 (CP-2 to CP-1: HR 0.52 [95% CI 0.40–0.67]; CP-2 to CP: HR 0.39 [95% CI 0.29–0.59], both p < 0.001].
Figures 1.
A-B. Kaplan Meier curve showing overall survival of all patients stratified by bone marrow blast percentage: [A] uncensored survival for stem cell transplantation, [B] censored survival for stem cell transplantation. All P-values between any 2 groups were < 0.05 unless further specified.
The survival outcomes after censoring for allogeneic SCT (n=119) showed similar results, with OS for CP, CP-1, CP-2 and AP of 64 (range, 57–71); 49 (range, 44–54), 25 (range, 17–35) months, and 14 (range, 2–28) months, respectively; (p<0.001 for all, p=0.91 between CP-2 and AP, Figure 1B).
Progression to AML (≥ 20% blasts) was observed in total of 146 patients (10%) with the highest cumulative incidence among patients with AP (52 CP [7.2%], 53 CP-1 [10%], 20 CP-2 [20%] and 21 AP 37.5%], p < 0.001]. AML incidence per person-years of follow-up was 3.48 cases per 100 person-years (2.7; 3.1, 7.7, and 24.7 cases per 100 person-years of CP, CP-1, CP-2 and AP; respectively, p<0.001 all; CP vs CP-1, p = 0.96; CP-1 vs CP-2, p = 0.01). Estimated LFS at 3 years was 67% for CP, 56% for CP-1, 33% for CP-2 and 25% for AP, respectively.
Clinical characteristics
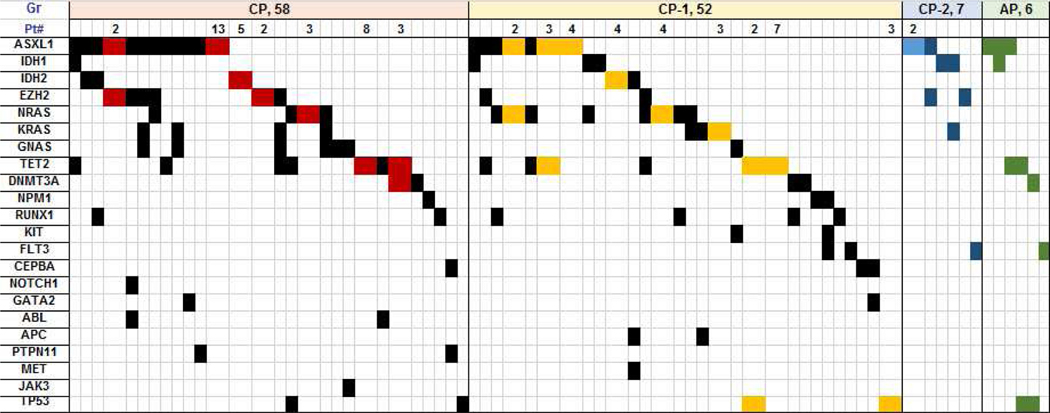
Table 1, Figure 2, and Supplemental Tables 2, and 3 summarize clinical characteristics, distribution of karyotype and non-driver molecular mutations in patients stratified by blast percentage. Patients with BM blasts < 5%, e.g., CP and CP-1, had lower WBC, higher platelets and hemoglobin, less frequent anemia (hemoglobin < 10 g/dL), lower incidence of palpable spleen > 5 cm below costal margin, less frequent grade ≥2 marrow fibrosis, and less frequent complex karyotype than patients with CP-2 and AP (Supplemental Table 2). On multivariate analysis (using all clinical variables from Table 1), BM blasts remained independent predictors of outcome. Patients with CP-2 had similar clinical characteristics as those with AP (Supplemental Table 3). The frequency of additional non-driver mutations, as well as high risk molecular mutations (i.e., ASXL1, EZH2, IDH1 / IDH2) was similar among all groups (Table 1, Figure 2).
Table 1.
Demographics and clinical characteristics of patients stratified according to blast percentage
| Pt. Characteristics | CP N=720 | CP-1 N=535 | CP-2 N=101 | AP N=56 | P-value |
|---|---|---|---|---|---|
| Median age, years (range) | 65 (24–89) | 67 (20–90) | 67 (32–86) | 66 (28–81) | 0.066 |
| Age > 65 years, N (%) | 355 (49) | 295 (55) | 60 (59) | 22 (39) | 0.094 |
| Males, N (%) | 437 (61) | 325 (61) | 65 (64) | 40 (71) | 0.400 |
| Median WBC ×10 9 /L, (range) | 8.6 (1–191) | 10.5 (1–228) | 12.8 (2–361) | 12.6 (1–76) | <0.001 |
| WBC > 25 ×10 9 /L, N (%) | 100 (14) | 105 (20) | 31 (31) | 11 (20) | <0.001 |
| Median platelets × 10 9 /L, (range) | 216 (1–2690) | 213 (6–1958) | 165 (6–877) | 146 (3–764) | 0.008 |
| Platelets < 100 ×10 9 /L, N (%) | 162 (23) | 134 (25) | 38 (38) | 22 (39) | <0.001 |
| Median hemoglobin g/dL, (range) | 10.5 (4–19) | 10.4 (5–18) | 10 (4.6–16) | 9.2 (5.8–15) | 0.001 |
| Hemoglobin < 10 g/dL, n (%) | 290 (40) | 228 (43) | 51 (50) | 36 (64) | 0.002 |
| Transfusion dependency, N (%) | 176 (24) | 128 (24) | 26 (26) | 21 (38) | 0.175 |
| Splenomegaly, > 5 cm BCM, N (%) | 310 (43) | 268 (50) | 62 (61) | 30 (54) | 0.003 |
| Symptoms, N (%) | 525 (73) | 408 (76) | 83 (82) | 52 (93) | 0.005 |
| BM fibrosis, grade ≥2, N (%) | 570 (79) | 441 (82) | 89 (88) | 50 (89) | 0.042 |
| Abnormal karyotype, N (%) | 210 / 661 (32) | 209 / 523 (40) | 41 / 96 (43) | 34 / 53 (64) | 0.06 |
| Complex karyotype, N (%) | 27 (4) | 31 (6) | 9 (9) | 6 (11) | 0.001 |
| JAK2 positive, N / N tested (%) | 412 / 611 (67) | 327 / 467 (7) | 51 / 78 (65) | 29 / 46 (63) | 0.608 |
| CALR, N (%) | 60 (10) | 53 (11) | 10 (13) | 5 (11) | 0.261 |
| MPL, N (%) | 29 (5) | 17 (4) | 1 (13) | 0 | 0.145 |
| Triple negative, N / N tested (%) | 34 / 534 (6) | 17 / 409 (4) | 2 / 64 (3) | 5 / 39 (13) | 0.086 |
| Additional molecular mutations (MolM), N (%) | 122 / 303 (40) | 123 / 253 (49) | 21 / 41 (51) | 13 / 31 (42) | 0.25 |
| HMR (ASXL1, EZH2, IDH1/2),total N, (%) | 81 / 303 (27) | 70 / 253 (28) | 14 / 41 (34) | 9 / 31 (29) | 0.09 |
| Median follow up, months (range) | 29 (1–251) | 23 (1–216) | 18 (1–189) | 11 (10–104) | <0.001 |
Abbr. and definitions: PRBC dependency: more than 4 UI PRBC / 2 months; WBC = white blood cells, BCM = below costal margin, BM fibrosis grading is according European classification (EUNMET), 3 or more Abn (complex karyotype); MolM = molecular mutations, HMR = high risk molecular mutations.
Figure 2.
Distribution of additional molecular mutations among patients with molecular abnormality. Each column represents one patient unless indicated in the first row “Pt#” which combines patients with the same molecular abnormality in one column and is also depicted by a different color. Number in “Pt” row equals the actual number of patients with the same molecular abnormality shown in that particular column
Treatment
Among all 1412 patients, 1053 patients (75%) received at least one therapy prior to presentation to our institution (including growth factors and steroids), with a median of 2 treatments per patient (range, 1–4). The most frequent were hydroxyurea (n = 652), immunomodulatory agents (n = 228), and steroids (n=204). JAK2 inhibitor RUX was given to 117 patients. During the follow-up at our institution, 186 patients (13%) did not receive any therapy (majority due to loss to follow-up or a very short follow-up). Among the remaining 1226 who were treated, 739 (60%) underwent therapy in a clinical trial (range, 1–5 trials per patient; 229 patients were treated with >1 clinical trial). Median number of all treatments received at our institution (since the presentation) was 2 (range: 1–8). In total, 119 patients (8%) underwent allogeneic SCT during their follow-up.
Overall, 540 patients were treated with RUX, 117 prior to coming to our institution. Two hundred and forty nine patients were treated on a clinical trial (monotherapy or in combination, Supplemental Table 4). Distribution to blast categories was done at the time of initial presentation to our institution, and not at the time of RUX therapy initiation which limits our ability to properly assess these correlations. Sixty seven percent (n=362) of patients received RUX as a single agent, whereas the remaining patients were treated with combinations (Supplemental Table 4). We were only able to determine the length of RUX therapy since the first visit or its initiation at our institution. Median duration of RUX therapy appeared significantly shorter in AP patients compared to all others (median of 6 vs 14–19 months, respectively, Supplemental Table 4). Due to various regimens and response assessments (especially for spleen, e.g., by palpation or by MRI); direct comparison of treatment efficacy was not feasible.
Ruxolitinib and overall survival
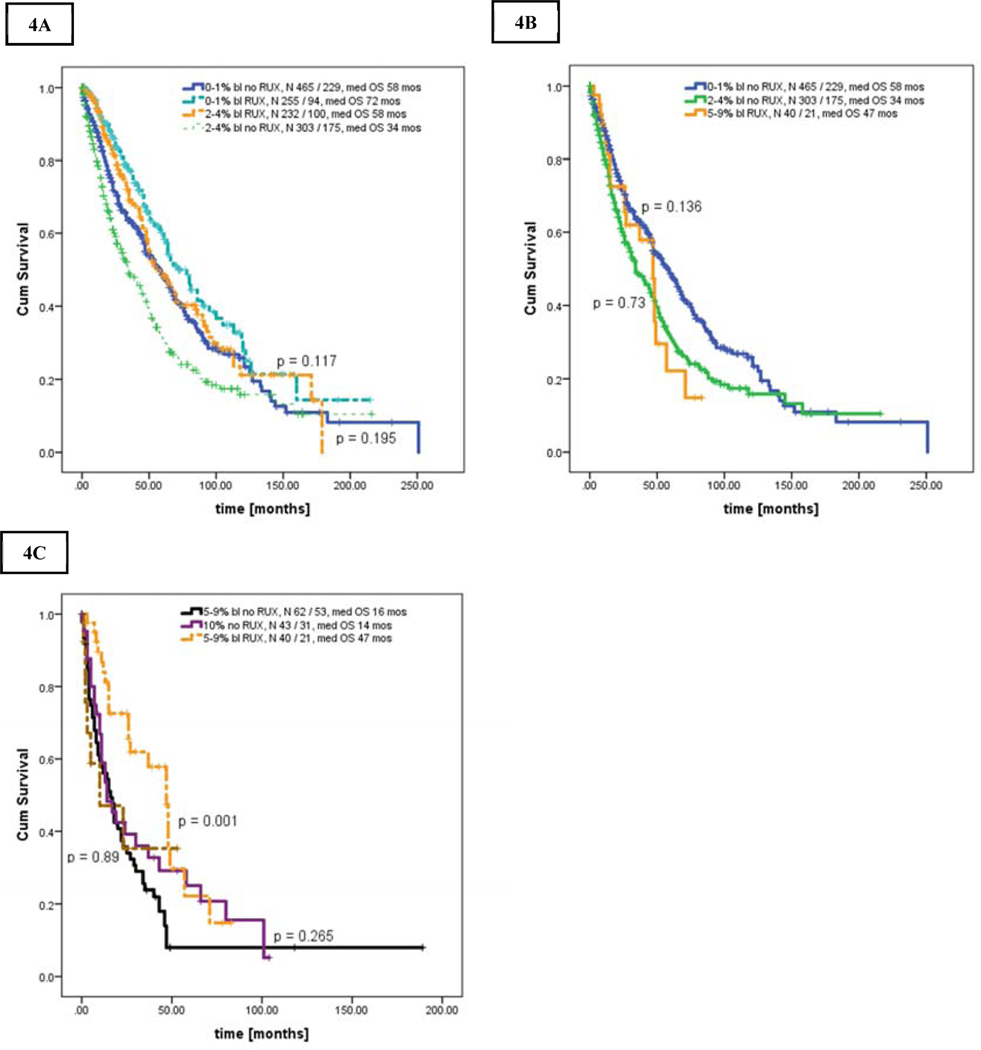
Next, we performed an analysis of OS stratified by exposure to RUX during the disease course starting from presentation to our institution (Figures 4A–C). Survival of patients in AP was similar regardless of RUX exposure (no RUX [n = 43] vs RUX [n = 13] with median OS of 14 (range, 6–21) and 10 (range, 1–33) months, respectively, p = 0.539).
Figures 4.
A-C. Kaplan Meier curve showing overall survival in patients stratified by bone marrow blasts and the use of ruxolitinib: [A] patients in CP versus CP-1 with and without ruxolitinib, [B] patients in CP-2 with ruxolitinib versus CP and CP-1 without ruxolitinib, [C] patients in CP-2 with and without ruxolitinib versus patients in AP
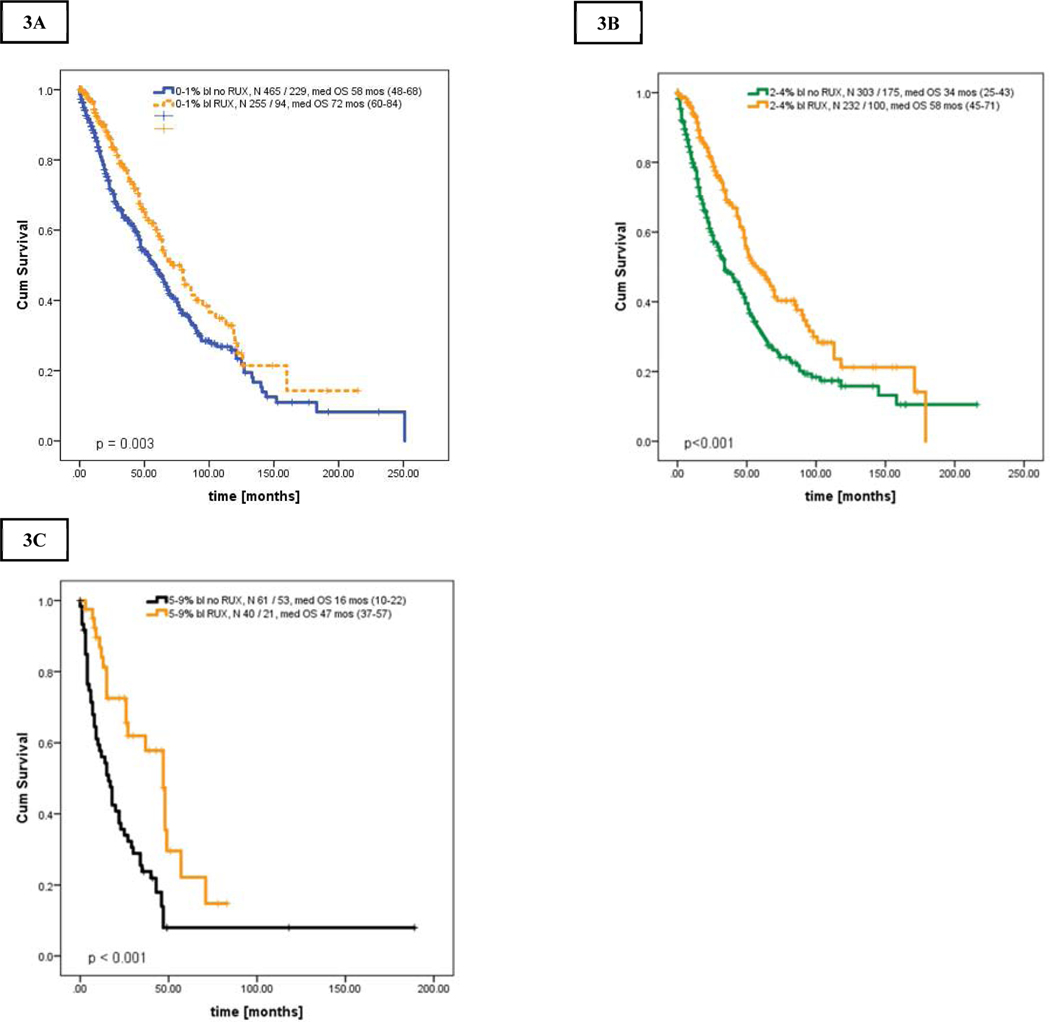
However, patients in chronic MF regardless of blasts percentage who were exposed to RUX had superior OS to those not treated with RUX. The median OS of patients with RUX versus without RUX was as follows: i) CP; 72 months (range, 60–84) vs 58 months (range, 48–68), p = 0.003, HR 0.70, 95% CI 0.84–0.89 (Figure 4A), ii) CP-1; 58 months (range, 45–71) vs 34 months (range, 25–43), p <0.001, HR 0.59, 95% CI 0–46 - 0.75 (Figure 4B), iii) CP-2; 47 months (range, 37–75) vs 16 months (range, 10–22), p < 0.001, HR 0.91, 95% CI 0.87–0.96 (Figure 4C).
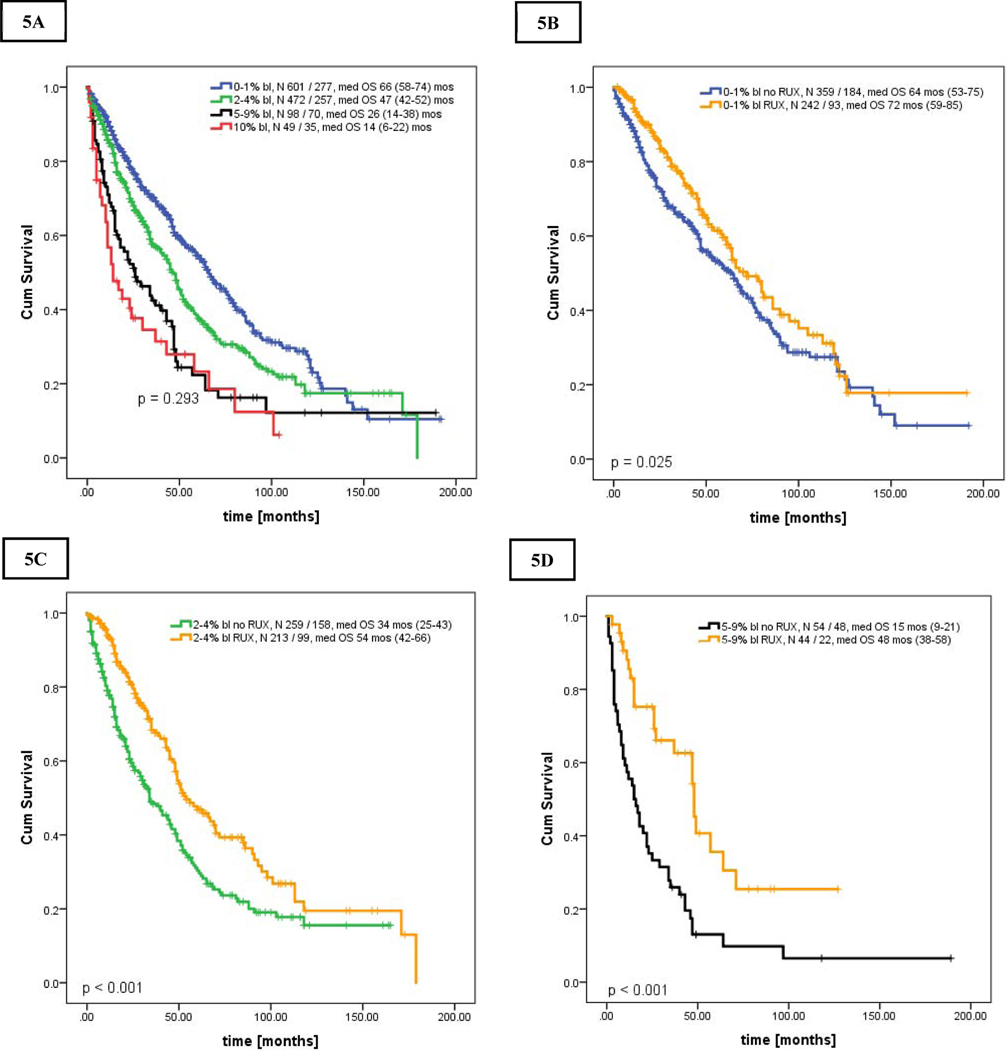
More importantly, these results also indicated that survival of patients with chronic MF treated with RUX was not only superior to patients within the same blast group, but became comparable to patients with lower blast percentage (e.g., patients in CP-1 and CP-2 treated with RUX had similar OS as those in CP and CP-1, respectively, Figures 5A–C, Supplemental Table 5). Censoring for allogeneic SCT revealed similar results (Supplemental Figures 2A–C).
Figures 5.
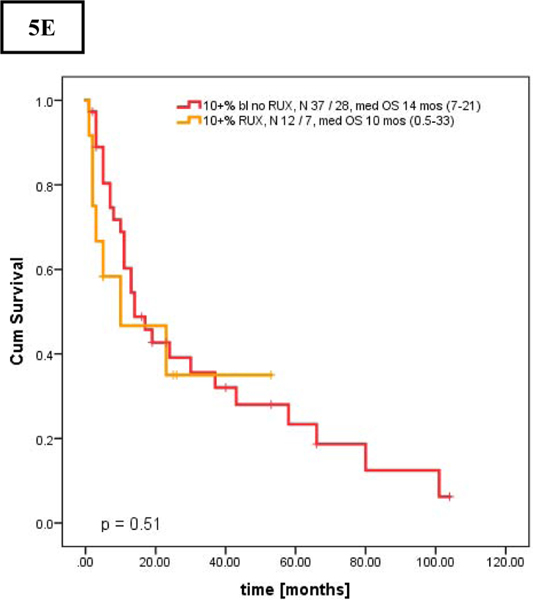
A-E. Kaplan Meier curve showing overall survival in patients who presented after the year of 2000 stratified by bone marrow blasts percentage [A], and overall survival stratified by bone marrow blasts percentage and the use of ruxolitinib [B-E]: [A] Overall survival in all 4 groups, [B] Overall survival of patients in CP, 0–1%, [C] patients in CP-1, 2–4%, [D] patients in CP-2, 5–9%, and [E] patients in AP, 10–19% stratified by the use of ruxolitinib
Sub-analysis in patients presented after the year of 2000 and in newly diagnosed patients
To verify our results and mitigate lead-time bias, we performed additional analyses in patients (follow-up of alive patients for at least 3 months) who presented to our institution after the year of 2000, and in newly diagnosed patients.
Among 1327 patients who presented after the year of 2000, 1220 patients had adequate follow-up: CP (n = 601), CP-1 (n = 472), CP-2 (n = 98) and AP (n = 49) with respective median overall survivals of 66, 47, 26, and 14 months; overall p < 0.001; CP-2 and AP with p=0.293 (Figure 5A). Survival of patients with CP-2 was inferior to those in CP and CP-1 (CP-2 to CP-1: HR 0.63 [95% CI 0.48–0.82]; CP-2 to CP: HR 0.45 [95% CI 0.35–0.59], both p < 0.001]. Similarly, patients in CP, CP-1, and CP-2 treated with RUX had superior OS of 72, 54 and 48 months, respectively, when compared to patients without RUX in the same blasts group (Figures 5B–D, Supplemental Table 6). OS of those with AP with and without RUX were similar (Figure 5E). As observed previously, AML progression rate was the highest in patients in AP, with incidence per 100 person-years of observation of 2.1 (n = 46), 3.4 (n = 49), 8.1 (n = 20), and 20.7 (n = 19) cases for CP, CP-1, CP-2 and AP; respectively (p<0.001 all; CP vs CP-1, p = 0.87).
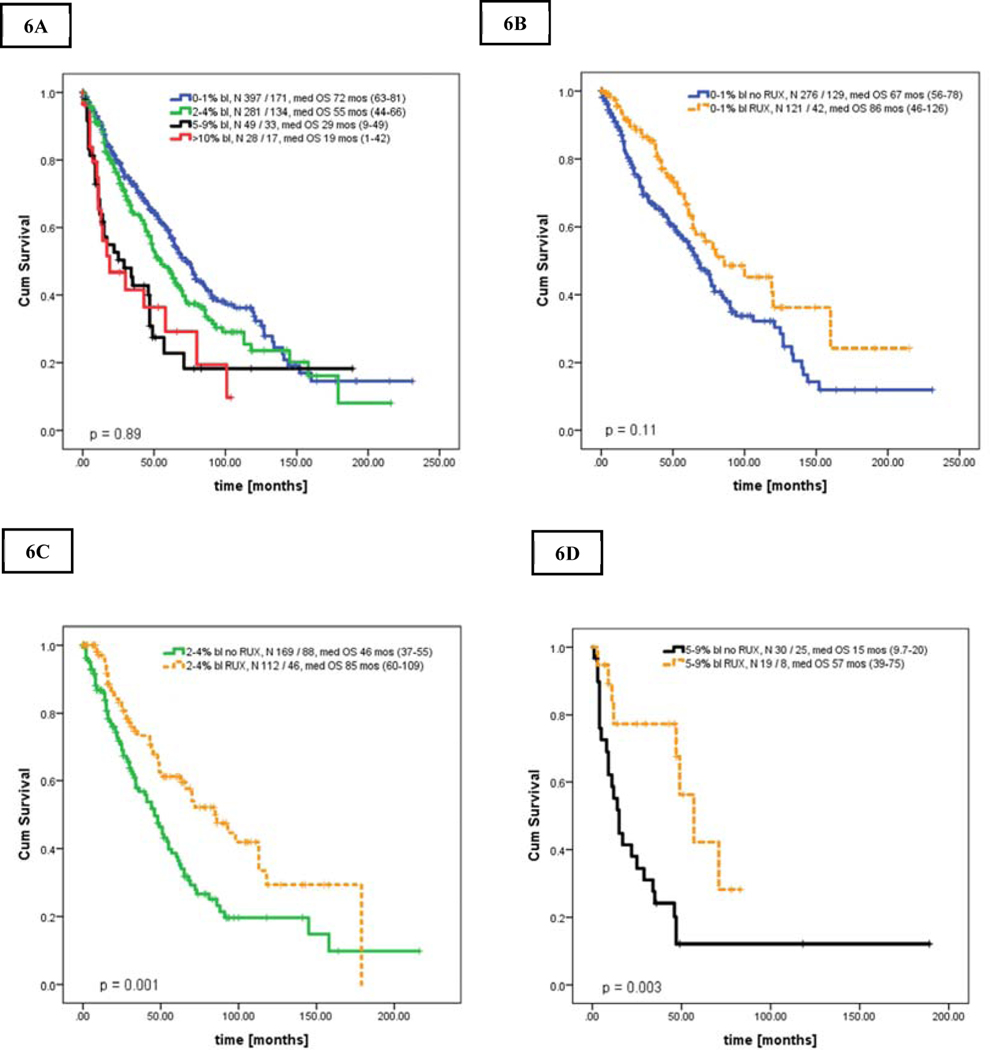
Results for newly diagnosed patients only (n = 755) were almost analogous in all analyses (Figures 6A–E). Median OS in CP, CP-1, CP-2, and AP were of 72, 55, 29, and 19 months, respectively (p<0.001; CP-2 vs AP, p = 0.89). Patients in CP, CP-1 and CP-2 treated with RUX had superior OS of 86, 46, and 57 months, respectively, when compared to patients without RUX in the same blasts group (Figures 6 C–E, Supplemental Table 7).
Figures 6.
A-D. Kaplan Meier curve showing overall survival in newly diagnosed patients stratified by bone marrow blasts percentage [A], and overall survival stratified by bone marrow blasts percentage and the use of ruxolitinib [B-D]: [A] Overall survival in all 4 groups, [B] Overall survival of patients in CP, 0–1%, [C] patients in CP-1, 2–4%, [D] patients in CP-2, 5–9% as stratified by the use of ruxolitinib
Survival results censored for SCT for patients referred after the year of 2000 and for newly diagnosed patients were similar and are summarized in Supplemental Tables 6 and 7.
Discussion:
Patients with myelofibrosis have highly variable prognoses. There are several prognostic scores that can further risk stratify patients with MF 2,3,19,20. Among the poor prognostic factors is the presence of peripheral blasts ≥1%. Patients with ≥10% BM/PB blasts (AP) have an increased risk of progression to AML and inferior overall survival 5; however, even PB blasts as low as 2–3% was shown to confer a worse prognosis 6,8–10. The role of BM blasts in these patients have not been specifically evaluated. In the present study, we evaluated the impact of BM blasts on disease behavior and outcome.
We found that patients with BM blasts of 5–9% have adverse clinical characteristics and overall inferior survival, and might represent similarly unfavorable group as already identified by ≥10% blasts, including our own report 5. This included patients who presented with higher blasts at diagnosis (newly diagnosed) or developed them later (entire cohort), suggesting that increased blasts represent more aggressive disease feature regardless of their appearance during the disease course. We acknowledge that in our entire heterogenous population, where 20% of patients presented after 15 months from diagnosis, we can’t accurately estimate the real impact of BM blasts on the disease specific survival; but we consistently showed it in the newly diagnosed cohort. And although the delayed presentation from diagnosis in these 20% of patients could negatively impact expected survival of patients with higher risk disease; the estimated median survivals of patients with 5–9% blasts were comparable when computed for the entire cohort, for those referred after the year of 2000, and for newly diagnosed patients (22, 26, and 29 months, respectively).
In our present study, progression of MF to AML directly correlated with the blast percentage and was the highest among patients with ≥ 10% blasts. Although patients with 5–9% BM blasts had lower incidence of progression to AML than those with ≥ 10% blasts (7.7 vs 24.7 cases per person-years observation), it was still twice as high as in those with < 5% BM blasts (~3 cases per person-year). Given the inferior survival, yet lower rate of transformation to AML in patients with 5–9% BM blasts compared to those with ≥ 10% blasts, we assume that overall progression of the disease, frequently associated with poor quality of life and significant symptom burden, likely contributes to the dismal outcomes of these patients.
Therefore, the use of ruxolitinib in these patients to improve their quality of life and, as shown in our study, also their overall survival, is crucial in daily practice. To the best of our knowledge, this is the first attempt to evaluate the possible effect of ruxolitinib on survival in this specific group of patients harboring worse prognosis than those in “true” chronic phase. With the use of ruxolitinib, the survival of patients with 5–9% BM blasts not only doubled when compared to patients within the same group who did not receive ruxolitinib, it became comparable to the survival of patients with lower blast percentages, who generally are known to have better outcome. Limitations of our dataset include noting the inherent heterogeneity in a retrospective chart review, the tertiary setting of our institution, the lack of availability of deep molecular sequencing for all patients and various ruxolitinib regimens started at different time points during the disease course. Therefore, the current analysis did not allow us to explicitly evaluate the “true” impact of ruxolitinib on disease specific survival, regardless of the role of BM blasts. Still, it allowed us to recognize another high-risk population of patients, who had observed survival advantage with ruxolitinib exposure. It remains to be determined whether this was an effect of ruxolitinib or simple disease behavior. Despite this limitation, we believe that our observation is clinically meaningful as there has not been any other conventional approach shown to significantly improve overall survival. The results herein might help to identify patients whose disease is evolving, and currently available therapy, including ruxolitinib, might allow them to undergo successful allogeneic SCT to optimize their outcomes. Early aggressive therapeutic intervention in these patients may also slow the disease progression to AML, which has a dismal prognosis and very limited treatment options 21.
Despite our encouraging findings, there is a noticeable pattern of shorter duration of benefit from ruxolitinib in these patients, and still significant AML transformation risk, implying that patients with higher blasts could benefit more from a combinatorial therapy. At the present time, there is an appealing increase of clinical trials exploring various combinational approaches, and these patients should be always encouraged to enroll and explore these options.
Conclusion:
To the best of our knowledge, this is the first report on the role of bone marrow blasts on the outcome of patients with myelofibrosis. We found that patients with 5–9% blasts represent a high-risk group of patients and should receive appropriate and timely attention to improve upon their outcome. While they still benefit from ruxolitinib therapy, there is an urgent need for novel treatment strategies that could halt disease progression.
Supplementary Material
Figures 3.
A-C. Kaplan Meier curve showing overall survival of all patients stratified by bone marrow blasts percentage and the use of ruxolitinib: [A] patients in CP, 0–1% BM blasts, [B] patients in CP-1, 2–4% BM blasts, [C] patients in CP-2, 5–9% BM blasts
Clinical Practice Points:
The role of bone marrow blasts on outcome of patients with myelofibrosis is ill-defined.
Patients with 5–9% BM blasts at diagnosis or at any time during their disease course had comparable disease features and outcome to patients with 10–19% blasts.
Patients with < 10% BM blasts who received JAK2 inhibitor ruxolitinib at any point during their disease course had superior survival when compared to patients without ruxolitinib.
Patients with 10–19% blasts showed no survival benefit from ruxolitinib therapy.
Progression to acute leukemia occurred most frequently in patients with 10–19% blasts, but the incidence in patients with 5–9% blasts was twice as high as in those with < 5% blasts.
Novel combinational and rationally designed therapies are urgently needed for high risk patients with myelofibrosis.
Acknowledgments
Funding Source:
This work was supported in part by a Cancer Center Support Grant to MD Anderson Cancer Center (P30 CA016672) from the National Cancer Institute
LM; ZE; LZ; SP: None. HK: Research Funding from Amgen, ARIAD, Bristol-Myers Squibb, Delta-Fly Pharma, Novartis, Pfizer. SV: Research Funding from Incyte. PB: Honoraria and Research Funding from Incyte, Celgene, CTI BioPharma, Blueprint and Kartos Therapeutics. Research Funding from Constellation Pharmaceuticals, Promedior, NS Pharma, Astellas and Pfizer. ND: Advisory role for Daiichi-Sankyo, BMS, Astellas, Abbvie, Genentech, Immunogen, Pfizer, Amgen, Forty-Seven, Novartis. Research funds from BMS, Pfizer, Forty-Seven, Genentech, Abbvie, Astellas, Daiichi-Sankyo, Incyte, Novimmune, Immunogen. NP: Consulting/honorarium: Celgene, Stemline, Incyte Corporation, Novartis, MustangBio, Roche Diagnostics, and LFB. Research funding/clinical trials support from Stemline, Novartis, Abbvie, Samus, Cellectis, Plexxikon, Daiichi-Sankyo, Affymetrix, and SagerStrong Foundation.
Footnotes
Conflict of Interest Disclosures:
Publisher's Disclaimer: This is a PDF file of an unedited manuscript that has been accepted for publication. As a service to our customers we are providing this early version of the manuscript. The manuscript will undergo copyediting, typesetting, and review of the resulting proof before it is published in its final form. Please note that during the production process errors may be discovered which could affect the content, and all legal disclaimers that apply to the journal pertain.
References:
- 1.Reilly JT, McMullin MF, Beer PA, et al. Guideline for the diagnosis and management of myelofibrosis. Br J Haematol. 2012;158(4):453–471. [DOI] [PubMed] [Google Scholar]
- 2.Cervantes F, Dupriez B, Pereira A, et al. New prognostic scoring system for primary myelofibrosis based on a study of the International Working Group for Myelofibrosis Research and Treatment. Blood. 2009;113(13):2895–2901. [DOI] [PubMed] [Google Scholar]
- 3.Passamonti F, Cervantes F, Vannucchi AM, et al. A dynamic prognostic model to predict survival in primary myelofibrosis: a study by the IWG-MRT (International Working Group for Myeloproliferative Neoplasms Research and Treatment). Blood. 2010;115(9):1703–1708. [DOI] [PubMed] [Google Scholar]
- 4.Passamonti F, Cervantes F, Vannucchi AM, et al. Dynamic International Prognostic Scoring System (DIPSS) predicts progression to acute myeloid leukemia in primary myelofibrosis. Blood. 2010;116(15):2857–2858. [DOI] [PubMed] [Google Scholar]
- 5.Quintas-Cardama A, Kantarjian H, Pierce S, Cortes J, Verstovsek S. Prognostic model to identify patients with myelofibrosis at the highest risk of transformation to acute myeloid leukemia. Clinical lymphoma, myeloma & leukemia. 2013;13(3):315–318.e312. [DOI] [PMC free article] [PubMed] [Google Scholar]
- 6.Rago A, Latagliata R, Montanaro M, et al. Hemoglobin levels and circulating blasts are two easily evaluable diagnostic parameters highly predictive of leukemic transformation in primary myelofibrosis. Leukemia research. 2015;39(3):314–317. [DOI] [PubMed] [Google Scholar]
- 7.Huang J, Li CY, Mesa RA, et al. Risk factors for leukemic transformation in patients with primary myelofibrosis. Cancer. 2008;112(12):2726–2732. [DOI] [PubMed] [Google Scholar]
- 8.Guglielmelli P, Lasho TL, Rotunno G, et al. MIPSS70: Mutation-Enhanced International Prognostic Score System for Transplantation-Age Patients With Primary Myelofibrosis. Journal of clinical oncology : official journal of the American Society of Clinical Oncology. 2018;36(4):310–318. [DOI] [PubMed] [Google Scholar]
- 9.Mora B GP, Rumi E, et al. Risk factors and outcome of acute myeloid leukemia secondary to post-polycythemia vera and post-essential thombocythemia myelofibrosis: an analysis of the MYSEC cohort. European Haematology Association. 2019;Abstract, PS1458. [Google Scholar]
- 10.Vallapureddy RR, Mudireddy M, Penna D, et al. Leukemic transformation among 1306 patients with primary myelofibrosis: risk factors and development of a predictive model. Blood Cancer Journal. 2019;9(2):12. [DOI] [PMC free article] [PubMed] [Google Scholar]
- 11.Arber DA, Orazi A, Hasserjian R, et al. The 2016 revision to the World Health Organization classification of myeloid neoplasms and acute leukemia. Blood. 2016;127(20):2391–2405. [DOI] [PubMed] [Google Scholar]
- 12.Verstovsek S, Kantarjian H, Mesa RA, et al. Safety and efficacy of INCB018424, a JAK1 and JAK2 inhibitor, in myelofibrosis. The New England journal of medicine. 2010;363(12):1117–1127. [DOI] [PMC free article] [PubMed] [Google Scholar]
- 13.Harrison C, Kiladjian JJ, Al-Ali HK, et al. JAK inhibition with ruxolitinib versus best available therapy for myelofibrosis. The New England journal of medicine. 2012;366(9):787–798. [DOI] [PubMed] [Google Scholar]
- 14.Verstovsek S, Mesa RA, Gotlib J, et al. Long-term treatment with ruxolitinib for patients with myelofibrosis: 5-year update from the randomized, double-blind, placebo-controlled, phase 3 COMFORT-I trial. Journal of hematology & oncology. 2017;10(1):55. [DOI] [PMC free article] [PubMed] [Google Scholar]
- 15.Harrison CN, Vannucchi AM, Kiladjian JJ, et al. Long-term findings from COMFORTII, a phase 3 study of ruxolitinib vs best available therapy for myelofibrosis. Leukemia. 2016;30(8):1701–1707. [DOI] [PMC free article] [PubMed] [Google Scholar]
- 16.Barosi G, Mesa RA, Thiele J, et al. Proposed criteria for the diagnosis of post-polycythemia vera and post-essential thrombocythemia myelofibrosis: a consensus statement from the International Working Group for Myelofibrosis Research and Treatment. Leukemia. 2008;22(2):437–438. [DOI] [PubMed] [Google Scholar]
- 17.Caramazza D, Begna KH, Gangat N, et al. Refined cytogenetic-risk categorization for overall and leukemia-free survival in primary myelofibrosis: a single center study of 433 patients. Leukemia. 2011;25(1):82–88. [DOI] [PMC free article] [PubMed] [Google Scholar]
- 18.Luthra R, Patel KP, Reddy NG, et al. Next-generation sequencing-based multigene mutational screening for acute myeloid leukemia using MiSeq: applicability for diagnostics and disease monitoring. Haematologica. 2014;99(3):465–473. [DOI] [PMC free article] [PubMed] [Google Scholar]
- 19.Gangat N, Caramazza D, Vaidya R, et al. DIPSS plus: a refined Dynamic International Prognostic Scoring System for primary myelofibrosis that incorporates prognostic information from karyotype, platelet count, and transfusion status. Journal of clinical oncology : official journal of the American Society of Clinical Oncology. 2011;29(4):392–397. [DOI] [PubMed] [Google Scholar]
- 20.Vannucchi AM GP, Rotunno G, et al. Mutation-enhanced International Prognostic Scoring System (MIPSS) for primary myelofibrosis: an AGIMM & IWG-MRT project. Blood 2014. 124:405. [Google Scholar]
- 21.Mascarenhas J. A Concise Update on Risk Factors, Therapy, and Outcome of Leukemic Transformation of Myeloproliferative Neoplasms. Clinical lymphoma, myeloma & leukemia. 2016;16 Suppl:S124–129. [DOI] [PubMed] [Google Scholar]
Associated Data
This section collects any data citations, data availability statements, or supplementary materials included in this article.


