

Abstract
Background:
Guidelines for Sinus of Valsalva-thoracic aortic aneurysms (SOV-TAA) in Marfan syndrome recommend size-based criteria for elective surgical repair. Biomechanics may provide a better prediction of dissection risk than diameter. Our aim was to determine magnitudes of wall stress in the aortic root of Marfan patients using finite element analyses.
Methods:
Forty-six Marfan patients underwent patient-specific 3D SOV-TAA geometry reconstruction using imaging data. Finite element analyses were performed to determine wall stress distributions at SOV, sinotubular junction (STJ), and ascending aorta (AscAo) at systole.
Results:
Peak circumferential stresses were 432.8±111kPa, 408.1±88.3kPa, and 321.9±83.8kPa at the SOV, STJ, and AscAo, respectively with significant differences between SOV and AscAo (p<3.08E-07), and STJ and AscAo (p<2.26E-06). Peak longitudinal wall stresses were 352±73.9kPa, 277.5±89.5kPa, and 200.6±81kPa at SOV, STJ, and AscAo, respectively with significant differences between SOV and STJ (p< 6.01E-06), SOV and AscAo (p< 9.79E-13), and STJ and AscAo (p< 3.34E-07). Diameter was not correlated to wall stresses. Comparison of wall stresses in aneurysm <5cm vs ≥5cm and <4.5cm vs ≥4.5 showed no significant differences in wall stresses in the circumferential or longitudinal direction.
Conclusions:
Peak wall stresses in Marfan SOV-TAA were greatest in SOV than STJ than AscAo. Diameter was poorly correlated to peak stresses such that current guidelines with 5cm cutoff had significant overlap in peak stresses in patients with <5cm vs ≥5cm. Use of patient-specific Marfan aneurysm models may identify patients with high wall stresses and small aneurysms who could benefit from earlier surgical repair to prevent aortic dissection.
Keywords: Marfan syndrome, aortic aneurysm, biomechanics
Introduction
Marfan syndrome is an autosomal dominant hereditary connective tissue disorder caused by various mutations in the gene encoding fibrillin-1 (FBN1) which forms microfibrils in the extracellular matrix(1). Marfan syndrome affects 1 per 3000 to 5000 individuals(2). Marfan patients experience cardiovascular, ocular, and skeletal manifestations leading to disproportionate growth in the long bones(3). Early mortality often occurs due to the associated aortic aneurysm, which can result in life-threatening complications such as aortic dissection or rupture(3-5). Marfan aortic aneurysms are characterized by predilection for progressive enlargement of the aortic root with development of Sinus of Valsalva-thoracic aortic aneurysm (SOV-TAA).
Surveillance of Marfan patients’ SOV-TAA involves annual imaging to assess maximum diameter for risk of aortic dissection. More frequent imaging may be necessary depending on the aneurysm growth rate. To lower the risk of dissection and rupture, patients often undergo elective surgical repair with either valve-sparing aortic root replacement or valved conduit aortic root replacement(6, 7). Early aortic root replacement in Marfan syndrome is critical as the 30-day mortality of elective repair was 1.5% compared to the 11.7% mortality of emergency repair(6). Indications for elective surgical treatment for Marfan patients include aneurysm diameters ≥5.0cm, or ≥4.5 cm with family history of aortic dissection and/or aortic size increase ≥5mm/year, while indication is ≥5.5cm for patients without connective tissue disorders(8, 9). Unfortunately, 15% of patients with Marfan syndrome underwent dissection at a diameter <5.0cm(5, 6, 10-12). Thus, improvements in patient-specific criteria are needed to accurately predict risk of dissection.
From a biomechanics perspective, dissection could occur when wall stress exceeds wall strength. The Law of LaPlace relates wall stress as proportional to radius, so the greater the radius of the aorta, the higher stresses it experiences. The rationale for using a diameter-based criterion for predicting dissection risk originates from this understanding of LaPlace’s law(13). However, this law applies to cylindrical geometry and oversimplifies wall stress for complex three-dimensional (3D) aneurysmal geometry. As such, diameter does not closely correlate to wall stresses for ascending thoracic aortic aneurysms without connective tissue disorders(14-16); however, correlation of diameter with wall stresses is unknown for Marfan syndrome. Unfortunately, there are no means to directly measure wall stress or wall strength in vivo, but finite element analysis (FEA) can accurately quantify mechanical stresses through computational modeling. FEA is a validated computational method which can assess failure modes and determine wall stresses using patient-specific geometry, material properties, and hemodynamic loading conditions. As such, FEA-calculated wall stresses may better predict dissection than diameter. The aim of this study was to determine regional wall stresses in the aortic root of Marfan patients in relationship to diameter.
Materials and Methods
Study Participants
We analyzed 46 patients with Marfan syndrome and ascending thoracic aortic aneurysm (aTAA) ≥4.0cm, located primarily in the aortic root. Adult Marfan patients 18 years and older with preoperative magnetic resonance imaging (MRI) or computed tomography (CT) were obtained from the Johns Hopkins Hospital (JHH). This study was approved by the Committee on Human Research at University of California San Francisco Medical Center and at JHH and the Institutional Review Board at San Francisco Veterans Affairs Medical Center. Table 1 summarizes patient clinical profiles. Pre-operative CT or MRI images were collected from the JHH radiologic database and de-identified.
Table 1.
Demographics of Marfan patients
| Demographics (n=46) | |
|---|---|
| Sinus Diameter (cm) | 4.55 (4.22-4.95) |
| STJ Diameter (cm) | 3.48 (3.13-3.74) |
| AscAo Diameter (cm) | 3.05 (2.72-3.45) |
| Age (years) | 47.5 ± 14.2 |
| Sex | |
| Male (n) | 37 (80.4%) |
| Smoking History (n) | 7 (15.2%) |
| Medical Comorbidities (n) | |
| Hypertension | 20 (43.5%) |
| Diabetes | 4 (8.70%) |
| Study Type | |
| CT | 40 (87.0%) |
| MRI | 6 (13.0%) |
Diameter is presented as median (25%-75% interquartile range). Sinus diameter is measured by commissure trigone to opposing mid-leaflet sinus. Age is presented as mean ± standard deviation.
Development of the Finite Element Models
De-identified CT and MRI scans were exported as Digital Imaging and Communications in Medicine files and imported into MeVisLab (an open-source surface reconstruction software for image segmentation) to reconstruct 3-dimensional (3D) geometries of left ventricular outflow tract (LVOT), aortic annulus, sinuses of Valsalva (SOV), sinotubular junction (STJ), ascending aorta (AscAo), aortic arch, and a portion of descending thoracic aorta (DTA). Segmented data were imported and refined in GeoMagic for 3D surface reconstruction with thickness from Marfan tissue(2, 17). Truegrid (XYZ Scientific Applications, Inc., Livermore, CA) was used to generate a volumetric mesh of 10,080 hexahedral elements (Figure 1). Convergence studies were performed to determine optimal mesh density. The mesh was refined until the stress results varied <1% for two subsequent mesh refinements. Ultimately, three elements were used across the vessel wall thickness for each model. These patient-specific 3D meshes were imported into LS-DYNA (LSTC Inc, Livermore, CA), a commercially available FE software package for pressure loading simulations and data analysis. Material properties from published bi-axial stretch testing on surgically resected Marfan surgical aneurysm specimens were used(17).
Figure 1.

Workflow from radiologic images to contour geometry to finite element mesh and simulation analysis.
Zero-Pressure Geometry
CTA images used to reconstruct 3D aTAA geometry under in vivo physiologic blood pressure conditions were considered prestressed. We and others have demonstrated the importance of accounting for this prestress to accurately determine in vivo wall stress(18, 19). We used a modified updated Lagrangian method to calculate prestress(20).
Collagen-Embedded Hyperelastic Material Model
The Marfan aortic wall was modeled as incompressible hyperelastic material composed of noncollagen matrix reinforced with dispersed collagen fibers. Total strain energy density function for the aneurysm was derived from the composite of both strain energy density function of ground matrix and that of collagen fibers as:
| (1) |
where is an isochoric part of the right Cauchy-Green deformation tensor C and J is Jacobian of the deformation gradient, ψ(J) enforcing the incompressibility of aortic tissue. Ground matrix was assumed to be isotropic and to have neoHookean-like strain energy density function:
| (2) |
where I1() is the first invariant of and a is a material constant. We assumed 2 collagen fibers distributed symmetrically along the circumferential direction with dispersed collagen fibers:
| (3) |
where is an invariant that reflects the impact of each fiber family deformation on strain energy. k1 and k2 are material parameters determined by previously conducted bi-axial stretch testing in the literature and by averaging the stress-strain curves for the young(<40) and old(>40 years old) populations (Table 2).(17)
Table 2.
Material Properties
| Material Parameters | k1 | k2 | Fiber angle (rad) |
|---|---|---|---|
| Marfan | 0.77 | 4.21 | 33.06 |
Finite Element (FE) Simulations
FE simulations were performed using LS-DYNA with specified collagen-embedded hyperelastic material model (Eq. 1). Three-dimensional brick elements were used to reconstruct aTAA wall. Aortic wall thickness, derived from literature Marfan aneurysm experimental studies(17), was set at 1.8mm uniformly throughout each model. Given that the aortic root is a dynamic structure, translational motion was fixed proximally at LVOT, 20mm below the annulus, to allow aortic root motion during the cardiac cycle and fixed distally at DTA to account for the physiologic effect of the ligamentum arteriosum, without constraints to rotational motion. Simulation was performed by applying time-dependent arterial pressure to aortic lumen, mimicking normal cardiac cycles. Physiologic blood pressure was assumed to be 120/80 for all patients in order to consistently compare wall stress magnitudes at the same pressure. Simulated cardiac cycles had a duration of 800ms, including a 300ms increase from diastolic to systolic pressure followed by a 500ms decrease back to diastolic pressure.
Statistical Analysis
Mechanical stresses on the aortic wall due to pressure loading were calculated. Analyses were performed utilizing 99th-percentile wall stresses (hereafter referred to as peak wall stresses) to avoid artifacts arising from inhomogeneities in the mesh, as previously described(14-16). Peak wall stresses in the circumferential and longitudinal direction were calculated at the SOV, STJ, and AscAo using LS-DYNA post-processing software. Continuous measurements of patient age and wall stresses are presented as mean±SD, while diameters are presented as median and (25%-75%) interquartile range. Categorical measurements are presented as numbers and percentages. The data were tested for normal distribution using the Shapiro-Wilk test. Peak wall stresses between groups were compared at different regions using unpaired Student’s t-tests. Spearman rank correlation coefficients were used for the correlation between wall stresses and diameter, indexed SOV diameter/body surface area (BSA), and aneurysm cross-sectional area/height ratio. Continuous and categorical variables were compared using Mann-Whitney U-test. A p-value <0.05 was considered statistically significant. Statistical analyses were performed using R (R 3.6 www.r-project.org).
Results
Patient Demographics
Marfan patients in this study with SOV-TAA had a mean age of 47.5 years, and 80.4% were male (Table 1). Median sinus diameter, 4.55cm (4.23, 4.95), was greater than STJ and AscAo diameter, 3.48cm (3.13, 3.74), and 3.05cm (2.72, 3.45), respectively. There were 27 patients with SOV diameter ≥4.5cm, 11 of whom had SOV diameter ≥5.0cm.
Marfan Aneurysm Wall Stresses by Region
Marfan SOV-TAA peak circumferential stresses were 432.8±111kPa, 408.1±88.3kPa, and 321.9±83.8kPa at the SOV, STJ, and AscAo, respectively at systolic pressure (Figure 2a). Peak circumferential stresses were significantly different between SOV and AscAo (p<3.08E-07), and STJ and AscAo (p<2.26E-06). Peak circumferential stresses were not significantly different between SOV and STJ (p=0.3). Peak longitudinal wall stresses were 352±73.9kPa, 277.5±89.5kPa, and 200.6±81kPa at SOV, STJ, and AscAo, respectively (Figure 2b). Peak longitudinal stresses were significantly different between SOV and STJ (p< 6.01E-06), SOV and AscAo (p< 9.79E-13), and STJ and AscAo (p< 3.34E-07). Peak wall stresses were significantly greater in the circumferential than longitudinal direction in the SOV (p<1.17E-4), STJ (p< 9.79E-11), and AscAo (p< 3.76E-12) at systolic pressure.
Figure 2.
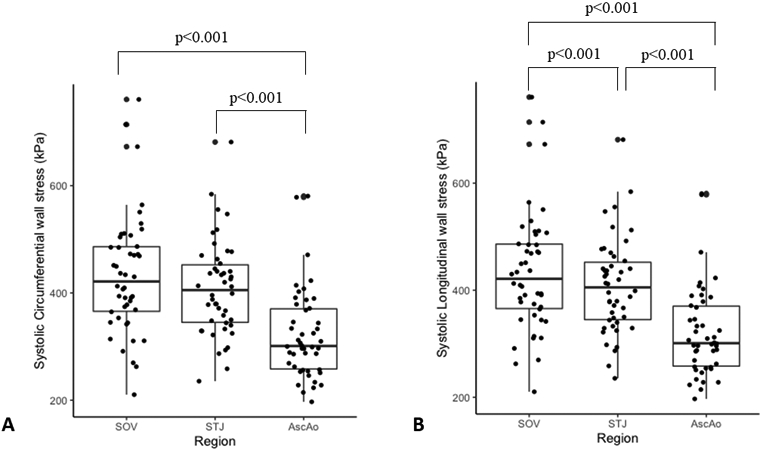
A) Peak circumferential wall stresses at SOV, STJ, and Ascending aorta (kPa). B) Peak longitudinal wall stresses at SOV, STJ, and Ascending aorta (kPa).
SOV-TAA Wall Stress Correlation with Diameter
Maximum aortic diameters at each region, SOV, STJ, and AscAo, were found not to correlate with corresponding peak wall stresses in a linear relationship. SOV diameter showed no statistically significant correlation with peak circumferential (r=−0.006, p=1.0) (Figure 3a) or longitudinal SOV wall stresses (r=0.053, p=0.7) (Figure 3b). STJ diameter showed no statistically significant correlation with either peak circumferential (r=0.202, p=0.2) (Figures 4a) or longitudinal STJ wall stresses (r=0.083, p=0.6) (Figure 4b). Similarly, AscAo diameter showed no statistically significant correlation with either peak circumferential (r=0.127, p=0.4) (Figure 5a) or longitudinal AscAo stresses (r=0.064, p=0.7) (Figure 5b).
Figure 3.

A) Relationship between peak SOV circumferential wall stresses (kPa) and SOV diameter. B) Relationship between peak SOV longitudinal wall stresses (kPa) and SOV diameter.
Figure 4.

A) Relationship between peak STJ circumferential wall stresses (kPa) and STJ diameter. B) Relationship between peak STJ longitudinal wall stresses (kPa) and STJ diameter.
Figure 5.

A) Relationship between peak AscAo circumferential wall stresses (kPa) and AscAo diameter. B) Relationship between peak AscAo longitudinal wall stresses (kPa) and AscAo diameter.
Wall Stresses based upon Diameter Cut-offs
Wall stresses between Marfan patients with maximum diameter <4.5cm vs. ≥4.5cm were compared based upon guidelines for Marfan patients with family history of dissection. Peak SOV, STJ, or AscAo circumferential wall stresses were not significantly greater when maximum SOV diameter was ≥4.5cm vs. <4.5cm (Table 3). Similarly, peak SOV and STJ longitudinal wall stresses were not significantly greater when maximum SOV diameter was ≥4.5cm than <4.5cm. However, peak AscAo longitudinal wall stresses were significantly greater when SOV diameter was ≥4.5cm than when SOV diameter was <4.5cm (p<0.04). Wall stresses between Marfan patients with SOV diameter <5.0cm and ≥5.0cm were also compared based on present guidelines for surgical repair. No significant differences in peak circumferential or longitudinal wall stresses were found at the SOV, STJ, or AscAo when comparing maximum aneurysm diameters <5.0cm vs. ≥5.0cm (Table 4).
Table 3.
Comparison of peak circumferential and longitudinal wall stresses at sinus, STJ, AscAo for sinus diameter cutoff of <4.5cm and ≥4.5cm.
| Location | SOV | STJ | AscAo | ||||||
|---|---|---|---|---|---|---|---|---|---|
| Wall Stresses (kPa) |
<4.5cm | ≥4.5cm | p value |
<4.5cm | ≥4.5cm | p value |
<4.5cm | ≥4.5cm | p value |
| Circumferential | 434.3 ± 100.7 | 431.7 ± 119.6 | 0.9 | 391.3 ± 79.5 | 420.0 ± 93.7 | 0.4 | 294.7 ± 60.0 | 341.0 ± 93.5 | 0.08 |
| Longitudinal | 346.5 ± 59.9 | 355.9± 83.2 |
0.7 | 255.6± 68.86 |
293.0± 99.97 | 0.3 | 172.0± 37.8 |
220.7± 96.7 |
0.04 |
Table 4.
Comparison of peak circumferential and longitudinal wall stresses at sinus, STJ, AscAo at sinus diameter cutoff of <5cm and ≥5cm.
| Location | SOV | STJ | AscAo | ||||||
|---|---|---|---|---|---|---|---|---|---|
| Wall Stresses (kPa) |
<5cm | ≥5cm | p value |
<5cm | ≥5cm | p value |
<5cm | ≥5cm | p value |
| Circumferential | 443.8 ± 112.0 | 397.6 ± 104.9 | 0.4 | 415.9 ± 95.6 | 383.6 ± 56.4 | 0.4 | 324.0 ± 89.0 | 315.2 ± 67.9 | 0.9 |
| Longitudinal | 359.9 ± 71.7 | 326.9± 78.4 | 0.3 | 281.9 ± 94.4 | 263.6 ± 74.2 | 0.7 | 201.6 ± 89.6 | 197.3 ± 47.2 | 0.7 |
SOV-TAA Wall Stresses Relationship to Indexed SOV Diameter/BSA and Aneurysm Cross-sectional Area/Height Ratio
No statistically significant correlation was found between the indexed SOV diameter/BSA and peak circumferential (r=0.02, p=0.89) or longitudinal (r=0.02, p=0.90) wall stresses in the sinuses. Wall stresses between Marfan patients with aneurysm cross-sectional area/height ratio <10 and ≥10cm2/m were compared. We found that peak SOV circumferential wall stresses were 419.6±100.6kPa vs. 438.5±126.6kPa for cross-sectional area ≥10 and <10cm2/m, respectively (p=0.8), and peak SOV longitudinal wall stresses were 351.9±72.7kPa vs 347.3±77.2kPa for cross-sectional area ≥10 vs <10cm2/m, respectively (p=0.6). Peak STJ wall stresses were 414.2±76.3kPa vs. 385.0±83.2kPa, p=0.2, circumferentially, and 279.7±83.3kPa vs 265.1±80.1kPa, p=0.6, longitudinally for cross-sectional area ≥10 vs <10cm2/m, respectively. Peak AscAo wall stresses were 330.0±81.3kPa vs. 297.8±66.2kPa, p=0.1, circumferentially and 212.9±93.2kPa vs 173.8±42.0kPa, p=0.1, longitudinally for cross-sectional area ≥10 vs <10cm2/m, respectively.
Comment
Aortic Size and Wall Stresses
The American College of Cardiology/American Heart Association last updated their guidelines in 2010 for management of thoracic aortic disease(1). Regarding imaging, patients with connective tissue disorders were recommended to have an echocardiogram at time of diagnosis to determine diameter of aortic root and ascending aorta with follow-up imaging 6 months later to determine rate of enlargement or annually if the diameter was stable. If the maximal aortic diameter was ≥4.5cm, more frequent imaging was to be considered. Since echocardiogram does not provide coordinates for 3D geometry reconstruction, patient selection from the Marfan database at Johns Hopkins Hospital for this study relied on those with good image quality on available CT or MRI studies.
Surgical repair for Marfan patients is indicated at an aortic diameter of ≥5.0cm. For patients that are pregnant, have a family history of aortic dissection at diameters <5.0cm, or have diameter growth of ≥0.5cm/year, surgery is indicated at <5.0cm. However, these recommendations reflect level C evidence, suggesting more research is needed to improve and expand upon these guidelines. Furthermore, 15% of Marfan patients had a dissection at a size <5.0cm. Because of the conflicting data regarding risks of dissection in Marfan patients, generating patient-specific wall stress may better inform management.
In this study, we demonstrated significantly greater peak wall stresses circumferentially than longitudinally. Peak circumferential or longitudinal wall stresses in each region, sinuses, sinotubular junction, and ascending aorta did not correlate with corresponding diameters in those regions. Using the guideline cutoff of 5.0cm, there were no significant differences in wall stresses in patients <5.0cm and ≥5.0cm in the SOV, STJ, and AscAo either circumferentially or longitudinally. In this study, we also examined the relationship between the indexed SOV diameter/BSA and aneurysm cross-sectional area/height ratio to peak circumferential and longitudinal wall stresses in the sinuses. No significant correlation was found between the indexed SOV diameter/BSA and peak circumferential or longitudinal SOV wall stresses. In addition, no significant differences in peak circumferential or longitudinal wall stresses in the sinuses were found based upon the cutoff of cross-sectional area/height of 10cm2/m. Thus, diameter and other indices were not an accurate reflection of Marfan wall stresses and determining a wall stress threshold for surgery may be a better means to stratify patients with low vs high risk of aneurysm complications. While wall stress has not been shown to correlate with diameter, it is possible that wall strength does, if increased diameter correlated with tissue weakness. In that case, diameter may be reflective of that aspect of the wall stress: wall strength ratio in the estimation of dissection risk.
Aortic Dissection and Wall Stresses:Wall Strength
Aortic dissection can be thought of as a mechanical process, which can occur when the ratio of aneurysm wall strength to wall stress allows wall stress to exceed wall strength. While there are other factors that play roles in the pathogenesis of dissection, patient-specific models of wall stresses could aid in predicting risk of dissection at physiologic blood pressures or hypertensive crises when these stress levels exceed tissue defined wall strength. Patient-specific computational aTAA models have facilitated understanding of aneurysm biomechanics in patients with bicuspid (BAV) vs tricuspid aortic valves (TAV) (14, 16), but such models are limited for patients with Marfan’s syndrome(21-23). This study analyzed peak wall stresses longitudinally and circumferentially at various regions of the aortic root in Marfan patients. To date, this is the largest study analyzing wall stresses of Marfan aTAA using computational models and FEA analyses. We demonstrated that the highest wall stresses occurred at the sinuses, followed by sinotubular junction, and were lowest in the ascending aorta. Thus, peak wall stresses were concentrated in the proximal aortic root, which correlates in location with the site of aneurysmal dilatation in Marfan syndrome.
Circumferential wall stresses in Marfan patients were less in STJ than sinuses. In contrast, circumferential wall stresses in TAV-aTAA without connective tissue disorder or BAV-aTAA were greater in STJ region than SOV(14, 15). Magnitudes of peak circumferential stresses were also larger in STJ of BAV and TAV-aTAA previously studied than in STJ of these Marfan aTAA. The overall differences in the ratio of STJ to sinus circumferential wall stresses in Marfan vs non-Marfan aTAAs likely reflect the differences in overall geometry, where Marfan aneurysms typically have the larger pear-shaped sinuses compared to geometries of our prior TAV- and BAV-aTAA without significant root enlargement.
Sparse data exists regarding the failure properties of Marfan aTAA, which is limited to failure stresses in the circumferential direction and ranged from 630kPa in older Marfan patients >40 to 1200kPa in younger Marfan patients <40(17). In our study, 3 patients had circumferential stresses >600kPa which would have put them at risk for possible dissection. In comparison, mean tensile strength in circumferential direction for TAV-aTAA at failure was 961kPa, while for BAV-aTAA was 1656kPa(24), suggesting Marfan tissue is weaker circumferentially than its BAV counterpart and within the range of its TAV counterpart. Unfortunately, only circumferential tensile strength was evaluated in Marfan tissue and not longitudinal tensile strength(17). Studies of non-Marfan aTAA failure have shown that ultimate tensile stresses at failure were much greater circumferentially than longitudinally(24). Thus, aneurysm tissue is weaker in the longitudinal direction and a longitudinal break could result in the typical transverse tear seen in acute dissection(25). Longitudinal wall stresses in our Marfan aTAA were greatest in the sinuses, followed by STJ, and AscAo. Future studies will be required to determine tensile stress at failure in the longitudinal direction of Marfan aTAA to serve as a benchmark by which to compare patient-specific longitudinal wall stresses by FEA.
Acute dissection still occurs in 15% of Marfan patients with aTAA diameters smaller than the surgical size thresholds for intervention. Patient-specific biomechanical FEA analysis may provide a more reliable risk stratification tool than the current diameter-based approach. Applying FEA in the clinical setting is highly feasible with advances in computational power and efficiency as well as biomechanical expertise. With a dedicated biomechanical team with expertise, the turnaround time for patient-specific biomechanics analysis could be reduced to less than 1 day, which gives ample time for navigating discussions regarding elective surgical repair. If in-house expertise does not exist, it may be more feasible to send the CT scan to a dedicated team for biomechanics. CT images could be used for automatic development of patient-specific aneurysm models for finite element analyses or potentially those images may be used to directly predict wall stresses using machine learning approaches.
Study limitations
One study limitation is that the material properties used in this study were obtained from in vitro studies of Marfan aneurysm tissue, and were not patient-specific. Since this was a retrospective joint study with Johns Hopkins Hospital, and many of these patients had undergone prophylactic aneurysm repair, determination of in vivo patient-specific material properties was not feasible. Determining patient-specific material properties is a costly and time-consuming process that requires specialized sequences of Cine Displacement Encoding with Simulated Echos (DENSE) MRI available in San Francisco. The majority of patients in the study were male, which may reflect the disproportionately greater male predominance for aortic root aneurysms with Marfan syndrome. Nonetheless, the wall stress data may not fully reflect the female Marfan aneurysm population. Lastly, the sample size is relatively small; however, it does represent the largest available thus far in the literature. Also, the aggressive prophylactic surgery practice at Johns Hopkins yielded limited patients across the higher spectrum of sizes. Therefore, the lack of correlation between wall stresses and indices such as cross-sectional area/height ratio or indexed aortic diameter/BSA may reflect insufficient numbers of patients across the size spectrum and may require a larger cohort to examine the correlation. We have previously shown correlation of non-Marfan ascending thoracic aortic aneurysms with diameter, but with significant overlap in stresses suggesting that while a correlation existed, diameter was insufficient to predict wall stresses in individual patients.
Conclusion
In this study, we found circumferential and longitudinal wall stresses were greatest in the sinuses, followed by sinotubular junction, and finally ascending aorta in Marfan aTAA. Unlike BAV- and non-Marfan TAV-aTAA, circumferential stresses were lower in STJ than sinuses in Marfan aTAA. While 5.0cm and in certain circumstances 4.5cm has been used as a diameter cut-off to guide elective surgical repair in Marfan aTAA, there were no significant differences in peak circumferential or longitudinal wall stresses with either size cut-off. There were no correlations between peak circumferential wall stresses and diameter in any region of the aortic root. Longitudinal peak wall stresses may be considered an independent risk factor for dissection. Using in vitro determined tensile stresses at failure longitudinally may provide a better threshold to estimate dissection risk than diameter when combined with patient-specific aTAA FEA. Our results highlight the need for patient-specific aTAA wall stress analyses to aid dissection risk evaluation and optimize timing of operative intervention, especially for those Marfan patients with aTAA <5cm.
Acknowledgements
This study was supported by NIH R01HL119857-01A1 (Tseng/Ge), American Heart Association 20POST35211107 (Wang), NIH K25HL150408 (Xuan), UCSF Summer Explore Research Fellowship (D’Souza) and Marfan Foundation (Xuan/Tseng/Ge).
Footnotes
The authors have no conflicts of interest.
References:
- 1.Robinson PN, Arteaga-Solis E, Baldock C et al. The molecular genetics of marfan syndrome and related disorders. J Med Genet 2006;43(10):769–787. [DOI] [PMC free article] [PubMed] [Google Scholar]
- 2.Judge DP, Dietz HC. Marfan's syndrome. Lancet 2005;366(9501):1965–1976. [DOI] [PMC free article] [PubMed] [Google Scholar]
- 3.Pearson GD, Devereux R, Loeys B et al. Report of the national heart, lung, and blood institute and national marfan foundation working group on research in marfan syndrome and related disorders. Circulation 2008;118(7):785–791. [DOI] [PMC free article] [PubMed] [Google Scholar]
- 4.Krause KJ. Marfan syndrome: Literature review of mortality studies. J Insur Med 2000;32(2):79–88. [PubMed] [Google Scholar]
- 5.Weinsaft JW, Devereux RB, Preiss LR et al. Aortic dissection in patients with genetically mediated aneurysms: Incidence and predictors in the gentac registry. J Am Coll Cardiol 2016;67(23):2744–2754. [DOI] [PMC free article] [PubMed] [Google Scholar]
- 6.Gott VL, Pyeritz RE, Magovern GJ Jr., Cameron DE, McKusick VA Surgical treatment of aneurysms of the ascending aorta in the marfan syndrome. Results of composite-graft repair in 50 patients. N Engl J Med 1986;314(17):1070–1074. [DOI] [PubMed] [Google Scholar]
- 7.Price J, Magruder JT, Young A et al. Long-term outcomes of aortic root operations for marfan syndrome: A comparison of bentall versus aortic valve-sparing procedures. J Thorac Cardiovasc Surg 2016;151(2):330–336. [DOI] [PubMed] [Google Scholar]
- 8.Milewicz DM, Dietz HC, Miller DC. Treatment of aortic disease in patients with marfan syndrome. Circulation 2005;111(11):e150–157. [DOI] [PubMed] [Google Scholar]
- 9.Hiratzka LF, Bakris GL, Beckman JA et al. 2010 accf/aha/aats/acr/asa/sca/scai/sir/sts/svm guidelines for the diagnosis and management of patients with thoracic aortic disease. A report of the american college of cardiology foundation/american heart association task force on practice guidelines, american association for thoracic surgery, american college of radiology,american stroke association, society of cardiovascular anesthesiologists, society for cardiovascular angiography and interventions, society of interventional radiology, society of thoracic surgeons,and society for vascular medicine. J Am Coll Cardiol 2010;55(14):e27–e129. [DOI] [PubMed] [Google Scholar]
- 10.de Beaufort HWL, Trimarchi S, Korach A et al. Aortic dissection in patients with marfan syndrome based on the irad data. Ann Cardiothorac Surg 2017;6(6):633–641. [DOI] [PMC free article] [PubMed] [Google Scholar]
- 11.Svensson LG, Crawford ES, Coselli JS, Safi HJ, Hess KR. Impact of cardiovascular operation on survival in the marfan patient. Circulation 1989;80(3 Pt 1):I233–242. [PubMed] [Google Scholar]
- 12.Svensson LG, Khitin L. Aortic cross-sectional area/height ratio timing of aortic surgery in asymptomatic patients with marfan syndrome. J Thorac Cardiovasc Surg 2002;123(2):360–361. [DOI] [PubMed] [Google Scholar]
- 13.Martufi G, Forneris A, Appoo JJ, Di Martino ES. Is there a role for biomechanical engineering in helping to elucidate the risk profile of the thoracic aorta? Ann Thorac Surg 2016;101(1):390–398. [DOI] [PubMed] [Google Scholar]
- 14.Gomez A, Wang Z, Xuan Y et al. Wall stress distribution in bicuspid aortic valve-associated ascending thoracic aortic aneurysms. Ann Thorac Surg 2020;110(3):807–814. [DOI] [PMC free article] [PubMed] [Google Scholar]
- 15.Wang Z, Flores N, Lum M et al. Wall stress analyses in patients with >/=5 cm versus <5 cm ascending thoracic aortic aneurysm. J Thorac Cardiovasc Surg 2020. [DOI] [PMC free article] [PubMed] [Google Scholar]
- 16.Xuan Y, Wang Z, Liu R et al. Wall stress on ascending thoracic aortic aneurysms with bicuspid compared with tricuspid aortic valve. J Thorac Cardiovasc Surg 2018;156(2):492–500. [DOI] [PMC free article] [PubMed] [Google Scholar]
- 17.Sulejmani F, Pokutta-Paskaleva A, Ziganshin B et al. Biomechanical properties of the thoracic aorta in marfan patients. Ann Cardiothorac Surg 2017;6(6):610–624. [DOI] [PMC free article] [PubMed] [Google Scholar]
- 18.Krishnan K, Ge L, Haraldsson H et al. Ascending thoracic aortic aneurysm wall stress analysis using patient-specific finite element modeling of in vivo magnetic resonance imaging. Interact Cardiovasc Thorac Surg 2015;21(4):471–480. [DOI] [PMC free article] [PubMed] [Google Scholar]
- 19.Wisneski AD, Mookhoek A, Chitsaz S et al. Patient-specific finite element analysis of ascending thoracic aortic aneurysm. J Heart Valve Dis 2014;23(6):765–772. [PMC free article] [PubMed] [Google Scholar]
- 20.Gee MW, Reeps C, Eckstein HH, Wall WA. Prestressing in finite deformation abdominal aortic aneurysm simulation. J Biomech 2009;42(11):1732–1739. [DOI] [PubMed] [Google Scholar]
- 21.Grande-Allen KJ, Cochran RP, Reinhall PG, Kunzelman KS. Mechanisms of aortic valve incompetence: Finite-element modeling of marfan syndrome. J Thorac Cardiovasc Surg 2001;122(5):946–954. [DOI] [PubMed] [Google Scholar]
- 22.Singh SD, Xu XY, Pepper JR, Izgi C, Treasure T, Mohiaddin RH. Effects of aortic root motion on wall stress in the marfan aorta before and after personalised aortic root support (pears) surgery. J Biomech 2016;49(10):2076–2084. [DOI] [PubMed] [Google Scholar]
- 23.Okamoto RJ, Xu H, Kouchoukos NT, Moon MR, Sundt TM 3rd,. The influence of mechanical properties on wall stress and distensibility of the dilated ascending aorta. J Thorac Cardiovasc Surg 2003;126(3):842–850. [DOI] [PubMed] [Google Scholar]
- 24.Pichamuthu JE, Phillippi JA, Cleary DA et al. Differential tensile strength and collagen composition in ascending aortic aneurysms by aortic valve phenotype. Ann Thorac Surg 2013;96(6):2147–2154. [DOI] [PMC free article] [PubMed] [Google Scholar]
- 25.Ge L, Tseng EE. Invited commentary. Ann Thorac Surg 2013;96(6):2154. [DOI] [PubMed] [Google Scholar]