

Summary
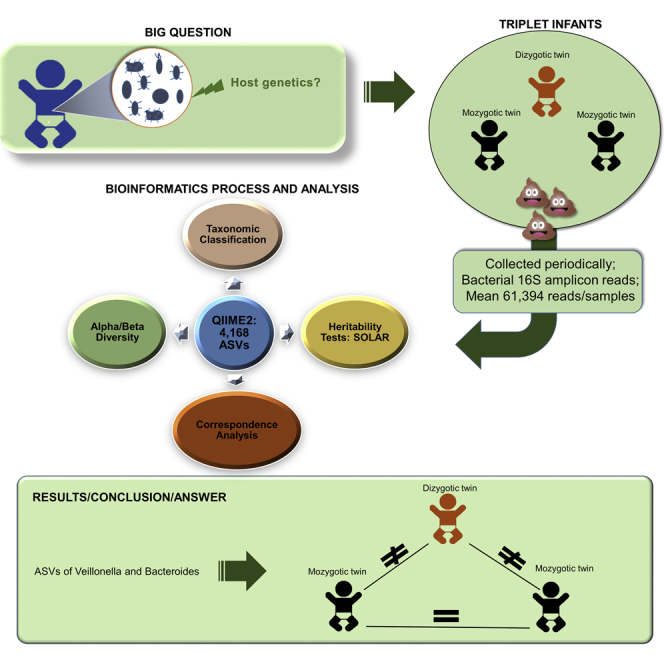
The question of whether host genetics plays a role in the development of the infant gut microbiota does not, as yet, have a clear answer. In order to throw additional light on this question, we have analyzed 16S rRNA amplicon sequences from 99 valid fecal samples of five sets of dichorionic triplet babies born by C-section from 1 to 36 months of age. Beta diversity analysis showed that monozygotic twins were more similar to each other than their dizygotic siblings. Monozygotic twins also tended to share more amplicon sequence variants between them. Heritability analysis showed that the genera Bacteroides and Veillonella are particularly susceptible to host genetics. We conclude that infant gut microbiota development is influenced by host genetics, but this effect is subtle and may affect only certain bacterial taxa during a limited time period early in life.
Subject areas: Microbiology, Microbiome
Graphical abstract
Highlights
-
•
Does genetics play a role in the development of the gut microbiota in infants?
-
•
We compared the microbiomes of triplets (two monozygotic and one dizygotic)
-
•
Genetics plays a role in the development of the microbiota, but the effect is subtle
-
•
Bacteroides and Veillonella were found to be particularly susceptible to host genetics
Microbiology; Microbiome
Introduction
The human gut microbiota starts to develop right after birth and becomes stable around 3 years of age, when it starts to resemble the adult microbiota (Bokulich et al., 2016; Yatsunenko et al., 2012). Even though it is possible to speak of the adult gut microbiota in general terms, the detailed microbiota profile is variable in adults and will be unique for each individual (Turnbaugh et al., 2009; Zhu et al., 2015). This can be explained by the several factors that can influence the establishment and development of the gut microbiota (Azad et al., 2013; Bokulich et al., 2016; Hill et al., 2017).
One important factor that may influence the community structure of the microbiota is host genetics. Previous studies based on culturable bacteria and fingerprinting of the fecal 16S rRNA gene suggest that part of the intestinal microbiota in adults is established very early on in the newborn's development with considerable heritability, since the gut microbiota of monozygotic (MZ) twins is more similar than the microbiota of dizygotic (DZ) twins (Blekhman et al., 2015; Goodrich et al., 2014, 2016; Hansen et al., 2011; Zoetendal et al., 2001). Genome-wide association analyses (GWASs) have provided a list of candidate genes or variants that may play roles in shaping the gut microbiota, such as the association between Bifidobacterium and the lactase (LCT) gene variants (Goodrich et al., 2016). Another example is that the genus Akkermansia was associated with a variant previously associated with body mass index (Davenport et al., 2015).
On the other hand, little is known with regard to the development and establishment of the microbiota in infants, and twin studies may provide important information on microbiota heritability. One of the first studies attempting to show this role found that pairs of infant MZ twins had more similarities in terms of eubacteria than nontwins (Stewart et al., 2005). Later, another study (Stewart et al., 2013) showed that, in a sample of preterm infants, genetically related infants have gut microbiomes that are more similar when compared with unrelated infants. The authors also found out that the community structures of the only set of triplets (two monochorionic monoamniotic and one dichorionic) were similar for all three infants. In 2015, Murphy et al. studied one set of dichorionic triplet children in order to analyze genetic factors in the development and establishment of the intestinal microbiota. They collected the infants' stools at four different time points (1, 2, 3, and 12 months) (Murphy et al., 2015). The authors found evidence that MZs were more similar than the DZs in alpha and beta diversities in the first 3 months, but they did not find any differences in the 12th month. All these studies were based on 16S rRNA gene data. Another study examined 10 pairs of Chinese twin children, whose ages ranged from 5 months to 6 years old (Zhou et al., 2016). Using shotgun metagenomic sequencing, the authors obtained a single sample from each individual, and they found that the gut microbiota is strongly influenced by age and that MZ pairs share more microbial species than DZ pairs.
Although these studies have made contributions to our understanding of the role played by host genetics on the gut microbiome development, they were limited by small sample sizes (Murphy et al., 2015; Stewart et al., 2005; Zhou et al., 2016), lack of long-term follow-up (Zhou et al., 2016), or analysis only of older infants (Stewart et al., 2005; Zhou et al., 2016).
With the aim to overcome part of these challenges in understanding the role of host genetics in the establishment and development of the gut microbiota in infants, we have obtained 111 feces samples from five sets of dichorionic triplets collected longitudinally, over an age range that varies from 1 month to 3 years. We have also applied state-of-the art computational pipelines to process 16S rRNA amplicon fragments. To our knowledge, this is the first study to explore this collection design.
Results
Datasets
We obtained five amplicon sequence datasets that we named A through E, representing a triplet set each. Of a total of 111 samples (each individual at a given time point yields one sample), 12 were discarded because one, two, or all three triplets in a triplet set were taking or took antibiotics within the previous 30 days. This resulted in 99 accepted samples (Table S1).
Sequencing results
Bacterial 16S amplicon sequencing of the samples yielded 22,101,869 reads combining all sequence datasets. After pre-processing, we obtained 6,672,051 reads with a length of 230 bp and minimum phred-like quality value 20 for each base, resulting in an average of 61,394 reads per sample (Table S2). All samples reached a plateau when rarefied, indicating sufficient sequencing depth (Figure S1). The reads were assigned to 4,168 amplicon sequence variants (ASVs).
For the next two subsections, we present results of this microbiome dataset as a whole, without taking into consideration the existence of triplets. The goal is to determine to what extent these results follow comparable results from the literature, so that we can ensure a good baseline for downstream analyses.
Bacteroides and Bifidobacterium were predominant throughout the sets
The ASVs were classified into 13 phyla (Table S3). The phyla with the highest relative abundances overall were Firmicutes, Bacteroidetes, and Proteobacteria, followed by Actinobacteria and Verrucomicrobia (Figure S2A). The families Lachnospiraceae and Enterobacteriaceae were the only ones in the top ten taxa in all sets in terms of relative abundance. The phylum Bacteroidetes was primarily represented by the genus Bacteroides, which had the highest relative abundance in almost all sets (14%–35%), except in set D, in which the genus with the highest relative abundance was Escherichia/Shigella (22%). The phylum Actinobacteria was primarily represented by genus Bifidobacterium, which had similar relative abundances in sets A (11%), B (11%), D (14%), and E (11%). In set C, whose samples were collected at later time points compared with the others (16, 19, 20, 21, and 22 months), this genus had lower relative abundance (2%) (Figure S2B). Taxonomic classification at the species level resulted in 168 species represented by 1,496 ASVs (Table S4).
Bacteroidetes and Bacteroides relative abundance increases with time
The three most abundant phyla were Firmicutes, Bacteroidetes, and Proteobacteria. Analyzing the relative abundance of these phyla in a longitudinal manner in all sets, we found that the relative abundance of Firmicutes did not vary by much over time, while Proteobacteria decreased and Bacteroidetes increased (Figure 1A). At the genus level it is more difficult to discern trends in relative abundance, but it does seem that the increase in abundance for the Bacteroidetes phylum is driven by an increase in Bacteroides (Figure 1B).
Figure 1.

Bacteroidetes and Bacteroides abundance increase with time
(A) Relative abundance of the 10 most abundant phyla of all sets at each time point.
(B) Relative abundance of the 10 most abundant genera of all sets at each time point. Taxa with low abundance were grouped as “Others.” Numbers on the top of each bar represent the quantity of triplet sets at the respective time point. The black dots between two time points denote month gaps when no samples were obtained. unclass. = unclassified. See also Figure S2.
MZs are more similar in beta diversity but not in alpha diversity
The mean scores for MZs and DZs for the Faith and Shannon indices and observed ASVs were not significantly different (p > 0.05), i.e., these groups presented similar alpha diversities (Table 1).
Table 1.
Permutation test of mean difference of phylogenetic diversity between MZ1 and MZ2
| Diversity Metrics | MZ1.MZ2 means and medians differencea | p valueb | |
|---|---|---|---|
| Faith | All sets | Mean(-0.1260) | 0.2677 |
| Median(0.2163) | 0.6527 | ||
| By setc | Mean(0.3512) | 0.9627 | |
| Median(0.3536) | 0.9523 | ||
| Shannon | All sets | Mean(-0.0066) | 0.4637 |
| Median(-0.1993) | 0.0735 | ||
| By setc | Mean(0.1202) | 0.8808 | |
| Median(0.2097) | 0.9658 | ||
| Observed ASVs |
All sets | Mean(1.7424) | 0.6703 |
| Median(-5.5) | 0.2832 | ||
| By setc | Mean(6.9760) | 0.9544 | |
| Median(4.25) | 0.8198 | ||
| Unweighted UniFrac |
All sets | Mean(-0.0247) | 0.0221∗ |
| Median(-0.0334) | 0.0261∗ | ||
| By setc | Mean(-0.0303) | 0.0168∗ | |
| Median(-0.0249) | 0.0238∗ | ||
| Weighted UniFrac |
All sets | Mean(-0.0106) | 0.3124 |
| Median(-0.0287) | 0.3107 | ||
| By setc | Mean(-0.0300) | 0.0914 | |
| Median(0.0022) | 0.5432 | ||
| Bray-Curtis | All sets | Mean(-0.0915) | 0.0016∗∗ |
| Median(-0.0770) | 0.0511 | ||
| By setc | Mean(-0.1179) | <0.001∗∗∗ | |
| Median(-0.0844) | 0.0108∗ | ||
| Jaccard | All sets | Mean(-0.0367) | 0.0009∗∗∗ |
| Median(-0.0397) | 0.0003∗∗∗ | ||
| By setc | Mean(-0.0419) | <0.0001∗∗∗ | |
| Median(-0.0432) | 0.0013∗∗∗ |
MZ1, monozygotic 1; MZ2, monozygotic 2.
Measured between monozygotic infant 1 and monozygotic infant 2.
Statistical significance if ∗p ≤ 0.05, ∗∗p ≤ 0.01, ∗∗∗p ≤ 0.001.
Takes into account the weight (size) of each set.
When relative abundance and phylogenetic relationships were taken into account in beta diversity analysis, we could not detect a difference between the MZs and their DZ co-twin as measured by the weighted UniFrac distance (p = 0.3124 for 10,000 permutation tests of the mean difference in all sets). On the other hand, using unweighted UniFrac, we observed that MZs (MZ1 and MZ2 mean difference) are significantly more similar to each other than to their DZ co-twin, both when number of samples per set was considered and not considered (considering number of samples per set, p = 0.0168; not considering the number of samples per set, p = 0.0221). We also observed highly significant similarities between MZs when only presence and absence were taken into account by the Jaccard method (not considering the number of samples per set, p = 0.0009). The Bray-Curtis measure, in which abundance is taken into account but not phylogenetic relationships, also showed that MZs are significantly more similar to each other than to their DZ co-twin (not considering the number of samples per set, p = 0.0016) (Table 1).
Next, we applied principal coordinate analysis using Bray-Curtis, Jaccard, and weighted and unweighted UniFrac distance metrics in each set in order to explore group differences between the samples. We observed clusterization of MZs at some time points in each set, mainly in unweighted UniFrac distance: in set A, MZs are clustered at 7 and 36 months; in set B, at 9, 13, 14, and 18 months; in set C, at 19, 21, and 22 months; in set D, at 9, 11, 13 and 18 months; and in set E, at 1, 6, 7, 9, and 11 months (Figure 2). In this measure, up to four principal coordinates were necessary to explain at least 50% variance of all samples, which ranged from 52.2% to 68.6% throughout the sets.
Figure 2.

MZs are more similar in terms of beta diversity
Principal coordinate analysis based on beta diversity measured by unweighted UniFrac in all sets (A, B, C, D, and E). Time points in months are color coded. Solid circles represent DZs (dizygotic twins) and triangles represent MZs (monozygotic twins). Up to four principal coordinates were necessary to explain at least 50% of the total variance, but only the first two of each set are shown. See also Table 1.
MZs share more ASVs between them when compared with their DZ co-twin
We checked whether each pair of MZs had more ASVs in common between them than between MZs and DZ co-twins (MZ1 and DZ or MZ2 and DZ). The fractions of ASVs shared only between MZs (MZ1 and MZ2) were 13%, 12%, 15%, 13%, and 12% of total ASVs in each set A, B, C, D, and E, respectively (Figure 3). In order to check if those fractions are significantly larger than the fractions between MZ1 and DZ (8%, 11%, 12%, 10%, and 11%, respectively) and MZ2 and DZ (7%, 9%, 8%, 8%, and 10%, respectively), we applied a multinomial model in each set to compare the three fractions (Figure 3 and Table 2). The result is that only for set A there is statistical significance with respect to both MZ1 and DZ and to MZ2 and DZ (Table 2). Most ASVs shared exclusively between MZs throughout the sets were classified as Bifidobacterium (60 ASVs, 7%), Bacteroides (52 ASVs, 6%), and Veillonella (50 ASVs, 6%) (Table S5).
Figure 3.

MZs share more ASVs between them when compared with their DZ co-twin
Number of ASVs shared by MZ1, MZ2, and DZ groups at all time points in each set. In set A, MZ1 and MZ2 shared significantly more ASVs between them when compared with their DZ co-twin (p = 0.044 when compared with MZ1 and DZ, and p = 0.018 when compared with MZ2 and DZ). In set C, MZ1 and MZ2 were only more similar when compared with MZ2 and DZ (p = 0.028). In sets B, D, and E, no significant evidence was found for MZ1 and MZ2 when compared with MZ1 and DZ (p = 0.388 in set B, p = 0.1278 in set D, p = 0.385 in set E) or with MZ2 and DZ (p = 0.149 in set B, p = 0.052 in set D, p = 0.166 in set E). MZ1, monozygotic twin 1; MZ2, monozygotic twin 2; DZ, dizygotic twin. See also Tables 2 and S5.
Table 2.
Multinomial model for proportion of shared ASVs
| Comparison of proportions between the pairs | P-valuesa |
||||
|---|---|---|---|---|---|
| Set A | Set B | Set C | Set D | Set E | |
| MZ1 and MZ2 vs. MZ1 and DZ | 0.0444∗ | 0.3889 | 0.1860 | 0.1278 | 0.3859 |
| MZ1 and MZ2 vs. MZ2 and DZ | 0.0183∗ | 0.1496 | 0.0283∗ | 0.0527 | 0.1664 |
MZ1, monozygotic 1; MZ2, monozygotic 2; DZ, dizygotic. See also Figure S5
Statistical significance if ∗p ≤ 0.05.
Specific time points reveal similarities of ASV-sample associations between MZs
We undertook a correspondence analysis (CA) in each set to investigate the associations of the abundance of ASVs with the samples. We normalized the samples on the principal coordinate based on relative abundances of ASVs and the ASVs themselves on standard coordinates. In sets A and E, the relative abundance of ASVs resulted in groups of samples based on time points (p < 0.05 for Pearson’s chi-square test). Overall, we noticed that samples of time points 9, 11, and 13 months formed a separate group from the other time points in these two sets. Next, we examined those time points (9, 11, and 13 months) more closely in all sets, except for set C, for which these time points samples were not available. We performed CA on those time points in which the chi-square p-values were less than 0.05, and since the sample size of the contingency tables were large (>450), we calculated the coefficient of contingency that was greater than 0.99 in all sets (Figure 4). To check the contribution of each sample and each ASV to the significance of association, we took the log2 of the likelihood ratio (for simplicity, we will call it “ratio” only), i.e., observed values over expected values from chi square, and used it as an index. Then, we compared the results between the triplets as follows: monozygotic twin 1 versus monozygotic twin 2 (MZ1 versus MZ2); monozygotic twin 1 versus dizygotic co-twin (MZ1 versus DZ); monozygotic twin 2 versus dizygotic co-twin (MZ2 versus DZ) (Figure S4). We found that both MZ1 versus MZ2 and MZ1 versus DZ had more similar ratios in 34 of 111 ASVs tested, whereas MZ2 versus DZ were more similar in 20 ASVs out of 111. There were ties in similarity in 23 ASVs between all three or two of the groups compared. Eleven ASVs (3, 8, 18, 19, 31, 43, 44, 63, 64, 80, and 714) were present in all sets and at all three time points. From these ASVs, MZ1 versus MZ2 were more similar in terms of ASVs 43 and 63; MZ1 versus DZ in terms of ASVs 8, 18, 44, and 80; and MZ2 versus DZ in terms of ASVs 3 and 714. In terms of ASV-19, MZ1 versus MZ2 and MZ1 versus DZ were equally more similar than MZ2 versus DZ, whereas in terms of ASV-31, all three groups were equally similar. For set C, we observed clusterization of MZs at two of four time points (p = 0.0005 for Pearson’s chi-square test) (Figure S3).
Figure 4.

Specific time points reveal similarities of ASV-sample associations between MZs
Correspondence analysis on Sets A (A), B, (B), D (C) and E (D) at time points 9, 11, and 13 months. Samples are in blue and ASVs (here coded with s#) are presented in a gradient color representing their contribution to the principal components of the samples. Samples grouped together are more similar to one another than samples further away. Samples on opposite quadrants are more different than samples in the same quadrant. Associations between ASVs and the samples can be evaluated by the angle between them formed from the origin and the distance of the ASVs from the origin. The further from the origin and the smaller the angle, the stronger the association. In set A (A), MZs are all in the lower quadrants and DZs are in the upper quadrants. In set B (B), samples are separated by time points; each time point is in a different quadrant. In set D (C), all MZs are more similar when compared with their DZ co-twins. In set E (D), there was no clusterization of MZs. m1, monozygotic twin 1; m2, monozygotic twin 2; d, dizygotic twin. See also Figures S3–S5.
ASVs of Bacteroides and Veillonella have significant heritabilities at time points 9, 11, and 13 months
We now report results of heritability tests on the ASVs, in order to verify whether their relative abundances reveal significant heritability differences. We considered p-value ≤ 0.05 as the threshold for statistical significance. Heritability (H2r) is defined by the proportion of phenotypic variance attributed to additive genetic variance, calculated on the basis of zygosity between siblings. We could perform heritability tests only at time points 9, 11, and 13 months, since these are the only time points where we had a large enough sample size (n = 4: sets A, B, D, and E). Before the test was applied, we screened the ASVs as follows: First, we kept only ASVs that were present in at least 50% of all samples following criteria in the literature (Goodrich et al., 2014, 2016; Xie et al., 2016). Second, we kept ASVs that were present in at least three sets and whose relative abundances were not equal to zero in DZs of each set at each time point. This resulted in 20, 28, and 32 ASVs at time points 9, 11, and 13 months, respectively. From these, we determined that at time point 9 months there were five ASVs with significant heritability values; at time point 11 months, there were seven; and at time point 13 months, there were ten (Figure 5 and Table S6).
Figure 5.

ASVs of Bacteroides and Veillonella have significant heritabilities at time points 9, 11, and 13 months
Heritability estimates (H2r) by SOLAR-Eclipse of ASVs at time points 9, 11, and 13 months. Dots represent the heritability estimates, and bars are the standard errors of the estimates. Shown here are only ASVs whose heritability was statistically significant (p ≤ 0.05). Numbers above the dots are the p-values of the test. The vertical dotted line is the mean of H2r of all ASVs represented here. uncl, unclassified; _i_s, _incertae_sedis; _s_s, _sensu_stricto. See also Figures S5 and S6.
Among ASVs with significant heritability values, ASVs classified as Bacteroides were by far the most prevalent (six distinct ASVs, with ASV-1 present at all three time points in this analysis, the only one to do so). We also highlight two ASVs classified as Veillonella (ASV-8 and ASV-63), which together have significant heritabilities at all three time points.
Finally, we compared these results with the ones we obtained from the shared ASVs and with the MZ clusterizations obtained with the CA (Figure S5). The following ASVs came up in all three analyses: at time point 9 months, only ASV-1 (Bacteroides); at time point 11 months, five ASVs: ASV-21 and ASV-31 (both Clostridium_XlVa), ASV-60 (Blautia), ASV-63 (Veillonella), and ASV-80 (Clostridium_sensu_stricto); and at time point 13 months, three ASVs: ASV-1 (Bacteroides), ASV-18 (Escherichia/Shigella), and ASV-860 (Bacteroides).
Discussion
In this study, we investigated the relationship between host genetics and gut microbiome profiles of five sets of triplet babies whose ages ranged from 1 month to 3 years. We used 16S rRNA amplicons for this analysis and mainly explored ASVs (amplicon sequence variants) to assess host genetics influence on the development of the gut microbiome.
The overall microbiome profile of these sets showed that the five most abundant phyla were Firmicutes, Proteobacteria, Bacteroidetes, Actinobacteria, and Verrucomocrobia (Figure S2). In a previous study of Brazilian children aged between 1 and 3 years, the exact same phyla were found to be the most abundant (Chew et al., 2020). The same five phyla are also listed as the most abundant in several other studies of infant microbiomes (Azad et al., 2013; Bokulich et al., 2016; Hill et al., 2017; Yassour et al., 2016). These observations suggest that these phyla play an important role in gut microbiota, independent of the environment. At the genus level, various studies (Hill et al., 2017; Mcgeachie et al., 2016; Stewart et al., 2018; Yassour et al., 2016) have shown that Bacteroides bacteria are not abundant in the first weeks of life in babies born by C-section, but their abundance starts to increase around the sixth month. This finding was reproduced here; we saw Bacteroides first increase at six months of age. Previous studies of Brazilian newborns (Brandt et al., 2012; Taddei et al., 2014) found that Escherichia/Shigella had the highest relative abundance. In the present study, we observed this only in set D; in the others, Bacteroides was the most abundant, with Escherichia/Shigella the second most abundant genus.
Regarding ASV classification at the species level, we first point out that, in general, the V3/V4 region of the 16S gene of the rRNA does not have the resolution necessary to distinguish different species of the same genus (Johnson et al., 2019). However, given that the human gut microbiome is well studied, we hypothesize that many of the species classifications given by SPINGO for this particular dataset should be accurate. For example, one of the identified species is Bacteroides fragilis, and its presence in the human gut is well documented (Wexler, 2007). We refrain, however, from providing a general analysis of the ASVs at the species level given the uncertainty in these classifications.
In terms of phyla variation over time we observed that Firmicutes was more or less stable, whereas Proteobacteria decreased in abundance and Bacteroidetes increased in abundance. The same trends have been reported previously in European children born by C-section (Hill et al., 2017; Yassour et al., 2016). We also observed that the genus Bifidobacterium had one of the highest relative abundances overall, an observation similar to that made by Hill et al. (2017). The genera Escherichia and Clostridium sensu stricto had high relative abundances in the first months but decreased before 2 years of age. These same findings have been reported previously and positively associated with C-section delivery (Hesla et al., 2014; Hill et al., 2017).
These results and comparisons with the literature suggest that the microbiome composition and its variation in our sets of triplets replicate the findings for similar profile children from Western countries. This may be explained at least in part by the fact that the diet of people inhabiting large urban centers in Brazil (such as São Paulo) is generally similar to that of people in European cities (Santos and Conde, 2020). One alternative explanation is that the establishment of the microbiota in infants is primarily determined by the human genome, with the environment being a secondary factor.
In a longitudinal (1 to 12 months) previous study of one set of Irish dichorionic triplets (Murphy et al., 2015), alpha diversity was higher in the DZ twins. However, in the present study, the comparison between the MZs and their DZ co-twin did not show evidence for differences of alpha diversity between the triplets. On the other hand, we observed that MZs were more similar to each other than to their DZ co-twin in all beta diversity measures, except weighted UniFrac. Goodrich et al. (2016), who analyzed the microbiome of 2,731 individuals from the United Kingdom (MZ twin pairs and DZ twin pairs) with a mean age of 60 years, and Murphy et al. (2015), who studied only one set of dichorionic infant triplets, have also reported more beta diversity similarities in MZs calculated by unweighted UniFrac distance, but not by weighted UniFrac distance. Here, we also found high significance (p = 0.0001 for 10,000 permutation tests) on ASVs exclusively shared between MZs (Table 2). In addition, MZs were more similar on Bray-Curtis measures. These results suggest that the species composition of microbiomes rather than their relative abundance (which is taken into account in weighted Unifrac) is driving the observed MZ similarities.
Our observations support the hypothesis that two specific bacterial genera may be particularly susceptible to host genetics: Bacteroides and Veillonella. Starting at time point 9 months, the genus Bacteroides was the most abundant in four of five sets. Moreover, among ASVs presenting significant heritability values (p ≤ 0.05), more were classified as Bacteroides than as any other genus. Among ASVs shared only by MZs, the most frequent genus classifications were Bacteroides and Veillonella, after Bifidobacterium (Table S5). On the other hand, we did not observe that ASVs classified as Bacteroides presented more similarities between the MZs in terms of ASV-sample associations when compared with ASVs classified as other genera. Previous reports (Goodrich et al., 2014, 2016; Singh et al., 2017; Turnbaugh et al., 2009) have shown that gut bacteria of the genus Bacteroides are particularly sensitive to environmental factors. The evidence here presented suggests that bacteria of this genus may also be susceptible to host genetics.
Our investigation of ASV abundances associated with MZ pairs by correspondence analysis and the heritability of ASVs showed that Veillonella ASVs, represented by ASV-8 and ASV-63, presented significant heritabilities (H2r > 0.50; p ≤ 0.05), the former at time point 13 and the latter at time points 9 and 11 months. Their ratios were more similar in MZ pairs than in the DZ co-twin. In addition, these ASVs were also exclusively shared between MZs (ASV-8 at 9 and 11 months; ASV-63 at 13 months). Veillonella was one of the top three most abundant genera that had the most number (50) of ASVs that were exclusively shared between the MZs in all sets of triplets. Previous reports on heritability of the human gut microbiome showed that the genus Veillonella had high heritability in an adult population of Hutterites (Davenport et al., 2015). In another gut microbiome study of adult Chinese (40–75 years old), the family Veillonellaceae was reported to have high heritability and its abundance to be negatively associated with some diseases predictable by host genetics (Xu et al., 2020). In a study of the oral microbiome of 485 Australian dizygotic and monozygotic twins aged 5 to 11 years (Gomez et al., 2017), it was reported that Veillonella was one of the most heritable taxa as well as one of the most dominant. A recent longitudinal study on baboons demonstrated significant heritability in a large list of phenotypes based on 16S rRNA sequences, including the genus Veillonella as a whole and some ASVs classified as belonging to this genus (Grieneisen et al., 2021). The authors showed correlation between the heritability of traits in baboons and humans. This body of literature and our own results suggest that members of the genus Veillonella in the gut may be susceptible to host genetic influence, especially early in life.
Recent studies demonstrated some health benefits provided by Veillonella. V. atypica improves athletes’ performance by turning lactate into short-chain fatty acid propionate, which counteracts inflammation and provides energy for the body (Scheiman et al., 2019). Veillonella parvula was identified as a co-participant of the innate immune system modulation by increasing IL-8, IL-6, IL-10, and TNF-α responses, which are involved in the regulation of the inflammation process (van den Bogert et al., 2014). Thus, members of the Veillonella genus seem to play an important role in human development.
Previous studies (Rothschild et al., 2018; Tabrett and Horton, 2020) have presented evidence that the human gut microbiome composition is more influenced by the environment than by host genetics. In the present study, we find evidence that host genetics does have a discernible influence. Taken together, these findings suggest that the host genetic-gut microbiome interaction can be very dynamic, especially in early life, when the microbiota is developing.
Conclusions
To our knowledge, our study is the first to conduct a descriptive analysis of the gut microbiome on five sets of triplets and test heritability on four of them. Our findings revealed that there are some bacteria that, at least at the sequence level, are affected by host genetics, such as Veillonella and Bacteroides. We hypothesize that there is a limited time window during infant gut microbiota development when this effect occurs. Since signals of genetic effects on the gut microbiome might be subtle and temporary, future investigations should aim at obtaining additional data, including microbiota genome sequences and gene and protein expression data.
Limitations of the study
The main limitations of this study are the relatively low number of triplet sets (five), the relative lack of uniformity in shared time points between the triplet sets, and the low number of samples during the first 6 months. Future studies following the experimental design presented here should seek to increase these numbers.
STAR★Methods
Key resources table
| REAGENT or RESOURCE | SOURCE | IDENTIFIER |
|---|---|---|
| Biological samples | ||
| Stool samples | collected by volunteers | Randomized identification |
| Critical commercial assays | ||
| Nextera XT Index Kit (24 indexes, 96 samples) | Illumina, Inc. | FC-131-1001 |
| PhiX Control v3 | Illumina, Inc. | FC-110-3001 |
| MiSeq Reagent Kit v3 (600-cycle) | Illumina, Inc. | MS-102-3003 |
| Nextera XT Index Kit v2 Set A (96 indexes, 384 samples) | Illumina, Inc. | FC-131-2001 |
| Deposited data | ||
| triplets_M1-T1_6wk | This paper | SRA: SAMN21216268 |
| triplets_M1-T2_6wk | This paper | SRA: SAMN21216269 |
| triplets_M1-T3_6wk | This paper | SRA: SAMN21216270 |
| triplets_M1-T1_22wk | This paper | SRA: SAMN21216271 |
| triplets_M1-T2_22wk | This paper | SRA: SAMN21216272 |
| triplets_M1-T3_22wk | This paper | SRA: SAMN21216273 |
| triplets_M1-T1_26wk | This paper | SRA: SAMN21216274 |
| triplets_M1-T2_26wk | This paper | SRA: SAMN21216275 |
| triplets_M1-T3_26wk | This paper | SRA: SAMN21216276 |
| triplets_M1-T1_34wk | This paper | SRA: SAMN21216277 |
| triplets_M1-T2_34wk | This paper | SRA: SAMN21216278 |
| triplets_M1-T3_34wk | This paper | SRA: SAMN21216279 |
| triplets_M1-T1_43wk | This paper | SRA: SAMN21216280 |
| triplets_M1-T2_43wk | This paper | SRA: SAMN21216281 |
| triplets_M1-T3_43wk | This paper | SRA: SAMN21216282 |
| triplets_M1-T1_48wk | This paper | SRA: SAMN21216283 |
| triplets_M1-T2_48wk | This paper | SRA: SAMN21216284 |
| triplets_M1-T3_48wk | This paper | SRA: SAMN21216285 |
| triplets_M1-T1_51wk | This paper | SRA: SAMN21216286 |
| triplets_M1-T2_51wk | This paper | SRA: SAMN21216287 |
| triplets_M1-T3_51wk | This paper | SRA: SAMN21216288 |
| triplets_M1-T1_144wk | This paper | SRA: SAMN21216289 |
| triplets_M1-T2_144wk | This paper | SRA: SAMN21216290 |
| triplets_M1-T3_144wk | This paper | SRA: SAMN21216291 |
| triplets_M3-T1_25wk | This paper | SRA: SAMN21216292 |
| triplets_M3-T2_25wk | This paper | SRA: SAMN21216293 |
| triplets_M3-T3_25wk | This paper | SRA: SAMN21216294 |
| triplets_M3-T1_34wk | This paper | SRA: SAMN21216295 |
| triplets_M3-T2_34wk | This paper | SRA: SAMN21216296 |
| triplets_M3-T3_34wk | This paper | SRA: SAMN21216297 |
| triplets_M3-T1_43wk | This paper | SRA: SAMN21216298 |
| triplets_M3-T2_43wk | This paper | SRA: SAMN21216299 |
| triplets_M3-T3_43wk | This paper | SRA: SAMN21216300 |
| triplets_M3-T1_47wk | This paper | SRA: SAMN21216301 |
| triplets_M3-T2_47wk | This paper | SRA: SAMN21216302 |
| triplets_M3-T3_47wk | This paper | SRA: SAMN21216303 |
| triplets_M3-T1_51wk | This paper | SRA: SAMN21216304 |
| triplets_M3-T2_51wk | This paper | SRA: SAMN21216305 |
| triplets_M3-T3_51wk | This paper | SRA: SAMN21216306 |
| triplets_M3-T1_56wk | This paper | SRA: SAMN21216307 |
| triplets_M3-T2_56wk | This paper | SRA: SAMN21216308 |
| triplets_M3-T3_56wk | This paper | SRA: SAMN21216309 |
| triplets_M3-T1_73wk | This paper | SRA: SAMN21216310 |
| triplets_M3-T2_73wk | This paper | SRA: SAMN21216311 |
| triplets_M3-T3_73wk | This paper | SRA: SAMN21216312 |
| triplets_M3-T1_78wk | This paper | SRA: SAMN21216313 |
| triplets_M3-T2_78wk | This paper | SRA: SAMN21216314 |
| triplets_M3-T3_78wk | This paper | SRA: SAMN21216315 |
| triplets_M3-T1_82wk | This paper | SRA: SAMN21216316 |
| triplets_M3-T2_82wk | This paper | SRA: SAMN21216317 |
| triplets_M3-T3_82wk | This paper | SRA: SAMN21216318 |
| triplets_M3-T1_86wk | This paper | SRA: SAMN21216319 |
| triplets_M3-T2_86wk | This paper | SRA: SAMN21216320 |
| triplets_M3-T3_86wk | This paper | SRA: SAMN21216321 |
| triplets_M4-T1_64wk | This paper | SRA: SAMN21216322 |
| triplets_M4-T2_64wk | This paper | SRA: SAMN21216323 |
| triplets_M4-T3_64wk | This paper | SRA: SAMN21216324 |
| triplets_M4-T1_74wk | This paper | SRA: SAMN21216325 |
| triplets_M4-T2_74wk | This paper | SRA: SAMN21216326 |
| triplets_M4-T3_74wk | This paper | SRA: SAMN21216327 |
| triplets_M4-T1_84wk | This paper | SRA: SAMN21216328 |
| triplets_M4-T2_84wk | This paper | SRA: SAMN21216329 |
| triplets_M4-T3_84wk | This paper | SRA: SAMN21216330 |
| triplets_M4-T1_87wk | This paper | SRA: SAMN21216331 |
| triplets_M4-T2_87wk | This paper | SRA: SAMN21216332 |
| triplets_M4-T3_87wk | This paper | SRA: SAMN21216333 |
| triplets_M5-T1_36wk | This paper | SRA: SAMN21216334 |
| triplets_M5-T2_36wk | This paper | SRA: SAMN21216335 |
| triplets_M5-T3_36wk | This paper | SRA: SAMN21216336 |
| triplets_M5-T1_44wk | This paper | SRA: SAMN21216337 |
| triplets_M5-T2_44wk | This paper | SRA: SAMN21216338 |
| triplets_M5-T3_44wk | This paper | SRA: SAMN21216339 |
| triplets_M5-T1_50wk | This paper | SRA: SAMN21216340 |
| triplets_M5-T2_50wk | This paper | SRA: SAMN21216341 |
| triplets_M5-T3_50wk | This paper | SRA: SAMN21216342 |
| triplets_M5-T1_73wk | This paper | SRA: SAMN21216343 |
| triplets_M5-T2_73wk | This paper | SRA: SAMN21216344 |
| triplets_M5-T3_73wk | This paper | SRA: SAMN21216345 |
| triplets_M6-T1_3wk | This paper | SRA: SAMN21216346 |
| triplets_M6-T2_3wk | This paper | SRA: SAMN21216347 |
| triplets_M6-T3_3wk | This paper | SRA: SAMN21216348 |
| triplets_M6-T1_9wk | This paper | SRA: SAMN21216349 |
| triplets_M6-T2_9wk | This paper | SRA: SAMN21216350 |
| triplets_M6-T3_9wk | This paper | SRA: SAMN21216351 |
| triplets_M6-T1_23wk | This paper | SRA: SAMN21216352 |
| triplets_M6-T2_23wk | This paper | SRA: SAMN21216353 |
| triplets_M6-T3_23wk | This paper | SRA: SAMN21216354 |
| triplets_M6-T1_26wk | This paper | SRA: SAMN21216355 |
| triplets_M6-T2_26wk | This paper | SRA: SAMN21216356 |
| triplets_M6-T3_26wk | This paper | SRA: SAMN21216357 |
| triplets_M6-T1_36wk | This paper | SRA: SAMN21216358 |
| triplets_M6-T2_36wk | This paper | SRA: SAMN21216359 |
| triplets_M6-T3_36wk | This paper | SRA: SAMN21216360 |
| triplets_M6-T1_42wk | This paper | SRA: SAMN21216361 |
| triplets_M6-T2_42wk | This paper | SRA: SAMN21216362 |
| triplets_M6-T3_42wk | This paper | SRA: SAMN21216363 |
| triplets_M6-T1_52wk | This paper | SRA: SAMN21216364 |
| triplets_M6-T2_52wk | This paper | SRA: SAMN21216365 |
| triplets_M6-T3_52wk | This paper | SRA: SAMN21216366 |
| Oligonucleotides | ||
| lyophilized custumized oligos 5′ 341F TCGTCGGCAGCGTCAGATGTGTAT AAGAGACAG CCT ACG GGA GGC AGC AG |
ThermoFisher Scientific | CA#10336022 |
| Software and algorithms | ||
| Pipeline QIIME2 2019.10 | Bolyen et al., 2019 | https://docs.qiime2.org/2019.10/interfaces/q2cli/ |
| R package phyloseq version 1.36.0 | McMurdie and Holmes, 2013 | https://github.com/joey711/phyloseq |
| SPINGO version 11.2 | Allard et al., 2015 | https://github.com/GuyAllard/SPINGO |
| RDP classifier version 2.12 | Wang et al., 2007 | https://sourceforge.net/projects/rdp-classifier/ |
| RDP version 11.5 | Cole et al., 2014 | https://rdp.cme.msu.edu/index.jsp |
| R package ggplot2 version 3.3.3 | Wickham, 2016 | https://cran.r-project.org/web/packages/ggplot2/index.html |
| R package VennDiagram version 1.6.17 | Ontario Institute for Cancer Research | https://CRAN.R-project.org/package=VennDiagram |
| CoinMinD R package version 1.1 | CRAN R Project | https://CRAN.R-project.org/package=CoinMinD |
| R package factoextra version 1.0.5 | CRAN R Project | https://CRAN.R-project.org/package=factoextra |
| SOLAR (Sequential Oligogenic Linkage Analysis Routines) Eclipse version software package version 8.5.1 (beta) | Kochunov et al., 2015 | http://www.solar-eclipse-genetics.org/ |
Resource availability
Lead contact
Further information and requests for resources and reagents should be directed to João C. Setubal (setubal@iq.usp.br)
Materials availability
This study did not generate any materials.
Experimental model and subject details
We recruited triplet mothers with social media ads. The study was approved by the Ethics Committee of the Biosciences Institute of the University of São Paulo through Plataforma Brazil under the number CAAE: 15291119.2.0000.5464, and all parents signed informed consent. In four of the five pregnancies, the babies were the result of in vitro fertilization, where two embryos were implanted and one divided afterwards, resulting in one pair of MZ twins and one DZ twin. All five sets of triplets were delivered by C-section. These healthy dichorionic triplets were included in the study.
Method details
Biological material collection
We collected stool samples from each baby and their respective mothers for access to the intestinal microbiota. We collected up to 30 g of feces monthly from diapers in universal DNA collector tubes and/or preservative tubes Omnigene-Gut OMR-200 GenoTeck®. After verification and identification, all samples were aliquoted and stored at −80°C until processing.
Questionnaires' application
We applied questionnaires for clinical follow-up on a monthly basis. The questionnaires contained questions about clinical state of the babies and their respective mothers observed in the period between collections, such as occurrences of viral conditions, infections, diet and habits, in addition to information about development and gestational and postpartum occurrences (weight, hospitalizations, use of antibiotics, etc.)
DNA extraction and quantification
We extracted the bacterial DNA using the commercial QIAmp DNA Stool Mini Kit (QIAGEN®, UK). The processing was carried out in accordance with the manufacturer's instructions. The extracted bacterial DNA was quantified by fluorimetric quantification using Qubit Assay (ThermoFisher Scientific, Ireland) or Quant-iT ™ PicoGreen ™ dsDNA (ThermoFisher Scientific, Ireland) and the absorbance in NanoDrop ND-1000 Visible UV Spectrophotometer (ThermoFisher Scientific, Ireland). The bacterial DNA extracted was analyzed for their degree of purity, based on the ratios 280 / 260nm and 260 / 230nm in NanoDrop ND-1000 Visible UV Spectrophotometer (ThermoFisher Scientific, Ireland). After quality checking, the samples were stored in a freezer at −20°C or −80°C until used.
16S rRNA amplicon sequencing
The samples of bacterial DNA extracted and purified from the babies' and mothers' feces, positive for 16S gene in conventional PCR, were sequenced on the Platforms MiSeqTM 2500 from Illumina. For the assembly and preparation sequencing library, we used primers 341F (CCT ACG GGA GGC AGC AG) and 806R (GGA CTA CHV GGG TAT CTA AT) – both of them with an adapter overhang - for V3 and V4 regions' amplification of 16S gene. We normalized all samples and the pooling for 4nM, and the pooling was sequenced at 12pM with 20% PhiX as Control also at 12pM with 500 cycles per run. The instructions and reagents lists were obtained from the “16S Metagenomic Sequencing Library Preparation protocol (Part #15044223 Rev. B)” provided by Illumina Inc.
Quantification and Statistical Analysis
We processed the forward 16S reads with QIIME2 2019.10 (Bolyen et al., 2019) filtering out the raw reads whose Phred quality scores were lower than 20 with plugin quality-filter q-score (Bokulich et al., 2013). We used Deblur (Amir et al., 2017) for amplicon sequence variant (ASV) assignment, truncating all reads at length 230 bp. Generation of the phylogenetic tree was performed with plugin q2-phylogeny; multiple alignments were generated with MAFFT (Katoh et al., 2002) and the tree was inferred with fasttree2 (Price et al., 2010). We normalized the data by rarefying to 10,000 read sampling depth without replacement before the diversity analysis. Alpha diversities (Shannon index, Faith diversity (Faith, 1992) and Observed ASVs) were calculated within the pipeline QIIME2 with default settings, and beta diversity analyses (Jaccard distance, Bray Curtis dissimilarity, weighted and unweighted UniFrac (Lozupone and Knight, 2005; Lozupone et al., 2007)) were performed with the R package phyloseq version 1.36.0 (McMurdie and Holmes, 2013). Alpha rarefaction curves were obtained with 10 steps in ggrare. We used SPINGO version 11.2 (Allard et al., 2015) and RDP classifier version 2.12 (Wang et al., 2007) with at least 85% identity for taxonomic classification, on RDP version 11.5 (Cole et al., 2014). We kept only those classifications that presented the same results from both programs. Species-level classifications were obtained from SPINGO only. Histograms for both Phyla and Genus relative abundance were created with the R package ggplot2 version 3.3.3 (Wickham, 2016) in the QIIME2 pipeline. Principal Coordinate Analysis (PCoA) was calculated on the four beta diversity measures mentioned above with the R package phyloseq version 1.36.0 and ellipses were calculated by ggforce:: geom_mark_ellipse.
We counted and identified ASVs in each member of the sets and descriptively compared common ASVs between the groups of monozygotic twins and their dizygotic co-twins. Visualization of the common ASVs was made with Venn diagrams using the R package VennDiagram version 1.6.17. In order to check whether the fractions of ASVs in the Venn Diagram were significantly larger in MZs, we applied the following multinomial model:
where p is the estimated probability of sharing ASVs between 1) MZ1 and MZ2, 2) MZ1 and DZ, 3) MZ2 and DZ in each set, and is the sum of all estimated probabilities in the Venn Diagram in the corresponding set. Overlapping of 95% confidence intervals (Goodman method) for the probabilities of occurrence were calculated with the function GM and p-values calculated with the function pchisq; both functions from CoinMinD R package. We adopted alpha = 0.05.
Permutation tests on alpha and beta diversities were performed to check for statistical significance based on alpha = 0.05. We used as models (y.m1-y.m2)-((y.m1-y.d)+(y.m2-y.d))/2 for alpha diversities and (y.m1m2)-((y.m1d)+(ym2d))/2 for beta diversities, where y is the mean or the median of the values of the measures (Shannon, Faith, Observed ASVs, Jaccard, Bray Curtis, weighted and unweighted UniFrac); m1 is the value of monozygotic twin 1; m2 is the value of the monozygotic twin 2; d is the value of the dizygotic twin; m1m2 is the distance/dissimilarity between monozygotic twin 1 and monozygotic twin 2; m1d is the distance/dissimilarity between monozygotic twin 1 and dizygotic twin; m2d is the distance/dissimilarity between monozygotic twin 2 and dizygotic twin. The model calculates the differences between the groups considering the relationship between monozygotic-monozygotic twins and monozygotic-dizygotic twins. Since our sets are unbalanced, we also used the models set((y.m1 + y.m2)/2 - y.d) for alpha diversity and set(ym1m2-(y.m1d + y.m2d)/2) for beta diversity, and calculated the mean or the median within the sets and between sets to take into account the longitudinal profile by set, i.e. calculations were done per set. Then, we permuted 10,000 times the original values of the groups m1, m2 and d (or m1m2, m1d, m2d) and sampled with replacement. P-values were obtained by calculating the number of times the mean or median from our models was present within the distribution generated by the permutations. In other words, if the values from the models which considered the different relationships between the groups (m1, m2, d) were rarely (0.05 or lower) present in a randomized distribution, we concluded that there was a significant difference between the monozygotic and dizygotic groups.
Correspondence analysis (CA) in each set was performed in R studio. We used the absolute abundance of ASVs present in each set to check for associations between the ASVs and the samples. First, we performed the CA with the 50 most abundant ASVs in each set allowing for clear visualization on the graph and avoiding overlap of variables that would make it difficult to read. We applied the function fviz_ca_biplot from the R package factoextra (version 1.0.5) setting the map to rowprincipal which generates an asymmetric plot with rows (samples) in the principal coordinates and columns (variables - ASVs) in standard coordinates, i.e, samples with similar abundance cluster together and the variables that contribute to the clustering are positioned in a low angle with the samples revealing their associations. Then, we computed Person's chi square test with simulated p-value based on 2,000 replicates to overcome the problem of very low expected values or zeros on the dataset. Since the contingency tables of all sets had a large sample size (N > 450 cells), we calculated the coefficient of contingency by:
We performed the CA again later with those 50 most abundant ASVs adding all the ASVs whose heritability (explained below) was significant, regardless of their abundance. We selected time points 9, 11 and 13 where we noticed clusterization from previous CA and where the heritability tests were applied. Here, we calculated the log2 likelihood ratio (ratio = observed value/expected value) as an index to interpret the association between the samples and the ASVs (Figure S4).
Heritability tests were applied to sets A,B,D and E at time points 9, 11 and 13, and it was made by testing H0: = 0 against H1: > 0 through the likelihood ratio statistic, which is asymptotically distributed as a 1/2:1/2 mixture of Chi-square with 0 and 1 degree of freedom. SOLAR (Sequential Oligogenic Linkage Analysis Routines) Eclipse version software package version 8.5.1 (beta) (Kochunov et al., 2015) (http://www.solar-eclipse-genetics.org/) was used for the test with default settings. SOLAR software applies variance component models under maximum likelihood estimation approach using the following matrix to take into account family dependence among individuals:
where omega Ω is the covariance matrix for a pedigree of individuals, Φ is the kinship matrix of pair-wise kinship coefficient among all individuals, is the genetic variance component due to additive genetic factors, I is the identity matrix, and is the variance component due to specific environmental effects of each individual, such that
is the narrow sense heritability and is the total phenotypic variance (Kochunov et al., 2015).
We first excluded from our analysis ASVs that were not present in 50% of samples of those sets at those time points. Then, we filtered in, per time point, ASVs that were present in at least 3 sets and at least in one monozygotic and dizygotic co-twin in each set. The phenotype file containing relative abundance responses was input into the software and normalized with inorm before the heritability test. Environmental factors such as diet, antibiotic intake, diseases and milestones (crawling and walking) were registered for each set of triplets, however, those variables could not be tested for heritability because there were very few variabilities, that is, the babies presented very similar profiles within the sets and between the sets. The phenotype sex was modelled as covariate in the adjusted models. Graph comparing heritability estimates was generated in R package ggplot2.
Acknowledgments
We thank the sample donors and their caregivers for donating their samples for this study. We thank Layla Farage Martins and Aline Maria da Silva from the Center for Advanced Technologies in Genomics, Institute of Chemistry, University of São Paulo, for guidance on amplicon library construction and Illumina sequencing. We also thank Carla Taddei de Castro Neves, Andrew Maltez Thomas, Suzana Guima, and Carlos Morais for technical assistance. Use of SOLAR software was possible thanks to NIH R01EB015611 grant to Peter Kochunov. J.C.S was supported in part by a CNPq senior researcher fellowship. O.P. was supported by a CNPq fellowship (Grant number: 381502/2018-0). L.R.B.M. was supported by a CNPq fellowship (Grant number: 381304/2018-3). Funding sources: CEPID-FAPESP: (CEGH-CELL); 2013-2024 (Grant number: 2013/08028-1), INSTITUTO NACIONAL DE CIÊNCIA E TECNOLOGIA (INCT) (Grant number: 465355/2014-5), and INCT-FAPESP: Temático-INCT: Grant number 14/50931-3.
Author contributions
Conceptualization: O.P., L.R.B.M., M.S.N., H.M.S.B., J.P.S., J.C.S., and M.Z.; sample acquisition: L.R.B.M. and M.S.N.; data curation: O.P., L.R.B.M., and M.S.N.; computational analysis: O.P. and J.C.S.; statistical analysis: O.P. and J.P.S.; results interpretation: O.P., L.R.B.M., M.S.N., H.M.S.B., J.P.S., J.C.S., and M.Z.; funding acquisition: M.Z.; project administration: L.R.B.M., M.S.N., J.C.S., and M.Z.; writing – original draft: O.P.; writing – review & editing: O.P., L.R.B.M., M.S.N., H.M.S.B., J.P.S., J.C.S., and M.Z. All authors read and approved the final manuscript.
Declaration of interests
The authors declare no competing interests.
Published: March 18, 2022
Footnotes
Supplemental information can be found online at https://doi.org/10.1016/j.isci.2022.103861.
Contributor Information
João C. Setubal, Email: setubal@iq.usp.br.
Mayana Zatz, Email: mayazatz@usp.br.
Supplemental information
Data and code availability
-
•
All fastq-format reads analyzed have been deposited and are publicly available at the National Center for Biotechnology Information BioSample database. The key resources table lists all Accession Numbers.
-
•
This paper does not report original code.
-
•
Any additional information required to reanalyze the data reported in this paper is available from the lead contact upon request.
References
- Allard G., Ryan F.J., Jeffery I.B., Claesson M.J. SPINGO: a rapid species-classifier for microbial amplicon sequences. BMC Bioinformatics. 2015;16:324. doi: 10.1186/s12859-015-0747-1. [DOI] [PMC free article] [PubMed] [Google Scholar]
- Amir A., Mcdonald D., Navas-Molina J.A., Kopylova E., Morton J.T., Zech Xu Z., Kightley E.P., Thompson L.R., Hyde E.R., Gonzalez A., et al. Deblur rapidly resolves single-nucleotide community sequence patterns. mSystems. 2017;2 doi: 10.1128/msystems.00191-16. e00191–16. [DOI] [PMC free article] [PubMed] [Google Scholar]
- Azad M.B., Konya T., Maughan H., Guttman D.S., Field C.J., Chari R.S., Sears M.R., Becker A.B., Scott J.A., Kozyrskyj A.L. Gut microbiota of healthy Canadian infants: profiles by mode of delivery and infant diet at 4 months. Can. Med. Assoc. J. 2013;185:385–394. doi: 10.1503/cmaj.121189. [DOI] [PMC free article] [PubMed] [Google Scholar]
- Blekhman R., Goodrich J.K., Huang K., Sun Q., Bukowski R., Bell J.T., Spector T.D., Keinan A., Ley R.E., Gevers D., et al. Host genetic variation impacts microbiome composition across human body sites. Genome Biol. 2015;16:191. doi: 10.1186/s13059-015-0759-1. [DOI] [PMC free article] [PubMed] [Google Scholar]
- Bokulich N.A., Chung J., Battaglia T., Henderson N., Jay M., Li H., Lieber A.D., Wu F., Perez-Perez G.I., et al. Antibiotics, birth mode, and diet shape microbiome maturation during early life. Sci. Transl. Med. 2016;8:343ra82. doi: 10.1126/scitranslmed.aad7121. [DOI] [PMC free article] [PubMed] [Google Scholar]
- Bokulich N.A., Subramanian S., Faith J.J., Gevers D., Gordon J.I., Knight R., Mills D.A., Caporaso J.G. Quality-filtering vastly improves diversity estimates from Illumina amplicon sequencing. Nat. Methods. 2013;10:57–59. doi: 10.1038/nmeth.2276. [DOI] [PMC free article] [PubMed] [Google Scholar]
- Bolyen E., Rideout J.R., Dillon M.R., Bokulich N.A., Abnet C.C., Al-Ghalith G.A., Alexander H., Alm E.J., Arumugam M., Asnicar F., et al. Reproducible, interactive, scalable and extensible microbiome data science using QIIME 2. Nat. Biotechnol. 2019;37:852–857. doi: 10.1038/s41587-019-0209-9. [DOI] [PMC free article] [PubMed] [Google Scholar]
- Brandt K., Taddei C.R., Takagi E.H., Oliveira F.F., Duarte R.T.D., Irino I., Martinez M.B., Carneiro-Sampaio M. Establishment of the bacterial fecal community during the first month of life in Brazilian newborns. Clinics (Sao Paulo) 2012;67:113–123. doi: 10.6061/clinics/2012(02)05. [DOI] [PMC free article] [PubMed] [Google Scholar]
- Chew C., Barros K.V., Weffort V.R.S., Maranhão H.D.S., Laranjeira M., Knol J., Roeselers G., De Morais M.B. Gut microbiota of young children living in four Brazilian cities. Front. Pediatr. 2020;8:573815. doi: 10.3389/fped.2020.573815. [DOI] [PMC free article] [PubMed] [Google Scholar]
- Cole J.R., Wang Q., Fish J.A., Chai B., Mcgarrell D.M., Sun Y., Brown C.T., Porras-Alfaro A., Kuske C.R., Tiedje J.M. Ribosomal Database Project: data and tools for high throughput rRNA analysis. Nucleic Acids Res. 2014;42:D633–D642. doi: 10.1093/nar/gkt1244. [DOI] [PMC free article] [PubMed] [Google Scholar]
- Davenport E.R., Cusanovich D.A., Michelini K., Barreiro L.B., Ober C., Gilad Y. Genome-wide association studies of the human gut microbiota. PLoS One. 2015;10:e0140301. doi: 10.1371/journal.pone.0140301. [DOI] [PMC free article] [PubMed] [Google Scholar]
- Faith D.P. Conservation evaluation and phylogenetic diversity. Biol. Conserv. 1992;61:1–10. doi: 10.1016/0006-3207(92)91201-3. [DOI] [Google Scholar]
- Gomez A., Espinoza J.L., Harkins D.M., Leong P., Saffery R., Bockmann M., Torralba M., Kuelbs C., Kodukula R., Inman J., et al. Host genetic Control of the oral microbiome in health and disease. Cell Host Microbe. 2017;22:269–278.e3. doi: 10.1016/j.chom.2017.08.013. [DOI] [PMC free article] [PubMed] [Google Scholar]
- Goodrich J.K., Davenport E.R., Beaumont M., Jackson M.A., Knight R., Ober C., Spector T.D., Bell J.T., Clark A.G., Ley R.E. Genetic determinants of the gut microbiome in UK twins. Cell Host Microbe. 2016;19:731–743. doi: 10.1016/j.chom.2016.04.017. [DOI] [PMC free article] [PubMed] [Google Scholar]
- Goodrich J.K., Waters J.L., Poole A.C., Sutter J.L., Koren O., Blekhman R., Beaumont M., Treuren W.V., Knight R., Bell J.T., et al. Human genetics shape the gut microbiome. Cell. 2014;159:789–799. doi: 10.1016/j.cell.2014.09.053. [DOI] [PMC free article] [PubMed] [Google Scholar]
- Grieneisen L., Dasari M., Gould T.J., Björk J.R., Grenier J.-C., Yotova V., Jansen D., Gottel N., Gordon J.B., Learn N.H., et al. Gut microbiome heritability is nearly universal but environmentally contingent. Science. 2021;373:181. doi: 10.1126/science.aba5483. [DOI] [PMC free article] [PubMed] [Google Scholar]
- Hansen E.E., Lozupone C.A., Rey F.E., Wu M., Guruge J.L., Narra A., Goodfellow J., Zaneveld J.R., Mcdonald D.T., Goodrich J.A., et al. Pan-genome of the dominant human gut-associated archaeon, Methanobrevibacter smithii, studied in twins. Proc. Natl. Acad. Sci. U S A. 2011;108:4599–4606. doi: 10.1073/pnas.1000071108. [DOI] [PMC free article] [PubMed] [Google Scholar]
- Hesla H.M., Stenius F., Jäderlund L., Nelson R., Engstrand L., Alm J., Dicksved J. Impact of lifestyle on the gut microbiota of healthy infants and their mothers – the ALADDIN birth cohort. Fems Microbiol. Ecol. 2014;90:791–801. doi: 10.1111/1574-6941.12434. [DOI] [PubMed] [Google Scholar]
- Hill C.J., Lynch D.B., Murphy K., Ulaszewska M., Jeffery I.B., O'shea C.A., Watkins C., Dempsey E., Mattivi F., Tuohy K., et al. Evolution of gut microbiota composition from birth to 24 weeks in the INFANTMET Cohort. Microbiome. 2017;5:4. doi: 10.1186/s40168-016-0213-y. [DOI] [PMC free article] [PubMed] [Google Scholar]
- Johnson J.S., Spakowicz D.J., Hong B.-Y., Petersen L.M., Demkowicz P., Chen L., Leopold S.R., Hanson B.M., Agresta H.O., Gerstein M.J.N.C. Evaluation of 16S rRNA gene sequencing for species and strain-level microbiome analysis. Nat. Commun. 2019;10:1–11. doi: 10.1038/s41467-019-13036-1. [DOI] [PMC free article] [PubMed] [Google Scholar]
- Katoh K., Misawa K., Kuma K.I., Miyata T. MAFFT: a novel method for rapid multiple sequence alignment based on fast Fourier transform. Nucleic Acids Res. 2002;30:3059–3066. doi: 10.1093/nar/gkf436. [DOI] [PMC free article] [PubMed] [Google Scholar]
- Kochunov P., Jahanshad N., Marcus D., Winkler A., Sprooten E., Nichols T.E., Wright S.N., Hong L.E., Patel B., Behrens T., et al. Heritability of fractional anisotropy in human white matter: a comparison of Human Connectome Project and ENIGMA-DTI data. Neuroimage. 2015;111:300–311. doi: 10.1016/j.neuroimage.2015.02.050. [DOI] [PMC free article] [PubMed] [Google Scholar]
- Lozupone C., Knight R. UniFrac: a new phylogenetic method for comparing microbial communities. Appl. Environ. Microbiol. 2005;71:8228. doi: 10.1128/AEM.71.12.8228-8235.2005. [DOI] [PMC free article] [PubMed] [Google Scholar]
- Lozupone C.A., Hamady M., Kelley S.T., Knight R. Quantitative and qualitative β diversity measures lead to different insights into factors that structure microbial communities. Appl. Environ. Microbiol. 2007;73:1576. doi: 10.1128/AEM.01996-06. [DOI] [PMC free article] [PubMed] [Google Scholar]
- Mcgeachie M.J., Sordillo J.E., Gibson T., Weinstock G.M., Liu Y.Y., Gold D.R., Weiss S.T., Litonjua A. Longitudinal prediction of the infant gut microbiome with dynamic Bayesian networks. Sci. Rep. 2016;6:20359. doi: 10.1038/srep20359. [DOI] [PMC free article] [PubMed] [Google Scholar]
- Mcmurdie P.J., Holmes S. Phyloseq: an R package for reproducible interactive analysis and graphics of microbiome census data. PLoS One. 2013;8:e61217. doi: 10.1371/journal.pone.0061217. https://10.1371/journal.pone.0061217 [DOI] [PMC free article] [PubMed] [Google Scholar]
- Murphy K., O' Shea C.A., Ryan C.A., Dempsey E.M., O' Toole P.W., Stanton C., Ross R.P. The gut microbiota composition in dichorionic triplet sets suggests a role for host genetic factors. PLoS One. 2015;10:e0122561. doi: 10.1371/journal.pone.0122561. [DOI] [PMC free article] [PubMed] [Google Scholar]
- Price M.N., Dehal P.S., Arkin A.P. FastTree 2 – approximately maximum-likelihood trees for large alignments. PLoS One. 2010;5:e9490. doi: 10.1371/journal.pone.0009490. [DOI] [PMC free article] [PubMed] [Google Scholar]
- Rothschild D., Weissbrod O., Barkan E., Kurilshikov A., Korem T., Zeevi D., Costea P.I., Godneva A., Kalka I.N., Bar N., et al. Environment dominates over host genetics in shaping human gut microbiota. Nature. 2018;555:210–215. doi: 10.1038/nature25973. [DOI] [PubMed] [Google Scholar]
- Santos I.K.S.D., Conde W.L. Tendência de padrões alimentares entre adultos das capitais brasileiras. Rev. Bras. Epidemiol. 2020;23:e200035. doi: 10.1590/1980-549720200035. [DOI] [PubMed] [Google Scholar]
- Scheiman J., Luber J.M., Chavkin T.A., MacDonald T., Tung A., Pham L.D., Wibowo M.C., Wurth R.C., Punthambaker S., Tierney B.T., et al. Meta-omics analysis of elite athletes identifies a performance-enhancing microbe that functions via lactate metabolism. Nat. Med. 2019;25:1104–1109. doi: 10.1038/s41591-019-0485-4. [DOI] [PMC free article] [PubMed] [Google Scholar]
- Singh R.K., Chang H.-W., Yan D., Lee K.M., Ucmak D., Wong K., Abrouk M., Farahnik B., Nakamura M., Zhu T.H., et al. Influence of diet on the gut microbiome and implications for human health. J. Transl. Med. 2017;15:73. doi: 10.1186/s12967-017-1175-y. [DOI] [PMC free article] [PubMed] [Google Scholar]
- Stewart C.J., Ajami N.J., O’brien J.L., Hutchinson D.S., Smith D.P., Wong M.C., Ross M.C., Lloyd R.E., Doddapaneni H., Metcalf G.A., et al. Temporal development of the gut microbiome in early childhood from the TEDDY study. Nature. 2018;562:583–588. doi: 10.1038/s41586-018-0617-x. [DOI] [PMC free article] [PubMed] [Google Scholar]
- Stewart C.J., Marrs E.C.L., Nelson A., Lanyon C., Perry J.D., Embleton N.D., Cummings S.P., Berrington J.E. Development of the preterm gut microbiome in twins at risk of necrotising enterocolitis and sepsis. PLoS One. 2013;8:e73465. doi: 10.1371/journal.pone.0073465. [DOI] [PMC free article] [PubMed] [Google Scholar]
- Stewart J.A., Chadwick V.S., Murray A. Investigations into the influence of host genetics on the predominant eubacteria in the faecal microflora of children. J. Med. Microbiol. 2005;54:1239–1242. doi: 10.1099/jmm.0.46189-0. [DOI] [PubMed] [Google Scholar]
- Tabrett A., Horton M.W. The influence of host genetics on the microbiome. F1000Res. 2020;5:F1000. doi: 10.12688/f1000research.20835.1. [DOI] [PMC free article] [PubMed] [Google Scholar]
- Taddei C.R., Oliveira F.F., Duarte R.T.D., Talarico S.T., Takagi E.H., Carvalho I.I.R., Gomes F.M.S., Brandt K., Martinez M.B. High abundance of Escherichia during the establishment of fecal microbiota in Brazilian children. Microb. Ecol. 2014;67:624–634. doi: 10.1007/s00248-014-0381-x. [DOI] [PubMed] [Google Scholar]
- Turnbaugh P.J., Hamady M., Yatsunenko T., Cantarel B.L., Duncan A., Ley R.E., Sogin M.L., Jones W.J., Roe B.A., Affourtit J.P., et al. A core gut microbiome in obese and lean twins. Nature. 2009;457:480–484. doi: 10.1038/nature07540. [DOI] [PMC free article] [PubMed] [Google Scholar]
- Van Den Bogert B.M.M., Zoetendal E., Wells J., Kleerebezem M. Immunomodulatory properties of Streptococcus and Veillonella isolates from the human small intestine microbiota. PLoS One. 2014;9:e114277. doi: 10.1371/journal.pone.0114277. [DOI] [PMC free article] [PubMed] [Google Scholar]
- Wang Q., Garrity G.M., Tiedje J.M., Cole J.R. Naïve Bayesian classifier for rapid assignment of rRNA sequences into the new bacterial taxonomy. Appl. Environ. Microbiol. 2007;73:5261. doi: 10.1128/AEM.00062-07. [DOI] [PMC free article] [PubMed] [Google Scholar]
- Wexler H.M. Bacteroides: the good, the bad, and the nitty-gritty. Clin. Microbiol. Rev. 2007;20:593–621. doi: 10.1128/CMR.00008-07. [DOI] [PMC free article] [PubMed] [Google Scholar]
- Wickham H. Springer-Verlag; 2016. ggplot2: Elegant Graphics for Data Analysis. [Google Scholar]
- Xie H., Guo R., Zhong H., Feng Q., Lan Z., Qin B., Ward K.J., Jackson M.A., Xia Y., Chen X., et al. Shotgun metagenomics of 250 adult twins reveals genetic and environmental impacts on the gut microbiome. Cell Syst. 2016;3:572–584.e3. doi: 10.1016/j.cels.2016.10.004. [DOI] [PMC free article] [PubMed] [Google Scholar]
- Xu F., Fu Y., Sun T.-Y., Jiang Z., Miao Z., Shuai M., Gou W., Ling C.-W., Yang J., Wang J., et al. The interplay between host genetics and the gut microbiome reveals common and distinct microbiome features for complex human diseases. Microbiome. 2020;8:145. doi: 10.1186/s40168-020-00923-9. [DOI] [PMC free article] [PubMed] [Google Scholar]
- Yassour M., Vatanen T., Siljander H., Hamalainen A.M., Harkonen T., Ryhanen S.J., Franzosa E.A., Vlamakis H., Huttenhower C., Gevers D., et al. Natural history of the infant gut microbiome and impact of antibiotic treatment on bacterial strain diversity and stability. Sci. Transl. Med. 2016;8:343ra81. doi: 10.1126/scitranslmed.aad0917. [DOI] [PMC free article] [PubMed] [Google Scholar]
- Yatsunenko T., Rey F.E., Manary M.J., Trehan I., Dominguez-Bello M.G., Contreras M., Magris M., Hidalgo G., Baldassano R.N., Anokhin A.P., et al. Human gut microbiome viewed across age and geography. Nature. 2012;486:222–227. doi: 10.1038/nature11053. [DOI] [PMC free article] [PubMed] [Google Scholar]
- Zhou S.M., Xu R.H., He F.S., Zhou J.X., Wang Y., Zhou J.L., Wang M.B., Zhou W.H. Diversity of gut microbiota metabolic pathways in 10 pairs of Chinese infant twins. PLoS One. 2016;11:e0161627. doi: 10.1371/journal.pone.0161627. [DOI] [PMC free article] [PubMed] [Google Scholar]
- Zhu A., Sunagawa S., Mende D.R., Bork P. Inter-individual differences in the gene content of human gut bacterial species. Genome Biol. 2015;16:82. doi: 10.1186/s13059-015-0646-9. [DOI] [PMC free article] [PubMed] [Google Scholar]
- Zoetendal E.G., Akkermansia A.D.L., Vliet W.M.A.-V., Visser J.a.G.M.D., Vos W.M.D. The host genotype Affects the bacterial community in the human gastronintestinal tract. Microb. Ecol. Health Dis. 2001;13:129–134. doi: 10.1080/089106001750462669. [DOI] [Google Scholar]
Associated Data
This section collects any data citations, data availability statements, or supplementary materials included in this article.
Supplementary Materials
Data Availability Statement
-
•
All fastq-format reads analyzed have been deposited and are publicly available at the National Center for Biotechnology Information BioSample database. The key resources table lists all Accession Numbers.
-
•
This paper does not report original code.
-
•
Any additional information required to reanalyze the data reported in this paper is available from the lead contact upon request.