

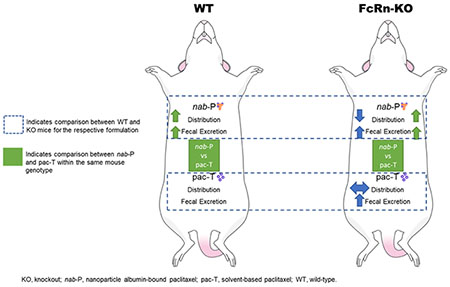
Abstract
nab-Paclitaxel (nab-P), an albumin-bound formulation of paclitaxel, was developed to improve the tolerability and antitumor activity of taxanes. The neonatal Fc receptor (FcRn) is a transport protein that can bind to albumin and regulate the homeostasis of circulating albumin. Therefore, the pharmacokinetics and pharmacodynamics of nab-P may be impacted by FcRn expression. This study aimed to investigate the effects of FcRn on nab-P elimination and distribution to targeted tissues. Wild-type and FcRn-knockout (FcRn-KO) mice were treated with nab-P, mouse-specific nab-P (distribution experiments only), and solvent-based paclitaxel (pac-T). Blood and tissue samples were collected for distribution analyses. Organ, urine, and fecal samples were collected for elimination analyses. The nab-P tissue penetration in the pancreas, fat pad, and kidney of wild-type mice, as reflected by the ratio of tissue/plasma concentration, was significantly higher (ranging from 5 to 80 fold) than that of FcRn-KO mice. In contrast, the tissue penetration of pac-T in these organs of FcRn-KO mice was similar to that of wild-type mice. More importantly, the excretion of nab-P in feces of FcRn-KO mice (45–68%) was significantly higher than that of wild-type mice (26–46%) from 8 to 48 h post treatment. In comparison, the difference of excretion of pac-T in feces between FcRn-KO mice and wild-type mice was smaller than that of nab-P. Furthermore, greater tissue penetration and fecal excretion were observed with nab-P than pac-T in both FcRn-KO and wild-type mice. These findings suggest that FcRn enhances the tissue distribution and penetration of nab-P in the targeted organs, while FcRn prevents excretion of nab-P to feces in the intestinal lumen. The findings support the notion that albumin nanoparticle delivery alters drug distribution and elimination through an FcRn-mediated process to impact drug efficacy and toxicity.
Keywords: albumin-bound paclitaxel, paclitaxel, FcRn, tissue distribution, pharmacokinetics, elimination
Graphical Abstract
INTRODUCTION
Taxanes are mitotic inhibitors that induce cell death by disrupting microtubule dynamics and have demonstrated activity against a broad range of cancers.1–7 Paclitaxel is formulated with polyoxyethylated castor oil (Kolliphor EL, formerly Cremophor EL; BASF, Ludwigshafen, Germany),8 which improves the solubility, but it is a vehicle that may contribute to adverse effects, including neuropathy and hypersensitivity. Similarly, some adverse effects associated with docetaxel may be linked to the polysorbate 80 (Tween 80) solvent.9–11 In addition, because Kolliphor EL micelles trap paclitaxel, the solvent may alter the pharmacokinetic and pharmacodynamic properties of paclitaxel.12–14
Additional formulations of taxanes have been investigated using a variety of carrier systems, including polymeric nanoparticles, micelles, and bioconjugates.10,11,15,16 To date, the only alternative paclitaxel formulation approved in the United States is nanoparticle albumin-bound paclitaxel [Abraxane; Celgene Corporation, Summit, NJ, USA; nab-Paclitaxel (nab-P)], a solvent-free formulation in which paclitaxel is bound to human albumin with an average particle size of ≈130 nm.4 In the United States, nab-P is approved as monotherapy by the Food and Drug Administration for the treatment of metastatic breast cancer after relapse within 6 months of adjuvant chemotherapy or the failure of combination chemotherapy for metastatic disease.4 It is also indicated for the first-line treatment of metastatic pancreatic adenocarcinoma (in combination with gemcitabine) and locally advanced or metastatic non-small cell lung cancer (in combination with carboplatin) in patients who are not candidates for radiation therapy or curative surgery.
Compared with solvent-based paclitaxel (pac-T), nab-P has improved tolerability and antitumor activity.17,18 In a phase 3 trial of patients with metastatic breast cancer, nab-P had greater efficacy and a favorable safety profile versus pac-T.19 Such differences may be explained by the pharmacological properties of each formulation. Chen et al. characterized the population pharmacokinetics and pharmacodynamics of nab-P in patients with advanced or metastatic solid tumors using data from phase I–III clinical studies.20 The authors compared these data with previously published data on the pharmacokinetics and pharmacodynamics of pac-T21,22 and found that the albumin formulation impacted the elimination and distribution kinetics of paclitaxel, but did not change the intrinsic neutrophil cytotoxicity associated with paclitaxel.20 The albumin formulation resulted in faster and deeper distribution of paclitaxel versus pac-T as well as slower elimination,20–22 which may be related to the improved efficacy.
Because albumin homeostasis recycling is mediated by the neonatal Fc receptor (FcRn), the pharmacokinetic and pharmacodynamic properties of nab-P may be impacted by FcRn, which is widely expressed across many cell types.23 FcRn binds albumin and is critical to the homeostatic regulation of circulating proteins as well as to the transport and phagocytosis of immunoglobulin G.24,25 However, the role of FcRn in regulating nab-P tissue distribution and elimination is unclear. To our knowledge, no studies have investigated the nature of the FcRn and nab-P interaction. Identifying any relationship between FcRn and nab-P pharmacokinetics (especially tissue distribution and elimination) may have clinical implications for efficacy and toxicity. To explore the impact of the relationship between FcRn and nab-P, the current study investigated nab-P distribution and elimination in wild-type and FcRn-knockout (FcRn-KO) mice after administration of different paclitaxel formulations.
METHODS
Chemicals and Reagents.
nab-P and mouse-specific nab-P (m-nab-P) were supplied by Celgene Corporation (Summit, NJ, USA), and pac-T was purchased from the University of Michigan Hospital (Hospira Inc, Lake Forest, IL, USA). Paclitaxel and docetaxel powder were procured from Thermo Fisher Scientific (Waltham, MA, USA). Liquid chromatography–mass spectrometry (LC–MS) grade acetonitrile was purchased from Sigma-Aldrich (St. Louis, MO, USA). Formic acid (98%; LC–MS grade) was obtained from Fluka (Morris Plains, NJ, USA). A Milli-Q water system from Millipore (Bedford, MA, USA) was used to obtain ultrapure deionized water.
Stock Solutions, Working Solutions, and Quality Control Samples.
Paclitaxel and docetaxel (internal standard) were individually weighed and dissolved in acetonitrile to 9 mg/mL stock solutions and then stored at −20 °C. The paclitaxel stock solution was then diluted with acetonitrile to a series of working solutions from 2.44 to 5000 ng/mL. The quality control working solutions at low, medium, and high concentrations were prepared using a separately prepared stock solution. For sample preparation, the docetaxel stock solution was diluted to 1000 ng/mL with acetonitrile. Quality control samples were evenly distributed among samples from each batch.
Sample Preparation.
Plasma (40 μL) was dispensed into a Fisher Scientific 96-well plate (Hampton, NH, USA), to which 40 μL of ice-cold acetonitrile (100%) and 120 μL of internal standard solution (1000 ng/mL docetaxel) were added. Next, the plate was vortexed for 10 min. The plate was then centrifuged at 3500 revolutions per minute (RPM) for 10 min at 4 °C to precipitate the protein. LC–tandem MS (LC–MS/MS) was used to analyze 5 μL of the supernatant. The blood samples were sonicated prior to being transferred to the 96-well plates. Tissue samples were weighed and suspended in 20% acetonitrile (80% water; 1:5 w/v). The samples were then homogenized 4 times for 20 s each time at 6500 RPM in a Precellys Evolution system (Montigny-le-Bretonneux, France). For LC–MS/MS analysis, the paclitaxel in blood and tissue homogenates was extracted from the samples in the same manner as the paclitaxel in plasma. Prior to extraction, samples that were above the upper limit of qualification were diluted with the same matrix. Calibrator-standard samples and quality control samples were prepared by mixing 40 μL of the blank bio matrix, 40 μL of working solution, and 120 μL of internal standard solution.
Calibration Curve.
Analytical curves were made with 12 nonzero standards by plotting the peak area ratio of paclitaxel to the internal standard versus the concentration. The curve was created with linear regression and weighted (1/X2). The correlation coefficient demonstrated the linearity of the relationship between peak area ratio and concentration.
Liquid Chromatography Tandem–Mass Spectrometry.
The concentrations of paclitaxel and paclitaxel metabolites were determined with a Sciex AB-5500 Qtrap (Concord, ON, Canada) mass spectrometer with an electrospray ionization source, interfaced with a Shimadzu high-performance LC system. The LC–MS/MS system was controlled with Analyst Software version 1.6 from Applied Biosystems (MDS SCIEX; Carlsbad, CA, USA); this was also used for acquisition and processing of data. Separation was performed on a Waters Xbridge C18 column (Milford, MA, USA) (50 × 2.1 mm ID, 3.5 μm); the flow rate was 0.4 mL/min. A (100% H2O with 0.1% formic acid) and B (100% acetonitrile with 0.1% formic acid) comprised the mobile phase. The gradient began with 25% B for 30 s and then linearly increased to 65% B at 2 min. It increased to 95% B at 2.5 min, was maintained at 95% B for 2 min, decreased to 25% B at 5 min, and was maintained at 25% B for 2 min. The mass spectrometer was operated in positive mode; multiple reaction monitoring was used for analysis. The temperature of the gas was 300 °C, with an ion spray voltage of 5500 V. Gas 1 and gas 2 each had pressures of 60 pound-force per square inch (psi), and the pressure of the curtain gas was 30 psi. Table 1 summarizes the multiple reaction monitoring transitions.
Table 1.
Summary of the Multiple Reaction Monitoring Transitions for Paclitaxel and Docetaxela
| Q1 mass (Da) | Q3 mass (Da) | DP (V) | EP (V) | CE (V) | CCEP (V) | |
|---|---|---|---|---|---|---|
| paclitaxel | 854.40 | 286.10 | 190.00 | 14.00 | 21.00 | 13.00 |
| docetaxel (IS) | 808.00 | 226.00 | 173.00 | 12.90 | 18.80 | 13.90 |
| 6α,3′-p-dihydroxy paclitaxel | 886.50 | 525.20 | 37.95 | 11.69 | 18.05 | 6.68 |
| 6α-hydroxy paclitaxel | 870.30 | 525.20 | 20.35 | 4.03 | 21.77 | 6.08 |
| 3′-p-hydroxy paclitaxel | 870.30 | 569.20 | 52.13 | 7.79 | 15.47 | 6.16 |
CCEP, collision cell exit potential; CE, collision energy; DP, declustering potential; EP, entrance potential; IS, internal standard.
Pharmacokinetic Data Analysis.
The pharmacokinetic parameters of paclitaxel from nab-P, m-nab-P, and pac-T were calculated using Phoenix/WinNonlin (version 6.4; Pharsight, Mountain View, CA, USA). Concentration–time data were compiled and plotted using R software (version 3.4.1). The formulations’ efficiency of paclitaxel delivery was ascertained by comparing paclitaxel concentrations in plasma and tissues at each time point. The relative amount of paclitaxel was calculated in each tissue at each time point.
Animal Experiments.
Each animal experiment was performed in compliance with the University of Michigan guidelines regarding the humane care and use of animals in research. The experiments were approved by the University of Michigan Institutional Animal Care and Use Committee (IACUC). All mice (FcRn-KO:26 B6.129X1-Fcgrttm1Dcr/DcrJ with stock number 003982, wild-type: C57BL/6J with stock number 000664) were purchased from the Jackson Laboratory (Bar Harbor, ME, USA).
Experiment 1 analyzed paclitaxel distribution to plasma, blood, and 15 tissues (bone, brain, fat, fat pad, heart, intestine, kidney, liver, lung, muscle, pancreas, skin, spleen, stomach, and uterus) in the mice after administration of different paclitaxel formulations. Wild-type mice were divided into nab-P or pac-T treatment groups, and FcRn-KO mice were divided into nab-P, pac-T, or m-nab-P treatment groups. Taxane treatment was administered intravenously via tail vein at 10 mg/kg. This dose was chosen because it results in similar paclitaxel plasma concentrations in mice as the approved maximum doses of pac-T (175 mg/m2 over a 3 h infusion) and nab-P (260 mg/m2 over a 0.5 h infusion) result in humans.4,27,28
There were 39 mice in each treatment group. At 13 designated time points after administration (5, 10, 15, 30, 45 min, 1, 2, 4, 7, 16, 24, 48, and 72 h), 3 mice from each treatment group were euthanized with isoflurane. Blood was then immediately collected via cardiac puncture using a 25 G needle and 1 mL syringe pretreated with sodium heparin. Blood, plasma, and the 15 tissues were removed from the mice and extensively rinsed with phosphate-buffered saline (pH 7.4). The samples were then transferred to a Precellys CK28 Hard Tissue Homogenizing Kit. The samples were stored at −80 °C until analyzed by LC–MS/MS.
Experiment 2 compared the fecal excretion of paclitaxel in wild-type B6 mice and FcRn-KO mice, with each mouse type divided into nab-P or pac-T treatment groups. The dose of paclitaxel was 10 mg/kg, which was administered via the tail vein. Each treatment group consisted of 4 mice, which were housed in a metabolic cage. Feces were collected directly at designated intervals: 2, 4, 8, 12, 24, 36, and 48 h after paclitaxel administration. The fecal samples were homogenized in 20% acetonitrile (80% water; 1:10, w/v), aliquoted, and stored at −80 °C until analyzed by LC–MS/MS.
RESULTS
nab-P Has Similar Plasma and Blood Concentration in Both FcRn-KO Mice and Wild-Type Mice.
To study the role of FcRn in pharmacokinetics and tissue distribution of nab-P, we used FcRn-KO mice in comparison with wild-type mice. Figure 1 displays the paclitaxel concentrations in blood and plasma for each mouse genotype. Administration of pac-T resulted in higher blood and plasma paclitaxel concentrations than did nab-P in both wild-type and FcRn-KO mice. Immediately after administration of pac-T, plasma and blood concentrations of paclitaxel were lower in FcRn-KO mice than in wild-type B6 mice at early time points. For wild-type and FcRn-KO mice, nab-P administration resulted in similar plasma paclitaxel concentration time profiles. In addition, the plasma and blood paclitaxel concentrations in FcRn-KO mice were generally similar following m-nab-P or nab-P administration.
Figure 1.
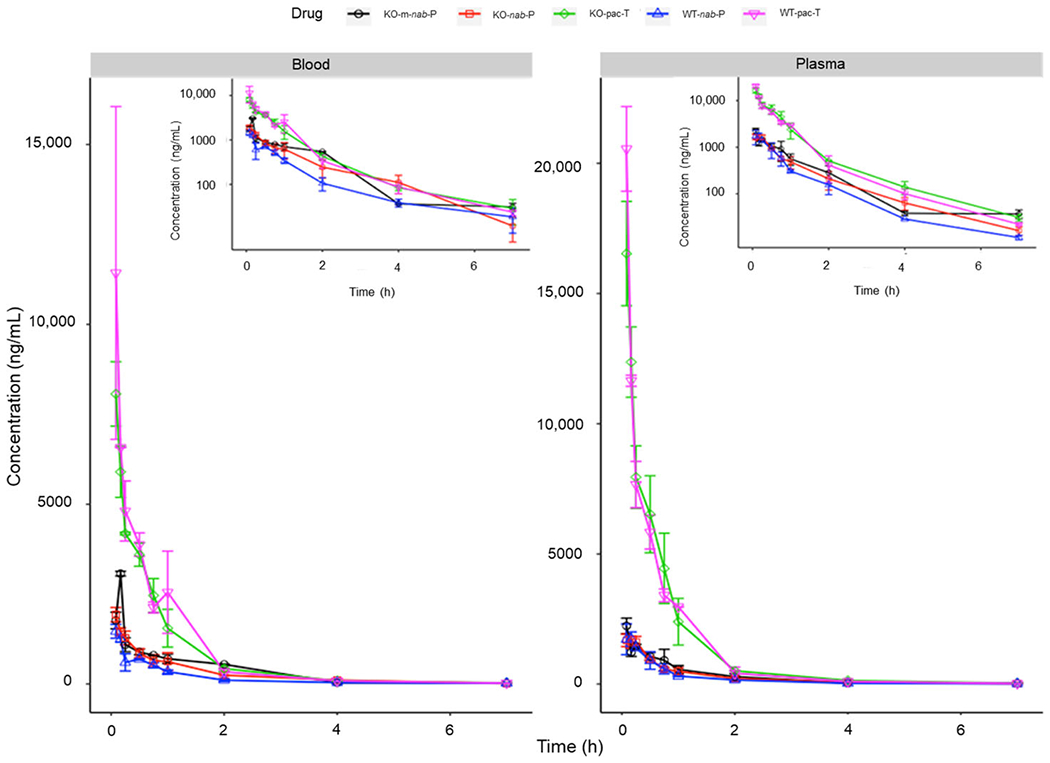
Blood and plasma concentrations of pac-T, nab-P, and m-nab-P in WT and FcRn-KO mice. FcRn; neonatal FcRn; KO, knockout; m-nab-P, mouse albumin nab-P; nab-P; nanoparticle albumin-bound paclitaxel; pac-T, solvent-based paclitaxel; WT, wild-type.
Differences in Tissue Distribution between nab-P Versus pac-T in FcRn-KO Mice Are Less Pronounced Than in Wild-Type Mice.
Overall, the differences in paclitaxel tissue concentrations after nab-P versus pac-T administration were less pronounced in FcRn-KO mice than in wild-type mice (Figure 2; Supporting Information Figure S1). Table S1 in the Supporting Information shows calculated mean maximum concentration (Cmax) in both mouse genotypes and Table S2 in the Supporting Information shows the area under the curve from time zero to the time of the last measurable concentration (AUClast) values for paclitaxel in both mouse genotypes.
Figure 2.
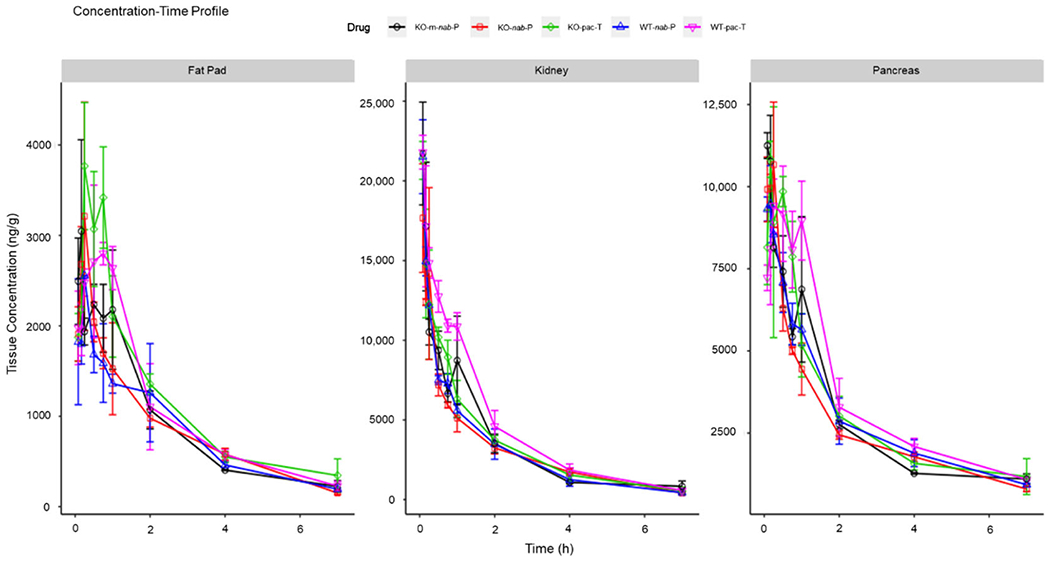
Concentration–time profiles of pac-T, nab-P, and m-nab-P in WT B6 and FcRn-KO mice in different tissues. FcRn; neonatal FcRn; KO, knockout; m-nab-P, mouse albumin nab-P; nab-P; nanoparticle albumin-bound paclitaxel; pac-T, solvent-based paclitaxel; WT, wild-type.
In FcRn-KO mice, the calculated mean Cmax and AUClast values with nab-P administration were lower or similar to those for pac-T in all tissues except liver and uterus. In contrast, in wild-type B6 mice, Cmax with nab-P administration was similar to that with pac-T in intestine, kidney, muscle, pancreas, and skin but was higher in the liver and stomach (Supporting Information Table S3). AUClast was higher with pac-T than with nab-P in most tissues but was similar in others, such as brain and heart (Supporting Information Table S4).
Between both mouse genotypes and among all paclitaxel formulations, paclitaxel was primarily distributed to blood, bone, intestine, muscle, skin, and liver (Figure 3A,B; Supporting Information Figure S2). In both genotypes of mice, the percentage of unchanged drug remaining in the blood was lower with nab-P administration than with pac-T administration, although the percentages were similar at early time points. The difference between the percentage of unchanged drug remaining in the blood with nab-P versus pac-T administration was less pronounced in FcRn-KO versus wild-type mice. Among mice that were administered nab-P, the amount of unchanged drug remaining in the blood was higher at later time points in FcRn-KO mice than that in wild-type mice. In contrast, after pac-T administration, unchanged drug remaining in the blood was lower in FcRn-KO mice than that in wild-type B6 mice at 2 h but became similar at 4 h (Figure 3). Taken together, these data suggest that FcRn may mediate nab-P tissue distributions.
Figure 3.
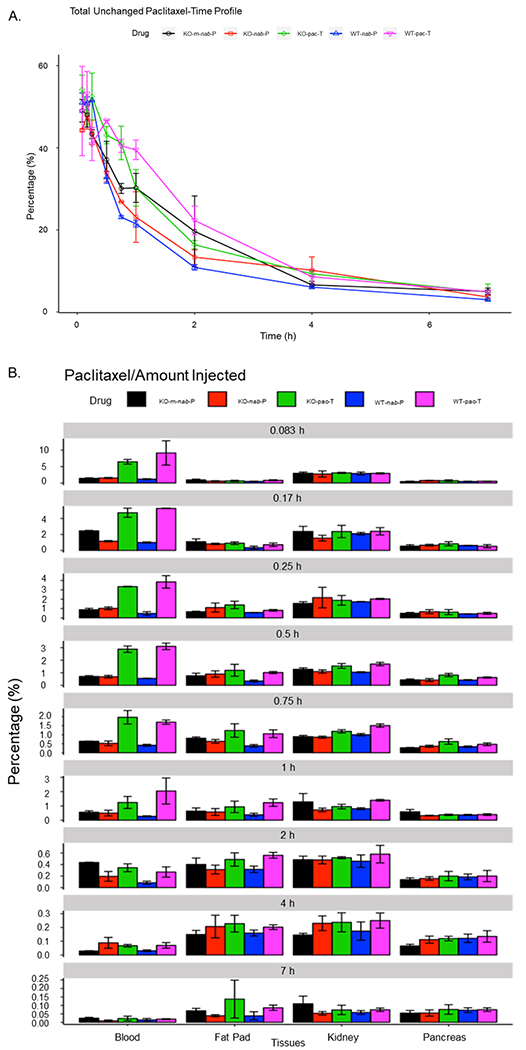
Percentage of unchanged paclitaxel in pac-T, nab-P, and m-nab-P treated WT B6 and FcRn-KO mice (A) and within blood, fat pad, kidney, and pancreas tissues (B) at each time point from initial injection to 7 h. FcRn; neonatal FcRn; KO, knockout; m-nab-P, mouse-specific nab-P; nab-P; nanoparticle albumin-bound paclitaxel; pac-T, solvent-based paclitaxel; WT, wild-type.
FcRn Enhances nab-P Penetration and Delivery Efficiency in Fat Pad, Pancreas, and Kidney.
To further analyze if FcRn mediates nab-P tissue distribution, we calculated the ratio of tissue/plasma concentration to represent tissue penetration at each time point, and the ratio of tissue/plasma AUC to represent delivery efficiency.
In the comparison of wild-type versus FcRn-KO mice, nab-P tissue penetration was significantly higher in the pancreas of wild-type mice (24–80-fold) than that of FcRn-KO mice (12–40-fold) from 2 to 7 h posttreatment (Figure 4). nab-P tissue penetration was significantly higher in the fat pad of wild-type mice (8–17-fold) than that in FcRn-KO mice (5–10-fold) from 2 to 7 h posttreatment. nab-P tissue penetration was significantly higher in the kidney of wild-type mice (25–38-fold) than that in FcRn-KO mice (18–27-fold) from 2 to 7 h posttreatment. Similar results were observed for bone, fat, lung, muscle, stomach, and brain tissue (Supporting Information Figure S3). In both wild-type and FcRn-KO mice, nab-P administration resulted in increased paclitaxel penetration across nearly all tissues versus pac-T. After administration of pac-T, differences in paclitaxel penetration between FcRn-KO and wild-type B6 mice were typically not as pronounced as differences following nab-P administration. Among FcRn-KO mice, paclitaxel tissue penetration was generally lower with m-nab-P than with nab-P.
Figure 4.
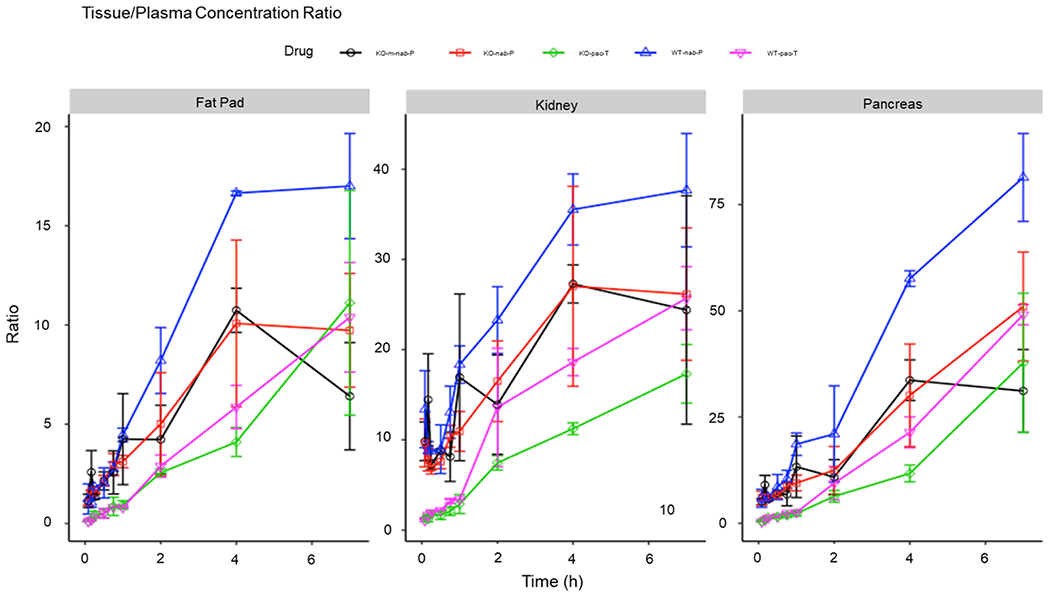
Total paclitaxel concentration ratios with plasma–time profiles of pac-T, nab-P, and m-nab-P in WT B6 and FcRn-KO mice in fat pad, kidney, and pancreas, scaled to corresponding plasma paclitaxel concentrations at each time point for each formulation. FcRn; neonatal FcRn; KO, knockout; m-nab-P, mouse albumin nab-P; nab-P; nanoparticle albumin-bound paclitaxel; pac-T, solvent-based paclitaxel; WT, wild-type.
Figure 5 and Figure S4 in the Supporting Information show the tissue-to-plasma AUC ratios, which can be used to assess paclitaxel delivery efficiency. In the comparison of wild-type versus FcRn-KO mice, nab-P delivery efficiency to the pancreas of wild-type mice (13–16-fold) was significantly higher than that of FcRn-KO mice (8–11-fold) from 5 to 16 h posttreatment, nab-P delivery efficiency to the fat pad of wild-type mice (3.8–4.0-fold) was significantly higher than that in FcRn-KO mice (2.8–3.2-fold) from 5 to 16 h posttreatment. nab-P tissue penetration was significantly higher in the kidney of wild-type mice (15-fold) than that in FcRn-KO mice (11-fold) from 5 to 16 h posttreatment. In contrast, pac-T delivery efficiency in all three tissues was similar in both wild-type and FcRn-KO mice. In both wild-type and FcRn-KO mice, nab-P delivery efficiency to the pancreas, fat pad, and kidney was higher than that of pac-T. Overall, these data suggest that FcRn enhances tissue penetration and delivery efficiency of nab-P.
Figure 5.
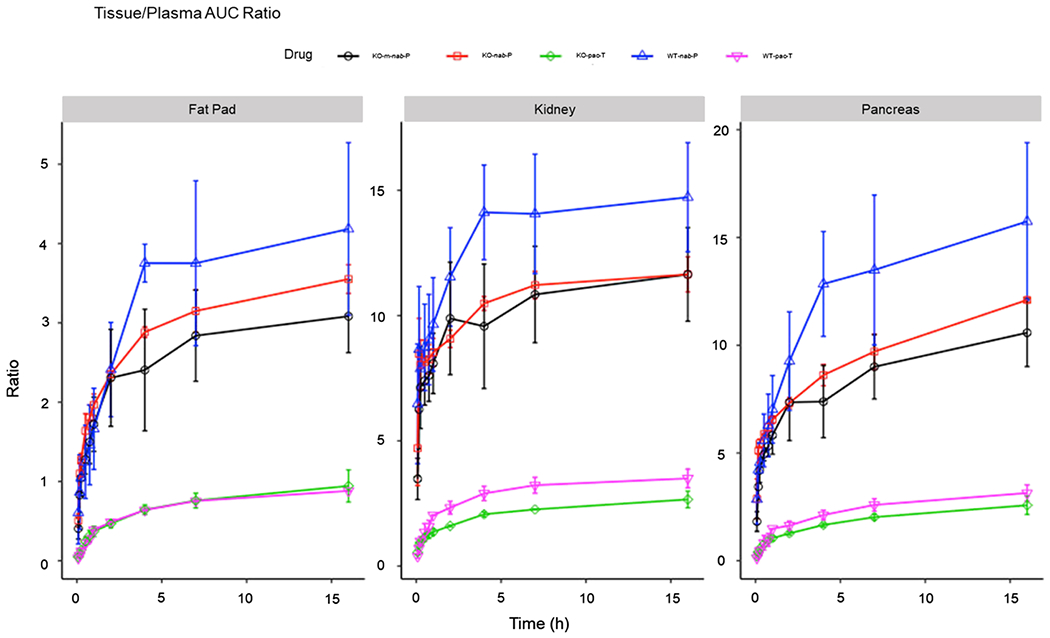
AUC ratios with plasma–time profiles of pac-T, nab-P, and m-nab-P in WT B6 and FcRn-KO mice in fat pad, kidney, and pancreas. Ratio (y axis) of accumulated AUC in tissues scaled to their corresponding accumulated AUC of plasma each formulation. AUC, an area under the curve; FcRn; neonatal FcRn; KO, knockout; m-nab-P, mouse albumin nab-P; nab-P; nanoparticle albumin-bound paclitaxel; pac-T, solvent-based paclitaxel; WT, wild-type.
FcRn Prevents nab-P Excretion to Feces.
To study the role of FcRn in elimination of nab-P, we used FcRn-KO mice to investigate excretion of paclitaxel and its metabolites in feces in comparison with wild-type mice. The presence of paclitaxel and associated metabolites in various tissues, plasma, blood, urine, and feces is summarized in Table 2. Paclitaxel was detectable in every tissue. However, only small amounts of metabolites were detected only in liver, intestine, and feces. All other tissues or blood had undetectable amounts of three metabolites. These data suggest that paclitaxel is mainly eliminated as an unchanged drug.
Table 2.
Presence of Paclitaxel Metabolitesb
| parent drug | M1 | M2 | M3 | |
|---|---|---|---|---|
| samplea | paclitaxel | 6α,3′-p-dihydroxy paclitaxel | 6-hydroxy paclitaxel | 3′-p-hydroxy paclitaxel |
| liver | √ | × | √ | √ |
| intestine | √ | √ | √ | √ |
| feces | √ | √ | √ | √ |
In all other tissues, only the parent drug was found.
M1, metabolite 1; M2, metabolite 2; M3, metabolite 3; √, detectable; ×, undetectable.
The excretion of nab-P in feces of FcRn-KO mice (45–68%) was significantly higher than that of wild-type mice (26–46%) from 8 to 48 h posttreatment (Figure 6). In contrast, the difference of fecal excretion of pac-T between FcRn-KO mice and wild-type mice was smaller than that with nab-P. Furthermore, fecal excretion of nab-P was greater than pac-T in both FcRn-KO and wild-type mice. These findings suggest that FcRn prevents nab-P excretion to feces in the intestinal lumen.
Figure 6.
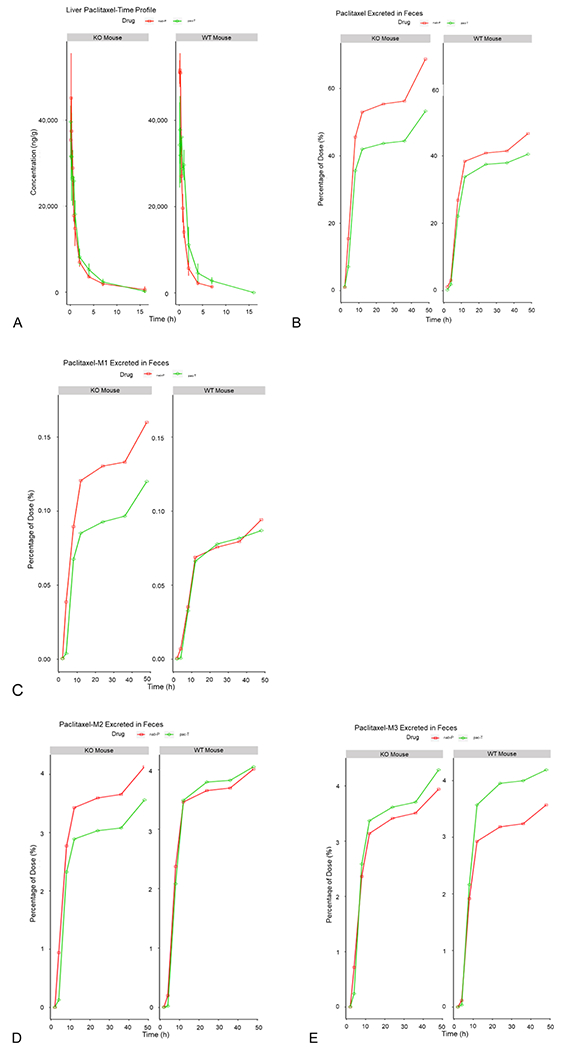
Elimination and excretion of nab-P vs pac-T. (A) Concentration of paclitaxel in the liver over time. (B) Percentage of unchanged paclitaxel excreted in feces over time. Excretion of the metabolites M1, M2, and M3 excreted in feces over time is displayed in (C–E). KO, knockout; M1, metabolite 1; M2, metabolite 2; M3, metabolite 3; nab-P; nanoparticle albumin-bound paclitaxel; pac-T, solvent-based paclitaxel; WT, wild type.
Because three metabolites were detected in very small amounts in the feces, the differences in fecal excretion of these metabolites were minor between the 2 types of mice.
DISCUSSION
The results of these experiments demonstrate the interaction between FcRn and the albumin carrier of nab-P, which affects the tissue distribution and excretion of nab-P. We found that nab-P and m-nab-P administration resulted in similar plasma and blood paclitaxel concentrations in FcRn-KO mice. Additionally, in both plasma and blood, drug concentration with nab-P administration was similar between wild-type B6 and FcRn-KO mice. These findings suggest that the intrinsic properties of the albumin vehicle drive the plasma and blood concentrations rather than the type of albumin used. Furthermore, both paclitaxel penetration and delivery efficiency to nearly all tissues were greater with nab-P than with pac-T regardless of genotype. Significant differences in drug tissue penetration were noted with nab-P between the 2 mouse genotypes for pancreas, kidney, and fat pad; these findings are clinically relevant, given that nab-P has demonstrated efficacy in treating pancreatic and breast cancers. Additional differences were noted for stomach, bone, lung, fat, muscle, and brain. As expected, the differences in tissue penetration and delivery efficiency between wild-type B6 and FcRn-KO mice after pac-T administration were less pronounced than those observed after nab-P administration. The findings suggest that FcRn likely affects tissue distribution with nab-P administration and may be linked with the observed efficacy of nab-P in pancreatic, breast, and lung cancers. This notion is further supported by the lower paclitaxel penetration and delivery efficiency in FcRn-KO mice than in wild-type B6 mice after nab-P administration.
Paclitaxel metabolites were detected in minor quantities in the liver and intestine tissues following administration of both nab-P and pac-T, and were undetectable in all other tissues, including blood. The data indicate that paclitaxel is primarily excreted as the parent drug via feces. In the feces of wild-type B6 mice, drug excretion was greater with nab-P than with pac-T. This difference indicates that the nab-P formulation alters the elimination pathway of paclitaxel. In addition, the nab-P formulation may result in enhanced paclitaxel access to the eliminating organs. In FcRn-KO mice, even greater fecal excretion was observed with nab-P than with pac-T administration, indicating that FcRn plays a role in the excretion of nab-P. Furthermore, FcRn-KO mice had greater fecal excretion after nab-P administration compared with wild-type B6 mice, which suggests that FcRn prevents excretion of nab-P. This difference is notable given that FcRn-KO mice have lower baseline albumin than wild-type mice;29 if albumin levels were the same, we would have expected an even greater difference. It is possible that FcRn in hepatocytes plays a role in pumping paclitaxel from hepatocytes to blood; therefore, knockout of FcRn lessens this effect and more nab-P is excreted into feces. These results are consistent with those of a recent publication by Pyzik et al., which demonstrated that hepatic FcRn plays a role in albumin circulation homeostasis.30 Therefore, these results suggest that nab-P delivers paclitaxel in complex with albumin before it is released from albumin as a free drug. This is markedly different from the equilibrium binding of paclitaxel and plasma albumin when pac-T is administered. These findings indicate that the formulation process is critical in FcRn-mediated recycling of albumin-based drug formulations; therefore, these observations may be applicable to other albumin-bound formulations of drugs such as human serum albumin cabazitaxel and albumin-bound docetaxel, which have improved pharmacokinetic profiles compared with their solvent-based counterparts, and guide further development and understanding of such formulations.31,32
Overall, these findings align with what has been previously observed with nab-P, which is a key agent in the treatment of pancreatic cancer. It is known that, compared with pac-T, nab-P results in enhanced tumor uptake.33 Moreover, in pancreatic cancer, nab-P is hypothesized to disrupt the tumor stroma, which is believed to increase tumoral uptake of gemcitabine compared with gemcitabine alone.34,35 Indeed, in our study, paclitaxel tissue penetration with nab-P was highest in the pancreas of wild-type mice. While this is a clinically relevant observation for humans, it must be acknowledged that the pharmacokinetic differences between nab-P and pac-T are smaller in mice than humans, potentially because of the more rapid paclitaxel metabolism in mice.28 Despite this, our findings add to the understanding of the characteristics of the nab-P formulation, further elucidating potentially clinically relevant differences between the nab-P and pac-T formulations as well as the interactions of FcRn with albumin-bound formulations.
In conclusion, the results of these experiments demonstrate that the interaction between FcRn and albumin carrier in nab-P. FcRn enhances nab-P tissue penetration in pancreas, fat pad, and kidney, while FcRn prevents nab-P excretion to feces. The findings support the notion that albumin nanoparticle delivery alters the distribution of paclitaxel and its elimination through an FcRn-mediated process to impact drug efficacy and toxicity.
Supplementary Material
ACKNOWLEDGMENTS
Medical writing assistance was provided by Shawn Vahabzadeh, PharmD, MediTech Media, Ltd, funded by Celgene Corporation. All listed authors were fully responsible for all content and editorial decisions for this manuscript. This research was funded by Celgene Corporation.
Footnotes
Supporting Information
The Supporting Information is available free of charge on the ACS Publications website at DOI: 10.1021/acs.molpharmaceut.8b01314.
Concentration–time profiles, visualization of unchanged paclitaxel, concentration, and AUC ratios with plasma–time profiles, calculated Cmax and AUClast and corresponding P values for the comparisons (PDF)
The authors declare the following competing financial interest(s): Nianhang Chen, Yan Li, Simon Zhou, Maria Palmisano are employees of and hold stock in Celgene Corporation. The other authors have nothing to disclose.
REFERENCES
- (1).Horwitz SB Taxol (paclitaxel): Mechanisms of action. Ann Oncol. 1994, 5, S3–S6. [PubMed] [Google Scholar]
- (2).Adams JD; Flora KP; Goldspiel BR; Wilson JW; Arbuck SG; Finley R Taxol: A history of pharmaceutical development and current pharmaceutical concerns. J. Natl. Cancer Inst. Monogr 1993, 141–147. [PubMed] [Google Scholar]
- (3).Jordan MA Mechanism of action of antitumor drugs that interact with microtubules and tubulin. Curr. Med. Chem.: Anti-Cancer Agents 2002, 2, 1–17. [DOI] [PubMed] [Google Scholar]
- (4).Abraxane (Paclitaxel) [Package Insert]; Celgene Corporation: Summit, NJ, 2018. [Google Scholar]
- (5).Taxotere (Docetaxel) [Package Insert]; Sanofi-Aventis US LLC: Bridgewater, NJ, 2015. [Google Scholar]
- (6).Spencer CM, Faulds D Paclitaxel. Drugs 1994, 48, 794–847. [DOI] [PubMed] [Google Scholar]
- (7).Gligorov J; Lotz JP Preclinical pharmacology of the taxanes: Implications of the differences. Oncologist 2004, 9, 3–8. [DOI] [PubMed] [Google Scholar]
- (8).Gelderblom H, Verweij J; Nooter K, Sparreboom A; Cremophor EL; Cremophor EL Eur. J. Cancer 2001, 37, 1590–1598. [DOI] [PubMed] [Google Scholar]
- (9).Engels FK; Mathot RAA; Verweij J Alternative drug formulations of docetaxel: A review. Anti-Cancer Drugs 2007, 18, 95–103. [DOI] [PubMed] [Google Scholar]
- (10).Schwartzberg LS; Navari RM Safety of polysorbate 80 in the oncology setting. Adv. Ther 2018, 35, 754–767. [DOI] [PMC free article] [PubMed] [Google Scholar]
- (11).Tan Q; Iiu X; Fu X; Li Q; Dou J; Zhai G Current development in nanoformulations of docetaxel. Expert Opin. Drug Delivery 2012, 9, 975–990. [DOI] [PubMed] [Google Scholar]
- (12).Tellingen O. v.; Huizing MT; Panday VRN; Schellens JHM; Nooijen WJ; Beijnen JH Cremophor EL causes (pseudo-) non-linear pharmacokinetics of paclitaxel in patients. Br. J. Cancer 1999, 81, 330–335. [DOI] [PMC free article] [PubMed] [Google Scholar]
- (13).Tije A. J. t.; Verweij J; Loos WJ; Sparreboom A Pharmacological Effects of Formulation Vehicles. Clin. Pharmacokinet 2003, 42, 665–685. [DOI] [PubMed] [Google Scholar]
- (14).Sparreboom A; van Zuylen L; Brouwer E; et al. Cremophor EL-mediated alteration of paclitaxel distribution in human blood: Clinical pharmacokinetic implications. Cancer Res. 1999, 59, 1454–1457. [PubMed] [Google Scholar]
- (15).Montana M; Ducros C; Verhaeghe P; Terme T; Vanelle P; Rathelot P Albumin-bound paclitaxel: The benefit of this new formulation in the treatment of various cancers. J. Chemother 2011, 23, 59–66. [DOI] [PubMed] [Google Scholar]
- (16).Nehate C; Jain S; Saneja A; et al. Paclitaxel formulations: Challenges and novel delivery options. Curr. Drug Delivery 2014, 11, 666–686. [DOI] [PubMed] [Google Scholar]
- (17).Desai N; Trieu V; Yao Z; et al. Increased antitumor activity, intratumor paclitaxel concentrations, and endothelial cell transport of cremophor-free, albumin-bound paclitaxel, ABI-007, compared with cremophor-based paclitaxel. Clin. Cancer Res 2006, 12, 1317–1324. [DOI] [PubMed] [Google Scholar]
- (18).Chen N; Brachmann C; Iiu X; et al. Albumin-bound nanoparticle (nab) paclitaxel exhibits enhanced paclitaxel tissue distribution and tumor penetration. Cancer Chemother. Pharmacol 2015, 76, 699–712. [DOI] [PMC free article] [PubMed] [Google Scholar]
- (19).Gradishar WJ; Tjulandin S; Davidson N; et al. Phase III trial of nanoparticle albumin-bound paclitaxel compared with polyethylated castor oil–based paclitaxel in women with breast cancer. J. Clin. Oncol 2005, 23, 7794–7803. [DOI] [PubMed] [Google Scholar]
- (20).Chen N; Li Y; Ye Y; Palmisano M; Chopra R; Zhou S Pharmacokinetics and pharmacodynamics of nab-paclitaxel in patients with solid tumors: Disposition kinetics and pharmacology distinct from solvent-based paclitaxel. J. Clin. Pharmacol 2014, 54, 1097–1107. [DOI] [PMC free article] [PubMed] [Google Scholar]
- (21).Joerger M; Huitema AD; van den Bongard DH; Schellens JH; Beijnen JH Quantitative effect of gender, age, liver function, and body size on the population pharmacokinetics of paclitaxel in patients with solid tumors. Clin. Cancer Res 2006, 12, 2150–2157. [DOI] [PubMed] [Google Scholar]
- (22).Friberg LE; Henningsson A; Maas H; Nguyen L; Karlsson MO Model of chemotherapy-induced myelosuppression with parameter consistency across drugs. J. Clin. Oncol 2002, 20, 4713–4721. [DOI] [PubMed] [Google Scholar]
- (23).Pyzik M; Rath T; Lencer WI; Baker K; Blumberg RS FcRn: The architect behind the immune and nonimmune functions of IgG and albumin. J. Immunol 2015, 194, 4595–4603. [DOI] [PMC free article] [PubMed] [Google Scholar]
- (24).Kuo TT; Baker K; Yoshida M; et al. Neonatal fc receptor: From immunity to therapeutics. J. Clin. Immunol 2010, 30, 777–789. [DOI] [PMC free article] [PubMed] [Google Scholar]
- (25).Sand KMK; Bern M; Nilsen J; Noordzij HT; Sandlie I; Andersen JT Unraveling the interaction between FcRn and albumin: Opportunities far design of albumin-based therapeutics. Front. Immunol 2015, 5, 682. [DOI] [PMC free article] [PubMed] [Google Scholar]
- (26).Roopenian DC; Christianson GJ; Sproule TJ; et al. The MHC class I-like IgG receptor controls perinatal IgG transport, IgG homeostasis, and fate of IgG-fc-coupled drugs. J. Immunol 2003, 170, 3528–3533. [DOI] [PubMed] [Google Scholar]
- (27).Taxol (Paclitaxel) [Package Insert]; Bristol-Myers Squibb Company: Princeton, NJ, 2011 [Google Scholar]
- (28).Li YF; Zhang C; Zhou S; et al. Species difference in paclitaxel disposition correlated with poor pharmacological efficacy translation from mice to humans. Clin. Pharmacol.: Adv. Appl 2018, 10, 165–174. [DOI] [PMC free article] [PubMed] [Google Scholar]
- (29).Dylewski J; Dobrinskikh E; Lewis L; et al. Differential trafficking of albumin and IgG facilitated by the neonatal Fc receptor in podocytes in vitro and in vivo. PLoS One 2019, 14, e0209732. [DOI] [PMC free article] [PubMed] [Google Scholar]
- (30).Pyzik M; Rath T; Kuo TT; et al. Hepatic FcRn regulates albumin homeostasis and susceptibility to liver injury. Proc. Natl. Acad. Sci. U.S.A 2017, 114, E2862–E2871. [DOI] [PMC free article] [PubMed] [Google Scholar]
- (31).Zhou G; Jin X; Zhu P; et al. Human serum albumin nanoparticles as a novel delivery system for cabazitaxel. Anticancer Res. 2016, 36, 1649–1656. [PubMed] [Google Scholar]
- (32).Desai N; Trieu V; Yang A; Tapas De JC; Yim Z; Ci S; Louie L; Grim BB; Azoulay J; Soon-Shiong P; Hawkins M Enhanced efficacy and safety of nanoparticle albumin-bound nab-docetaxel versus taxotere. Cancer Res. April 15, 2006. (66) (8 Supplement) pp 1277–1278.16452179 [Google Scholar]
- (33).Kundranda M; Niu J Albumin-bound paclitaxel in solid tumors: Clinical development and future directions. Drug Des., Dev. Ther 2015, 9, 3767–3777. [DOI] [PMC free article] [PubMed] [Google Scholar]
- (34).Alvarez R; Musteanu M; Garcia-Garcia E; et al. Stromal disrupting effects of nab-paclitaxel in pancreatic cancer. Br. J. Cancer 2013, 109, 926–933. [DOI] [PMC free article] [PubMed] [Google Scholar]
- (35).Von Hoff DD; Ramanathan RK; Borad MJ; et al. Gemcitabine plus nab-paclitaxel is an active regimen in patients with advanced pancreatic cancer: A phase I/II trial. J. Clin. Oncol 2011, 29, 4548–4554. [DOI] [PMC free article] [PubMed] [Google Scholar]
Associated Data
This section collects any data citations, data availability statements, or supplementary materials included in this article.