Abstract
Immunotherapy is the most promising treatment for uveal melanoma patients with metastasis. Tumor microenvironment plays an essential role in tumor progression and greatly affects the efficacy of immunotherapy. This research constructed an immune-related subtyping system and discovered immune prognostic genes to further understand the immune mechanism in uveal melanoma. Immune-related genes were determined from literature. Gene expression profiles of uveal melanoma were clustered using consensus clustering based on immune-related genes. Subtypes were further divided by applying immune landscape, and weighted correlation network analysis was performed to construct immune gene modules. Univariate Cox regression analysis was conducted to generate a prognostic model. Enriched immune cells were determined after gene set enrichment analysis. Three major immune subtypes (IS1, IS2, and IS3) were identified, and IS2 could be further divided into IS2A and IS2B. The subtypes were closely associated with uveal melanoma prognosis. IS3 group had the most favorable prognosis and was sensitive to PD-1 inhibitor. Immune genes in IS1 group showed an overall higher expression than IS3 group. Six immune gene modules were identified, and the enrichment score of immune genes varied within immune subtypes. Four immune prognostic genes (IL32, IRF1, SNX20, and VAV1) were found to be closely related to survival. This novel immune subtyping system and immune landscape provide a new understanding of immunotherapy in uveal melanoma. The four prognostic genes can predict prognosis of uveal melanoma patients and contribute to new development of targeted drugs.
Keywords: : Uveal melanoma, molecular subtyping system, immune subtypes, immune-related genes, immune landscape, prognostic signature, immunotherapy, bioinformatics
Impact statement
This study first identified three major immune subtypes and defined an immune landscape of uveal melanoma, which can elevate the success rate of personalized therapeutic strategies especially for metastatic uveal melanoma patients. These novel immune subtypes with distinct overall survival help to further understand the relation between tumor microenvironment and prognosis. Furthermore, these immune subtypes can effectively guide the chemotherapy and immune checkpoint blockade therapy for uveal melanoma patients. In addition, four prognostic genes tightly associated with survival can be a concrete indicator for screening uveal melanoma patients particularly with unfavorable prognosis.
Introduction
Uveal melanoma (UM) is a relatively rare melanocytes-derived malignancy and contributes to 3%–5% of all melanomas. 1 The Surveillance, Epidemiology, and End Results (SEER) database showed that the incidence of UM is 5.2 per million, with 98% of UM cases found in the Caucasian population. 2 UM is the most frequent eye tumor, and about 50% of patients will ultimately develop metastasis with approximately 13.4 months of median overall survival time. 1 Numerous researches have demonstrated that chromosome abnormalities, especially loss of chromosome 3 and arrangements of 6q and 8q, are critically associated with metastasis or worse prognosis.3–7 Furthermore, hotspot mutated genes including GNA11, GNAQ, EIF1AX, SF3B1, and BAP1 have also been verified to be correlated with UM progression, particularly BAP1 mutations, which are more closely associated with metastasis.1,8
Although the TNM staging system from the American Joint Committee on Cancer Classification (AJCC) can stratify patients into several risk categories based on clinical and histopathologic features, its accuracy is relatively low in predicting prognosis and is therefore not reliable enough in guiding personalized treatment. To this end, Onken et al. exploited a new classification that stratified UM patients into class 1 and class 2 on the basis of gene expression profiling (GEP) assay.9,10 Then, a 15-gene assay has been developed to predict metastasis risk, and class 1 was then subdivided into class 1A and class 1B according to the expression level of RAB31 and CDH1.11,12 Field et al. further improved the predictive accuracy of the 15-gene assay by introducing PRAME gene expressing cancer-testis antigen, and subdivided class 1 into Class1PRAME− and Class1PRAME+. 13 The Cancer Genome Atlas (TCGA) also developed a subtyping system, which classified UM patients into four subtypes based on monosomy 3 (M3) and disomy 3 (D3). 14
Although the above subtyping systems shows certain advantages than AJCC staging system in predicting cancer metastasis, they are still inadequate in guiding personalized therapies, particularly for metastatic patients. The five-year overall survival of UM has remained stable; meanwhile, over the past decades, the treatments for UM patients were largely developed from surgery to its combination with radiotherapy, chemotherapy and some other therapies. 2 Lack of means to effectively treat metastatic patients is a crucial reason leading to the death of UM patients, and the most promising immunotherapies are now undergoing with clinical trials. Therefore, with the development of immunotherapies, it is also essential to explore an effective subtyping system to provide a better understanding of immune-related tumor microenvironment (TME). Early studies elucidated that high expression of human leukocyte antigen (HLA) class I is related to a poor prognosis, which indicates that different patterns of immune cells may result in different prognosis. 15 TCGA study also demonstrated that UM patients with high metastatic risk could be further classified by the level of CD8+ T-cell infiltration and differential expression of immune profiles. 14
In the present study, we attempted to unveil the relation between immune components and prognosis through integrated bioinformatics analysis. According to gene expression profiles of UM patients from TCGA, we developed a novel subtyping system focusing on immune-related genes and an immune-related prognostic signature for further understanding the tumor microenvironment and predicting survival of UM patients.
Materials and methods
Data source and preprocessing
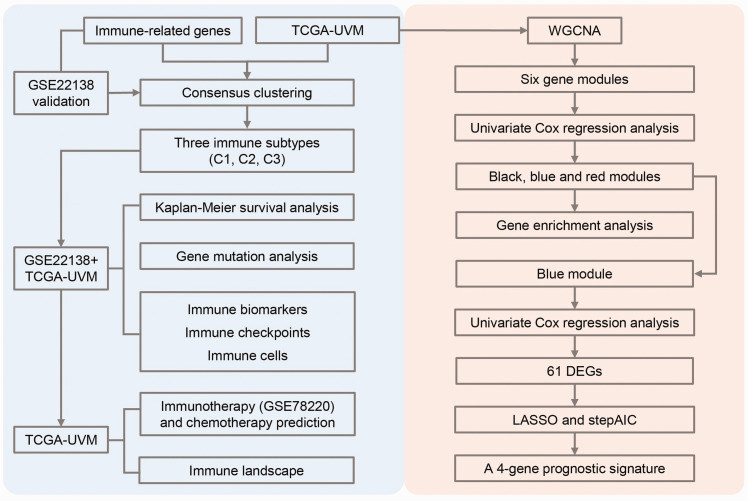
The workflow chart of this study is shown in Figure 1. RNA-seq data (TCGA-UVM) and gene expression profiles (GSE22138, GSE78220) were downloaded from TCGA dataset and Gene Expression Omnibus (GEO), respectively. In TCGA-UVM dataset, samples lacked of survival data or genes whose transcripts per million (TPM) = 0 in over 50% samples were excluded. Ensembl gene ID was transferred to gene symbol. Eighty samples and expression data of 18409 genes in TCGA-UVM dataset were included (Supplementary Table S1). In GSE22138 dataset, samples without survival data or probes without value were excluded. The remaining probes were matched to gene symbol. One probe that was mapped into multiple genes was also excluded. If multiple probes were mapped to one gene, median value of expression data was calculated. Finally, 63 samples and expression profiles of 23,520 genes were retained (Supplementary Table S2). TCGA-UVM was defined as a training dataset, and GSE22138 was defined as a validation dataset (Supplementary Table S3). GSE78220 dataset containing the treatment data of immunotherapy and chemotherapy for UM patients was exported from GEO.
Figure 1.
The workflow chart of exploring UM data. The study was divided into two parts. One part is immune subtyping-related analysis, and another part is the identification of prognostic genes. (A color version of this figure is available in the online journal.)
WGCNA: weighted correlation network analysis; DEGs: differentially expressed genes; LASSO: Least absolute shrinkage and selection operator; AIC: Akaike information criterion.
Collection of immune-related genes
We collected total of 2006 immune-related genes including immune cell-specific genes, genes of co-inhibitory and co-stimulatory molecules, genes of cytokines and cytokine receptors, genes for antigen processing and presentation, and other immune-related genes from a previous research. 16
Consensus clustering
Consensus clustering in ConsensusClusterPlus R package was performed to cluster immune-related genes from TCGA-UMV dataset. 17 Consensus clustering is an unsupervised class discovery to mine the unknown possible groups based on intrinsic features. Partitioning around medoids (PAM) algorithm and Canberra distance were applied to consensus clustering. Five hundred times of bootstraps were implemented, and 80% of the total samples in TCGA-UVM dataset were included in each time of bootstraps. Groups (k) was set from 2 to 10, and the most optimized clusters were defined by cumulative distribution function (CDF) curve and consensus CDF. Kaplan-Meier survival curve and log-rank test were used to evaluate the performance of the immune subtyping system.
Comparison of mutation patterns among different immune subtypes
To better understand characteristics of gene mutations in the three immune subtypes, we used mutect2 software to analyze the mutation patterns in TCGA-UVM dataset (https://software.broadinstitute.org/cancer/cga/mutect). 18 Mutect2 is a method widely used in preprocessing next generation sequencing data, and it can detect mutations with a very low false-positive rate. Chi-square test was performed to identify significantly differential mutations among different subtypes.
Predicting the sensitivity of immune subtypes to immunotherapy and chemotherapy
We obtained GSE78220 dataset with treatment data of melanoma patients receiving anti-PD-1 therapy from GEO. Submap analysis was performed to predict the sensitivity of different immune subtypes to anti-PD-1 therapy by comparing the similarity of expression profiles between GSE78220 and TCGA-UVM datasets. In the sensitivity prediction of chemotherapy, pRRophetic R package was applied to estimate IC50 (half maximal inhibitory concentration) of six chemotherapy drugs (tamoxifen, cisplatin, sunitinib, crizotinib, sorafenib, and temozolomide) in each patient. 19 ANOVA test was performed to analyze the difference among three subtypes.
Construction of immune landscape
Monocle is an unsupervised algorithm and has been previously used to reduce dimensionality and construct a two-dimensional landscape. 20 The algorithm of Monocle represented the expression data of each sample as a point in a high-dimensional Euclidean space. Then, the dimensionality was reduced using Independent Component Analysis, in which each sample was casted as a point in the two-dimensional graph. Finally, a tree structure manifesting the features of each sample was constructed by Monocle.
Weighted correlation network analysis
Weighted correlation network analysis (WGCNA) R package was performed to find immune-related gene modules. 21 WGCNA is a correlation network methodology that can be used to efficiently screen biomarkers or hub genes. Negative relation between log(k) and log(p(k)), R2 > 0.85 and soft threshold (power) = 3 were defined to be the most optimized cluster. Topological overlap matrix (TOM) was constructed based on adjacency matrix. We applied average-linkage hierarchical clustering and dynamic branch cutting to identify co-expression modules containing at least 30 genes. Parameters of height = 0.25, deepSplit = 2, minModuleSize = 30 were set to merge multiple modules.
Gene enrichment analysis
Single-sample gene set enrichment analysis (ssGSEA) in the GSVA R package was implemented to score 28 types of immune cells. 22 ssGESA method uses cumulative distribution functions of gene expression to calculate enrichment score per sample, which is further normalized by the range of values taken across all samples and gene sets. 23 ANOVA was performed to assess the relation between immune subtypes and 56 types of immune-related biomarkers. 24 Enriched biological processes in gene ontology (GO) terms of six immune-related gene modules were annotated by DAVID (v6.8). 25
Exploration of prognostic genes
Univariate Cox regression analysis was conducted to identify gene modules and prognostic genes (within TCGA-UVM dataset) significantly correlated with overall survival. Least absolute shrinkage and selection operator (LASSO) regression in the glmnet R package and stepAIC (stepwise Akaike information criterion) in the MASS R package were employed to reduce the quantity of prognostic genes and optimize the prognostic model.26–28 LASSO is widely applied to estimate the structure of a nonlinear polynomial model and can reduce the unnecessary variables to meet the optimal model. It has been successfully used to identify prognostic biomarkers in various diseases.29,30 Risk score was defined as coefficient 1×gene 1 expression + coefficient 2 × gene 2 expression + … + coefficient n×gene n expression. Finally, the prognostic model performance was assessed by Kaplan-Meier survival curve and log-rank test.
Statistical analysis
All statistical analyses were performed in R (v3.4.2) software. Student t test was performed when comparing two groups. ANOVA test was performed when comparing three or more than three groups. Log-rank test was performed in Kaplan-Meier survival analysis and univariate Cox regression analysis. p < 0.05 was considered as a significance. Bonferroni correction was used to correct p value. Other statistical analyses were presented in the corresponding figure legends. All parameters were default if there was no specific indication.
Results
Molecular subtyping of UM based on immune-related genes
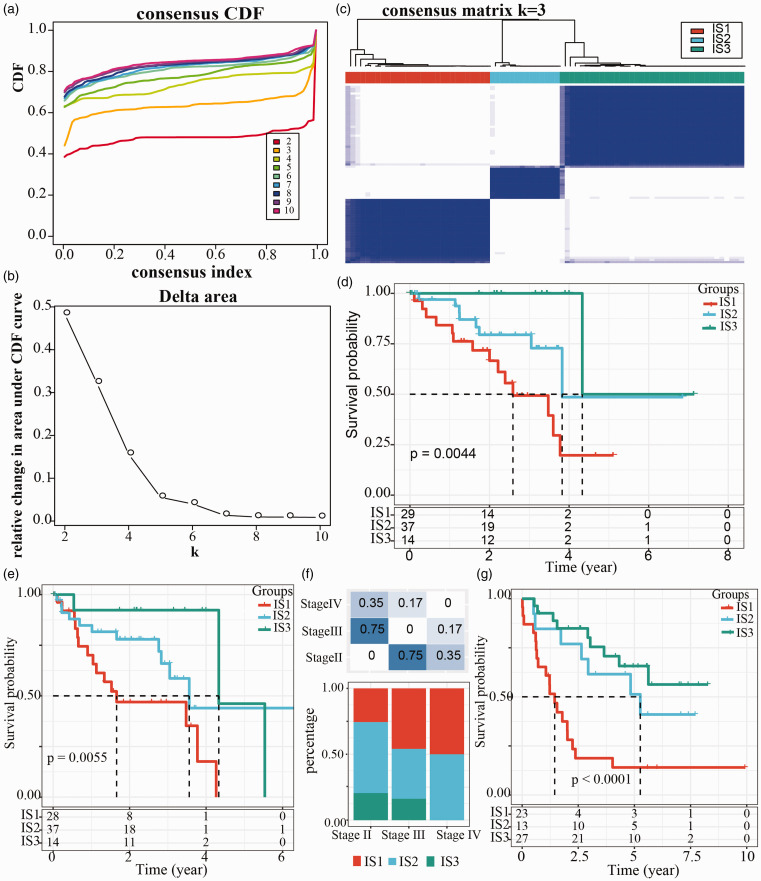
After collecting 2006 immune-related genes from literature, we exported 1809 immune-related genes from RNA-seq data in TCGA-UVM dataset and then performed clustering analysis for 80 UM samples through “ConsensusClusterPlus” R package. The most optimized cluster was when k = 3, according to CDF and CDF delta area (Figure 2(a) and (b)), and the samples were clustered into three immune subtypes (IS1, IS2, and IS3) (Figure 2(c)). Survival analysis in TCGA-UVM dataset revealed significant difference of overall survival in the three groups, while IS1 group showed the worst prognosis, and IS3 group had the longest overall survival (p = 0.0044, Figure 2(d)). Similarly, progression-free survival was the worst in IS1 group and the optimal in IS3 group (p = 0.0055, Figure 2(e)). In addition, no close relation between immune subtypes or clinical features including age, gender, and stages in TCGA-UVM dataset, was detected (Supplementary Figure S1(a) to (d) and Figure 2(f)). Furthermore, we validated this molecular subtyping system in GSE22138 dataset, and the results were consistent with the previous. The overall survival was different in the three groups classified by immune subtypes, with the worst survival shown in IS1 group and the optimal prognosis in IS3 group (p < 0.001, Figure 2(g)). The data did not show significant difference between three groups or clinical features (age and gender) (Supplementary Figure S1(e) and (f)).
Figure 2.
Immune subtyping of uveal melanoma in TCGA dataset. (a) Cumulative distribution function (CDF) curves analyzed in TCGA dataset. Category numbers (k = 2 to 10) were shown in different colors. (b) CDF delta area curves (k = 2 to 10) analyzed in TCGA dataset. (c) Cluster heatmap when k = 3. Samples were stratified into three immune subtypes (IS1, IS2, and IS3). (d) Kaplan-Meier survival curves of immune subtypes and overall survival in TCGA dataset. (e) Kaplan-Meier survival curves of immune subtypes and progression-free survival in TCGA dataset. (f) The distribution of three immune subtypes in the stage II, III, and IV in TCGA dataset. Chi-square test was performed. (g) Kaplan-Meier survival curves of immune subtypes and overall survival in GSE22138 dataset. Log-rank test was performed in survival analysis. (A color version of this figure is available in the online journal.)
Characteristics of gene mutations in different immune subtypes
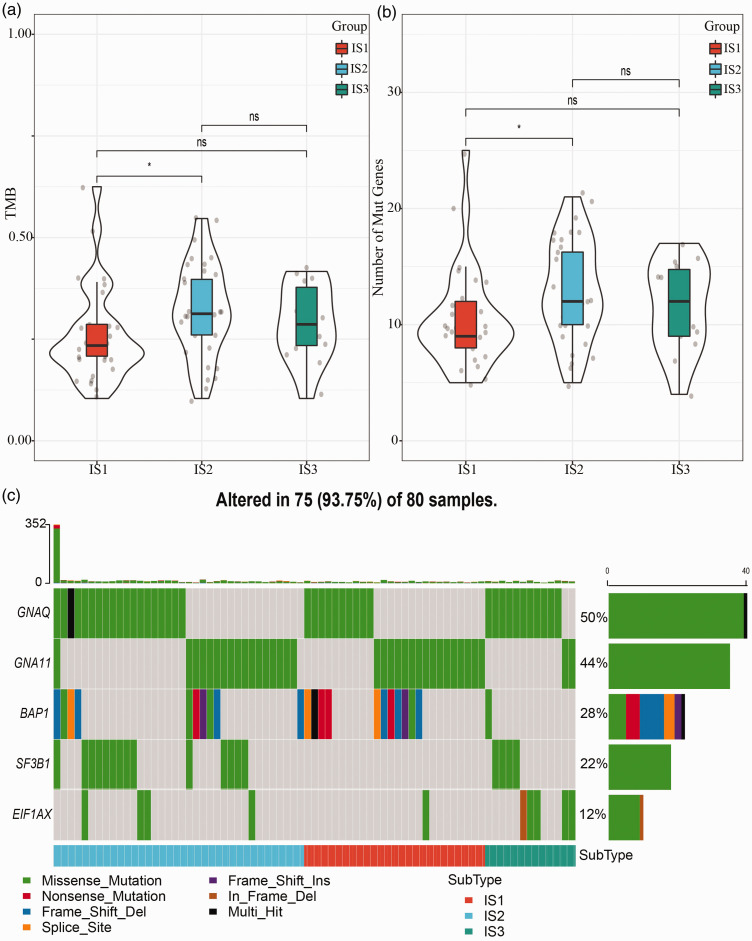
To better understand characteristics of gene mutations in the three immune subtypes, we used mutect2 software to analyze the mutation patterns in TCGA-UVM dataset. 18 Tumor mutation burden (TMB) and number of mutation genes of IS1, IS2, and IS3 groups were, respectively, calculated, and we observed a significant difference between IS1 and IS2 groups (p < 0.05, Figure 3(a) and (b)). We screened five genes (GNAQ, GNA11, BAP1, SF3B1, and EIF1AX) with mutation rates over 3%, and their mutation characteristics in three immune subtypes are shown in Figure 3(c). Missense mutations consisted most of mutations, and the top two genes with high mutation frequency were GNAQ (50%) and GNA11 (44%). However, BAP1 had the most variable mutation types (Figure 3(c)). Notably, no mutations of SF3B1 were detected in IS2 group, and most of mutations in IS3 group were missense mutations (Figure 3(c)). In each subtype, the three genes (GNAQ, SF3B1, and EIF1AX) showing a high mutation frequency were screened through Chi-square test (p < 0.05).
Figure 3.
Characteristics of gene mutations in three immune subtypes. (a) Tumor mutation burden of three immune subtypes. ANOVA was performed. (b) Number of mutated genes in three immune subtypes. ANOVA was performed. (c) Mutation distribution and mutation types of top five mutated genes (GNAQ, GNA11, BAP1, SF3B1, and EIF1AX) in three immune subtypes. Chi-square test was performed. *p < 0.05. (A color version of this figure is available in the online journal.)
ns: no significance; TMB: tumor mutation burden.
Chemotherapy-induced gene expression of immune biomarkers and checkpoints
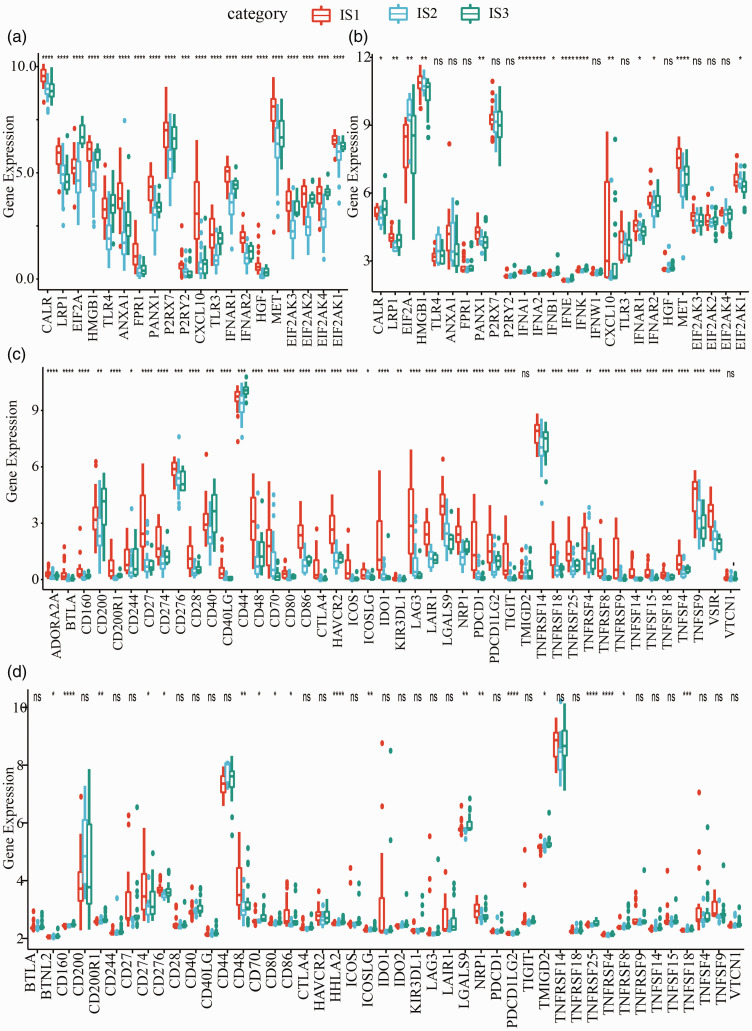
From patients with chemotherapy history, the gene expression of immune biomarkers in three immune subtypes was detected. In TCGA-UVM dataset, 20 immune biomarkers were found to be differentially expressed in IS1, IS2, and IS3 (p < 0.001, Figure 4(a)). In GSE22138 dataset, 26 immune biomarkers were expressed, and 15 of them were differentially expressed in the immune subtypes (p < 0.05, Figure 4(b)). Gene expression of the 47 immune checkpoints collected from previous research in two datasets was also analyzed. 31 A total of 44 genes were expressed in TCGA-UVM dataset, and 42 were differentially expressed in the immune subtypes (Figure 4(c)). In GSE22138 dataset, a total of 45 genes were expressed, and 19 of them were differentially expressed in three immune subtypes (Figure 4(d)).
Figure 4.
Differential gene expression of immune-related genes within immune subtypes. (a) Chemotherapy-induced gene expression of immune biomarkers in TCGA-UVM dataset. (b) Chemotherapy-induced gene expression of immune biomarkers in GSE22138 dataset. (c) Chemotherapy-induced gene expression of immune checkpoints in TCGA-UVM dataset. (d) Chemotherapy-induced gene expression of immune checkpoints in GSE22138 dataset. ANOVA test was performed. *p < 0.05, **p < 0.01, ***p < 0.001, ****p < 0.0001. (A color version of this figure is available in the online journal.)
ns: no significance.
Distribution of immune cells in three immune subtypes
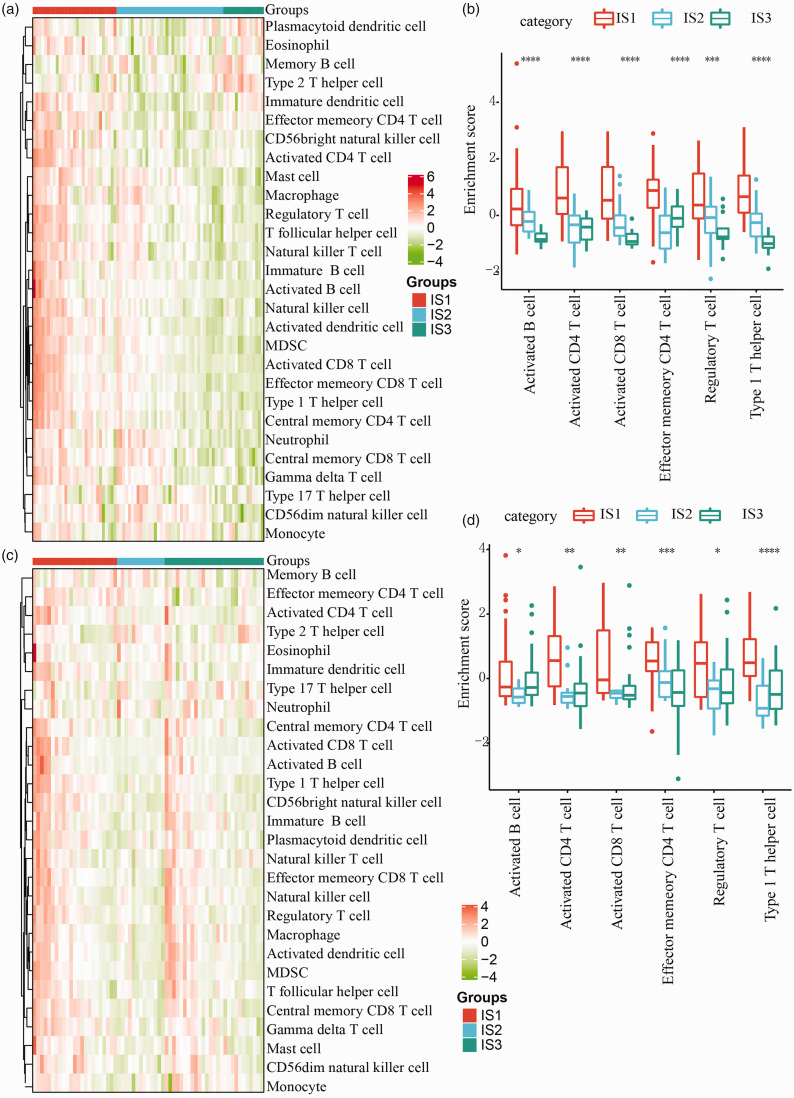
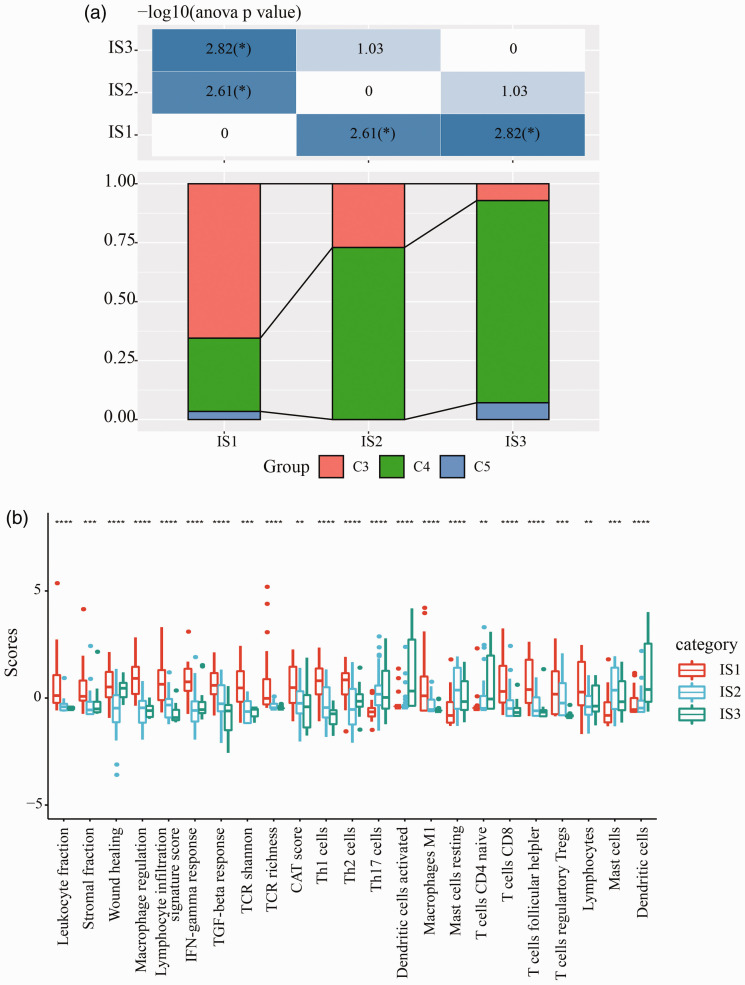
Subsequently, we evaluated the distribution of immune cells in different subtypes and then collected related genes from previous study. 32 By using ssGSEA method, we calculated the score of 28 types of immune cells of each samples, according to expression data. The results showed differential distribution of immune cells in the three subtypes (Figure 5). In IS1 group, accumulative gene expression of immune cells was significantly higher than IS3 group in TCGA-UVM dataset (Figure 5(a)). Especially, six types of immune cells, including activated CD4+ T cell, effector memory CD4+ T cell, activated B cell, activated CD8+ T cell, regulatory T cell, and type 1 T helper cell had significantly higher enrichment in IS1 group (p < 0.001, Figure 5(c)). Moreover, we also observed similar results in GSE22138 dataset (p < 0.05, Figure 5(b) and (d)). According to an immunogenomic analysis of pan-cancer, the six immune subtypes (C1 to C6) could reflect various prognosis of tumors. 24 We extracted the data of immune subtypes of TCGA-UVM in the study and observed that 80 samples in total were classified into C3 and C4 groups mostly with only two samples as C5 group. 24 We matched the three immune subtypes in our study (IS1, IS2, and IS3) to the immune subtypes in the previous study (C3, C4, and C5), and found that C3 subtype was enriched in IS1 group and C4 subtype consisted mostly of IS3 group (Figure 6(a)). Such a result was reasonable because in the present study patients in IS1 group demonstrated the worst prognosis (Figure 2(d) and (g)), while overall survival of C3 subtype was lower than C4 in the literature. 24 Furthermore, we scored each sample on a total of 56 immune-related biomarkers from the literature, and 23 biomarkers were considered to have strong significant difference among IS1, IS2, and IS3 groups (FDR < 0.01, p < 0.01, Figure 6(b)). Three terms including dendritic cells, activated dendritic cells, and T Cells CD4 naive showed the highest enrichment in IS3 group, and the remaining was mostly enriched in IS1 group (Figure 6(b)).
Figure 5.
Distribution of immune-related cells and signatures within IS1, IS2, and IS3 groups. (a) Heatmap of 28 types of immune cells in three immune subtypes in TCGA-UVM dataset. Color from green to red (z-score = –4 to 6) means from low enrichment to high enrichment of immune cells. (b) Enrichment scores of activated B cells, activated CD4 T cells, activated CD8 T cells, effector memory CD4 T cells, regulatory T cells, and type 1 T helper cells in TCGA-UVM dataset. (c) Heatmap of 28 types of immune cells in three immune subtypes in GSE22138 dataset. Color from green to red (z-score = –4 to 4) means from low enrichment to high enrichment of immune cells. (d) Enrichment scores of activated B cells, activated CD4 T cells, activated CD8 T cells, effector memory CD4 T cells, regulatory T cells, and type 1T helper cells in GSE22138 dataset. (A color version of this figure is available in the online journal.)
Figure 6.
(a) Distribution of C3, C4, and C5 subtypes in IS1, IS2, and IS3 groups. Chi-square test was performed. (b) Distribution of 23 immune-related signatures with significant difference within IS1, IS2, and IS3 groups. ANOVA was performed within three groups. *p < 0.05, **p < 0.01, ***p < 0.001, ****p < 0.0001. (A color version of this figure is available in the online journal.)
Sensitivity of immunotherapy in different immune subtypes
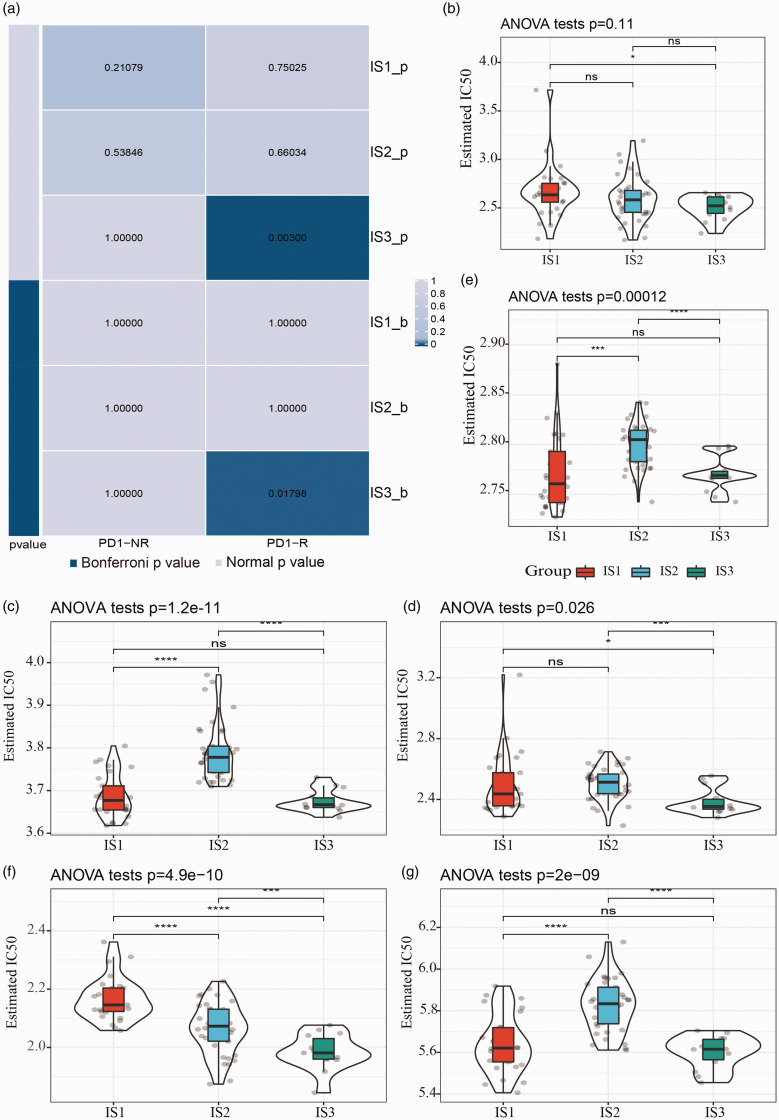
We then evaluated whether the immune subtyping system could guide immunotherapy for managing UM patients. Submap analysis revealed that IS3 group was more sensitive to programmed cell death protein 1 (PD-1) inhibitor than other two groups (Bonferroni-corrected p = 0.01798, Figure 7(a)). In addition, among six chemotherapy drugs (cisplatin, tamoxifen, sunitinib, crizotinib, sorafenib, and temozolomide), IS1 group was more sensitive to crizotinib and temozolomide treatment, while cisplatin, tamoxifen, sunitinib, sorafenib, and temozolomide treatment were more effective in IS3 group (Figure 7(b) to (g)).
Figure 7.
Sensitivity of chemotherapy drugs in IS1, IS2, and IS3 groups within GSE78220 dataset. (a) Submap analysis of the relation between PD-1 inhibiter treatment and immune subtypes. (b–g) IC50 (half maximal inhibitory concentration) of six chemotherapy drugs with cisplatin (b), tamoxifen (c), sunitinib (d), crizotinib (e), sorafenib (f), temozolomide (g) within three subtypes. (A color version of this figure is available in the online journal.)
Immune landscape of UM
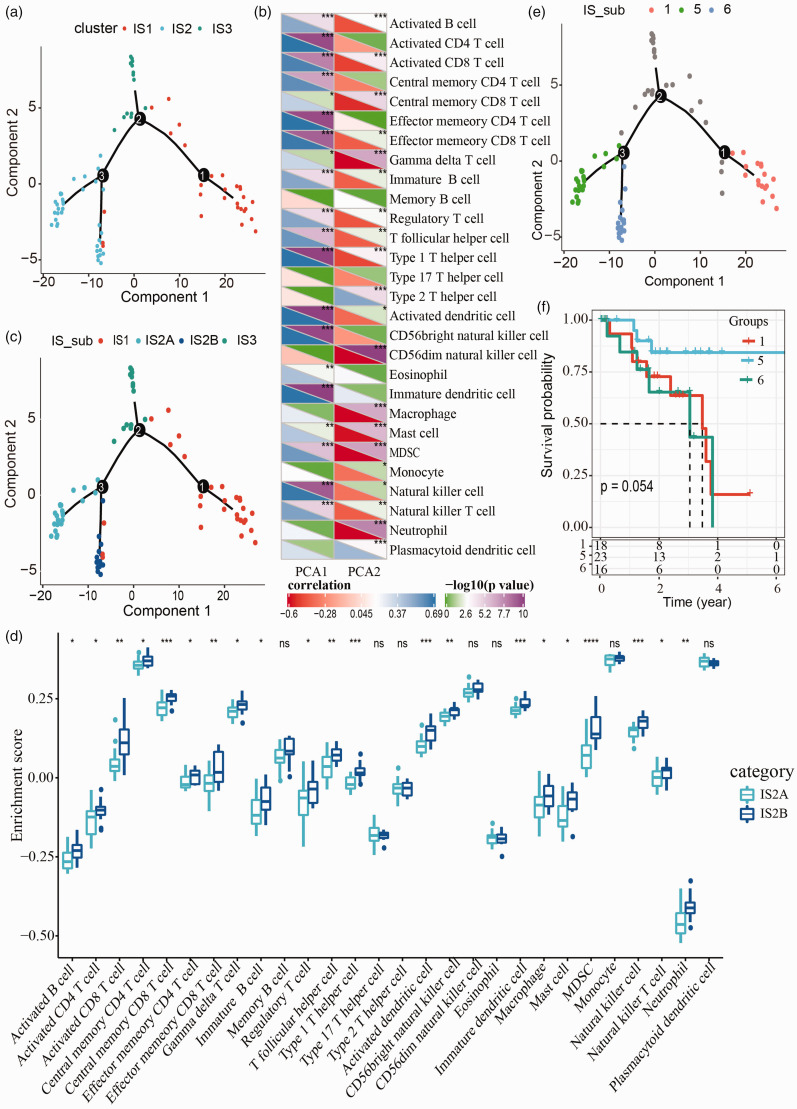
A visualized immune landscape could help delineate the immune subtypes of all samples. Therefore, we applied dimensionality reduction through a graphical tree structure. 33 As shown in Figure 8(a), three immune subtypes with different colors were clearly distinguished by the tree branches. Further analysis of the correlation between two components and 28 types of immune-related cells showed that component 1 was positively closely related to immature dendritic cells, activated dendritic cells and type 1 T helper cells, while component 2 was negatively closely related to CD56dim natural killer cells, neutrophil, MDSC, and gamma delta T cells (|R| > 0.7, p < 0.001, Figure 8(b)). Additionally, there were two branches in the IS2 group, indicating that IS2 group could be further classified into two new subtypes, which were IS2A and IS2B, respectively (Figure 8(c)). Then we scored the gene enrichment of IS2A and IS2B in immune-related cells, and 21 (75%) types of immune-related cells were differentially enriched in these two subtypes (p < 0.05, Figure 8(d)). Hence, a new series of immune subtypes were defined as IS1, IS2A, IS2B, and IS3. Survival analysis revealed that different branches (group 1, 5, and 6) had different prognosis, although it was not obvious between group 1 and group 6 (Figure 8(e) and (f)).
Figure 8.
Immune landscape of uveal melanoma within TCGA-UVM dataset. (a) A spanning tree in the two-dimensional landscape. Each point represents a sample and three different colors represent three immune subtypes (IS1, IS2, and IS3). (b) Heatmap of the relation between 28 types of immune-related cells and two components. Student’s t test was performed. PCA1 represents component 1 group and PCA2 represents component 2 group. Negative correlation and positive correlation are shown in red and blue with R value under box, respectively. –log10 (p value) is displayed as green (p > 0.05) and violet (p < 0.05). (c) Immune landscape of IS1, IS2A, IS2B, and IS3. (d) The enrichment score of IS2A and IS2B in 28 types of immune-related cells. ANOVA was performed. (e) Different branches with red (group 1), green (group 5), blue (group 6) colors in the immune landscape. (f) Kaplan-Meier survival curves of group 1, 5, and 6. *p < 0.05, **p < 0.01, ***p < 0.001, ****p < 0.0001. (A color version of this figure is available in the online journal.)
Co-expression network analysis within immune-related genes
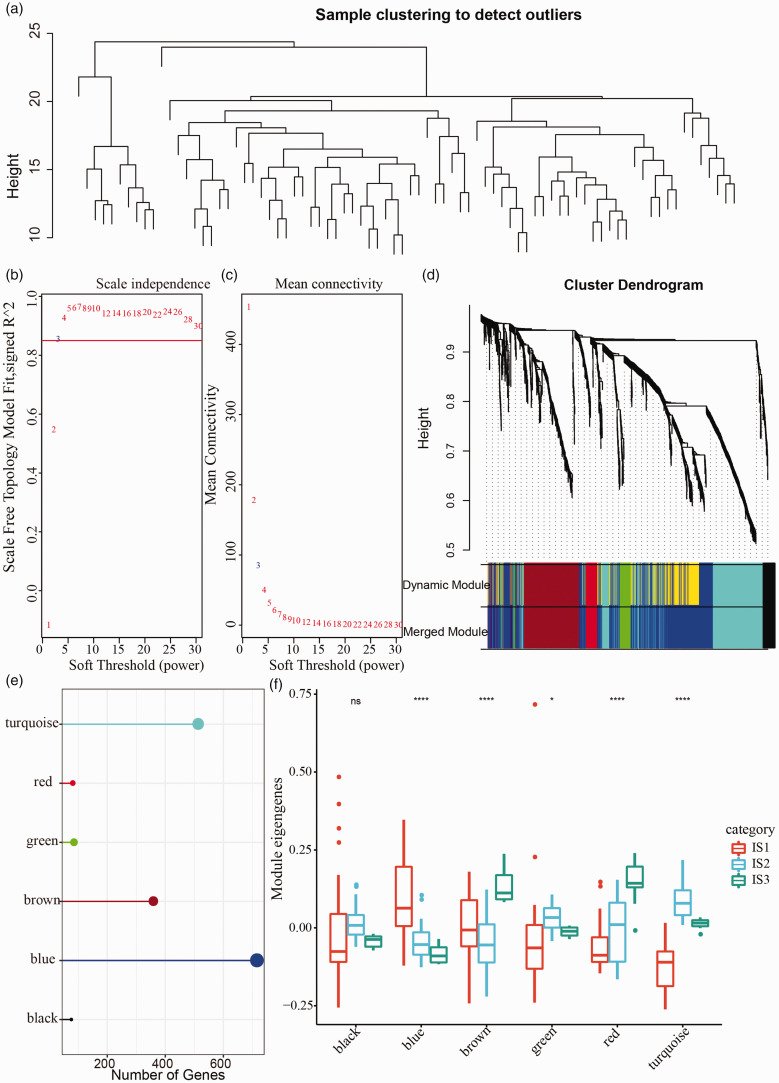
Co-expressed gene modules were identified using WGCNA within TCGA-UVM dataset. Firstly, we clustered the samples according to the expression profiles of 1809 immune-related genes (Figure 9(a)). Next, under the condition of the negative relation between log(k) and log(p(k)), R2 > 0.85 and soft threshold (power) = 3 were set to meet a scale-free network (Figure 9(b) and (c)). TOM was constructed based on adjacency matrix. We applied average-linkage hierarchical clustering and dynamic branch cutting to identify co-expression modules, with each module containing at least 30 genes. To further simply the modules, the connectivity of eigengenes was analyzed, and cluster analysis was performed to merge modules with close distance. Finally, 1809 immune-related genes were sorted into six modules colored in turquoise, red, green, brown, blue, and black (Figure 9(d) and (e)). Furthermore, the expression level of module eigengenes was significantly differential within IS1, IS2, and IS3 groups in five modules except for black module (Figure 9(f)). IS1 group showed the highest expression level in blue module and the lowest in green, red, and turquoise module, while IS3 group had the highest expression level in brown and red modules (Figure 9(f)).
Figure 9.
Co-expression gene analysis in TCGA-UVM dataset. (a) Cluster analysis of 80 samples. (b) Analysis of the scale-free fit index for various soft-thresholding powers. (c) Analysis of the mean connectivity for various soft-thresholding powers. (d) Cluster dendrogram generated by average-linkage hierarchical clustering based on topological overlap matrix and dynamic branch cutting. Modules were merged when height = 0.25, deepSplit = 2, minModuleSize = 30. (e) Quantity of gene numbers in each module. (f) Distribution of eigengenes of six modules in three immune subtypes. *p < 0.05, ****p < 0.0001. (A color version of this figure is available in the online journal.)
ns: no significance.
Function of immune-related gene modules and prognostic analysis
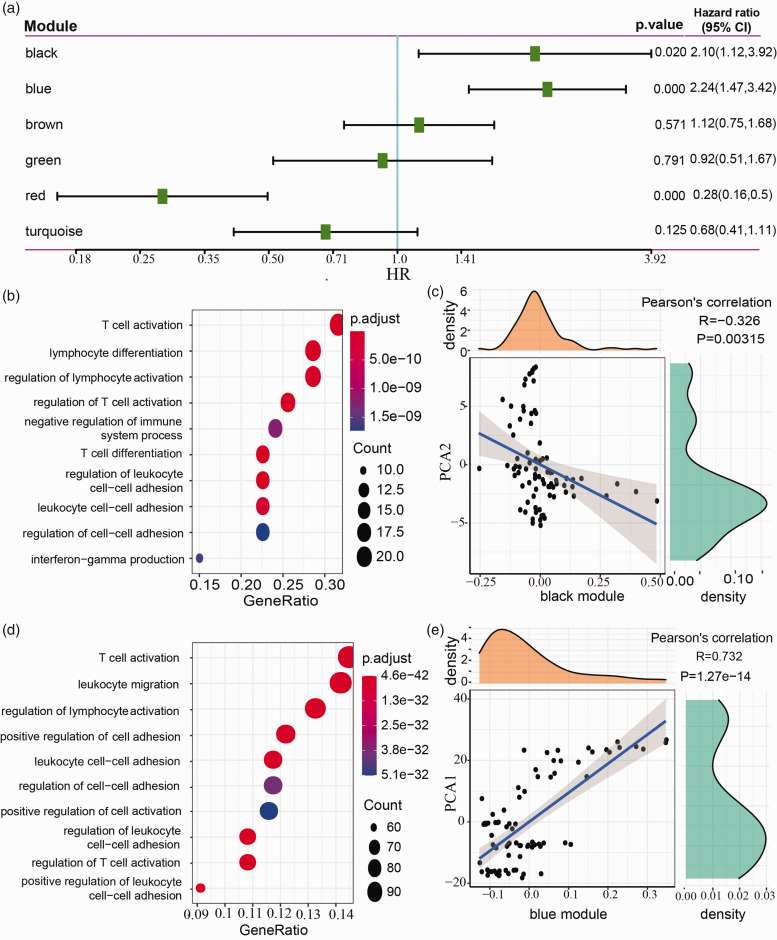
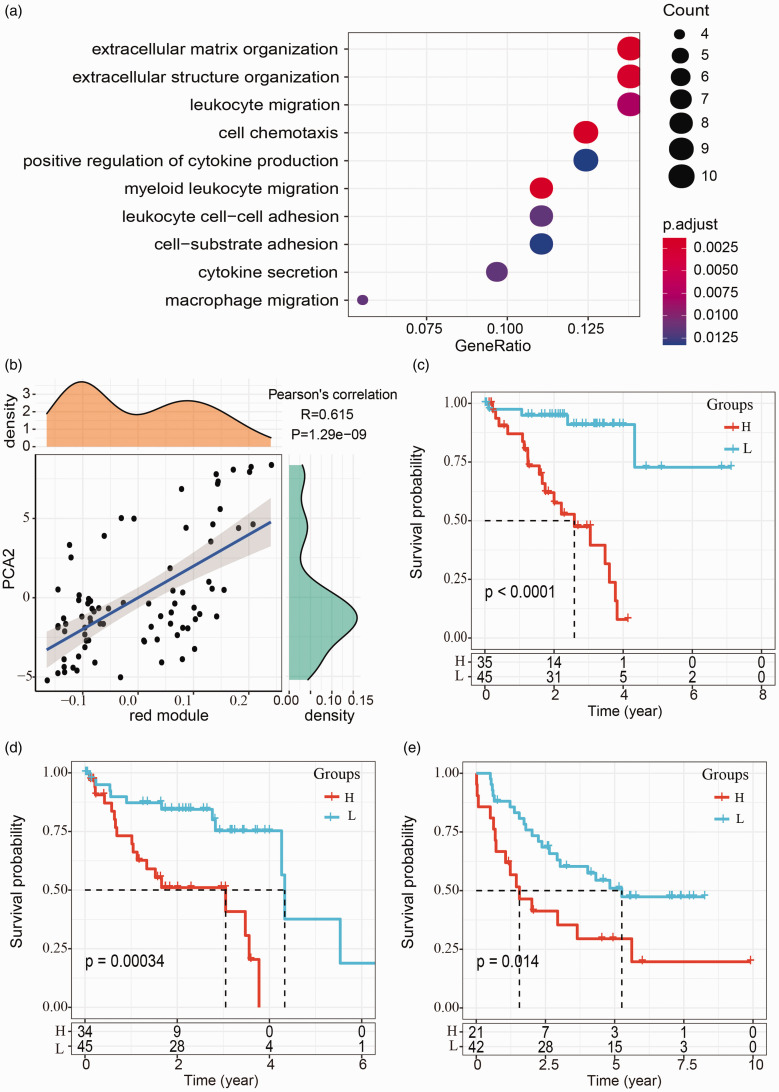
We identified six immune-related gene modules, and univariate Cox regression analysis demonstrated that several modules had a close relation with UM prognosis. Black and blue modules had a negative correlation with prognosis, with HR = 2.1 (95%CI, 1.12–3.92) and HR = 2.24 (95%CI, 1.47–3.42), respectively (p < 0.05, Figure 10(a)). Red module was positively correlated with prognosis with HR = 0.28 (95%CI, 0.16–0.50, p < 0.001, Figure 10(a)). Functional enrichment analysis was performed in black, blue, and red modules, and the top 10 enriched biological processes were listed. In black module, functional pathways such as T-cell activation, lymphocyte differentiation, and regulation of lymphocyte activation were enriched (Figure 10(b)), and black module eigengenes were negatively related to component 2 of immune landscape (R = –0.326, p = 0.00315, Figure 10(c)). Biological processes, for example, leukocyte migration, regulation of lymphocyte activation, and T-cell activation, were enriched in blue module, which was found to be positively correlated with the component 1 (R = 0.732, p = 1.27e-14, Figure 10(d) and (e)). Biological processes including leukocyte migration, extracellular structure organization, and extracellular matrix organization, were enriched in red module, which was positively correlated with the component 2 (R = 0.615, p = 1.29e-09, Figure 11(a) and (b)).
Figure 10.
Function analysis of black and blue modules. (a) Univariate Cox regression analysis of six modules. (b) Functional enrichment analysis of black module. (c) The correlation between black module eigengenes and the component 2 of immune landscape (PCA2). (d) Functional enrichment analysis of blue module. (e) The correlation between blue module eigengenes and the component 1 of immune landscape (PCA1). (A color version of this figure is available in the online journal.)
HR: hazard ratio; CI: confidence interval.
Figure 11.
Function analysis of red module, and the relation between four-gene signature and prognosis. (a) Functional enrichment analysis of red module. (b) The correlation between red module eigengenes and the component 2 of immune landscape (PCA2). (c) Kaplan-Meier survival curve of overall survival grouped by the four-gene signature in TCGA-UVM dataset. Group-H represents high-risk group and group-L represents low-risk group. (d) Kaplan-Meier survival curve of progression-free survival grouped by the four-gene signature in TCGA-UVM dataset. (e) Kaplan-Meier survival curve of overall survival grouped by the four-gene signature in GSE78220 dataset. (A color version of this figure is available in the online journal.)
Considering blue model had a stronger correlation with prognosis and immune landscape, we then explored prognostic genes from the model. For such a purpose, we exported the genes with correlation coefficient of module eigengenes >0.8 from blue model. Univariate Cox regression analysis was conducted to assess the relation between overall survival and these genes. Sixty-one differentially expressed genes in total were included as genes significantly related to survival (p < 0.01). The number of genes were reduced to seven genes (ARHGAP30, CST7, GZMH, IL32, IRF1, SNX20, VAV1) through LASSO regression analysis, and the seven genes were exported when lambda = 02,586,782, resulting in the most optimized model. Furthermore, AIC was performed to simplify the prognostic model, and a four-gene signature was determined. The definition of risk score was listed below.
The expression of IL32 and IRF1 was positively related to risk score, whereas the expression of SNX20 and VAV1 was negatively related to risk score. Survival analysis demonstrated that the four-gene signature could efficiently stratify the samples into low-risk and high-risk groups in both TCGA-UVM dataset (p < 0.001, Figure 11(c) and (d)) and GSE22138 dataset (p = 0.014, Figure 11(e)). In this way, the four genes were verified to be capable of serving as prognostic genes for UM.
Discussion
TME plays an important role in oncogenesis. Inflammatory cells, especially tumor-associated macrophages (TAMs), contribute to monocyte recruitment and therefore mediate tumor progression. 34 Evidence indicated that high-density of immune infiltration is significantly correlated with worse survival.35,36 Inspired by previous studies on the TME of UM, we investigated whether metastatic risk could be precisely defined by the differential patterns of immune infiltration.
To date, only a few studies have explored immune-related prognostic signatures of UM37,38; however, none of the studies proposed an immune-related subtyping system. The current study developed a novel classification system with robust performance in both TCGA-UVM and GSE22138 dataset. The subtyping system stratified UM patients into three major subtypes, namely, IS1, IS2, and IS3, which was significantly related to differential OS and PFS. Our results presented that IS1 group had the worst prognosis, and the expression of immune-related genes was higher than other two groups. The classification was consistent with pan-cancer subtyping system reported in a previous study, which showed the worst OS in C3 subtype and the most component of C3 in IS1 group. 32
Within the hotspot mutated genes, it was surprisingly observed that IS3 group had a lowest quantity of BAP1 mutations and only missense mutations were appeared, while IS1 and IS2 presented certain loss-of-function mutations. The level of functional BAP1 expression was proven to be highly related to UM metastasis 8 ; thus, it was reasonable to observe the longest OS in IS3 group. Moreover, a close relation between loss of BAP1 function and higher expression level of the immune biomarkers of HLA-DRA, CD38, LAG-3, and IDO1 has been found. 8 These immune biomarkers are importantly associated with immune-suppressive pathways, which may result in immunotherapy resistance.39,40 In the current study, most of immune biomarkers related to immune checkpoints inhibition had higher expression level in IS1 group and lower expression in IS3 group, which is consistent with the result of high sensitivity of PD-1 inhibiter for IS3 group. In addition, inflammatory cells, especially regularly T cells, activated CD4+ T cells, activated B cells, effector memory CD4+ T cells, activated CD8+ T cells, and type I helper cells, were highly infiltrated in IS1 group, suggesting that a poor prognosis of UM may be resulted from the activation and accumulation of these immune cells.
To comprehensively characterize the immune subtypes, we introduced immune landscape and further subdivided IS2 into IS2A and IS2B. These two groups showed varied OS and expression of immune-related cells, meaning that the immune landscape of UM was a meaningful complement to the immune subtyping system. Given that previous studies already proposed a series of immune prognostic signatures for UM,37,38 we therefore adopted a new perspective by identifying co-expressed gene modules. Six modules were identified, and three modules (black, blue, and red) were closely associated with prognosis, in particular, the relationship between the blue module and worse survival. Finally, the prognostic model was developed with four immune-related genes (IL32, IRF1, SNX20, and VAV1).
Strong evidence was reported that interleukin (IL)-32 is closely involved in immune infiltration, especially T-cell infiltration in human melanoma, and IL-32α promotes melanoma migration through Erk1/2 activation.41,42 In lung cancer and gastric cancer, IL-32 expression is also highly associated with tumor invasion and metastasis,43,44 indicating that IL-32 could serve as a prognostic biomarker. Interferon regulatory factor 1 (IRF1) is one of HLA expression regulators, and its high expression level is related to the M3 subtype that largely results in metastasis. 45 IRF1 is also considered as a positive factor of metastatic risk in the current study. SNX20 belongs to the sorting nexin (SNX) family and is highly related to immune infiltration in 25 types of cancers. 46 In a study of lung cancer immunotherapy, patients with high SNX20 expression have positive prognosis and SNX20 is effective in assessing the efficacy of PD-1 inhibiter treatment combining PD-L1. 46 Our study also revealed that high expression of SNX20 was positively related to favorable prognosis of UM patients, and that SNX20 can serve as a biomarker in UM immunotherapy. VAV1 is a signal transducer protein, and frequent VAV1 mutations have been identified in human cancers. 47 High expression of VAV1 has also been observed in pancreatic cancer, ovarian cancer, and lung cancer patients with poor prognosis. 47 However, in our study, high VAV1 expression was related to a low risk of UM metastasis. A research on lymphomagenesis detected that VAV1 deficiency increased tumorigenesis in the mice model of lymphoma-like tumors, suggesting that VAV1 may function differentially in various cancers. 48
Immune infiltration is a crucial part in TME, and various patterns of immune infiltration can indicate prognosis of UM patients. By exploiting immune-related genes and gene expression profiles, this study developed a novel stratification to classify UM patients into corresponding subtypes with differential prognosis, but this subtyping system should be further verified in more UM patients.
In the present study, we proposed an immune subtyping system which has not been reported before. The subtyping system was highly effective in stratifying UM patients, and it could guide immunotherapy in the patients selectively sensitive to clinical treatment. Moreover, the four-gene prognostic signature can serve as a predictor of UM survival or potential targets for discovering new immune-related drugs.
Supplemental Material
Supplemental material, sj-pdf-1-ebm-10.1177_15353702211053801 for Identification of molecular subtyping system and four-gene prognostic signature with immune-related genes for uveal melanoma by Fei Xia, Zhilong Yu, Aijun Deng and Guohong Gao in Experimental Biology and Medicine
Footnotes
AUTHORS’ CONTRIBUTIONS: All authors participated in the design, interpretation of the studies and analysis of the data and review of the manuscript. FX, AJD, and GHG designed the research. FX and ZLY acquired the data. ZLY performed the statistical analysis. FX, ZLY, AJD, GHG analyzed and interpreted the data. ZLY drafted the article. AJD revised the manuscript for important intellectual content.
DECLARATION OF CONFLICTING INTERESTS: The author(s) declared no potential conflicts of interest with respect to the research, authorship, and/or publication of this article.
FUNDING: The author(s) disclosed receipt of the following financial support for the research, authorship, and/or publication of this article: This work was supported by Shandong Medical and Health Science and Technology Development Program under Grant (grant number 2017WS245) and China Disabled Persons’ Federation (grant number CJFJRRB19-2019).
ORCID iD: Guohong Gao https://orcid.org/0000-0003-2384-4495
SupplementAL MATERIAL: Supplemental material for this article is available online.
References
- 1.Krantz BA, Dave N, Komatsubara KM, Marr BP, Carvajal RD. Uveal melanoma: epidemiology, etiology, and treatment of primary disease. Clin Ophthalmol 2017; 11:279–89 [DOI] [PMC free article] [PubMed] [Google Scholar]
- 2.Aronow ME, Topham AK, Singh AD. Uveal melanoma: 5-year update on incidence, treatment, and survival (SEER 1973-2013). Ocul Oncol Pathol 2018; 4:145–51 [DOI] [PMC free article] [PubMed] [Google Scholar]
- 3.Sisley K, Rennie IG, Parsons MA, Jacques R, Hammond DW, Bell SM, Potter AM, Rees RC. Abnormalities of chromosomes 3 and 8 in posterior uveal melanoma correlate with prognosis. Genes Chromosom Cancer 1997; 19:22–8 [DOI] [PubMed] [Google Scholar]
- 4.Onken MD, Worley LA, Person E, Char DH, Bowcock AM, Harbour JW. Loss of heterozygosity of chromosome 3 detected with single nucleotide polymorphisms is superior to monosomy 3 for predicting metastasis in uveal melanoma. Clin Cancer Res 2007; 13:2923–7 [DOI] [PubMed] [Google Scholar]
- 5.Shields CL, Say EAT, Hasanreisoglu M, Saktanasate J, Lawson BM, Landy JE, Badami AU, Sivalingam MD, Hauschild AJ, House RJ, Daitch ZE, Mashayekhi A, Shields JA, Ganguly A. Personalized prognosis of uveal melanoma based on cytogenetic profile in 1059 patients over an 8-Year period: the 2017 Harry S. Gradle lecture. Ophthalmology 2017; 124:1523–31 [DOI] [PubMed] [Google Scholar]
- 6.Damato B, Dopierala JA, Coupland SE. Genotypic profiling of 452 choroidal melanomas with multiplex ligation-dependent probe amplification. Clin Cancer Res 2010; 16:6083–92 [DOI] [PubMed] [Google Scholar]
- 7.Kujala E, Mäkitie T, Kivelä T. Very long-term prognosis of patients with malignant uveal melanoma. Invest Ophthalmol Vis Sci 2003; 44:4651–9 [DOI] [PubMed] [Google Scholar]
- 8.Figueiredo CR, Kalirai H, Sacco JJ, Azevedo RA, Duckworth A, Slupsky JR, Coulson JM, Coupland SE. Loss of BAP1 expression is associated with an immunosuppressive microenvironment in uveal melanoma, with implications for immunotherapy development. J Pathol 2020; 250:420–39 [DOI] [PMC free article] [PubMed] [Google Scholar]
- 9.Onken MD, Worley LA, Ehlers JP, Harbour JW. Gene expression profiling in uveal melanoma reveals two molecular classes and predicts metastatic death. Cancer Res 2004; 64:7205–9 [DOI] [PMC free article] [PubMed] [Google Scholar]
- 10.Onken MD, Worley LA, Char DH, Augsburger JJ, Correa ZM, Nudleman E, Aaberg TM, Jr, Altaweel MM, Bardenstein DS, Finger PT, Gallie BL, Harocopos GJ, Hovland PG, McGowan HD, Milman T, Mruthyunjaya P, Simpson ER, Smith ME, Wilson DJ, Wirostko WJ, Harbour JW. Collaborative ocular oncology group report number 1: prospective validation of a multi-gene prognostic assay in uveal melanoma. Ophthalmology 2012; 119:1596–603 [DOI] [PMC free article] [PubMed] [Google Scholar]
- 11.Harbour JW. A prognostic test to predict the risk of metastasis in uveal melanoma based on a 15-gene expression profile. Meth Mol Biol (Clifton, NJ) 2014; 1102:427–40 [DOI] [PMC free article] [PubMed] [Google Scholar]
- 12.Field MG, Harbour JW. Recent developments in prognostic and predictive testing in uveal melanoma. Curr Opin Ophthalmol 2014; 25:234–9 [DOI] [PMC free article] [PubMed] [Google Scholar]
- 13.Field MG, Decatur CL, Kurtenbach S, Gezgin G, van der Velden PA, Jager MJ, Kozak KN, Harbour JW. PRAME as an independent biomarker for metastasis in uveal melanoma. Clin Cancer Res 2016; 22:1234–42 [DOI] [PMC free article] [PubMed] [Google Scholar]
- 14.Robertson AG, Shih J, Yau C, Gibb EA, Oba J, Mungall KL, Hess JM, Uzunangelov V, Walter V, Danilova L, Lichtenberg TM, Kucherlapati M, Kimes PK, Tang M, Penson A, Babur O, Akbani R, Bristow CA, Hoadley KA, Iype L, Chang MT, Cherniack AD, Benz C, Mills GB, Verhaak RGW, Griewank KG, Felau I, Zenklusen JC, Gershenwald JE, Schoenfield L, Lazar AJ, Abdel-Rahman MH, Roman-Roman S, Stern MH, Cebulla CM, Williams MD, Jager MJ, Coupland SE, Esmaeli B, Kandoth C, Woodman SE. Integrative analysis identifies four molecular and clinical subsets in uveal melanoma. Cancer Cell 2017; 32:204–20.e15 [DOI] [PMC free article] [PubMed] [Google Scholar]
- 15.Souri Z, Wierenga APA, Mulder A, Jochemsen AG, Jager MJ. HLA expression in uveal melanoma: an indicator of malignancy and a modifiable immunological target. Cancers 2019; 11:1132. [DOI] [PMC free article] [PubMed] [Google Scholar]
- 16.Breuer K, Foroushani AK, Laird MR, Chen C, Sribnaia A, Lo R, Winsor GL, Hancock RE, Brinkman FS, Lynn DJ. InnateDB: systems biology of innate immunity and beyond – recent updates and continuing curation. Nucleic Acids Res 2013; 41:D1228–33 [DOI] [PMC free article] [PubMed] [Google Scholar]
- 17.Wilkerson MD, Hayes DN. ConsensusClusterPlus: a class discovery tool with confidence assessments and item tracking. Bioinformatics 2010; 26:1572–3 [DOI] [PMC free article] [PubMed] [Google Scholar]
- 18.Cibulskis K, Lawrence MS, Carter SL, Sivachenko A, Jaffe D, Sougnez C, Gabriel S, Meyerson M, Lander ES, Getz G. Sensitive detection of somatic point mutations in impure and heterogeneous cancer samples. Nat Biotechnol 2013; 31:213–9 [DOI] [PMC free article] [PubMed] [Google Scholar]
- 19.Geeleher P, Cox N, Huang RS. pRRophetic: an R package for prediction of clinical chemotherapeutic response from tumor gene expression levels. PloS One 2014; 9:e107468. [DOI] [PMC free article] [PubMed] [Google Scholar]
- 20.Trapnell C, Cacchiarelli D, Grimsby J, Pokharel P, Li S, Morse M, Lennon NJ, Livak KJ, Mikkelsen TS, Rinn JL. The dynamics and regulators of cell fate decisions are revealed by pseudotemporal ordering of single cells. Nat Biotechnol 2014; 32:381–6 [DOI] [PMC free article] [PubMed] [Google Scholar]
- 21.Langfelder P, Horvath S. WGCNA: an R package for weighted correlation network analysis. BMC Bioinformatics 2008; 9:559. [DOI] [PMC free article] [PubMed] [Google Scholar]
- 22.Hänzelmann S, Castelo R, Guinney J. GSVA: gene set variation analysis for microarray and RNA-seq data. BMC Bioinform 2013; 14:1–15 [DOI] [PMC free article] [PubMed] [Google Scholar]
- 23.Barbie DA, Tamayo P, Boehm JS, Kim SY, Moody SE, Dunn IF, Schinzel AC, Sandy P, Meylan E, Scholl C, Fröhling S, Chan EM, Sos ML, Michel K, Mermel C, Silver SJ, Weir BA, Reiling JH, Sheng Q, Gupta PB, Wadlow RC, Le H, Hoersch S, Wittner BS, Ramaswamy S, Livingston DM, Sabatini DM, Meyerson M, Thomas RK, Lander ES, Mesirov JP, Root DE, Gilliland DG, Jacks T, Hahn WC. Systematic RNA interference reveals that oncogenic KRAS-driven cancers require TBK1. Nature 2009; 462:108–12 [DOI] [PMC free article] [PubMed] [Google Scholar]
- 24.Thorsson V, Gibbs DL, Brown SD, Wolf D, Bortone DS, Ou Yang TH, Porta-Pardo E, Gao GF, Plaisier CL, Eddy JA, Ziv E, Culhane AC, Paull EO, Sivakumar IKA, Gentles AJ, Malhotra R, Farshidfar F, Colaprico A, Parker JS, Mose LE, Vo NS, Liu J, Liu Y, Rader J, Dhankani V, Reynolds SM, Bowlby R, Califano A, Cherniack AD, Anastassiou D, Bedognetti D, Mokrab Y, Newman AM, Rao A, Chen K, Krasnitz A, Hu H, Malta TM, Noushmehr H, Pedamallu CS, Bullman S, Ojesina AI, Lamb A, Zhou W, Shen H, Choueiri TK, Weinstein JN, Guinney J, Saltz J, Holt RA, Rabkin CS, Lazar AJ, Serody JS, Demicco EG, Disis ML, Vincent BG, Shmulevich I. The immune landscape of cancer. Immunity 2018; 48:812–30.e14 [DOI] [PMC free article] [PubMed] [Google Scholar]
- 25.Jiao X, Sherman BT, Huang da W, Stephens R, Baseler MW, Lane HC, Lempicki RA. DAVID-WS: a stateful web service to facilitate gene/protein list analysis. Bioinformatics 2012; 28:1805–6 [DOI] [PMC free article] [PubMed] [Google Scholar]
- 26.Hastie T, Qian J. Glmnet vignette. Retrieved June 2014; 9:1–30 [Google Scholar]
- 27.Ripley B, Venables B, Bates DM, Hornik K, Gebhardt A, Firth D, Ripley MB. Package ‘mass. Cran r 2013; 538:113–20 [Google Scholar]
- 28.Zhang Z. Variable selection with stepwise and best subset approaches. Ann Transl Med 2016; 4:136. [DOI] [PMC free article] [PubMed] [Google Scholar]
- 29.Ghosh D, Chinnaiyan AM. Classification and selection of biomarkers in genomic data using LASSO. J Biomed Biotechnol 2005; 2005:147–54 [DOI] [PMC free article] [PubMed] [Google Scholar]
- 30.Zheng D, Ding Y, Ma Q, Zhao L, Guo X, Shen Y, He Y, Wei W, Liu F. Identification of serum MicroRNAs as novel biomarkers in esophageal squamous cell carcinoma using feature selection algorithms. Front Oncol 2018; 8:674. [DOI] [PMC free article] [PubMed] [Google Scholar]
- 31.Danilova L, Ho WJ, Zhu Q, Vithayathil T, De Jesus-Acosta A, Azad NS, Laheru DA, Fertig EJ, Anders R, Jaffee EM, Yarchoan M. Programmed cell death ligand-1 (PD-L1) and CD8 expression profiling identify an immunologic subtype of pancreatic ductal adenocarcinomas with favorable survival. Cancer Immunol Res 2019; 7:886–95 [DOI] [PMC free article] [PubMed] [Google Scholar]
- 32.Charoentong P, Finotello F, Angelova M, Mayer C, Efremova M, Rieder D, Hackl H, Trajanoski Z. Pan-cancer immunogenomic analyses reveal genotype-immunophenotype relationships and predictors of response to checkpoint blockade. Cell Rep 2017; 18:248–62 [DOI] [PubMed] [Google Scholar]
- 33.Mao Q, Wang L, Goodison S, Sun Y. Dimensionality reduction via graph structure learning. In: Proceedings of the 21th ACM SIGKDD international conference on knowledge discovery and data mining. Sydney, NSW, Australia: Association for Computing Machinery, 2015, pp.765–774.
- 34.Noy R, Pollard JW. Tumor-associated macrophages: from mechanisms to therapy. Immunity 2014; 41:49–61 [DOI] [PMC free article] [PubMed] [Google Scholar]
- 35.Bronkhorst IH, Jager MJ. Inflammation in uveal melanoma. Eye (Lond) 2013; 27:217–23 [DOI] [PMC free article] [PubMed] [Google Scholar]
- 36.Bronkhorst IH, Ly LV, Jordanova ES, Vrolijk J, Versluis M, Luyten GP, Jager MJ. Detection of M2-macrophages in uveal melanoma and relation with survival. Invest Ophthalmol Vis Sci 2011; 52:643–50 [DOI] [PubMed] [Google Scholar]
- 37.Wang Y, Xu Y, Dai X, Lin X, Shan Y, Ye J. The prognostic landscape of adaptive immune resistance signatures and infiltrating immune cells in the tumor microenvironment of uveal melanoma. Exp Eye Res 2020; 196:108069. [DOI] [PubMed] [Google Scholar]
- 38.Li YZ, Huang Y, Deng XY, Tu CS. Identification of an immune-related signature for the prognosis of uveal melanoma. Int J Ophthalmol 2020; 13:458–65 [DOI] [PMC free article] [PubMed] [Google Scholar]
- 39.Marin-Acevedo JA, Dholaria B, Soyano AE, Knutson KL, Chumsri S, Lou Y. Next generation of immune checkpoint therapy in cancer: new developments and challenges. J Hematol Oncol 2018; 11:39. [DOI] [PMC free article] [PubMed] [Google Scholar]
- 40.Amaro A, Gangemi R, Piaggio F, Angelini G, Barisione G, Ferrini S, Pfeffer U. The biology of uveal melanoma. Cancer Metastasis Rev 2017; 36:109–40 [DOI] [PMC free article] [PubMed] [Google Scholar]
- 41.Lee J, Kim KE, Cheon S, Song JH, Houh Y, Kim TS, Gil M, Lee KJ, Kim S, Kim D, Hur DY, Yang Y, Bang SI, Park HJ, Cho D. Interleukin-32α induces migration of human melanoma cells through downregulation of E-cadherin. Oncotarget 2016; 7:65825–36 [DOI] [PMC free article] [PubMed] [Google Scholar]
- 42.Paz H, Tsoi J, Kalbasi A, Grasso CS, McBride WH, Schaue D, Butterfield LH, Maurer DM, Ribas A, Graeber TG, Economou JS. Interleukin 32 expression in human melanoma. J Transl Med 2019; 17:113. [DOI] [PMC free article] [PubMed] [Google Scholar]
- 43.Sorrentino C, Di Carlo E. Expression of IL-32 in human lung cancer is related to the histotype and metastatic phenotype. Am J Respir Crit Care Med 2009; 180:769–79 [DOI] [PubMed] [Google Scholar]
- 44.Ishigami S, Arigami T, Uchikado Y, Setoyama T, Kita Y, Sasaki K, Okumura H, Kurahara H, Kijima Y, Harada A, Ueno S, Natsugoe S. IL-32 expression is an independent prognostic marker for gastric cancer. Med Oncol 2013; 30:472. [DOI] [PubMed] [Google Scholar]
- 45.van Essen TH, van Pelt SI, Bronkhorst IH, Versluis M, Némati F, Laurent C, Luyten GP, van Hall T, van den Elsen PJ, van der Velden PA, Decaudin D, Jager MJ. Upregulation of HLA expression in primary uveal melanoma by infiltrating leukocytes. PloS One 2016; 11:e0164292. [DOI] [PMC free article] [PubMed] [Google Scholar]
- 46.Fan L, Li L, Huang C, Huang S, Deng J, Xiong J. Increased SNX20 and PD-L1 levels can predict the clinical response to PD-1 inhibitors in lung adenocarcinoma. Onco Targets Ther 2020; 13:10075–85 [DOI] [PMC free article] [PubMed] [Google Scholar]
- 47.Farago M, Yarnitzky T, Shalom B, Katzav S. Vav1 mutations: what makes them oncogenic? Cell Signal 2020; 65:109438. [DOI] [PubMed] [Google Scholar]
- 48.Ruiz S, Santos E, Bustelo XR. The use of knockout mice reveals a synergistic role of the Vav1 and Rasgrf2 gene deficiencies in lymphomagenesis and metastasis. PloS One 2009; 4:e8229. [DOI] [PMC free article] [PubMed] [Google Scholar]
Associated Data
This section collects any data citations, data availability statements, or supplementary materials included in this article.
Supplementary Materials
Supplemental material, sj-pdf-1-ebm-10.1177_15353702211053801 for Identification of molecular subtyping system and four-gene prognostic signature with immune-related genes for uveal melanoma by Fei Xia, Zhilong Yu, Aijun Deng and Guohong Gao in Experimental Biology and Medicine


