Abstract
Nonalcoholic fatty liver disease (NAFLD) develops rapidly in high-fat diet (HFD) fed Mongolian gerbil (Meriones unguiculatus). Here, we aim to explore the gene expression characteristics of Mongolian gerbil to better understand the underlying mechanism in this animal model. Mongolian gerbils were fed with normal diet or HFD for different periods. High-throughput sequencing was carried out on the hepatic mRNA and bioinformatics analysis was further performed. Eight hub genes Cd44, App, Cdc42, Cd68, Cxcr4, Csf1r, Adgre1, and Fermt3, which were involved in inflammation, fibrosis, and HCC were obtained. Four significant independent poor prognostic factors for HCC (GPC1, ARPC1B, DAB2, and CFL1) were screened out. qRT-PCR result showed that the above genes expressed high levels in different periods of modeling process. The findings of this study provide useful information for further studies on Mongolian gerbil NAFLD model.
Keywords: Gerbil, Mongolian gerbil (Meriones unguiculatus), NAFLD, NASH, fibrosis, HCC, transcriptome profiling
Impact statement
Mongolian gerbil has been used for the study of the metabolic disease since the 1960s and became an ideal NAFLD model with rapid progression. Unfortunately, the lack of comprehensive genomic and related transcriptome information limits its application for the research to a great extent. Here we report the comparative analysis results of the hepatic transcriptome data from NAFLD gerbil model induced by high-fat diet of different lengths. The genes whose expression changed in a continuous manner were analyzed emphatically and eight hub genes were obtained. Furthermore, four significant independent poor prognostic factors for HCC were found highly up-regulated. This study provides a comprehensive understanding of NAFLD gerbil gene expression and the clues for gerbil as a potential experimental model of NAFLD-related HCC.
Introduction
Nonalcoholic fatty liver disease (NAFLD) is generally considered the hepatic symptom of the metabolic syndrome (MS). 1 It is the most popular chronic liver disease around the world and is becoming a major public health concern. NAFLD may develop from early simple steatosis (SS) to nonalcoholic steatosis (NASH) without any intervention. NASH may involve fibrosis, cirrhosis, and even hepatocellular carcinoma (HCC). 2 To date, the pathogenesis of NAFLD has not been clearly explained and an appropriate animal model is critical for improving our understanding of the cause and progression of this disease. 3
Currently, the rodent models of NAFLD by diet induction are normally mice and rats. However, the composition, distribution of serum lipoproteins, and the lipid metabolism in mice and rats are quite different from those in humans. Furthermore, the formation of liver fibrosis in NAFLD mice requires a continuous high-fat diet (HFD) for at least 24 weeks. Rats have a high tolerance for high fat, and it is not easy to induce hepatic fibrosis by diet. Liver fibrosis in NAFLD rats can only be formed after more than 48 weeks of continuous high fat feeding, and the survival rate is less than 10%. Furthermore, the process of hepatic fibrosis induced by CCl4 is quite different from that induced by NAFLD. 4
Mongolian gerbil (Meriones unguiculatus) is an ideal rodent model for NAFLD with rapid progression. 5 Much research has revealed that it is highly sensitive to HFD, and its lipid metabolism is similar to that of human in many aspects. 6 Although Mongolian gerbil (hereinafter referred to as gerbil) has been used for the study of the metabolic disease since the 1960s, the lack of comprehensive genome and related transcriptome information has largely limited its application in the research. In this work, we tried to better understand the mechanism underlying the rapid developmnet of NASH in gerbil by analyzing the transcriptome profiling of different modeling times. The HFD-fed gerbils for 4 weeks (4W), 8 weeks (8W), and 16 weeks (16W) were used to establish a NAFLD model of the complete process from steatosis to fibrosis, and the transcriptome data were analyzed in-depth.
Eight hub genes, extracellular matrix receptor III (Cd44), amyloid-β precursor protein (App), cell division control protein 42 homolog (Cdc42), macrosialin (Cd68), C-X-C chemokine receptor type 4 (Cxcr4), the colony-stimulating factor 1 receptor (Csf1r), the gene encoding F4/80 (Adgre1), and Kindlin-3 (Fermt3) were obtained. They were all involved in inflammation response, in which Cdc42 and Fermt3 are associated with HCC. Fibrosis-related genes exhibited high transcript levels within the very early stage of modeling (HFD for 4W). We further screened out four significant independent poor prognostic factors for HCC: Glypican-1 (GPC1), actin-related protein 2/3 complex subunit 1B (ARPC1B), Disabled homolog 2 (DAB2), and Cofilin-1 (CFL). Intriguingly, we found the four genes showed high expression levels within the modeling process. Our findings indicated that the gerbil NAFLD model developed inflammation and fibrosis in the very early stage of modeling. Prolonging the modeling time may lead to NAFLD-related HCC.
Materials and methods
Animals
All the animal-related procedures in this study were approved by the Ethics Committee of Zhejiang University of Traditional Chinese Medicine (Resolution number ZSLL-2012–77). Male adult Mongolian gerbils with a weight of 40–60 g (Z: ZCAL) were provided by the Experimental Animal Center of Zhejiang Academy of Medical Sciences (production license: SYXK(Zhe) 2008–0115).
After adaptive feeding for one week, 36 male gerbils were divided into the normal diet (ND) group and the HFD group randomly. Each group was divided into 4-week (4W), 8-week (8W), and 16-week (16W), with six gerbils in each group. The gerbils in the ND group were fed with ND and given water freely. The gerbils in the HFD group were fed with HFD and had water freely. The HFD consists of 80.5% ordinary feed, 10% egg yolk powder, 7% lard bile, 2% cholesterol, and 0.5% No. 3 bile salt. The ordinary feed and high-fat feed were processed and produced by the Zhejiang Academy of Medical Sciences Center of Laboratory Animals.
The gerbils were sacrificed at 4th week, 8th week, and 16th week, respectively. Before the experiment, the gerbils were fasted for 18 h and provided with water only. The blood samples were collected under anesthesia, and the serum was separated for biochemical analysis. Some of the liver tissue was immediately cut into a frozen section for Oil-red O staining. Some of the liver tissue was fixed in 10% formalin, dehydrated, dipped in wax, embedded in paraffin for hematoxylin-eosin (HE), or Masson staining. The remaining liver tissue was kept at –80°C for later use.
Hepatic histological examination and biochemistry tests
Oil-red O, HE, and Masson staining were performed according to the standard procedure. Serum alanine aminotransferase (ALT, E.C. 2.6.1.2), aspartate aminotransferase (AST, E.C. 2.6.1.1), triglyceride (TG), and cholangiocarcinoma (CHOL) were measured by a commercial kit (DiaSys Diagnostic System GmbH).
High-throughput mRNA sequencing and unigene annotation
High-throughput mRNA sequencing was performed by LC-BIO Technologies (Hangzhou) Co., Ltd. Total hepatic RNA was extracted by Trizol (Invitrogen, CA, USA). The total hepatic RNA was quantified by the 2100 Bioanalyzer (Agilent Technologies) and purified by RNA 6000 Nano LabChip Kit (Agilent, CA, USA) with RIN number >7.0. Then the purified mRNA was randomly broken into short fragments. The cDNA library was generated by the mRNA-Seq sample preparation kit ( Illumina, San Diego, USA). Sequencing was conducted on the Hiseq4000 platform via 150PE strategy using a paired-end library normally inserted with a size of 350 ± 50 bp. After removing the low-quality reads, the clean reads were de novo assembly by Trinity version 2.4.0. The transcripts were clustered according to the sharing sequences. The longest transcript in each cluster was identified as a “unigene.”
All unigenes were searched against the following database: NCBI NR protein database (http://www.ncbi.nlm.nih.gov/), Swiss-Prot (http://www.expasy.ch/sprot/), Gene Ontology (GO) (http://www.geneontology.org), Kyoto Encyclopedia of Genes and Genomes (KEGG) (http://www.genome.jp/kegg/), and eggNOG (http://eggnogdb.embl.de/) databases by DIAMOND with E-value <0.00001.
DEGs identification
The differentially expressed genes (DEGs) between HFD vs. ND of 4W, 8W, and 16W were identified using Limma (3.32.5) (http://bioconductor.org/packages/release/bioc/html/limma.html) based on the significance threshold of P < 0.05 and |logFC|>1. Hierarchical clustering was performed on the DEGs from the three gene sets obtained by pairwise stage comparisons using Pheatmap (1.0.8) (https://cran.r-project.org/web/packages/pheatmap/index.html) and the heatmap was generated. Based on the analysis of mouse homologous sequences, enriched GO Biological Process (GO-BP) terms and KEGG pathways were identified using Metascape version 3.32.5 (http://metascape.org/) (FDR <0.05).
WGCNA, Mufzz analysis, and protein–protein interaction network generation
Weighted gene correlation network analysis (WGCNA) was performed by WGCNA version 1.61 (https://cran.r-project.org/web/packages/WGCNA/index.html). Mufzz cluster was conducted by Mfuzz version 2.42.0 (http://www.bioconductor.org/packages/release/bioc/html/Mfuzz.html). Based on the analysis of mouse homologous sequences, the sharing DEGs between WGCNA and Mufzz gene sets were analyzed using STRING Version 11.0 (https://string-db.org/) to search the interaction between the proteins and produce the protein–protein interaction (PPI) network. Visualization was created by Cytoscape (3.6.1). Then degrees of the nodes were calculated by analysis of the topological characteristics to search for hub genes from the PPI network. GO-BP or KEGG pathway analyses were conducted by Metascape (P <0.05).
Identification of the significant independent adverse prognostic factors for HCC
The gene expression profile data of “Hepatocellular carcinoma” was downloaded from the database of TCGA (https://gdc-portal.nci.nih.gov/). Information of 420 samples was obtained, including 50 normal controls and 370 tumor samples (364 with prognosis information). Based on the analysis of human homologous sequences, univariate and multivariate Cox regression analyses were performed on the sharing DEGs in the PPI network to identify the independent prognostic factors using Survival package version 2.42.6 of R3.4.1 (https://cran.r-project.org/web/packages/survival/index.html). The samples were sorted into low- and high-level groups according to the median expression level of each DEGs. The Kaplan-Meier survival curves were created by Survival package of R (3.4.1).
qRT-PCR
The mRNA sequences were spliced using by LC-BIO Technologies (Hangzhou) Co., Ltd. using Trans Decoder-3.0.1. Based on these mRNA sequences, the primers for qRT-PCR were designed. The qRT-PCR was performed as previously described. 7 Total RNAs from liver tissues were extracted by Takara RNA Extraction Kit (Takara, Dalian, China; Cat # 9767). cDNA was synthesized by PrimeScript Master Kit (Takara, Dalian, China; Cat # RR036A). The qRT-PCR was conducted by TB Green Premix Ex TaqII (Takara, Dalian, China; Cat # RR820A) and run on C1000™ Thermal Cycler CFX 384 (Bio-Rad). Relative expression levels were determined by the 2−ΔΔCT method. Gerbil Gapdh served as the internal control. Primer sequences were displayed in Table S1. SPSS17.0 software was used for the statistical analyses. The results were shown as mean ± SD.
Results
Establishment of gerbil NAFLD model induced by HFD
To establish the NAFLD model of the whole process from steatosis to fibrosis, male gerbils were fed with HFD for 4-week (4W), 8-week (8W), and 16-week (16W), respectively. The gerbils fed with ND for the same periods were served as the control groups.
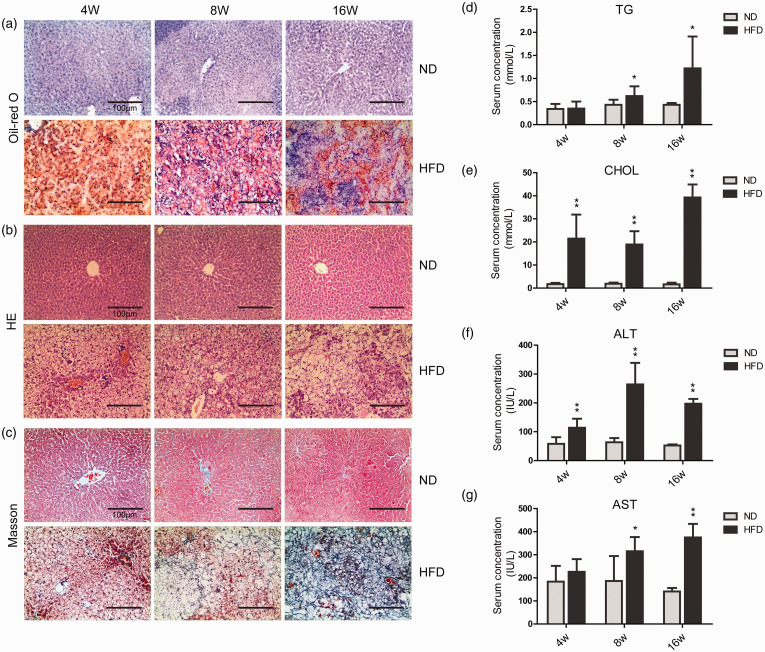
The liver tissues of gerbils were stained with Oil-red O, HE, and Masson, respectively, to evaluate lipid accumulation, inflammatory cell infiltration, and fibrosis. As shown in Figure 1(a), in the HFD-4W group, a large amount of red-stained lipid droplets appeared in the hepatocytes. From the HFD-8W group to the HFD-16W group, the red-colored areas of the liver slices showed a decrease. HE and Masson staining showed that the liver tissue of gerbils in the HFD-4W group was diffused with lipid vacuoles. A small quantity of inflammatory cell infiltration and slight collagen deposition occurred. With the prolonged time of HFD, the infiltration of inflammatory cells and the collagen deposition greatly increased. Liver tissue sections of the HFD-16W group exhibited signs of early cirrhosis (Figure 1(b) and (c)).
Figure 1.
Representative liver sections and the analysis of serum samples. (a) Oil-red O stained gerbil liver sections (scale bar = 100 μm). (b) HE stained liver sections (scale bar = 100 μm). (c) Masson stained liver sections (scale bar = 100 μm). (d) Serum concentrations of TG. (e) Serum concentrations of CHOL. (f) Serum concentrations of ALT. (g) Serum concentrations of AST. ND, normal diet; HFD, high-fat diet; 4W, 4-week; 8W, 8-week; 16W, 16-week. Experimental results are shown as the mean value ± SD (n= 6). *P < 0.05, **P < 0.01. (A color version of this figure is available in the online journal.)
The serum TG and CHOL were detected to determine the blood lipid levels and the serum ALT and AST were measured for the evaluation of liver function. The serum TG levels in HFD-8W and HFD-16W groups were significantly higher than those in the control groups (Figure 1(d)).The levels of serum CHOL in all HFD groups were much higher than those in the ND groups (Figure 1(e)).The serum ALT level of each HFD group was significantly higher than that in the ND group, and the HFD-8W group exhibited the highest ALT level (Figure 1(f)). Compared with the ND groups, serum AST levels in the HFD-8W and HFD-16W groups were significantly higher (Figure 1(g)).
Illumina sequencing, de novo assembly, and functional annotation
A total of 924,834,608 raw sequence reads were generated. After filtering the low-quality reads, the valid reads percent of each cDNA library was higher than 97.60% (Table 1). De novo assembly by Trinity software yielded 32,424 unigenes ranging in size of 201 nucleotides (nt) to 15,452 nt with an N50 of 3,074 nt (Table 2). The set of the unigenes was served as the reference transcriptome to further annotate and to analyze the DEGs between the ND-and HFD-fed samples.
Table 1.
Output statistics of RNA-seq samples.
| Samples | Raw reads | Raw bases | Valid reads | Valid bases | Valid % | Q20 % | Q30 % | GC % |
|---|---|---|---|---|---|---|---|---|
| ND-4W-1 | 53,297,720 | 7.99G | 52,242,194 | 7.66G | 98.02 | 98.29 | 95.38 | 49.78 |
| ND-4W-2 | 54,833,870 | 8.23G | 53,715,812 | 7.91G | 97.96 | 98.80 | 96.47 | 48.66 |
| ND-4W-3 | 49,358,704 | 7.40G | 48,507,944 | 7.13G | 98.28 | 98.33 | 95.53 | 50.25 |
| ND-8W-1 | 57,988,636 | 8.70G | 57,006,612 | 8.38G | 98.31 | 98.46 | 95.75 | 50.11 |
| ND-8W-2 | 55,105,796 | 8.27G | 54,124,926 | 7.95G | 98.22 | 98.40 | 95.62 | 50.60 |
| ND-8W-3 | 45,585,784 | 6.84G | 45,132,700 | 6.66G | 99.01 | 98.60 | 96.11 | 49.99 |
| ND-16W-1 | 42,627,452 | 6.01G | 42,189,834 | 5.90G | 98.97 | 98.32 | 94.52 | 49.77 |
| ND-16W-2 | 44,687,954 | 6.30G | 44,264,266 | 6.20G | 99.05 | 98.36 | 94.54 | 49.16 |
| ND-16W-3 | 50,558,066 | 7.13G | 50,041,154 | 7.00G | 98.98 | 98.33 | 94.50 | 49.72 |
| HFD-4W-1 | 53,297,720 | 7.99G | 52,242,194 | 7.66G | 98.02 | 98.29 | 95.38 | 49.78 |
| HFD-4W-2 | 54,833,870 | 8.23G | 53,715,812 | 7.91G | 97.96 | 98.80 | 96.47 | 48.66 |
| HFD-4W-3 | 49,358,704 | 7.40G | 48,507,944 | 7.13G | 98.28 | 98.33 | 95.53 | 50.25 |
| HFD-8W-1 | 55,828,734 | 8.37G | 55,045,872 | 8.12G | 98.60 | 98.65 | 96.24 | 50.45 |
| HFD-8W-2 | 56,242,448 | 8.44G | 55,325,602 | 8.14G | 98.37 | 98.43 | 95.71 | 50.98 |
| HFD-8W-3 | 45,327,538 | 6.80G | 44,238,078 | 6.50G | 97.60 | 98.59 | 95.97 | 49.43 |
| HFD-16W-1 | 54,117,976 | 8.12G | 53,161,316 | 7.80G | 98.23 | 98.34 | 95.49 | 51.30 |
| HFD-16W-2 | 54,947,604 | 8.24G | 54,213,726 | 7.99G | 98.66 | 98.65 | 96.23 | 51.52 |
| HFD-16W-3 | 46,836,032 | 7.03G | 45,824,512 | 6.74G | 97.84 | 98.70 | 96.20 | 50.16 |
Table 2.
De novo assembling of high-quality clean reads.
| Index | Unigenes | GC% | Min length (nt) | Median length (nt) | Max length (nt) | Total assembled bases | N50 |
|---|---|---|---|---|---|---|---|
| Transcripts | 96,836 | 50.97 | 201 | 1334.00 | 15,452 | 174,285,079 | 2,997 |
| Unigenes | 32,424 | 49.27 | 201 | 540.00 | 15,452 | 45,142,812 | 3,074 |
A total of 32,424 unigenes were annotated in six public databases using the software DIAMOND. Among them, 14,164 were annotated in GO (the Gene ontology database), 12,006 were annotated in KEGG (Figure S1), 12,141 were annotated in the Pfam database, 14,076 were annotated in SwissProt (the Swiss-Prot protein database), 14,632 were annotated in eggNOG, and 16,031 were annotated in NCBI NR database (Table 3).
Table 3.
Functional annotation of Gerbil unigenes.
| Database for annotation | Number of unigenes annotated | Ratio (%) |
|---|---|---|
| GO | 14,164 | 43.68 |
| KEGG | 12,006 | 37.03 |
| Pfam | 12,141 | 37.44 |
| Swiss-Prot | 14,076 | 43.41 |
| eggNOG | 14,632 | 45.13 |
| NR | 16,031 | 49.44 |
| Total unigenes | 32,424 | 100.00 |
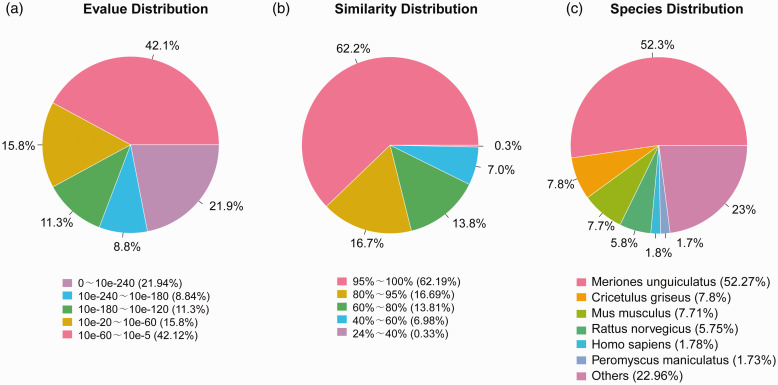
The NR annotation showed that 21.94% of the annotated sequences had the top homology (E-value ≦ 10−240), 35.94% exhibited high sequence homology (10−240 <E-value ≦ 10−60), and an additional 42.12% showed a homology between E-values of 10–60 to 10–5 (Figure 2(a)). Concerning the similarity distribution, 62.19% of the sequences showed a similarity higher than 95%, and 30.5% of the hits exhibited similarities of 60–95%. There was an additional 7.31% sequences having similarities of 24–60% (Figure 2(b)). Species distribution analysis revealed that 52.27% of the unique genes had top hits to sequences from Meriones unguiculatus, with additional matches to Cricetulus griseus (7.8%), Mus musculus (7.71%), Rattus norvegicus (5.75), Homo sapiens (1.78%), and Peromyscus maniculatus (1.73%). There was 22.96% of the unique genes matched the sequences of other species (Figure 2(c)).
Figure 2.
Top BLAST hits for each Mongolian gerbil unigenes against the NR database. (a) E-value distribution. (b) Similarity distribution. (c) Species distribution. (A color version of this figure is available in the online journal.)
Data preprocessing and DEGs identification
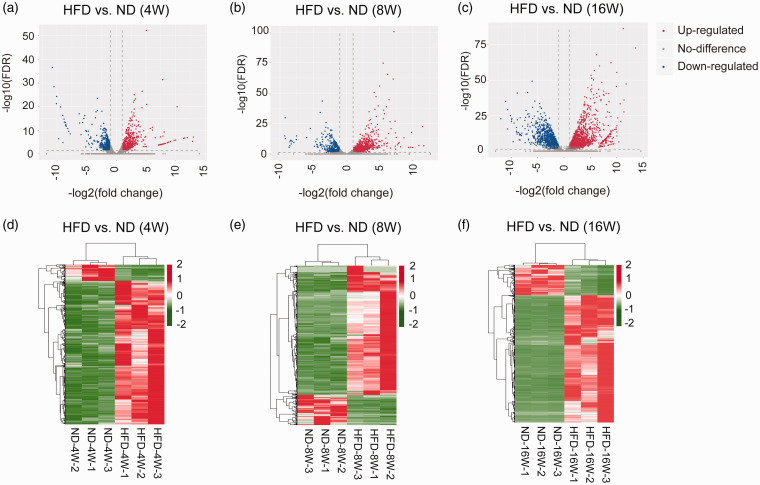
The number of raw reads per sample was transformed to Transcripts Per Million (TPM) and the expression levels for each sample were normalized (Figure S2). The differentially expressed genes (DEGs) in HFD groups vs. ND groups of 4W, 8W, and 16W were screened using the limma package in R3.4.1. From the three comparisons, 1,957 DEGs (1757 up- and 200 down-regulated), 2,102 DEGs (1724 up- and 378 down-regulated), and 2,943 DEGs (2407 up- and 536 down-regulated) were obtained separately. Volcano plots (Figure 3(a) to (c)) and hierarchical clustering maps(Figure 3(d) to (f)) of the DEGs in samples from 4W, 8W, and 16W showed that the expression values of the DEGs separated different types of samples in distinct colors, which indicated that the DEGs obtained had different expression patterns. The DEGs of the comparisons of 4W, 8W, and 16W were mainly involved in biological processes such as cell component movement, inflammatory response, and cardiovascular system development. They mainly acted in pathways of tuberculosis, ribosome, and focal adhesion, etc., respectively (Figure S3).
Figure 3.
The expression profiles of the DEGs from the pairwise comparisons at 4W, 8W, and 16W time points. (a to c).Volcano plot of effect size (log2 FC) and −log10 (FDR) of the DEGs from 4W, 8W and 16W time points. (d to f). Heatmap of the DEGs from 4W, 8W, and 16W time points. (A color version of this figure is available in the online journal.)
Screening of common DEGs of the three time points of 4W, 8W, and 16W
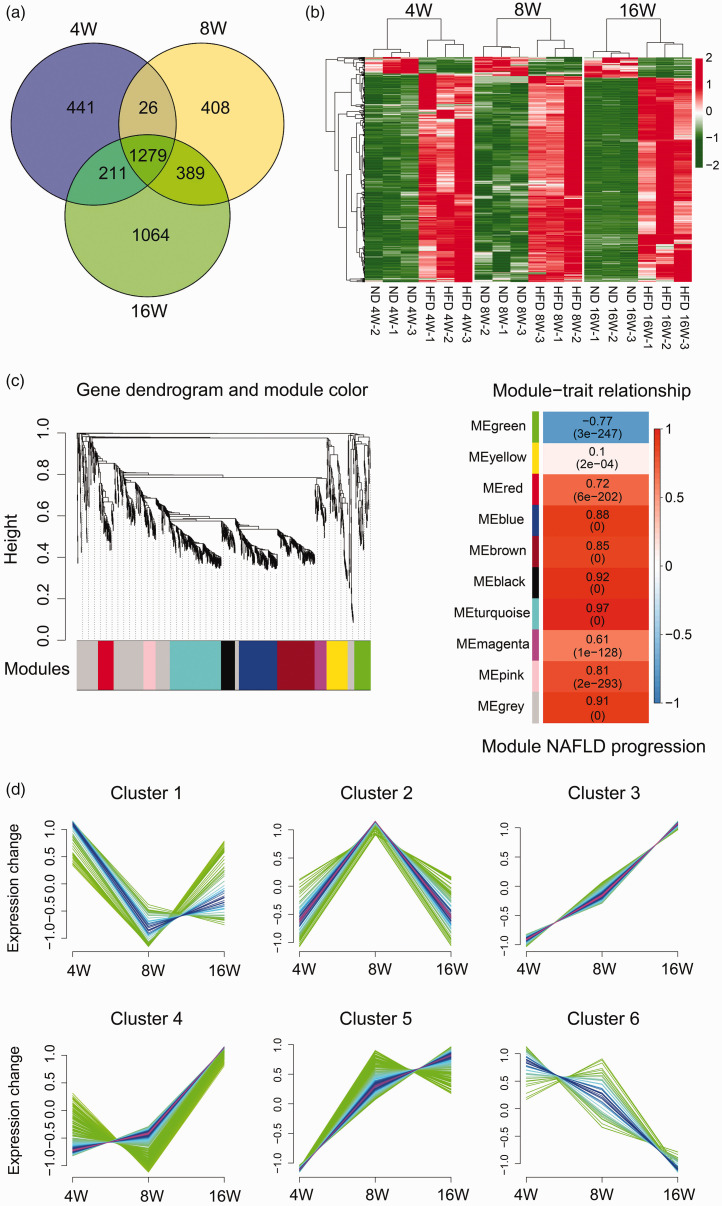
We took the intersection of DEGs from 4W, 8W, and 16W time points, and 1,279 common DEGs were obtained (Figure 4(a)), in which 1,185 DEGs were significantly up-regulated and 94 were significantly down-regulated. Based on the expression levels of the DEGs in each time point, hierarchical clustering maps were generated. Figure 4(b) demonstrated that the overlapping DEGs in different time points were of distinct expression pattern; 212 BPs and 47 signaling pathways were obtained using GO and KEGG analysis (Figure S4).
Figure 4.
Analysis of the overlapping DEGs of the pairwise comparisons from 4W, 8W, and 16W groups. (a) The Venn diagram presents the number of DEGs from three pairwise comparisons. (b) Heatmap of the DEGs from the three pairwise comparisons. (c) WGCNA analysis of the common DEGs of the three pairwise comparisons. The gene dendrogram and module color maps on the left present the co-expressed DEG modules. Each module is marked with a specific color (gray module presents unassigned DEGs). Each vertical line in the “leaf” represents a DEG. The right diagraph shows trait and module relationship analysis. Each column indicates a trait, and each row represents a module eigengene. The numbers in each row represent the correlation coefficient between each module and a trait. The number in brackets represents the P value. (d) Mfuzz clustering analysis. The ordinate shows the expression change of the common DEGs and the abscissa represents the time points. (A color version of this figure is available in the online journal.)
WGCNA network analysis
In order to select DEGs that are highly correlated with the progression of NAFLD in gerbils, WGCNA was performed on the 1,279 common DEGs (Figure 4(c)). To generate a scale-free network, the soft thresholding 28 was selected (Figure S5). Ten co-expression modules were determined by Dynamic tree cut method (cut height 0.995, Figure 4(c), left). Correlations between NAFLD progression and modules were calculated. The correlation coefficient of the green module is negative, gray module is not classified into any modules, and other modules is positive (Figure 4(c), right). We selected the other eight modules except for the green module and the gray module for further analysis.
Clustering of gene expression changes
In the meanwhile, the 1,279 common DEGs were clustered using the Mfuzz R software package. As shown in Figure 4(d), a total of six clusters were obtained, in which Cluster 3, 4, and 5 indicating the DEGs with sustained upregulation over the time course (1,056 DEGs) and Cluster 6 (42 DEGs) indicating the DEGs with opposite expression pattern. We selected Clusters 3, 4, 5, and 6 for further analysis.
PPI network construction
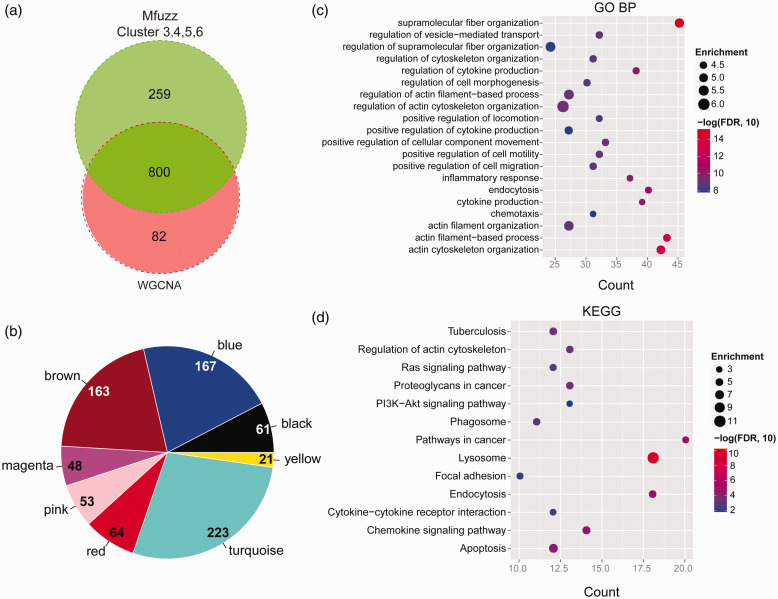
Next, 800 overlapping DEGs between the selected DEGs from WGCNA and Mfuzz were obtained (Figure 5(a) and (b)). The interaction relationships between the proteins encoded by the 800 overlapping genes were searched on the STRING database. A total of 1,319 interaction pairs were obtained and the PPI network was generated (Figure S6); 91 GO-BP and 13 KEGG terms were categorized from the DEGs in the PPI network (Figure 5(c) and (d)). The associated GO-BP terms were supramolecular fiber organization, actin filament-based process, actin cytoskeleton organization, endocytosis and regulation of cytokine production, etc. The related KEGG pathways were lysosome, endocytosis, pathways in cancer, chemokine signaling pathway, apoptosis, etc.
Figure 5.
PPI network generation and enrichment of GO-BP terms or KEGG pathway. (a) Venn diagrams shows the number of DEGs from Mfuzz and WGCNA analysis. (b) The distribution of the common DEGs from Figure 5(a) in each WGCNA modules. (c) GO-BP terms enrichment of the DEGs in the PPI network (Figure S6). (d) KEGG pathway analysis of the DEGs among the PPI network (Figure S6). (A color version of this figure is available in the online journal.)
qRT-PCR verification of the hub genes
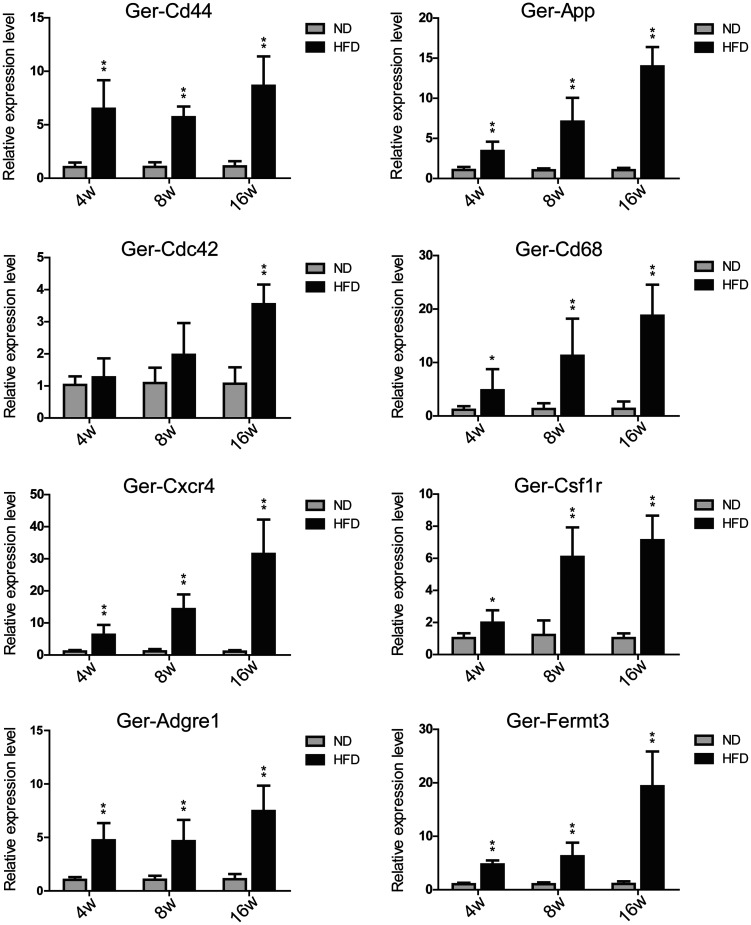
We selected eight hub genes Cd44, App, Cdc42, Cd68, Cxcr4, Csf1r, Adgre1, and Fermt3 with the highest degrees to performed qRT-PCR verification (Figure 6). Except for Ger-Cdc42, the expression of the other seven genes exhibited a significant increase from the fourth week of HFD feeding. Among the seven genes, the expression levels of five genes Ger-Cd44, Ger-Cd68, Ger-Cxcr4, Ger-Adgre1, and Ger-Fermt3 in HFD-4W were more than four times higher than in the ND-4W group.
Figure 6.
qRT-PCR verification of the selected hub genes. Gerbil Gapdh served as the internal control. *P < 0.05, **P < 0.01 compared with ND group (n = 6/group). The prefix “Ger-” of the gene name presented Gerbil.
Discussion
Epidemiology shows that hyperlipidemia is an important risk factor for NAFLD, and 20%–92% of patients with hyperlipidemia are complicated with NAFLD. 8 However, the NAFLD models of mice and rats induced by HFD show no symptoms of hyperlipidemia. Our biochemical result showed that the serum TG levels showed an upward trend with the prolonged of the HFD feeding time (Figure 1(d)). This result demonstrated that the gerbil model of NAFLD is closer to human NAFLD. Serum liver enzymes analysis showed that serum ALT level was increased significantly after HFD feeding for four weeks (Figure 1(f)). This result revealed that the liver function was impaired in gerbils with HFD-fed for 4W, which suggested the rapid occurrence and development of NAFLD in gerbils. The hub genes, which are highly interconnected with the progression of NAFLD, provide important clues for a better understanding of the mechanism of the rapid occurrence and development of NAFLD in gerbils. Therefore, we generated the PPI network (Figure S6) using the overlapping DEGs from the intersection of WGCNA and Mfuzz (Figure 5(a) and (b)). We selected eight hub genes Cd44, App, Cdc42, Cd68, Cxcr4, Csf1r, Adgre1, and Fermt3 with the highest degrees for qRT-PCR verification (Figure 6). Except for Ger-Cdc42, the expression of the other seven genes exhibited a significant increase from the fourth HFD feeding week.
During the different time points of HFD feeding, the expression of Ger-Cxcr4 increased the most, followed by Ger-Fermt3 and Ger-Cd68. Homing of inflammatory cells to the liver and Kupffer cell (KC) activation are crucial for the progression of NASH. Cxcr4 is a receptor of Cxcl12 and Cxcl12- Cxcr4 plays a vital role in cell migration 9 and energy metabolism. 10 Cd68 is one of the KC activation markers. 11 Fermt3 regulates the activation of integrin and adhesion enhancement of effector T cells. 12 It was found that the high expression level of Fermt3 is strongly linked to the occurrence and progression of tumors,13,14 including HCC. 15 The result demonstrated that the inflammatory cell recruitment and KC activation have been initiated in 4W HFD-fed gerbils and increased with the prolongation of high-fat feeding time.
Cd44 is a key player for liver inflammatory respond. The degree of hepatic steatosis, inflammation and fibrosis was greatly reduced in the CD44-deficient mouse model. 16 App has been widely reported in Alzheimer’s disease and it is involved in neuroinflammation. 17 It was reported that App might be associated with severe NAFLD, while the mechanism has not been described in detail. 18 Csf1r is associated with KC expansion and/or activation. 19 Adgre1 has been widely used as a marker for monocyte/macrophage in mice. 19 It can be seen that Cd44, App, Csf1r, and Adgre1 are all involved in the inflammatory response. Our result showed that the expressions of the above genes in the HFD groups increased dramatically from the fourth week of HFD feeding, suggesting that the inflammatory response has been triggered from the first period of modeling.
The expression level of Ger-Cdc42 showed significantly enhanced in the HFD-16W group. Cdc42 belongs to the Rho family of small guanosine triphosphatases (GTPases). Studies have found that Cdc42 is overexpressed in various cancers and it is related to metastasis in HCC cells. 20 It was observed that Cdc42 is crucial for chronic inflammation. It is considered to be involved in the development from NAFLD to HCC. 21
From the above discussion, it is clear that all the eight hub genes are involved in the inflammatory response, in which Fermt3 and Cdc42 are related to HCC. This result indicated that on one hand the inflammation response occurred in the early stage of HFD-feeding and ran through the whole progression of NAFLD, and on the other hand, different HCC-related genes were activated in different modeling times. For example, Ger-Fermt3 and Ger-Cdc42 showed a high expression level in the 4th and 16th week of HFD feeding, respectively.
To better understand the relationship between gene functions and the progression of NAFLD, we conducted GO-BP terms analysis and KEGG pathway categorization on the DEGs among the PPI network. The top three GO-BP terms were supramolecular fiber organization, actin filament-based process, and actin cytoskeleton organization (Figure 5(c)). The “Supramolecular fiber organization” is a process of extracellular fibril organization and biogenesis, which is associated with fibrosis. The “Actin filament-based process” and “Actin cytoskeleton organization” are both associated with inflammatory response and fibrosis. In brief, these findings indicated that, except for inflammatory response, fibrosis was another major event in gerbil NAFLD progression during the three periods of HFD feeding.
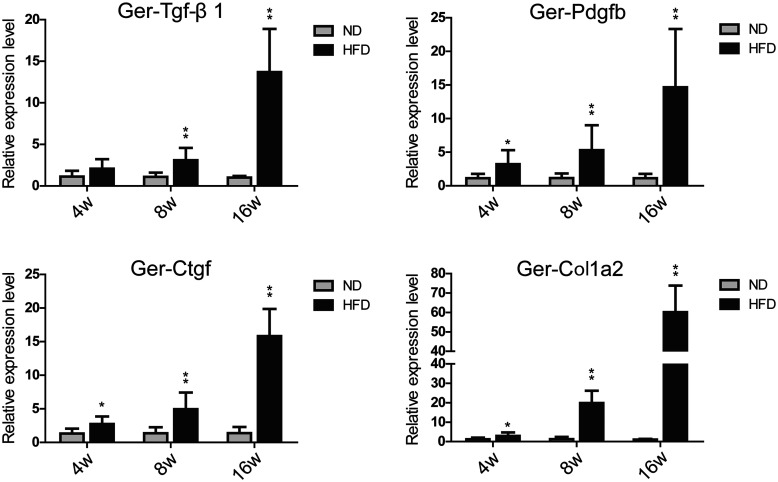
Therefore, we analyzed the transcript levels of the fibrosis-related genes transforming growth factor-β (Tgf-β1), platelet-derived growth factor B (Pdgfb), connective tissue growth factor (Ctgf), and collagen, type I, alpha 2 (Col1a2) at the three time points (Figure 7). The result revealed that the transcript level of Ger-Tgf-β1 increased significantly from the eighth HFD feeding week; the expression levels of Ger-Pdgfb, Ger-Ctgf, and Ger-Col1a2 increased significantly from the fourth HFD feeding week. The expression level of Ger-Tgf-β1 of the HFD-16W group was about 14 times higher than that of the ND-16W group(13.69 ± 5.21**). The mRNA levels of Ger-Pdgfb and Ger-Ctgf were about 15 and 16 times higher than that of the ND group (14.66 ± 8.68**, 15.82 ± 4.05**), respectively. At the 4th, 8th and 16th feeding week, the expression levels of Ger-Col1a2 in the HFD groups were about three times (2.94 ± 1.75**), 20 times (19.87 ± 6.34**), and 60 times (60.13 ± 13.71**) higher than that in the ND group at the same time point (*P < 0.05, **P < 0.01, compared with ND group). Combined with the pathological observation (Figure 1(c)), this result revealed that the collagen deposition had been triggered during the four-week of HFD feeding and early cirrhosis formed within 16-week of HFD feeding.
Figure 7.
qRT-PCR verification of the fibrosis related genes. Gerbil Gapdh served as the internal control. *P < 0.05, **P < 0.01 compared with ND group (n = 6/group). The prefix “Ger-” of the gene name presented Gerbil.
The KEGG pathway categorization of the DEGs among the PPI network showed that Pathways in cancer is one of the three top pathways (Figure 5(d)). Intriguingly, in the above sections of our discussion, we have noted the high expression levels of HCC-related genes in the HFD-induced NAFLD gerbil. This inspired a question, that is, whether the adverse prognostic factors for HCC also began to express during the modeling. To address the question, we used publicly available data of the TCGA database to identify the DEGs associated with the poor prognosis of HCC.
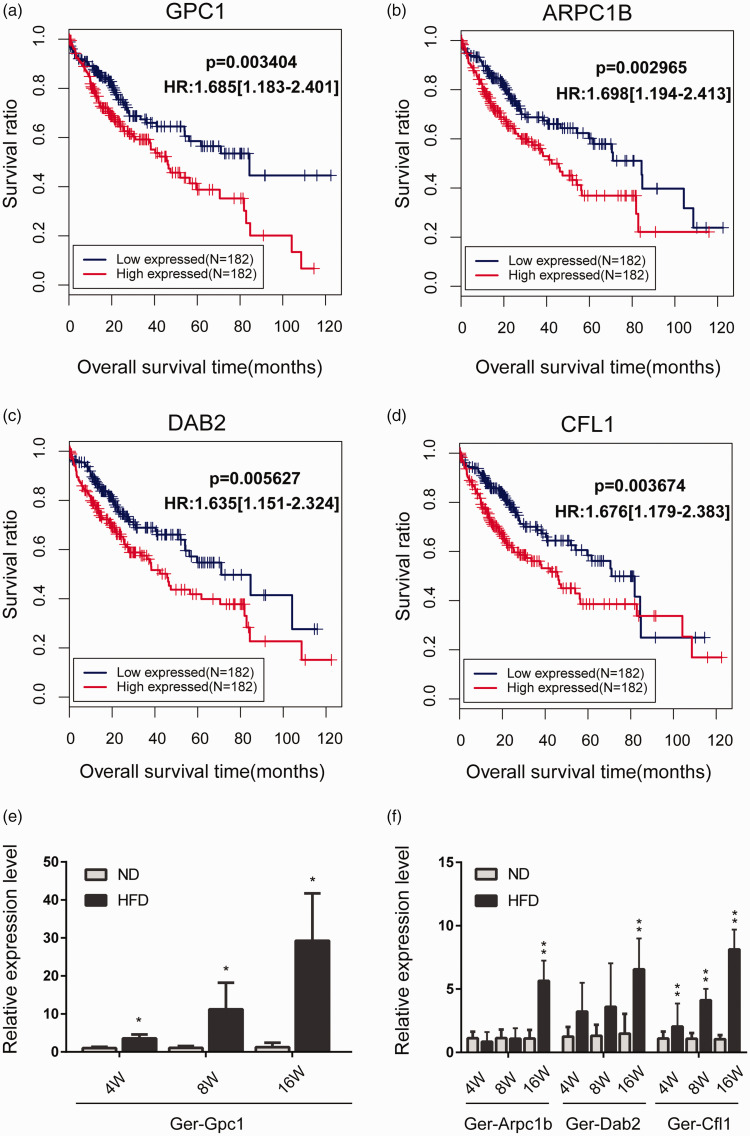
The gene expression profile data related to “Hepatocellular carcinoma” was downloaded from the TCGA database. The information of 420 samples were obtained, including 50 normal controls and 370 tumor samples (364 of which provided prognosis information). According to the homologous sequences between gerbil and humans, we selected the genes sharing with the 800 DEGs among the PPI network. First, we performed univariate Cox regression analysis using Survival package Version 2.42.6 (R3.4.1) and 32 DEGs related to the prognosis of HCC were obtained. Then the data were further analyzed by multivariate Cox regression and four significant independent factors of worse prognosis GPC1, ARPC1B, DAB2, and CFL1 were obtained. According to the expression levels of the four genes, Kaplan-Meier survival curves were generated. As shown in Figure 8(a) to (d), the poor prognosis of HCC was significantly correlated with higher expression of GPC1, ARPC1B, DAB2, and CFL1. Our result also revealed the high level of these four genes in HCC samples (Figure S7).
Figure 8.
The Kaplan-Meier overall survival curves of significant independent factors of poor prognosis for HCC and the qRT-PCR verification in gerbil NAFLD models. (a–d) Kaplan-Meier curves showing overall survival of patients with HCC based on GPC1, ARPC1B, DAB2, and CFL1 status, respectively. HCC, hepatocellular carcinoma. (e and f) qRT-PCR verification of the HCC prognostic genes in gerbils. Gerbil Gapdh was used as the internal control. *P < 0.05, ** P < 0.01 compared with ND group (n = 6/group). The prefix “Ger-” of the gene name presented Gerbil. (A color version of this figure is available in the online journal.)
GPC1 is highly expressed in various tumor tissues while hardly expressed in normal tissues. Recent research showed that Gpc1 can be used in the early diagnosis of pancreatic cancer and is associated with disease progression and tumor burden. 22 ARPC1B is involved in cytoskeleton remodeling. 23 It was reported that ARPC1B overexpression in tumors is associated with the worst metastasis-free survival in breast cancer patients. 24 DAB2 was found to have the tumor-suppressive effect, and low DAB2 expression was detected in a variety of cancers, including HCC. 25 However, our TGCA analysis showed that DAB2 was higher expressed in HCC patients (Figure 8(c), Figure S7). CFL1 is an actin-binding protein with relatively high expression level in a variety of tumor tissues. It is considered to be a potential target for inhibiting the development and metastasis of malignant tumors. 26
The qRT-PCR (Figure 8(e) and (f)) result showed that the expression of Ger-Gpc1 increased dramatically with the prolonged HFD feeding time (Figure 8(e)). In the 4th, 8th, and 16th week of HFD feeding, the expression of Ger-Gpc1 of the HFD group was approximately 4 times (3.56 ± 1.06**), 11 times (11.22 ± 7.02**), and 29 times (29.25 ± 12.47**) higher than that of the ND group, respectively (*P < 0.05, **P < 0.01). The mRNA levels of Ger-Arpc1b and Ger-Dab2 (Figure 8(f)) were significantly enhanced in the HFD-16W group. Compared with the control group, the mRNA level of Ger-Cfl1 increased significantly (2.05 ± 1.81*, 4.12 ± 0.90**, and 8.13 ± 1.56**) during the three periods of HFD feeding (*P < 0.05, **P < 0.01, Figure 8(f)). The overexpression of significant independent adverse prognostic factors for HCC suggested a potential link with HCC risk.
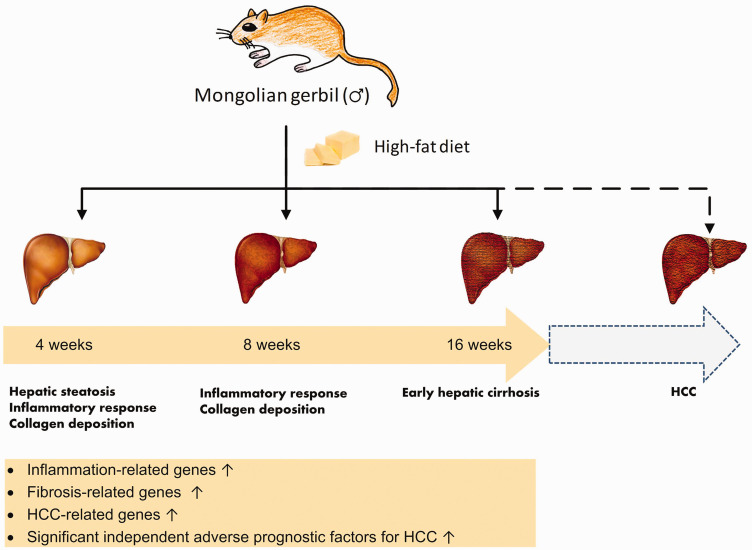
Our results revealed that the inflammatory response ran through the whole process of NAFLD in gerbil. The collagen deposition was triggered within 4-week of HFD feeding, and early hepatic cirrhosis was formed during 16-week of HFD treatment. The overexpression of the HCC-related genes suggested a risk of HCC. These findings revealed that Mongolian gerbil model of NAFLD induced by HFD progressed rapidly in inflammation and fibrosis, which may further develop into HCC with prolonged modeling time (Figure 9). More research is needed to further investigate this finding.
Figure 9.
Brief schematic overview of NAFLD progression in the HFD Mongolian gerbil model. Inflammation and fibrosis develop rapidly in the HFD Mongolian gerbil model. Prolonging the modeling time may lead to the formation of NAFLD-related HCC. (A color version of this figure is available in the online journal.)
Supplemental Material
Supplemental material, sj-pdf-1-ebm-10.1177_15353702211055099 for Bioinformatics analysis of an animal model of diet-induced nonalcoholic fatty liver disease with rapid progression by Wei Hong, Tingting Zhang, Junbin Yan, Jianshun Yu, Beihui He, Liyan Wu, Kannan Yao, Wei Mao and Zhiyun Chen in Experimental Biology and Medicine
Footnotes
AUTHORS’ CONTRIBUTIONS: HW analyzed the data and drafted the article. ZTT analyzed the data and performed qRT-PCR. YJB performed qRT-PCR. YJS performed animal experiments and biochemistry experiments. HBH, WLY and YKN performed animal experiments.CZY and MW revised the manuscript. The final manuscript has been approved by all the authors.
DECLARATION OF CONFLICTING INTERESTS: The author(s) declared no potential conflicts of interest with respect to the research, authorship, and/or publication of this article.
FUNDING: The author(s) disclosed receipt of the following financial support for the research, authorship, and/or publication of this article: This work is supported by the National Natural Science Foundation of China (81973610, 81573761, 81673706); Zheijiang Provincial Experimental Animal Science and Technology Plans (2012C37088); and Zhejiang Traditional Chinese Medicine Science and Technology Plan Project (2019ZA055).
DATA AVAILABILITY: The high-throughput mRNA sequencing raw data were uploaded to the Gene Expression Omnibus (GEO) database (https://www.ncbi.nlm.nih.gov/geo/query/acc.cgi?acc=GSE157169).
ORCID iD: Zhiyun Chen https://orcid.org/0000-0002-2072-444X
SupplementAL MATERIAL: Supplemental material for this article is available online.
References
- 1.Souza MRDA. Metabolic syndrome and risk factors for non-alcoholic fatty liver disease. Arq Gastroenterol 2012; 49:89–96 [DOI] [PubMed] [Google Scholar]
- 2.Mehta SR. Advances in the treatment of nonalcoholic fatty liver disease. Ther Adv Endocrinol Metab 2010; 1:101–15 [DOI] [PMC free article] [PubMed] [Google Scholar]
- 3.Kohli R, Feldstein AE. NASH animal models: are we there yet? J Hepatol 2011; 55:941–3 [DOI] [PubMed] [Google Scholar]
- 4.Temmerman AM, Vonk RJ, Niezen-Koning K, Berger R, Fernandes J. Effects of dietary cholesterol in the Mongolian gerbil and the rat: a comparative study. Lab Anim 1989; 23:30–5 [DOI] [PubMed] [Google Scholar]
- 5.Li W, Guan Z, Brisset JC, Shi Q, Lou Q, Ma Y, Suriguga S, Ying H, Sa X, Chen Z, Quax WJ, Chu X. A nonalcoholic fatty liver disease cirrhosis model in gerbil: the dynamic relationship between hepatic lipid metabolism and cirrhosis. Ther Adv Endocrinol Metab 2018; 11:146–57 [PMC free article] [PubMed] [Google Scholar]
- 6.Seiler M, Hamilton M, Lauris V, Herrera M. Hegsted DJAJoP Hyperlipemia in the gerbil: effect of diet on hepatic lipogenesis. Am J Physiol 1971; 221:554–8 [DOI] [PubMed] [Google Scholar]
- 7.Hong W, Li SS, Wu LY, He BH, Jiang JP, Chen ZY. Prediction of VEGF-C as a key target of pure total flavonoids from citrus against NAFLD in mice via network pharmacology. Front Pharmacol 2019; 10: [DOI] [PMC free article] [PubMed] [Google Scholar]
- 8.Bellentani S, Scaglioni F, Marino M, Bedogni G. Epidemiology of non-alcoholic fatty liver disease. Dig Dis 2010; 28:155–61 [DOI] [PubMed] [Google Scholar]
- 9.Chen W, Zhang J, Fan HN, Zhu JS. Function and therapeutic advances of chemokine and its receptor in nonalcoholic fatty liver disease. Therap Adv Gastroenterol 2018; 11:1756284818815184. [DOI] [PMC free article] [PubMed] [Google Scholar]
- 10.Yano T, Liu Z, Donovan J, Thomas MK, Habener JF. Stromal cell derived factor-1 (SDF-1)/CXCL12 attenuates diabetes in mice and promotes pancreatic beta-cell survival by activation of the prosurvival kinase akt. Diabetes 2007; 56:2946–57 [DOI] [PubMed] [Google Scholar]
- 11.Song M, Chen T, Prough RA, Cave MC, McClain CJ. Chronic alcohol consumption causes liver injury in high-fructose-fed male mice through enhanced hepatic inflammatory response. Alcohol Clin Exp Res 2016; 40:518–28 [DOI] [PMC free article] [PubMed] [Google Scholar]
- 12.Moretti FA, Moser M, Lyck R, Abadier M, Ruppert R, Engelhardt B, Fassler R. Kindlin-3 regulates integrin activation and adhesion reinforcement of effector T cells. Proc Natl Acad Sci U S A 2013; 110:17005–10 [DOI] [PMC free article] [PubMed] [Google Scholar]
- 13.Kiriyama K, Hirohashi Y, Torigoe T, Kubo T, Tamura Y, Kanaseki T, Takahashi A, Nakazawa E, Saka E, Ragnarsson C, Nakatsugawa M, Inoda S, Asanuma H, Takasu H, Hasegawa T, Yasoshima T, Hirata K, Sato N. Expression and function of FERMT genes in colon carcinoma cells. Anticancer Res 2013; 33:167–73 [PubMed] [Google Scholar]
- 14.Lu CH, Cui CZ, Liu B, Zou SF, Song HW, Tian HF, Zhao J, Li Y. FERMT3 contributes to glioblastoma cell proliferation and chemoresistance to temozolomide through integrin mediated Wnt signaling. Neurosci Lett 2017; 657:77–83 [DOI] [PubMed] [Google Scholar]
- 15.Hu ZG, Huang PB, Yan YC, Zhou ZY, Wang J, Wu G. Hepatitis B virus X protein related lncRNA WEE2-AS1 promotes hepatocellular carcinoma proliferation and invasion. Biochem Biophys Res Commun 2019; 508:79–86 [DOI] [PubMed] [Google Scholar]
- 16.Patouraux S, Rousseau D, Bonnafous S, Lebeaupin C, Luci C, Canivet CM, Schneck AS, Bertola A, Saint-Paul MC, Iannelli A, Gugenheim J, Anty R, Tran A, Bailly-Maitre B, Gual P. CD44 is a key player in non-alcoholic steatohepatitis. J Hepatol 2017; 67:328–38 [DOI] [PubMed] [Google Scholar]
- 17.Alasmari F, Alshammari MA, Alasmari AF, Alanazi WA, Alhazzani K. Neuroinflammatory cytokines induce amyloid beta neurotoxicity through modulating amyloid precursor protein levels/metabolism. Biomed Res Int 2018; 2018:3087475. [DOI] [PMC free article] [PubMed] [Google Scholar]
- 18.Qi S, Wang CH, Li CL, Wang P, Liu MH. Candidate genes investigation for severe nonalcoholic fatty liver disease based on bioinformatics analysis. Medicine (Baltimore) 2017; 96:e7743. [DOI] [PMC free article] [PubMed] [Google Scholar]
- 19.Waddell LA, Lefevre L, Bush SJ, Raper A, Young R, Lisowski ZM, McCulloch MEB, Muriuki C, Sauter KA, Clark EL, Irvine KM, Pridans C, Hope JC, Hume DA. ADGRE1 (EMR1, F4/80) is a rapidly-evolving gene expressed in mammalian monocyte-macrophages. Front Immunol 2018; 9:2246. [DOI] [PMC free article] [PubMed] [Google Scholar]
- 20.Zhang QJ, Chen Y, Liu K. miR-185 inhibits cell migration and invasion of hepatocellular carcinoma through CDC42. Oncol Lett 2018; 16:3101–7 [DOI] [PMC free article] [PubMed] [Google Scholar]
- 21.Zhao Y, Wu TY, Zhao MF, Li CJ. The balance of protein farnesylation and geranylgeranylation during the progression of nonalcoholic fatty liver disease. J Biol Chem 2020; 295:5152–62 [DOI] [PMC free article] [PubMed] [Google Scholar]
- 22.Melo SA, Luecke LB, Kahlert C, Fernandez AF, Gammon ST, Kaye J, LeBleu VS, Mittendorf EA, Weitz J, Rahbari N, Reissfelder C, Pilarsky C, Fraga MF, Piwnica-Worms D, Kalluri R. Glypican-1 identifies cancer exosomes and detects early pancreatic cancer. Nature 2015; 523:177–82 [DOI] [PMC free article] [PubMed] [Google Scholar]
- 23.Lauber C, Klink B, Seifert M. Comparative analysis of histologically classified oligodendrogliomas reveals characteristic molecular differences between subgroups. BMC Cancer 2018; 18:399. [DOI] [PMC free article] [PubMed] [Google Scholar]
- 24.Molinie N, Rubtsova SN, Fokin A, Visweshwaran SP, Rocques N, Polesskaya A, Schnitzler A, Vacher S, Denisov EV, Tashireva LA, Perelmuter VM, Cherdyntseva NV, Bieche I, Gautreau AM. Cortical branched actin determines cell cycle progression. Cell Res 2019; 29:432–45 [DOI] [PMC free article] [PubMed] [Google Scholar]
- 25.Sun C, Yao X, Jiang Q, Sun X. miR-106b targets DAB2 to promote hepatocellular carcinoma cell proliferation and metastasis. Oncol Lett 2018; 16:3063–9 [DOI] [PMC free article] [PubMed] [Google Scholar]
- 26.Wang LX, Xiong L, Wu ZC, Miao XY, Liu ZR, Li DQ, Zou Q, Yang ZL. Expression of UGP2 and CFL1 expression levels in benign and malignant pancreatic lesions and their clinicopathological significance. World J Surg Oncol 2018; 16:11. [DOI] [PMC free article] [PubMed] [Google Scholar]
Associated Data
This section collects any data citations, data availability statements, or supplementary materials included in this article.
Supplementary Materials
Supplemental material, sj-pdf-1-ebm-10.1177_15353702211055099 for Bioinformatics analysis of an animal model of diet-induced nonalcoholic fatty liver disease with rapid progression by Wei Hong, Tingting Zhang, Junbin Yan, Jianshun Yu, Beihui He, Liyan Wu, Kannan Yao, Wei Mao and Zhiyun Chen in Experimental Biology and Medicine


