

Abstract
OBJECTIVE
To estimate direct medical and indirect costs attributable to diabetes in each U.S. state in total and per person with diabetes.
RESEARCH DESIGN AND METHODS
We used an attributable fraction approach to estimate direct medical costs using data from the 2013 State Health Expenditure Accounts, 2013 Behavioral Risk Factor Surveillance System, and the Centers for Medicare & Medicaid Services’ 2013–2014 Minimum Data Set. We used a human capital approach to estimate indirect costs measured by lost productivity from morbidity (absenteeism, presenteeism, lost household productivity, and inability to work) and premature mortality, using the 2008–2013 National Health Interview Survey, 2013 daily housework value data, 2013 mortality data from the Centers for Disease Control and Prevention Wide-ranging Online Data for Epidemiologic Research, and mean wages from the 2014 Bureau of Labor Statistics. Costs were adjusted to 2017 U.S. dollars.
RESULTS
The estimated median state economic cost was $5.9 billion, ranging from $694 million to $55.5 billion, in total and $18,248, ranging from $15,418 to $30,915, per person with diabetes. The corresponding estimates for direct medical costs were $2.8 billion (range $0.3–22.9) and $8,544 (range $6,591–12,953) and for indirect costs were $3.0 billion (range $0.4–32.6) and $9,672 (range $7,133–17,962). In general, the estimated state median indirect costs resulting from morbidity were larger than costs from mortality both in total and per person with diabetes.
CONCLUSIONS
Economic costs attributable to diabetes were large and varied widely across states. Our comprehensive state-specific estimates provide essential information needed by state policymakers to monitor the economic burden of the disease and to better plan and evaluate interventions for preventing type 2 diabetes and managing diabetes in their states.
Diabetes is a chronic disease that leads to many serious complications, including heart disease, stroke, blindness, kidney failure, and lower-limb amputations (1). Both managing diabetes and treating its complications require tremendous health care resources. Among 155 health conditions studied, diabetes ranked at the top in U.S. health care spending in 2013 (2). Diabetes also leads to substantial productivity losses in the nation’s economy, as people with diabetes may not be able to work or may take more days of sick leave or die prematurely. The estimated economic cost of diabetes, including direct medical costs and indirect productivity losses, in the U.S. was $245 billion in 2012, was $327 billion in 2017 (3,4), and has been growing over the last two decades (3–6).
Prior studies on the economic burden of diabetes in the U.S. mainly focused on costs at the national level (4–6). A few studies estimated economic cost of diabetes at the state level, but they were based on applying the national-level per-person age-, sex-, and race/ethnicity-specific cost estimates to the corresponding demographic stratum of the states (4,7). Although such analysis provides useful information to state policymakers, the estimates did not take into account other differences between states. Furthermore, state-level cost estimates borne by payers, such as Medicaid and Medicare, were not specified.
The per-person economic cost of diabetes is likely to vary across states for several reasons. First, the distribution of age, sex, and race/ethnicity groups varies by state. Second, both the amount that a person spends on health care in general and the level of spending for persons with diabetes relative to spending for those without diabetes may vary by state. Health care spending could be affected by state income level (8,9), the state’s health care policy and insurance regulations, and payer mix (Medicaid, Medicare, and other payers) (8,10). Differences in relative spending levels between persons with and without diabetes across states could be influenced by levels of health insurance coverage and specific coverage benefits across disease conditions (11). Indirect costs of diabetes and earning ability could be affected by differences across states in labor productivity, overall and diabetes-related mortality, and the level of disability among people with and without diabetes.
Because many health policy decisions regarding diabetes prevention and control are made at the state level, state public health planners, policymakers, and payers need accurate, detailed information on the economic burden of diabetes in their state. Such information is critical for diabetes surveillance, setting public health intervention priorities, and resource planning for interventions to prevent and manage diabetes. Using the most recent available state-level data, the Centers for Disease Control and Prevention (CDC) developed an online toolkit to estimate the health and economic burden of diabetes for each state in 2013 U.S. dollars (available at https://nccd.cdc.gov/Toolkit/DiabetesBurden/Home/Economic). In this study, we used state-level data to produce state-level estimates of diabetes-attributable economic costs per person among the population with diabetes, and in total, by cost component expressed in 2017 dollars.
RESEARCH DESIGN AND METHODS
We used a prevalence-based cost-of-illness approach to estimate the economic costs of diabetes for adults in each U.S. state and the District of Columbia (DC) from a societal perspective. We included both direct and indirect costs of diabetes, valued in terms of opportunity costs (the value of foregone resources) resulting from diabetes treatment and productivity losses, regardless of who bore them. All costs were expressed in 2017 U.S. dollars. Below we summarize our approaches for estimating each cost component. The detailed methods, including data sources, their descriptions, and uses, are available in the CDC’s online toolkit technical document, Section 2.2 (12).
Direct Medical Costs
We estimated direct medical costs attributable to diabetes separately for the noninstitutionalized and institutionalized populations, in total and per person with diabetes.
Noninstitutionalized Population
We used an attributable fraction (AF) approach to estimate the portion of state health expenditures attributable to diabetes by state, age, sex, payer, and service type:
In the equation, pd is the state prevalence of diabetes, RR is the cost ratio between people with and without diabetes, and j indicates age, sex, payer, and service type. We estimated state level diabetes prevalence by age-group, sex, and payer using 2013 Behavioral Risk Factor Surveillance System (BRFSS) Health Care Access Module data. RRs were estimated by payer (Medicare, Medicaid, and other [private insurance, other insurances, and patient’s out of pocket]), service type (all services combined for Medicaid), and age-group, using the 2008–2012 Medical Expenditure Panel Survey. Because of lack of detailed state-level data, RRs were estimated at the national level and applied to all states. We estimated cost ratios using a two-part regression model. In the first part, logit models estimated whether respondents had any medical spending; in the second part, generalized linear models estimated costs among those who had positive spending (13). We then estimated RRs as the ratio of predicted costs for patients with diabetes to predicted costs assuming no diabetes. Models controlled for age, age squared, sex, race/ethnicity, poverty status, education, and census region.
To estimate diabetes-attributable total medical costs, we multiplied AF estimates by projected 2013 State Health Expenditure Accounts (SHEA) estimates (14). SHEA is an accounting of state-level “personal health care” based on the National Health Expenditure Accounts data and state-level data on health care expenditures from the economic census and other sources. It excludes administrative and net costs of private health insurance, government public health activities, and investment in research, structures, and equipment (14). To obtain per-person diabetes-attributable medical costs, we divided total costs by the number of people with diabetes in each age-sex stratum. Medicare and Medicaid costs were calculated based on the number of people with diabetes covered by those insurers; for “other” payers, costs were based on all people with diabetes because “other” costs in SHEA represent costs paid by private payers, other third-party payers, and patient out-of-pocket payments.
Institutionalized Population
For the institutionalized population, we estimated an AF weighted by the Centers for Medicare & Medicaid Services’ Resource Utilization Groups (RUGs) payments. RUGs represent levels of care intensity in nursing homes and are assigned to all residents based on their activities of daily living, dependency score, and other clinical care needs (15). RUG-weighted AFs were calculated for each state by age-group and sex and applied to nursing home expenditures from SHEA. The RUG-weighted AF is the weighted excess diabetes prevalence in nursing homes compared with community prevalence:
ND and NN are the number of long-term stay nursing home residents with and without diabetes, respectively. RUGD and RUGN are average RUG payments for nursing home residents with diabetes and without diabetes, respectively. CD is the prevalence of diabetes in the community. We used Centers for Medicare & Medicaid Services’ 2013–2014 Minimum Data Set to estimate state-level diabetes prevalence in the nursing home and average RUG payments by diabetes status.
We estimated state-level nursing home expenses attributable to diabetes by multiplying AFs by the state nursing home spending estimates by payer, age-group, and sex. For state-level nursing home expenditures, we used the Nursing Care Facilities and Continuing Care Communities cost category from SHEA, subtracting the estimated portion that was for continuing care retirement communities. To obtain per-person estimates, we divided total diabetes-attributable nursing home costs by the estimated number of people with diabetes (from BRFSS) in the community plus active nursing home residents with diabetes (from the Minimum Data Set).
We adjusted all medical cost estimates to 2017 dollars using the annual average medical care component of the consumer price index.
Indirect Costs
We used a human capital approach to estimate the indirect cost of diabetes, which reflects the productivity forgone in labor market and household production resulting from diabetes. Morbidity- and mortality-related productivity losses were estimated separately.
Morbidity-Related Productivity Losses
Morbidity-related costs attributable to diabetes were calculated as the sum of diabetes-attributable costs from absenteeism, presenteeism, household productivity losses, and inability to work, as described below.
Absenteeism Costs.
We calculated statelevel absenteeism costs as the number of missed workdays attributable todiabetes multiplied by the daily state wages and the estimated number of people with diabetes employed in each state. The number of workdays missed due to diabetes was estimated by census region, age-group, and sex using the 2009–2013 National Health Interview Survey (NHIS) (16) and controlling for demographic and socioeconomic factors. Daily mean earnings were estimated as national annual wages from the 2015 Current Population Survey Table Creator (17) and adjusted to state wages by applying a state-to-national 2014 Bureau of Labor Statistics wage ratio (18) and then dividing by 250. We estimated the number of employed people with diabetes in each state by multiplying the estimated percentage of people with diabetes who work by region from the 2009 to 2013 NHIS by corresponding state estimates of the number of people with diabetes using 2013 BRFSS data. We adjusted absenteeism and all other indirect costs to 2017 dollars using the Employment Cost Index.
Presenteeism Costs.
We estimated diabetes-attributable presenteeism costs (on-the-job productivity losses) for employed people in each state as the average number of presenteeism days lost multiplied by estimated daily earnings. Based on previous studies, we assumed an average number of presenteeism days lost due to diabetes at 6.6% of average number of days worked (4,5), with days worked based on 250 days minus estimated absenteeism days.
Household Productivity Losses.
Household productivity losses arise, regardless of employment status, when people are unable to perform household services for nonmarket production, such as housework, cooking and cleanup, house-hold management, and caring for children. Per-person household productivity losses were estimated as the number of diabetes-attributable bed days per year due to illness or injuries, using the same approach as for estimating workdays lost, multiplied by the daily value of household production. Average values of a day of household production were obtained from the Expectancy Data Economic Demographers’ The Dollar Value of a Day: 2013 Dollar Valuation (19). To generate state estimates, we applied Bureau of Labor Statistics state-to-national wage ratios as used for absenteeism costs.
Inability to Work Costs.
People can become unable to work due to diabetes related disability and lose the full value of their expected annual earnings. We used 2011–2013 NHIS (16) data to estimate the number of people unable to work because of diabetes-related disability, multiplying the probability of being unable to work because of diabetes by the number of people with diabetes. We multiplied by state-level annual earnings to estimate the losses associated with inability to work.
Mortality-Related Productivity Losses
We used a human capital approach, which values premature death from a disease as foregone future productivity, to estimate mortality costs (20,21). Mortality costs attributable to diabetes were estimated by multiplying the number of diabetes-attributable deaths by age-group and sex in each state with the present value of lifetime labor earnings and household productivity costs.
An AF approach was used to estimate the number of diabetes-attributable deaths by age-group and sex, combining information on diabetes prevalence, the relative risk of death for people with diabetes compared with those without diabetes, and the total number of deaths in the entire population (22). We estimated relative risk of death using 2005–2009 NHIS with follow-up mortality data through 2011 and the number of deaths using the 2013 CDC Wide-ranging Online Data for Epidemiologic Research (WONDER) (23).
Present value of future labor earnings and household production were calculated from national estimates of annual earnings and the dollar value of household production (19). We discounted future costs by the probability of surviving to each year of age at which the expected production occurs. We used 2010 U.S. life tables from the National Vital Statistics Report to calculate compounded survival rates for each age-group (24). Present values were adjusted to account for expected employment rates and the percentage of people living in households and further assumed a 1% annual growth rate in productivity and a 3% annual discount rate (20).
State aggregate costs are mainly driven by population size. Therefore, as an alternative measure of the economic burden of diabetes in a state, we also calculated costs per adult population in the state. Additionally, we estimated diabetes AFs for medical cost as ratios of estimated state-specific diabetes-attributable medical costs to state personal health care expenditures. We examined the association between this AF and state-level diabetes prevalence using correlation analysis.
RESULTS
The total economic costs ranged from $694 million in Wyoming to $55.5 billion in California, with median cost of $5.9 billion (Table 1). Costs by component were highest in California and were lowest in Wyoming for medical and morbidity costs and in Vermont for mortality costs (Table 1). The estimated total economic cost at the national level as a sum of costs across the states was $465.2 billion, consisting of $214.1 billion (46%) for medical costs, $139.6 billion (30%) for morbidity costs, and $111.5 billion (24%) for mortality costs (Table 1).
Table 1—
State-level diabetes-attributable annual total and per-patient economic costs by cost category, 2017
| Total costs (in millions, 2017 dollars) |
Total costs per patient* (2017 dollars) |
|||||||
|---|---|---|---|---|---|---|---|---|
| Cost category | U.S. | Median | Minimum | Maximum | U.S. | Median | Minimum | Maximum |
| Total direct medical | 214,084 | 2,798 (OK) | 325 (WY) | 22,881 (CA) | 8,471 | 8,544 (LA) | 6,591 (AZ) | 12,953 (DC) |
| Medicaid | 28,651 | 332 (WI) | 39 (WY) | 4,951 (NY) | 4,300 | 4,592 (ID) | 2,561 (CA) | 10,160 (NH) |
| Medicare | 73,758 | 978 (MS) | 73 (AK) | 7,748 (CA) | 6,537 | 6,133 (KS) | 4,684 (ID) | 7,911 (DC) |
| Other | 111,674 | 1,449 (OK) | 202 (WY) | 11,665 (CA) | 4,419 | 4,764 (WV) | 3,475 (AZ) | 7,201 (AK) |
| Total indirect | 251,152 | 3,037 (WI) | 365 (VT) | 32,643 (CA) | 9,931 | 9,672 (PA) | 7,133 (SD) | 17,962 (DC) |
| Total morbidity | 139,628 | 1,629 (OR) | 203 (WY) | 19,927 (CA) | 5,520 | 5,142 (MN) | 4,036 (SD) | 9,031 (DC) |
| Absenteeism | 7,869 | 92 (CO) | 11 (WY) | 1,179 (CA) | 311 | 290 (GA, TX) | 218 (MS) | 469 (DC) |
| Presenteeism | 43,809 | 520 (CO) | 63 (VT) | 6,520 (CA) | 1,732 | 1,675 (UT) | 1,295 (MS) | 2,711 (DC) |
| Inability to work | 81,255 | 926 (OR) | 115 (WY) | 11,318 (CA) | 3,213 | 2,922 (WY) | 2,243 (SD) | 5,363 (DC) |
| Household productivity | 6,695 | 76 (MN) | 10 (VT) | 910 (CA) | 265 | 248 (AL, FL) | 194 (SD) | 487 (DC) |
| Total mortality | 111,524 | 1,351 (AR) | 153 (VT) | 12,716 (CA) | 4,409 | 4,438 (NY) | 3,097 (SD) | 8,931 (DC) |
| Labor productivity | 75,001 | 930 (AR) | 102 (VT) | 8,629 (CA) | 2,965 | 2,951 (NY) | 2,074 (SD) | 6,008 (DC) |
| Household productivity | 36,523 | 463 (WI) | 51 (VT) | 4,088 (CA) | 1,444 | 1,445 (WA) | 1,023 (SD) | 2,923 (DC) |
| Total economic cost | 465,236 | 5,888 (MN) | 694 (WY) | 55,524 (CA) | 18,402 | 18,248 (KY) | 15,418 (SD) | 30,915 (DC) |
Medicare and Medicaid costs are based on person with diabetes covered by each payer, whereas the other payer costs are based on all persons with diabetes. For all other components, the costs are based on all persons with diabetes.
By payer, medical costs for Medicaid ranged from $39 million in Wyoming to $5.0 billion in New York, with median cost of $332 million. For Medicare, medical costs ranged from $73 million in Alaska to $7.7 billion in California, with a median cost of $978 million. For other payers, medical costs ranged from $202 million in Wyoming to $11.7 billion in California, with a median cost of $1.4 billion. On average, 13% of medical costs were borne by Medicaid, 34% by Medicare, and 52% by other payers. These proportions varied widely across states (Supplementary Table 1).
Total economic costs per adult in each state ranged from $1,103 in Utah to $2,522 in West Virginia, with a median of $1,875 (Fig. 1). Medical costs per adult were also lowest in Utah and highest in West Virginia, whereas morbidity costs per adult were lowest in Montana and highest in New York; mortality costs were lowest in Utah and highest in Alabama. Figure 2 illustrates the distribution of total direct medical costs per adult in each state by payer. For Medicaid, costs ranged from $44 per adult in Utah to $321 per adult in New York, with a median cost of $104 per adult. For Medicare, costs ranged from $131 per adult in Alaska to $470 per adult in West Virginia, with a median cost of $280 per adult. For other payers, medical costs ranged from $289 per adult in Utah to $640 per adult in Delaware, with a median cost of $473 per adult.
Figure 1—
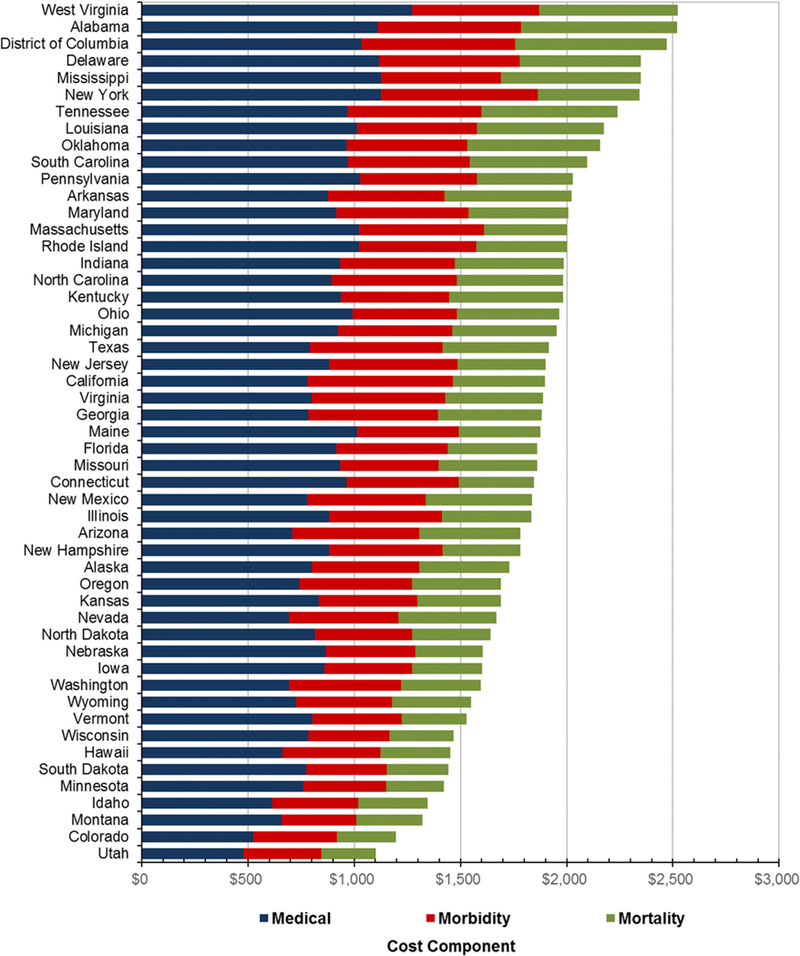
Annual total economic costs (in U.S. dollars) per adult population attributable to diabetes by state and cost component, 2017. Note: the sum of direct medical costs and indirect costs (morbidity and mortality) yields total economic cost.
Figure 2—
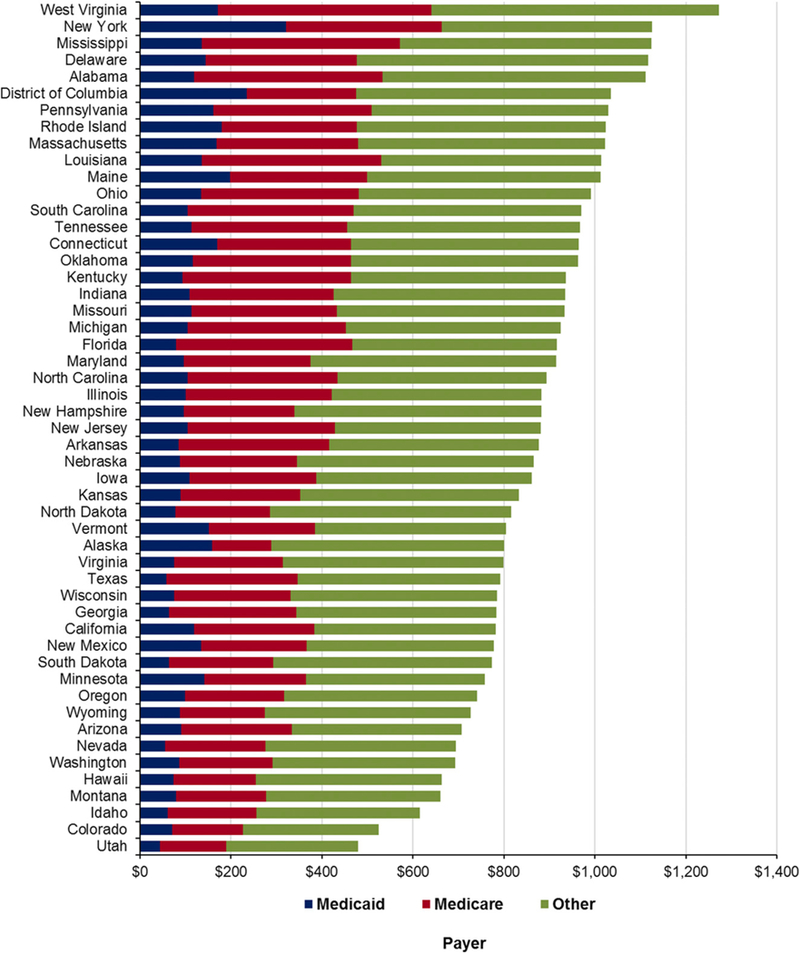
Annual total medical costs (in U.S. dollars) per adult population attributable to diabetes by state and payer, 2017. Note: other is private insurance, other payers, and out of pocket from patients.
Indirect costs due to morbidity and mortality costs were substantially higher than direct medical costs, ranging from $365 million in Vermont to $32.6 billion in California, with a median cost of $3.0 billion (Table 1 and Supplementary Tables 1–3). Median morbidity costs were $1.6 billion, comparable to median mortality costs ($1.4 billion); however, the range for morbidity costs ($203 million to $19.9 billion) was 57% greater than that for mortality costs ($153 million to $12.7 billion). On average, ;58% of the morbidity cost was attributable to being unable to work, ~31% to presenteeism, ~6% to absenteeism, and 5% to household productivity losses (Supplementary Table 2). About two-thirds of mortality costs were attributable to work productivity losses, whereas the rest resulted from household productivity losses (Supplementary Table 3).
State-level maps show geographical patterns of diabetes costs per person with diabetes, with a cluster of states in the northeast and Alaska bearing highest costs (Fig. 3A). The northeast U.S. had a cluster of states with high per-person medical costs, whereas the southwest and a small section of the south had clusters of states with lower per-person medical costs (Fig. 3B). Conversely, the statesinthewestandsouthwesthadsome of the highest per-person morbidity costs (Fig. 3C), and states in the southeast had some of the highest per-person mortality costs (Fig. 3D). DC had the highest per person economic cost ($30,915), and South Dakota had the lowest ($15,418), with the median per-person cost of $18,248 (Table 1). The median direct medical cost was $8,544 per person with diabetes; the per-person cost to Medicare ($6,133) was larger than the cost to Medicaid ($4,592) (Table 1 and Supplementary Table 1). The per-person median indirect cost ($9,672) was larger than the medical cost. Within indirect costs, the per-person morbidity cost ($5,142) was higher than mortality cost ($4,438) (Table 1 and Supplementary Tables 2 and 3). Within the morbidity cost, the per person median cost was highest for inability to work ($2,922) and lowest for household productivity ($248) (Table 1 and Supplementary Table 2). The per-person mortality costs due to lost labor productivity were more than twofold that attributed to householdproductivity losses ($2,951 vs. $1,445) (Table 1 and Supplementary Tables 1 and 3).
Figure 3—
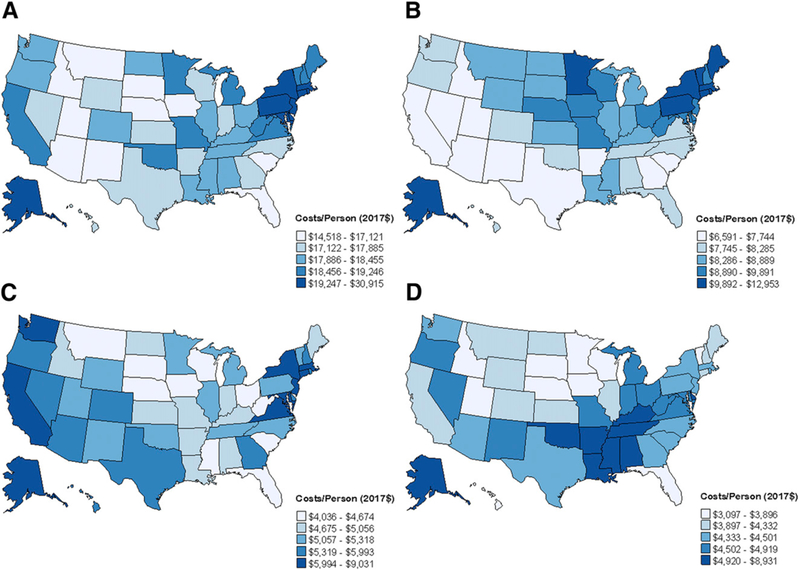
A–D: Quintilesofstate-leveldiabetes-attributableper-personannualtotaleconomiccosts(U.S. dollars) andbycostcomponent, 2017. A: Total diabetes-attributable annual economic costs per person with diabetes. B: Total diabetes-attributable annual medical costs per person with diabetes. C: Total diabetes-attributable annual morbidity costs per person with diabetes. D: Total diabetes-attributable annual mortality costs per person with diabetes.
The diabetes AF for medical cost ranged from 5.8 to 12.4%, with a median of 8.6%. The fraction was highly positively correlated with diabetes prevalence in the state (r = 0.95; P, 0.001) (Supplementary Table 4).
CONCLUSIONS
This study provides the most comprehensive estimates to date of economic costs of diabetes in each of the 50 U.S. states and DC. Improvements from previous studies include: 1) use of mainly state-level data, 2) providing detailed estimates for each component of direct and indirect costs in total and per person with diabetes, and 3) providing direct medical costs by payment source (Medicare, Medicaid, and others). Estimates by age and sex are available at https://nccd.cdc.gov/Toolkit/DiabetesBurden/Home/Economic. Policymakers, especially those at the state, regional, and local levels, may find this information useful in developing evidence-based public health policies to curb the increases of the health and economic burden of diabetes.
State-level economic costs of diabetes are not only large, but also vary greatly across states. When estimated per adult population in the state, almost one-third of states had diabetes-attributable annual medical costs in excess of $1,000 (range $480–1,270) and annual total economic costs exceeding $2,000 per adult (range $1,100–2,520). Costs per person with diabetes also varied substantially across states, both in total and by component. Thus, assuming perperson cost of diabetes derived from national data to estimate the cost for a state may substantially over- or underestimate true cost.
The total economic cost per-person with diabetes in the highest-cost state was twofold of that in the lowest. This variation was explained by variations in both per-person direct medical costs (2-fold) and indirect costs (2.5-fold). Twofold differences in per-person direct medical costs were largely driven by wide variation in per-person Medicaid costs (fourfold). The 2.5-fold differences in per-person indirect costs were due to a twofold difference in morbidity costs and a nearly threefold difference in mortality costs. Differences in the number and the age and sex composition of deaths led to variation in mortality costs across states, whereas the cost of inability to work and presenteeism were the key drivers of variation in per-person morbidity costs. The fraction of the population with diabetes who worked, along with age- and sex-specific state wages, were the major factors driving state variation in these morbidity costs.
Per-person medical costs of diabetes also varied by payer. Although median per-person cost borne by Medicare was larger than that borne by Medicaid and other payers, the difference in costs between the highest versus the lowest cost states was 4-fold for Medicaid compared with 1.7-fold for Medicare and 2.1-fold for other payers. The larger variation in state Medicaid cost may be due to differences in Medicaid enrollment and coverage, as each state has its own Medicaid policies. The Medicaid cost estimates provide valuable information for decision making for Medicaid health care resource planning and program evaluation.
Our estimated aggregate medical cost, as a sum of state-level costs, is comparable to the American Diabetes Association’s (ADA’s) 2017 estimates ($214 vs.$237 billion in 2017 dollars) (3). However, our aggregated total economic costs are much larger than ADA estimates ($472 vs. $327 billion in 2017 dollars). Several factors may have caused our indirect costs to be larger than ADA estimates. First, although both studies used Current Population Survey earnings data to value the productivity losses associated with absenteeism, presenteeism, inability to work, and premature mortality, the earnings used in our study were larger, as ADA estimates capped earnings at $150,000, and we did not. Second, although ADA used Social Security Income disability program participation to estimate the number of people with diabetes who were unable to work, we used disability status of each person as self-reported in NHIS, resulting in a larger number of people with diabetes who were unable to work in our study. Third, for estimating morbidity costs, we included people who were self-employed as part of the employed population for estimating morbidity costs and, to estimate mortality costs, included household productivity losses, in addition to labor productivity losses used in ADA estimates (5).
Our study had several limitations. First, for some components, such as morbidity-related productivity losses, reliable state-level data were not available; we therefore used regional estimates. Hence, estimates for these components may not have captured full state-specific variation. Second, we did not include nonmedical direct costs, such as patient transportation and caregiver costs, because state-level data on patients’ use of these resources were not available. Furthermore, our study did not include the indirect cost associated with pain and suffering by patients and their families. Hence, our results may underestimate actual costs. Third, our population with diabetes estimates were based on people with diagnosed diabetes; because approximately one-fourth of people with diabetes are undiagnosed (1), our cost estimates likely understate the true burden of diabetes to states. Finally, because of inadequate information to reliably distinguish diabetes by its type, we were not able to estimate separate costs for type 1 and type 2 diabetes.
Our detailed estimates of state-specific economic costs attributable to diabetes have significant public health implications, as they provide critical information needed by policymakers to develop, prioritize, and assess policies and interventions to target areas with highest economic burden. The wide variation in state-level per-person total economic costs and component-specific costs suggests that estimates using an oversimplified approach, such as extrapolating national average estimates to derive state-level cost estimates, are likely biased and may lead to improperly informed policy decisions and assessments of the benefit of diabetes interventions. Additionally, variability notwithstanding, state-level economic burden of diabetes was substantial across the states and reinforces the need for continued efforts toward delaying or preventing type 2 diabetes (25) and improving ongoing care among patients with diabetes.
Various studies in the U.S. and elsewhere have demonstrated that type 2 diabetes prevention programs with intensive lifestyle modification or metformin targeting weight loss could reduce the risk of type 2 diabetes by >50% and can be cost-effective or even cost-saving (26–33).
Conclusion
Economic costs attributable to diabetes, overall and by component, were substantial and varied extensively across U.S. states. By allocating and targeting resources toward type 2 diabetes prevention and diabetes management, states could reduce this burden. Our estimates provide policymakers and payers an improved understanding of the various aspects of the state-specific economic burden of diabetes and information needed for better planning and evaluating diabetes interventions at the state level.
Supplementary Material
Acknowledgments.
The authors acknowledge consultant Christy Avery (University of North Carolina at Chapel Hill), Alyssa R. Leib (Community College of Denver, Denver, CO) for statistical analysis support, and the following members of the Expert Advisory Panel who provided advice on the technical approach, development, and data sources used for the analysis: Barbara Bartman (Agency for Healthcare Quality and Research, Rockville, MD), Jonathan Brown (International Diabetes Federation, Portland, OR), William Herman (University of Michigan Health System, Ann Arbor, MI), Matt Petersen (American Diabetes Association, Arlington, VA), and Kristi Pier (Maryland Department of Mental Health and Hygiene, Baltimore, MD).
Funding. This work was based on the online toolkit developed by RTI International under Centers for Disease Control and Prevention contract number 200-2013-M-53964B.
The contents are solely the responsibility of the authors and do not necessarily represent the official views of the Centers for Disease Control and Prevention, the Department of Health and Human Services, or the U.S. government.
Footnotes
The findings and conclusions in this report are those of the authors and do not necessarily represent the official position of the Centers for Disease Control and Prevention.
Duality of Interest. No potential conflicts of interest relevant to this article were reported.
References
- 1.Centers for Disease Control and Prevention. National Center for Chronic Disease Prevention and Health Promotion: at a glance 2016. Diabetes: working to reverse the US epidemic. [Internet]. Available from https://www.cdc.gov/chronicdisease/resources/publications/aag/pdf/2016/diabetes-aag.pdf. Accessed 1 October 2018.
- 2.Dieleman JL, Baral R, Birger M, et al. US spending on personal health care and public health, 1996–2013. JAMA 2016;316:2627–2646 [DOI] [PMC free article] [PubMed] [Google Scholar]
- 3.American Diabetes Association. Economic costs of diabetes in the U.S. in 2017. Diabetes Care 2018;41:917–928 [DOI] [PMC free article] [PubMed] [Google Scholar]
- 4.American Diabetes Association. Economic costs of diabetes in the U.S. in 2012. Diabetes Care 2013;36:1033–1046 [DOI] [PMC free article] [PubMed] [Google Scholar]
- 5.American Diabetes Association. Economic costs of diabetes in the U.S. in 2007. Diabetes Care 2008;31:596–615 [DOI] [PubMed] [Google Scholar]
- 6.Hogan P, Dall T, Nikolov P; American Diabetes Association. Economic costs of diabetes in the U.S. in 2002. Diabetes Care 2003;26:917–932 [DOI] [PubMed] [Google Scholar]
- 7.Trogdon JG, Murphy LB, Khavjou OA, et al. Costs of chronic diseases at the state level: the chronic disease cost calculator. Prev Chronic Dis 2015;12:E140. [DOI] [PMC free article] [PubMed] [Google Scholar]
- 8.Cuckler G, Martin A, Whittle L, et al. Health spending by state of residence, 1991–2009. Medicare Medicaid Res Rev 2011;1:E1–E31 [DOI] [PMC free article] [PubMed] [Google Scholar]
- 9.Martin AB, Whittle L, Heffler S, Barron MC, Sisko A, Washington B. Health spending by state of residence, 1991–2004. Health Aff (Millwood) 2007;26:w651–w663 [DOI] [PubMed] [Google Scholar]
- 10.Mukamel DB, Li Y, Harrington C, Spector WD, Weimer DL, Bailey L. Does state regulation of quality impose costs on nursing homes? Med Care 2011;49:529–534 [DOI] [PubMed] [Google Scholar]
- 11.Li R, Zhang P, Barker L, Hartsfield D. Impact of state mandatory insurance coverage on the use of diabetes preventive care. BMC Health Serv Res 2010;10:133. [DOI] [PMC free article] [PubMed] [Google Scholar]
- 12.Centers for Disease Control and Prevention. Diabetes State Burden Toolkit: Technical Report. [Internet], December 2016. Available from http://nccd.cdc.gov/Toolkit/DiabetesBurden/images/docs/technical_documentation.pdf. Accessed 1 October 2018.
- 13.Diehr P, Yanez D, Ash A, Hornbrook M, Lin DY. Methods for analyzing health care utilization and costs. Annu Rev Public Health 1999;20:125–144 [DOI] [PubMed] [Google Scholar]
- 14.Centers for Medicaid and Medicare Services. State health expenditure accounts, 1980–2014. [Internet]. Available from https://www.cms.gov/Research-Statistics-Data-and-Systems/Statistics-Trends-and-Reports/NationalHealthExpendData/NationalHealthAccountsStateHealthAccountsResidence.html. Accessed 1 October 2018.
- 15.Centers for Medicaid and Medicare Services. MDS 3.0 Quality Measures User’s Manual (v10.0 03-25-2016) [Internet]. Available from https://www.cms.gov/Medicare/Quality-Initiatives-PatientAssessment-Instruments/NursingHomeQualityInits/Downloads/MDS-30-QM-Users-Manual-V10.pdf. Accessed 1 October 2018.
- 16.Centers for Disease Control and Prevention (CDC). National Health Interview Survey (NHIS) Data, Questionnaires and Related Documentation. [Internet]. Available from www.cdc.gov/nchs/nhis/data-questionnaires-documentation.htm. Accessed 1 October 2018.
- 17.Current Population Survey (CPS). Table creator [Internet]. Suitland, MD, U.S. Census Bureau. Available from http://www.census.gov/cps/data/cpstablecreator.html. Accessed 1 October 2018 [Google Scholar]
- 18.Occupational Employment Statistics (OES) [Internet]. Washington, DC, Bureau of Labor Statistics. Available from http://www.bls.gov/oes/tables.htm. Accessed 1 October 2018 [Google Scholar]
- 19.Expectancy Data. The Dollar Value of a Day: 2013 Dollar Valuation Shawnee Mission, Kansas, Expectancy Data, 2014 [Google Scholar]
- 20.Haddix AC, Teutsch SM, Corso PS. Prevention Effectiveness: A Guide to Decision Analysis and Economic Evaluation New York, Oxford University Press, 2003 [Google Scholar]
- 21.Rice DP, Hodgson TA, Kopstein AN. The economic costs of illness: a replication and update. Health Care Financ Rev 1985;7:61–80 [PMC free article] [PubMed] [Google Scholar]
- 22.Miettinen OS. Theoretical Epidemiology: Principles of Occurrence Research in Medicine New York, Wiley, 1985 [Google Scholar]
- 23.Centers for Disease Control and Prevention (CDC). WONDER. [Internet]. Available from https://wonder.cdc.gov/. Accessed 1 October 2018.
- 24.Arias E United States life tables, 2010. Natl Vital Stat Rep 2014;63:1–63 [PubMed] [Google Scholar]
- 25.Zhuo X, Zhang P, Hoerger TJ. Lifetime direct medical costs of treating type 2 diabetes and diabetic complications. Am J Prev Med 2013;45:253–261 [DOI] [PubMed] [Google Scholar]
- 26.Breeze PR, Thomas C, Squires H, et al. The impact of type 2 diabetes prevention programmes based on risk-identification and lifestyle intervention intensity strategies: a cost-effectiveness analysis. Diabet Med 2017;34:632–640 [DOI] [PubMed] [Google Scholar]
- 27.Diabetes Prevention Program Research Group. The 10-year cost-effectiveness of lifestyle intervention or metformin for diabetes prevention: an intent-to-treat analysis of the DPP/DPPOS. Diabetes Care 2012;35:723–730 [DOI] [PMC free article] [PubMed] [Google Scholar]
- 28.Knowler WC, Fowler SE, Hamman RF, et al. ; Diabetes Prevention Program Research Group. 10-year follow-up of diabetes incidence and weight loss in the Diabetes Prevention Program Outcomes Study. Lancet 2009;374:1677–1686 [DOI] [PMC free article] [PubMed] [Google Scholar]
- 29.Herman WH. The cost-effectiveness of diabetes prevention: results from the Diabetes Prevention Program and the Diabetes Prevention Program Outcomes Study. Clin Diabetes Endocrinol 2015;1:9. [DOI] [PMC free article] [PubMed] [Google Scholar]
- 30.Herman WH, Edelstein SL, Ratner RE, et al. ; Diabetes Prevention Program Research Group. Effectiveness and cost-effectiveness of diabetes prevention among adherent participants. Am J Manag Care 2013;19:194–202 [PMC free article] [PubMed] [Google Scholar]
- 31.Neumann A, Lindholm L, Norberg M, Schoffer O, Klug SJ, Norstro¨m F. The cost-effectiveness of interventions targeting lifestyle change for the prevention of diabetes in a Swedish primary care and community based prevention program. Eur J Health Econ 2017;18:905–919 [DOI] [PMC free article] [PubMed] [Google Scholar]
- 32.Png ME, Yoong JS. Evaluating the cost-effectiveness of lifestyle modification versus metformin therapy for the prevention of diabetes in Singapore. PLoS One 2014;9:e107225. [DOI] [PMC free article] [PubMed] [Google Scholar]
- 33.Ramachandran A, Snehalatha C, Yamuna A, Mary S, Ping Z. Cost-effectiveness of the interventions in the primary prevention of diabetes among Asian Indians: within-trial results of the Indian Diabetes Prevention Programme (IDPP). Diabetes Care 2007;30:2548–2552 [DOI] [PubMed] [Google Scholar]
Associated Data
This section collects any data citations, data availability statements, or supplementary materials included in this article.