Abstract
Background
Despite studies using localized high density contact mapping and lower resolution panoramic approaches, the mechanisms that sustain human persistent atrial fibrillation (AF) remain unresolved. Voltage mapping is commonly employed as a surrogate of atrial substrate to guide ablation procedures.
Objective
To study the distribution and temporal stability of activation during persistent AF using a global non‐contact charge density approach and compare the findings with bipolar contact mapping.
Methods
Patients undergoing either redo or de novo ablation for persistent AF underwent charge density and voltage mapping to guide the ablation procedure. Offline analysis was performed to measure the temporal stability of three specific charge density activation (CDA) patterns, and the degree of spatial overlap between CDA patterns and low voltage regions.
Results
CDA was observed in patient‐specific locations that partially overlapped, comprising local rotational activity (18% of LA), local irregular activity (41% of LA), and focal activity (39% of LA). Local irregular activity had the highest temporal stability. LA voltage was similar in regions with and without CDA.
Conclusion
In persistent AF, CDA patterns appear unrelated to low voltage areas but occur in varying locations with high temporal stability.
Keywords: atrial fibrillation, non‐contact mapping
We performed non‐contact charge density activation and bipolar contact mapping in patients with persistent atrial fibrillation (AF). Temporally stable activation patterns were found that had little relationship to voltage. This has mechanistic implications for persistent AF and may help inform future research and treatment strategies.

1. INTRODUCTION
Persistent forms of atrial fibrillation (AF) represent more advanced atrial disease than paroxysmal AF. 1 However, the mechanisms for persistence are still debated and may involve multiple wavelets, endo‐epicardial dissociation, or drivers. 2 , 3 , 4 , 5 Clinical studies using dominant frequency analysis of roving contact catheter data to locate driver regions have had mixed success. 6 , 7 Subsequently, endocardial basket contact mapping catheters were used to demonstrate rotors and showed promising responses to treatment, 8 but the results of more recent meta‐analyses have been equivocal. 9 , 10 Atrial substrate changes detectable during clinical electrophysiology studies include low voltage areas (LVA) or fractionated signals. 1 Although LVA is advocated as a target for ablation, 11 , 12 more recent studies have described marked variation in the extent of LVA observed depending on cycle length and direction of wave front activation, and also in sinus rhythm versus AF. 13 , 14 Complex, fractionated signals themselves could represent either active drivers or wavefront collision or fusion and the initial success of targeting complex atrial electrograms reported by Nademanee 15 was not replicated in the randomized Substrate and Trigger Ablation for Reduction of Atrial Fibrillation (STAR‐AF) II trial. 16
Combined charge density and ultrasound mapping (AcQMap, Acutus Medical) is possible with a novel system employing a spherical catheter with six splines, each of which has eight ultrasound transducers and electrodes. Rapid ultrasound cardiac chamber geometry combined with the ability to collect up to 150 000 non‐contact charge density samples per second allows acquisition of full chamber, high resolution electrical activity. 17 Several stereotyped charge density activation (CDA) patterns were described during mapping of AF with this system, namely focal activity (FA), local rotational activity (LRA), and local irregular activity (LIA). LRA shows a regionally organized pattern of conduction that rotates in one direction around a confined zone (clockwise or counter‐clockwise) and subtends a path of ≥270°, FA indicates radial wavefronts propagating from a single location, while LIA is a disorganized pattern of conduction with repetitive, multidirectional, isthmus‐like conduction through a confined zone that may enter, exit, and pivot within and around the zone (Figure 1). Initial clinical results using this technology to guide ablation have been reported in a single arm study with 73% freedom from AF at 12 months after a single ablation procedure for persistent AF. 18 More recently, non‐contact data from the AcQMap system have been validated against standard contact electrograms demonstrating a high degree of correlation for morphology and timing. 19
FIGURE 1.
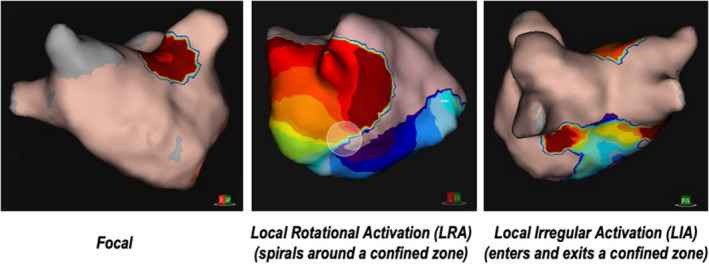
Example charge density activation patterns
The purpose of this study was to describe the spatial distribution and temporal stability of CDA identified using this novel mapping system in a cohort of patients with persistent AF, and to determine if there was any relationship between LVA (using conventional bipolar voltage mapping techniques) and CDA.
2. METHODS
Following granting of European CE mark and US FDA approval, we obtained local institutional approval to use the novel AcQMap system to treat AF, and all patients in the study gave informed written consent. Between September 2018 and November 2019, sixteen consecutive patients underwent an electrophysiology study and ablation for persistent AF using both AcQMap (Acutus Medical) and Ensite Precision (Abbott Medical) systems.
2.1. Electrophysiology study and ablation
All procedures were performed under general anesthetic with transoesophageal echocardiography. Patients were routinely anticoagulated with direct oral anticoagulants (DOAC). Femoral venous access was used for double trans‐septal puncture, followed by heparinization to ACT >350 s. The baseline charge density map (pre‐PVI) was acquired for 30 s during AF with AcQMap, followed by a high density (>3000 points) contact map of the left atrium (LA) during AF using a multipolar catheter, either Advisor FL SE or Advisor HD Grid SE (Abbott Medical). A threshold of 0.2 mV (in AF) was used to define LVA as this has been shown to correlate with the conventional definition of 0.5 mV in sinus rhythm and with the presence of a scar on MRI. 14 , 20 Pulmonary vein isolation (PVI) was then performed either by de novo wide area circumferential ablation (n = 6), or for redo procedures (n = 10) at regions of vein reconnection with contact force guidance (TactiCath SE; Abbott Medical). Power settings were by operator preference either 30 W anteriorly/25 W posteriorly, guided by Lesion Index (LSI; Abbott Medical), or 45 W up to 15 s “high power, short duration”. Following PVI a further 30 s map (post‐PVI) of AF was acquired using AcQMap. AcQTrack software (Acutus Medical) was used to identify CDA (LIA, LRA, FA) targets and thresholds of 5, 7 and 1 for LRA, LIA, and FA, respectively, gave clinically usable maps with similar numbers of CDA in the majority of our patients. These were ablated at operator discretion. Two patients were ablated directly to sinus rhythm, while the remainder completed the procedure with external cardioversion. Clinical follow‐up was undertaken using a combination of patient symptoms, 12 lead EKG, and continuous EKG recordings.
2.2. Image registration
Comparing left atrial (LA) maps across multiple patients is challenging due to variation in LA size and geometry. In order to accurately compare maps from the two systems and across patients, in‐house methods were developed within Matlab (Version 2020a; www.mathworks.com) and Cloud Compare software (Version 2.6.1; www.cloudcompare.org) to merge maps. Fiducial markers were used to tag structures common to both geometries, typically the LA appendage and the carina between pulmonary veins, in order to generate a transformation matrix which is then used to align, resize, and rotate maps. Next, a “nearest neighbor” matching algorithm was used to apply bipolar voltage values from the Ensite Precision map onto the AcQMap geometry. This allows direct comparison of CDA and voltage for each vertex in the map.
For the composite images, an average LA geometry was generated. Again, fiducial points were marked and used to transform each patient's geometry to the common LA geometry, before the nearest‐neighbor matching applied the thresholded CDA and voltage values to the common geometry. The number of occurrences of above‐threshold CDA, and the mean of the voltage at each vertex, were used to create LA heatmaps.
2.3. Image comparison and statistical methods
The detection of LVA and CDA in the LA is threshold dependent. A commonly used metric for medical image comparison, Sørenson Dice coefficient, is sensitive to changes in the thresholds used, so we compared maps using a novel area under the curve (AUC) metric. Our AUC metric calculates the AUC of a sensitivity/(1‐specificity) plot using a continually‐varying threshold for each of the two maps being compared. This is analogous to the area under a receiver‐operating characteristic (ROC) curve except that both the ‘test’ and ‘reference’ maps are from the same dataset and are both are subject to varying thresholds. This differs from the binary outcome of a gold‐standard reference test used when comparing diagnostic test accuracy—the typical application of ROC. Therefore, in this application, AUC values of <0.5 are possible for inversely matched maps (where CDAs have less intersection between maps than would be expected by chance), whereas a perfect match scores 1.0. This method has the substantial advantage that, by analyzing every possible CDA threshold, it removes the requirement for a threshold to be chosen.
Due to constraints of clinical workflow, of 16 patients treated, 11 had the full set of data comprising bipolar voltage map, pre‐PVI CDA map, and post‐PVI CDA map. The primary analysis of temporal stability was performed on these 11 patients, but we also used all available datasets across all 16 patients for a secondary analysis (provided as a supplement). To assess single map temporal stability, a 30 s CDA acquisition was divided into three consecutive 10 s sections. Within each 10 s section, the locations of each CDA were annotated to create binary maps of the LA with FA/LRA/LIA present or absent. Each 10 s section (1, 2, 3) was compared against the other sections within the same 30 s window using AUC i.e. 1 vs. 2, 2 vs. 3, and 1 vs. 3. To compare longer term (intraprocedural) temporal stability, we compared the 30 s pre‐PVI recordings with 30 s recordings post‐PVI. Figure 2 gives an overview of all comparisons performed.
FIGURE 2.
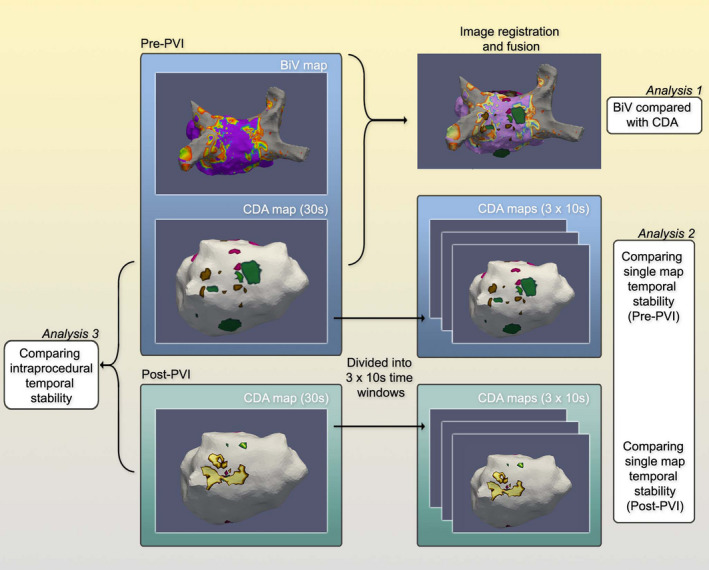
Summary of workflow undertaken to compare bipolar voltage and charge density, and to assess short‐ and long‐term temporal stability of charge density activation
Baseline demographic data are presented as mean ± SD or median (range) as appropriate. All pairwise comparisons were performed with Wilcoxon signed‐rank test (R, The R Project for Statistical Computing).
3. RESULTS
Patient characteristics are shown in Table 1.
TABLE 1.
Patient characteristics. Continuous variables are described using mean ± SD unless otherwise stated
| Age (years) | 63 ± 11 |
| AF history (years) | 4.2 ± 3.0 |
| Gender (M:F) | 15:1 |
| Body mass index (kg/m2) | 29 ± 4 |
| CHA2DS2‐VaSC score–median (range) | 1 (0–4) |
| LV ejection fraction (%) | 52 ± 5 |
| LA dimension (mm) | 46 ± 5 |
| Previous AF ablation procedures–median (range) | |
| Antiarrhythmic drugs at time of procedure | |
| Betablockers | 14/16 |
| Digoxin | 3/16 |
| Amiodarone | 1/16 |
| Patients with previous AF ablation procedure | 10/16, median 1 (0–3) procedures |
3.1. Spatial distribution and co‐localization of CDA and relationship to voltage
The spatial distribution of LRA, LIA, and FA regions for all patients during the baseline 30 s AF recording is shown on a common geometry—Figure 3. There was some preferential location in anterior/septal wall, but CDA could be observed throughout the LA. The LIA and FA patterns were more frequently observed than LRA. At the clinically used thresholds, 55% of the atrial endocardial surface was involved in activation across one or more LRA, LIA, or FA. The Venn diagrams for complete cases and for all available data (Figure 4 and Figure S1 respectively) show the overlap for CDA types—LRA was rarely observed in isolation and mainly occurred in association with LIA or FA, while LIA and FA occurred more often in isolation. Across all patients studied, the median LA voltage was 0.39 mV (IQR 0.16–0.83). Comparing LA voltage in areas where CDA were present or absent, nominally significant differences were observed, with lower voltage in areas with LIA. However, there was a large range of data and no clinically meaningful differences were identified (Figure 5, Figure S2).
FIGURE 3.
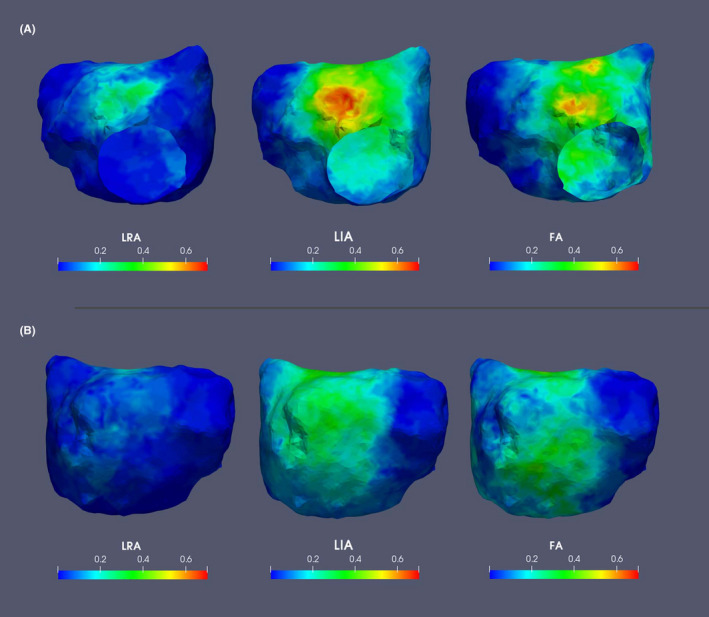
Composite images demonstrating spatial distribution and frequency (normalized to scale 0–1) of CDA, for all patients displayed on a common geometry; (A) AP and (B) PA views. CDA, charge density activation; FA, focal activity; LIA, local irregular activity; LRA, local rotational activity
FIGURE 4.
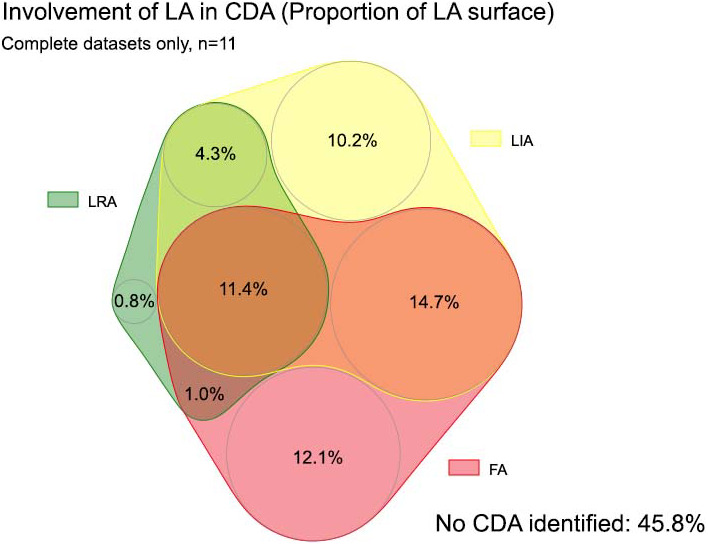
Venn diagram demonstrating the involvement of left atrium (percentage of LA area) and degree of spatial overlap between charge density activity, complete datasets only. CDA, charge density activation pattern comprising LRA (local rotational activity); LIA, local irregular activity and FA, focal activity
FIGURE 5.
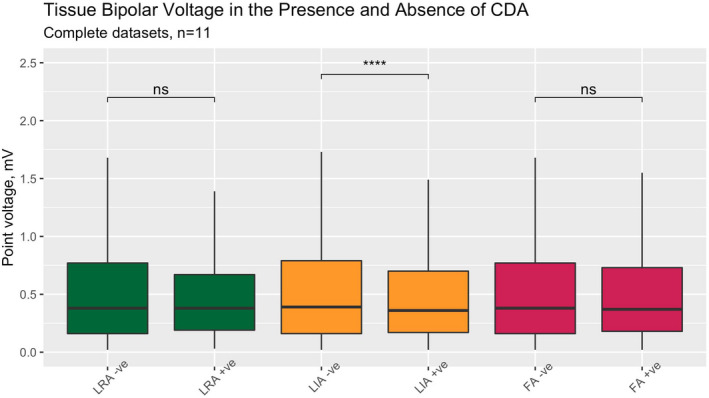
Bipolar tissue voltage, in areas with and without CDA present, complete datasets only. Pairwise comparisons with Wilcoxon signed‐rank (****, p < .0001. ns, not significant). CDA, charge density activation pattern comprising LRA (local rotational activity); FA, focal activity; LIA, local irregular activity
3.2. Temporal stability of observed CDA
Within the 30 s pre‐PVI recordings of AF, when 10 s segments were compared in individual patients to examine short‐term CDA stability, we observed a high degree of CDA overlap, indicating stable patterns of CDA (Figure 6, Figure S3). At both timepoints, LIA was the most spatially stable form of CDA.
FIGURE 6.
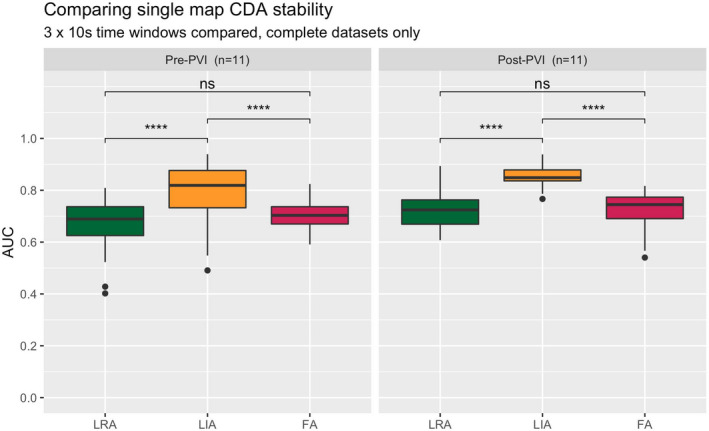
Short‐term temporal stability expressed as AUC (comparing 10 s sections within the same 30 s window), complete datasets only. Pairwise comparisons with Wilcoxon signed‐rank (****, p < .0001. ns, not significant). CDA, charge density activation pattern comprising LRA (local rotational activity); FA, focal activity; LIA, local irregular activity; PVI, pulmonary vein isolation; UAC, area under the curve metric
Comparing the pre‐ and post‐PVI maps (with a mean ± SD intervening time period of 100 ± 50 min) to assess longer term CDA stability, the observation of stable CDA patterns was again seen over this much longer time period (Figure 7, Figure S4).
FIGURE 7.
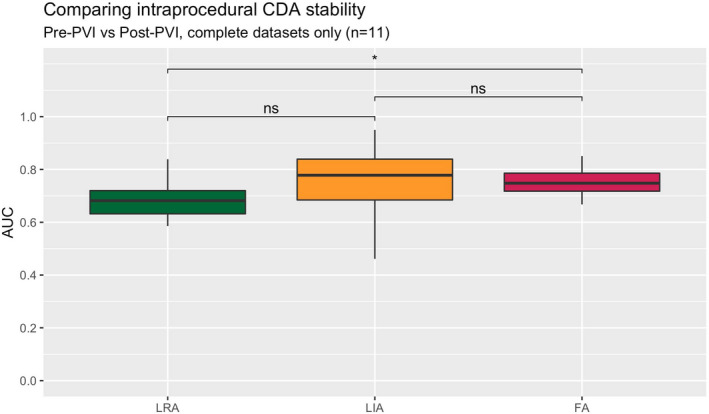
Long‐term temporal stability expressed as AUC (comparing 30 s maps from the pre‐PVI and post‐PVI recordings), complete datasets only. Pairwise comparisons with Wilcoxon signed‐rank (ns = not significant, *p < .05). AUC, area under the curve metric; CDA, charge density activation pattern comprising LRA (local rotational activity); FA, focal activity; LIA, local irregular activity; PVI, pulmonary vein isolation
4. DISCUSSION
In this study using a novel mapping system in persistent AF patients, the main findings were:
Temporally stable, regions of activation during persistent AF the location of which varied between patients.
Localized irregular activity was frequently observed and showed high temporal stability, while rotational activity was less frequent.
CDA did not correlate well with low voltage regions mapped during AF.
The observation of directional organization or “linking” during AF has been recognized previously, suggested to represent underlying anatomic structures or refractoriness from previous wavefronts. 21 , 22 Our data using high resolution global non‐contact mapping confirms that repetitive patterns of activity can be observed over timescales of <1 min, and greater than 1 h, which may be more consistent with a “driver” mechanism than “multiple wavelets”. This extends previous observations during epicardial perioperative maps acquired over the course of 10 min of AF. 23 Our long‐term stability assessment was performed by comparing pre‐PVI and post‐PVI data. We accept interim ablation may affect the AF substrate, although one might expect this to reduce temporal stability. Mapping with unipolar signals mitigates against some of the downsides of bipolar electrograms, including sensitivity to wavefront direction and loss of fine detail of complex activation patterns or “bipolar blindness”.
With regard to specific CDA events, our data indicate that rotational activity, particularly occurring in isolation, was infrequent. This is consistent with previous reports using biatrial epicardial contact mapping studies 24 , 25 and also by mapping the epicardium non‐invasively using CardioInsight (Medtronic). 26 Studies that report more consistent findings of rotors, tend to depend on phase analysis methods. 8 , 27 The appearance of rotational activity can be a passive phenomenon based on phase analysis of electrograms at lines of conduction block. 28 We observed frequent and consistent endocardial FA which could represent either focal or micro re‐entrant drivers or epicardial to endocardial breakthrough. In a previous high density epicardial mapping study predominantly focal activations were observed with collision and merging of wavefronts. 25
Atrial bipolar voltage is commonly used clinically as a surrogate for atrial substrate, despite potential limitations including wavefront direction and regional variation in LA wall thickness. Although voltage values were nominally statistically different in areas of CDA versus non‐CDA, this was likely due to the sheer number of points compared. More importantly, the significant overlap made it impossible to identify any clinically useful voltage threshold to identify CDA locations. This has also been recently reported by Chierchia et al. 29 —LVA identified during paced and sinus rhythm (but not during AF) did not overlap with CDA locations. Yet the consistent observation of temporally stable activity in patient‐specific locations, LIA in particular, strongly suggests this reflects an underlying fixed atrial substrate. Our observations regarding the frequent occurrence of LIA confirm those of others using this approach. 18 , 30 , 31 Using optical mapping ex vivo, fibrotic regions have been shown to harbor microscopic intramural re‐entrant circuits that can act as AF drivers. 32 However, current human in vivo electrophysiological and imaging methods are limited to either the endocardial or epicardial surface and lack the resolution to resolve this microscopic level of detail. Prior endocardial non‐contact mapping studies using the Ensite array failed to show stable dominant frequency sites, or stable focal or rotor sites. 33 , 34 However, this earlier generation system was of lower spatial resolution and does not utilize accurate patient‐specific ultrasound chamber geometry. Using the current system, LIA locations detected during AF co‐localize to areas of slow conduction during non‐AF paced rhythm, providing further evidence that these represent localized areas of abnormal substrate. 31
Acute AF termination during ablation was a relatively infrequent occurrence in this study, but freedom from AF observed after ablation in this and other studies using this mapping system suggests that areas of CDA identified for ablation were involved in maintenance of AF. 18 , 35 The findings in this study of temporally stable CDA locations during AF that vary from patient to patient would not support an approach of either empiric linear ablation or voltage based ablation for persistent AF. The AcQMap system allows a bespoke approach and provides the ability to rapidly map, ablate and remap. The clinical effectiveness of non‐contact charge density guided mapping for treatment of AF is being evaluated in ongoing larger trials (e.g. RECOVER, NCT03368781 and DISCOVER, NCT0389333).
5. LIMITATIONS
The population studied had mostly longstanding persistent AF, and observations here may not apply to all forms of AF. Mapping in this study was confined to the endocardial LA, and we did not perform right atrial mapping.
6. CONCLUSIONS
This study of persistent AF has demonstrated temporally stable activation patterns over both short and relatively long periods of time, that appear unrelated to bipolar voltage. These may represent novel targets for AF ablation but this requires further investigation with larger clinical trials.
CONFLICT OF INTEREST
NFK has received an honorarium for participating in an Acutus Medical sponsored symposium. All other authors have no conflicts to declare.
Supporting information
Fig S1
Fig S2
Fig S3
Fig S4
ACKNOWLEDGMENTS
The authors are grateful to Dr Derrick Chou and Dr Graydon Beatty (Acutus Medical) for helpful discussions during the preparation of this manuscript.
Lee JMS, Nelson TA, Clayton RH, Kelland NF. Characterization of persistent atrial fibrillation with non‐contact charge density mapping and relationship to voltage. J Arrhythmia. 2022;38:77–85. doi: 10.1002/joa3.12661
Funding information
This research did not receive any specific grant from funding agencies in the public, commercial, or not‐for‐profit sectors.
REFERENCES
- 1. Teh AW, Kistler PM, Lee G, Medi C, Heck PM, Spence SJ, et al. Electroanatomic remodeling of the left atrium in paroxysmal and persistent atrial fibrillation patients without structural heart disease. J Cardiovasc Electrophysiol. 2012;23:232–8. 10.1111/j.1540-8167.2011.02178.x [DOI] [PubMed] [Google Scholar]
- 2. Moe GK, Rheinboldt WC, Abildskov JA. A computer model of atrial fibrillation. Am Heart J. 1964;67:200–20. 10.1016/0002-8703(64)90371-0 [DOI] [PubMed] [Google Scholar]
- 3. Konings KT, Kirchhof CJ, Smeets JR, Wellens HJ, Penn OC, Allessie MA. High‐density mapping of electrically induced atrial fibrillation in humans. Circulation. 1994;89:1665–80. 10.1161/01.cir.89.4.1665 [DOI] [PubMed] [Google Scholar]
- 4. Skanes AC, Mandapati R, Berenfeld O, Davidenko JM, Jalife J. Spatiotemporal periodicity during atrial fibrillation in the isolated sheep heart. Circulation. 1998;98(12):1236–1248. 10.1161/01.CIR.98.12.1236 [DOI] [PubMed] [Google Scholar]
- 5. de Groot NMS, Houben RPM, Smeets JL, Boersma E, Schotten U, Schalij MJ, et al. Electropathological substrate of longstanding persistent atrial fibrillation in patients with structural heart disease: epicardial breakthrough. Circulation. 2010;122:1674–82. 10.1161/CIRCULATIONAHA.109.910901 [DOI] [PubMed] [Google Scholar]
- 6. Sanders P, Berenfeld O, Hocini M, Jaïs P, Vaidyanathan R, Hsu L‐F, et al. Spectral analysis identifies sites of high‐frequency activity maintaining atrial fibrillation in humans. Circulation. 2005;112:789–97. 10.1161/CIRCULATIONAHA.104.517011 [DOI] [PubMed] [Google Scholar]
- 7. Verma A, Lakkireddy D, Wulffhart Z, Pillarisetti J, Farina D, Beardsall M, et al. Relationship between complex fractionated electrograms (CFE) and dominant frequency (DF) sites and prospective assessment of adding DF‐guided ablation to pulmonary vein isolation in persistent atrial fibrillation (AF). J Cardiovasc Electrophysiol. 2011;22:1309–16. 10.1111/j.1540-8167.2011.02128.x [DOI] [PubMed] [Google Scholar]
- 8. Narayan SM, Krummen DE, Shivkumar K, Clopton P, Rappel W‐J, Miller JM. Treatment of atrial fibrillation by the ablation of localized sources: CONFIRM (Conventional Ablation for Atrial Fibrillation With or Without Focal Impulse and Rotor Modulation) trial. J Am Coll Cardiol. 2012;60:628–36. 10.1016/j.jacc.2012.05.022 [DOI] [PMC free article] [PubMed] [Google Scholar]
- 9. Mohanty S, Mohanty P, Trivedi C, Gianni C, Della Rocca DG, Di Biase L, et al. Long‐term outcome of pulmonary vein isolation with and without focal impulse and rotor modulation mapping: insights from a meta‐analysis. Circ Arrhythm Electrophysiol. 2018;11:e005789. 10.1161/CIRCEP.117.005789 [DOI] [PubMed] [Google Scholar]
- 10. Baykaner T, Rogers AJ, Meckler GL, Zaman J, Navara R, Rodrigo M, et al. Clinical implications of ablation of drivers for atrial fibrillation: a systematic review and meta‐analysis. Circ Arrhythm Electrophysiol. 2018;11:e006119. 10.1161/CIRCEP.117.006119 [DOI] [PMC free article] [PubMed] [Google Scholar]
- 11. Rolf S, Kircher S, Arya A, Eitel C, Sommer P, Richter S, et al. Tailored atrial substrate modification based on low‐voltage areas in catheter ablation of atrial fibrillation. Circ Arrhythm Electrophysiol. 2014;7:825–33. 10.1161/CIRCEP.113.001251 [DOI] [PubMed] [Google Scholar]
- 12. Kottkamp H, Berg J, Bender R, Rieger A, Schreiber D. Box isolation of fibrotic areas (BIFA): a patient‐tailored substrate modification approach for ablation of atrial fibrillation. J Cardiovasc Electrophysiol. 2016;27:22–30. 10.1111/jce.12870 [DOI] [PubMed] [Google Scholar]
- 13. Wong GR, Nalliah CJ, Lee G, Voskoboinik A, Prabhu S, Parameswaran R, et al. Dynamic atrial substrate during high‐density mapping of paroxysmal and persistent AF: implications for substrate ablation. JACC Clin Electrophysiol. 2019;5:1265–77. 10.1016/j.jacep.2019.06.002 [DOI] [PubMed] [Google Scholar]
- 14. Qureshi NA, Kim SJ, Cantwell CD, Afonso VX, Bai W, Ali RL, et al. Voltage during atrial fibrillation is superior to voltage during sinus rhythm in localizing areas of delayed enhancement on magnetic resonance imaging: an assessment of the posterior left atrium in patients with persistent atrial fibrillation. Heart Rhythm. 2019;16:1357–67. 10.1016/j.hrthm.2019.05.032 [DOI] [PMC free article] [PubMed] [Google Scholar]
- 15. Nademanee K, McKenzie J, Kosar E, Schwab M, Sunsaneewitayakul B, Vasavakul T, et al. A new approach for catheter ablation of atrial fibrillation: mapping of the electrophysiologic substrate. J Am Coll Cardiol. 2004;43:2044–53. 10.1016/j.jacc.2003.12.054 [DOI] [PubMed] [Google Scholar]
- 16. Verma A, Jiang C‐Y, Betts TR, Chen J, Deisenhofer I, Mantovan R, et al. Approaches to catheter ablation for persistent atrial fibrillation. N Engl J Med. 2015;372:1812–22. 10.1056/NEJMoa1408288 [DOI] [PubMed] [Google Scholar]
- 17. Grace A, Willems S, Meyer C, Verma A, Heck P, Zhu M, et al. High‐resolution noncontact charge‐density mapping of endocardial activation. JCI Insight. 2019;4. 10.1172/jci.insight.126422 [DOI] [PMC free article] [PubMed] [Google Scholar]
- 18. Willems S, Verma A, Betts TR, Murray S, Neuzil P, Ince H, et al. Targeting nonpulmonary vein sources in persistent atrial fibrillation identified by noncontact charge density mapping: UNCOVER AF Trial. Circ Arrhythm Electrophysiol. 2019;12:e007233. 10.1161/CIRCEP.119.007233 [DOI] [PubMed] [Google Scholar]
- 19. Shi R, Parikh P, Chen Z, Angel N, Norman M, Hussain W, et al. Validation of dipole density mapping during atrial fibrillation and sinus rhythm in human left atrium. JACC: Clin Electrophysiol. 2020;6:171–81. 10.1016/j.jacep.2019.09.012 [DOI] [PubMed] [Google Scholar]
- 20. Kawaji T, Hojo S, Kushiyama A, Nakatsuma K, Kaneda K, Kato M, et al. Optimal cutoff value of bipolar low‐voltage in electroanatomic voltage mapping during atrial fibrillation rhythm. Pacing Clin Electrophysiol. 2019;42:663–9. 10.1111/pace.13661 [DOI] [PubMed] [Google Scholar]
- 21. Gerstenfeld EP, Sahakian AV, Swiryn S. Evidence for transient linking of atrial excitation during atrial fibrillation in humans. Circulation. 1992;86:375–82. 10.1161/01.cir.86.2.375 [DOI] [PubMed] [Google Scholar]
- 22. Botteron GW, Smith JM. Quantitative assessment of the spatial organization of atrial fibrillation in the intact human heart. Circulation. 1996;93:513–8. 10.1161/01.CIR.93.3.513 [DOI] [PubMed] [Google Scholar]
- 23. Walters TE, Lee G, Morris G, Spence S, Larobina M, Atkinson V, et al. Temporal stability of rotors and atrial activation patterns in persistent human atrial fibrillation. JACC: Clin Electrophysiol. 2015;1:14–24. 10.1016/j.jacep.2015.02.012 [DOI] [PubMed] [Google Scholar]
- 24. Lee G, Kumar S, Teh A, Madry A, Spence S, Larobina M, et al. Epicardial wave mapping in human long‐lasting persistent atrial fibrillation: transient rotational circuits, complex wavefronts, and disorganized activity. Eur Heart J. 2014;35:86–97. 10.1093/eurheartj/eht267 [DOI] [PubMed] [Google Scholar]
- 25. Lee S, Sahadevan J, Khrestian CM, Cakulev I, Markowitz A, Waldo AL. Simultaneous biatrial high‐density (510–512 electrodes) epicardial mapping of persistent and long‐standing persistent atrial fibrillation in patients. Circulation. 2015;132(22):2108–17. 10.1161/CIRCULATIONAHA.115.017007 [DOI] [PMC free article] [PubMed] [Google Scholar]
- 26. Cuculich PS, Wang Y, Lindsay BD, Faddis MN, Schuessler RB, Damiano RJ, et al. Noninvasive characterization of epicardial activation in humans with diverse atrial fibrillation patterns. Circulation. 2010;122:1364–72. 10.1161/CIRCULATIONAHA.110.945709 [DOI] [PMC free article] [PubMed] [Google Scholar]
- 27. Haissaguerre M, Hocini M, Denis A, Shah AJ, Komatsu Y, Yamashita S, et al. Driver domains in persistent atrial fibrillation. Circulation. 2014;130(7):530–538. 10.1161/CIRCULATIONAHA.113.005421 [DOI] [PubMed] [Google Scholar]
- 28. Podziemski P, Zeemering S, Kuklik P, van Hunnik A, Maesen B, Maessen J, et al. Rotors detected by phase analysis of filtered, epicardial atrial fibrillation electrograms colocalize with regions of conduction block. Circ Arrhythm Electrophysiol. 2018;11:e005858. 10.1161/CIRCEP.117.005858 [DOI] [PMC free article] [PubMed] [Google Scholar]
- 29. Chierchia G‐B, Sieira J, Vanderper A, Osorio TG, Bala G, Stroker E, et al. Substrate mapping of the left atrium in persistent atrial fibrillation: spatial correlation of localized complex conduction patterns in global charge‐density maps to low‐voltage areas in 3D contact bipolar voltage maps. J Interv Card Electrophysiol. 2021; 10.1007/s10840-020-00926-4 [DOI] [PMC free article] [PubMed] [Google Scholar]
- 30. Shi R, Chen Z, Butcher C, Zaman JAB, Boyalla V, Wang YK, et al. Diverse activation patterns during persistent atrial fibrillation by noncontact charge‐density mapping of human atrium. Journal of Arrhythmia. 2020;36(4):692–702. 10.1002/joa3.12361 [DOI] [PMC free article] [PubMed] [Google Scholar]
- 31. Pope MTB, Kuklik P, Briosa e Gala A, Leo M, Mahmoudi M, Paisey J, et al. Spatial and temporal variability of rotational, focal, and irregular activity: practical implications for mapping of atrial fibrillation. J Cardiovasc Electrophysiol. 2021;32(9):2393–2403. 10.1111/jce.15170 [DOI] [PMC free article] [PubMed] [Google Scholar]
- 32. Hansen BJ, Zhao J, Csepe TA, Moore BT, Li N, Jayne LA, et al. Atrial fibrillation driven by micro‐anatomic intramural re‐entry revealed by simultaneous sub‐epicardial and sub‐endocardial optical mapping in explanted human hearts. Eur Heart J. 2015;36:2390–401. 10.1093/eurheartj/ehv233 [DOI] [PMC free article] [PubMed] [Google Scholar]
- 33. Jarman JWE, Wong T, Kojodjojo P, Spohr H, Davies JE, Roughton M, et al. Spatiotemporal behavior of high dominant frequency during paroxysmal and persistent atrial fibrillation in the human left atrium. Circul: Arrhyth Electrophysiol. 2012;5:650–8. 10.1161/CIRCEP.111.967992 [DOI] [PubMed] [Google Scholar]
- 34. Lee G, McLellan AJA, Hunter RJ, Lovell MJ, Finlay M, Ullah W, et al. Panoramic characterization of endocardial left atrial activation during human persistent AF: insights from non‐contact mapping. Int J Cardiol. 2017;228:406–411. 10.1016/j.ijcard.2016.11.085 [DOI] [PubMed] [Google Scholar]
- 35. Shi R, Chen Z, Pope MTB, Zaman JAB, Debney M, Marinelli A, et al. Individualized ablation strategy to treat persistent atrial fibrillation: core‐to‐boundary approach guided by charge‐density mapping. Heart Rhythm. 2021;18:862–70. 10.1016/j.hrthm.2021.02.014 [DOI] [PubMed] [Google Scholar]
Associated Data
This section collects any data citations, data availability statements, or supplementary materials included in this article.
Supplementary Materials
Fig S1
Fig S2
Fig S3
Fig S4


