Abstract
Rapid and sensitive detection of numerous regulatory pathways in growth and development processes and defensive responses in plant–pathogen interactions caused by miRNA has been the current interest of agricultural scientists. Herein, an uncomplicated ultrasensitive electrochemical biosensor was fabricated to detect miR393a, as its detection is of vital importance for plant diseases. A streptavidin-coated screen-printed carbon electrode (SPCE) was fabricated and characterized by scanning electrochemical microscopy, scanning electron microscopy, surface plasmon resonance, and cyclic voltammetry. The two-dimensional (2D) structure and chemical functionality of the streptavidin-coated SPCE render it a superior platform for loading a modified probe via a 1-ethyl-3-(3-dimethylaminopropyl)carbodiimide–N-hydroxysuccinimide linker. This biorecognition platform is capable of efficiently using its excellent conductivity, greater surface area, and effective electrochemical execution due to its synergistic effect between streptavidin and carbon electrodes. The biosensor showed a good linear response (R2 = 0.96) to miR393a concentrations ranging from 100 nM to 100 fM. This streptavidin-based biosensor is highly sensitive to the minimum concentration of miR393a, lowest detection limit, and ultrasensitivity under optimized conditions, i.e., 100 fM, 0.33 fM, and 33.72 μA fM–1 cm–2, respectively. In addition, remarkable recoveries could be obtained to confirm the feasibility of this assay in plant disease samples. The fabricated technology could offer a selective, adaptable, and farmer-friendly strategy for the timely detection of miRNA of plant samples.
1. Introduction
MicroRNAs (miRNAs) are a new class of endogenous, small, regulatory, noncoding RNA molecules of approximately 20–24 nucleotides in length, which play a crucial role in gene expression. miRNAs are engaged in post-transcriptional gene regulation, mainly through the cleavage and translation inhibition of the target mRNAs. In both plants and animals, miRNAs contribute to various biological processes, including the maintenance of intrinsic growth, development, metabolism, and adaptive responses to environmental stresses. miRNAs can serve as biomarkers, and this has been well studied in animal systems. A couple of potent miRNA biological markers have been, of late, established in plants, and these are emerging as the next-generation targets for genetic engineering for crop improvement. Environmental stimulation or unhealthy conditions may lead to the upregulation and downregulation of explicit miRNAs. It is believed that the type or amount of protein transcript required during stress reactions in plants is generally dependent on whether or not the phenomena of upregulation and downregulation of miRNAs occur during stress.
In an RNA-induced silencing complex, miRNAs bind to a target messenger RNA (mRNA) and hinder the expression of a gene through perfect or nearly perfect complementarity between the miRNA and the mRNA. This results in gene silencing named RNA interference in faunas and post-transcriptional gene silencing (PTGS) in the flora population. Mostly, target mRNAs in plants bear one single miRNA corresponding site, and the majority of complementary miRNAs are typically appropriately complementary to these sites and thus split the target mRNAs.1
The miR393a is unequivocally upregulated by NaCl, ultraviolet radiation, cold, drought, and by treating with the stress regulator abscisic acid. Transport inhibitor response 1 (TIR1), the main target for miR393a, is a positive regulator of the auxin signaling pathway. The overexpression of miR393a corresponds to a decrease in auxin signaling and seedling development. Hence, a particular stress reaction that activates miR393a expression will inhibit plant growth during stress.2 In addition to abiotic stress, miR393a has a role in plant antibacterial pattern-triggered immunity. In the case of powdery mildew disease in wheat, differential expression patterns have been observed for various miRNAs, among which miR393a and others are upregulated.3 Thus, miR393a is a potential biomarker under stress responses. Most recent techniques are confined to the hybridization between a complementary modified probe and a target miRNA to generate double-stranded helical biomolecules. This hybridization can be detected using several analytical methods, such as electrochemical4,5 and optical measurements.6−8 Optical methods usually include bioluminescence spectroscopy,9,10 fluorescence spectroscopy,9,11,12 surface plasmon resonance imaging dimension,13 and Raman scattering spectroscopy,14 among others. Furthermore, conventional methods for miRNA detection, including quantitative reverse transcription-polymerase chain reaction (qRT-PCR), northern blotting,15,16 and DNA microarray techniques only partially meet the requirements for its detection. However, these techniques are labor-intensive, costly, and time-consuming, which limits their application as timely biosensors.17,18 Moreover, these techniques require costly commercial kits and the use of an equipped research laboratory with well-trained and specialized biologists.
Apart from miRNAs, the majority of phytohormones and associated signal processes emerged as a principal player in miRNA-targeted stress regulation mechanisms in plants. Plant hormones chiefly associated with plant growth, development, and nutrient uptake are also involved in plant tolerance to certain biotic and abiotic stresses. Mostly, all phytohormones, including auxin, gibberellin, abscisic acid (ABA), cytokinins, salicylic acid, ethylene, and jasmonic acid, play a significant role in plant response to the majority of environmental stresses by altering the plant morphology. Plant hormones like ABA and jasmonic acid are among those that intervene in particular types of stress responses, and their activity results additionally in the negative regulation of plant growth. ABA is involved in numerous aspects of water-restricting stresses, such as salinity, drought, and cold stress, while jasmonic acid work is predominantly ascribed to injury and pathogen reactions.19,20
Curiously, some miRNAs are generally receptive to all known stresses. Aggregating proof, in any case, obviously shows that the differential expression of certain miRNAs is reliant upon the particular stress condition, even in a similar plant group. miR169 was thought to be inhibited by drought stress in Arabidopsis but at the same time induced by salinity treatment.21 Similarly, another miR398 stimulated by ultraviolet-B radiation in Arabidopsis thaliana plants, however, was suppressed by cold, oxidative, and salinity stress conditions.22 A comparative wonder was additionally seen in other plant species, including rice and soybean.23 Different investigations have shown that miR398 was inhibited by both ABA and salinity treatment, while it was regulated by drought treatment in Arabidopsis. Investigation of copper superoxide dismutase (CSD) 1 and 2, the two focuses of miR398, revealed that both of these genes were regulated by salinity treatment.24 This strongly recommends that miRNAs might help plant resistance to certain abiotic stresses in a stress-dependent fashion.25
Electrochemical methods are especially of interest for the detection of miRNA because they are simple, inexpensive, sensitive, and effortless for miniaturization.26−28 Recently, some attractive electrochemical biosensors based on miRNA have been described. Recently, Flor de Fátima Rosas-Cárdenas et al. demonstrated a tissue printing hybridization method for the simple and effective detection of sRNAs. This method was developed by the examination and determination of the spatiotemporal expression patterns of miRNAs, such as miR159 and miR164, in the fruits of several crop plants.29 Cao et al. developed a calcium-ion-aided fluorescence optical biosensor a year ago for the rapid and direct detection of microRNA-167 in extracted samples of microRNA obtained from A. thaliana seedlings using the FRET-based (fluorescence resonance energy transfer) method. This method used polydopamine (PDA)-coated Fe3O4 nanoparticles as an acceptor molecule along with carbon dots as the donor part and probe DNA species. The biosensor system developed exhibits a wider linear range of 0.5–100 nM and a detection limit of 76 pM with recovery rates in the range of 96.4–98.3%. Here, the sensitive detection of microRNA-167 was mainly achieved through the benefit from the two magnetic properties of Fe3O4. We detected the microRNA-167 molecule by avoiding the signal amplification steps, which could make this procedure rapid and very simple.30 Keyvan Asefpour Vakiliana recently proposed a study incorporating an optical biosensor purely based on gold nanoparticles to specifically and selectively determine miRNA-1886, especially in the roots of tomato plants. The tomato roots were found to be affected by drought stress as well as by other stresses like temperature and salinity during their growing phase. The results showed that irrigation ranges from 100 to 60% of field capacity increased the concentration of miRNA-1886 in the range from ca. 100 to 6800 fM, resulting in a linear exchange in the biosensor reaction (R2 = 0.97). The results also showed that in contrast with plant conventional morphophysiological and biochemical characteristics, miRNA-1886 concentration was now not significantly affected (P < 0.01). The developed biosensor is a promising analytical and reliable method to examine stress-dependent features of miRNAs in tomato plants along with their application during specific stress determination in several tomato varieties.31 Li et al. employed photoelectrochemical biosensors based on CuO-CuWO4 used as a photoactive material to detect the effect of plant hormones on miRNA-319a expression in rice leaves. We used rolling circle amplification and enzymatic signal techniques for the detection strategy. The detection protocol revealed very high sensitivity, showing a low detection limit of 0.13 fM. Among other conventional techniques, the photoelectrochemical method has attracted extensive attention due to the advantages of low cost and background signal, fast detection capability, uncomplicated instrumentation with very high sensitivity, and better performance compared with traditional methodologies.32 Shaoyan Wu et al. developed a sophisticated electrochemical biosensor for the determination of miRNAs on the basis of base stacking hybridization technology and enzyme amplification. Electrochemical biosensor strategies for miRNA detection are promising owing to their outstanding advantages, such as low cost, miniature size, ease of construction and use, and higher sensitivity with good selectivity. The developed electrochemical biosensor could detect miRNAs as low as 0.4 pM, showing a linear range from 1 pM to 100 nM with fair reproducibility. This developed sensing strategy might be superior to other types of miRNA detection and could be a reliable device for field research and clinical applications.33 Wang et al. earlier proposed the detection of small endogenous non-coding RNAs utilizing the label-less and ultrasensitive properties of the electrochemical biosensor assay by employing protein cage nanoparticles for enhanced sensitivity. The apoferritin-Cu nanoparticle complex used here was further allowed to immobilize on the surface of the electrode through a unique response between the amino and carboxyl groups. The generation of electrochemical oxidation signal between the probe DNA and the target miRNA-159a was established after Cu was released into the detection buffer by adjusting the pH. This developed assay has the potential to even discriminate a single-base mismatch between the complementary targets and is at the same time selective and sensitive with a lower limit of detection of 3.5 fM.34 Zhou et al. proposed an electrochemical method for the detection of microRNAs upon utilizing the nonspecific nature of nuclease S1 attempting the endo- and exocatalytic cleavage of single-stranded fragments of nucleic acids. They were able to achieve the electrochemical signal in the absence of hybridization since the DNA probe immobilized on the electrode surface could be digested by the enzyme, which in turn resulted in a weak signal following hybridization with the target microRNA-319a. The limit of detection obtained here was 1.8 pM with a signal-to-noise ratio of 3. The present method showed high reproducibility and excellent detection sensitivity for expressing the target mRNA in rice seedlings.35 Zhou et al. demonstrated another label-free, sensitive electrochemical enzyme-based biosensor for the expression of microRNA-159a in Arabidopsis thaliana seedlings by studying the effect of phytohormones based on signal amplification of mimic enzyme catalysis. The limit of detection was found to be in the range of 0.5 pM to 1.0 nM with a detection limit of 0.17 pM (signal to noise ratio of 3). The constructed biosensor showed noticeably reproducible detection selectivity even for mismatched-base microRNA bases. We also found that a form of phytohormone, viz., abscisic acid, has an impact on microRNA-159a expression in Arabidopsis seedlings. With increasing abscisic acid concentration and prolonging incubation time, the expression level of microRNA-159a increased. This strategy offers a novel route to locate microRNA with high sensitivity and selectivity while avoiding hard label, disadvantages of bioenzymes, and complicated operations for microRNA differentiation and enhancement.36 Gao et al. formulated an ultrasensitive one-step novel labeling assay for revealing the extraordinary electrocatalytic activity of Ru(PD)2Cl2 with regard to the oxidation of hydrazine, rendering it feasible for the conduction of miRNA detection in the total RNA mixture by employing chemical and biochemical ligation reactions for direct miRNA labeling. The present assay permits the detection of miRNAs in the wide range of 0.50–400 pM, showing a detection limit of 0.20 pM.37 However, there is limited research regarding the specific electrochemical determination of miR393a. Here, there is an enforcing need to fabricate a simple, sensitive, cost-effective, and portable method to quantify miR393a levels, which will likely rely on novel methods for miRNA detection and quantification. The newly developed miRNA biosensor strategies will facilitate the early detection of stress induction.
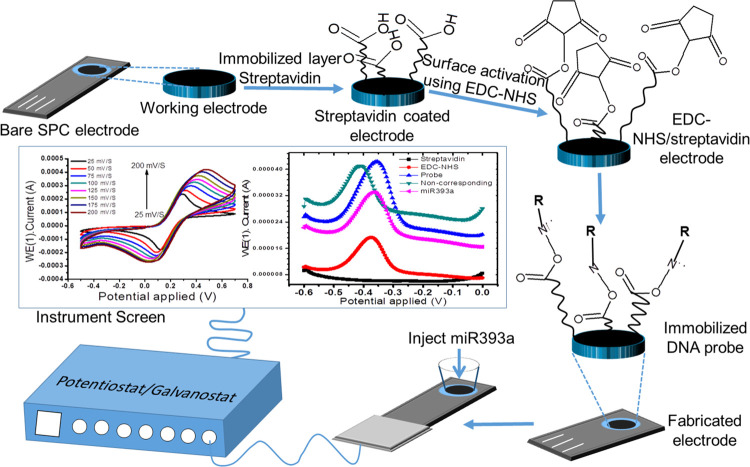
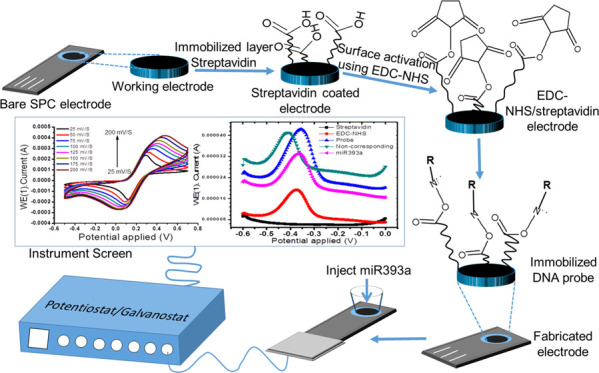
As yet, to the best of our knowledge, the use of streptavidin for miRNA detection has not been demonstrated. In this manuscript, we present a facile, substrate-free, label-free, and sensitive streptavidin-based electrochemical biosensor for the detection of miRNA, as shown in the schematic diagram in Scheme 1. The miRNA detection is based on the oxidation of a ferrocyanide solution, resulting in the hybridization of a complementary capture probe with the target miRNA. The oxidation of ferrocyanide prior and after hybridization produces a change in response recorded by differential pulse voltammetry (DPV). Streptavidin has superior advantages for the oxidation of ferrocyanide. The use of streptavidin might improve the sensitivity of ferrocyanide determination, thereby enhancing the analytical performance of the miRNA electrochemical biosensor. In addition, the fabricated biosensors include no labels, external substrates, or implicated biochemical reactions and so preparing the sample is cost-effective. As a new case, the biosensor used miR393a, which has a vital role in cell proliferation.
Scheme 1. Schematic Description of the Fabrication of the Probe/EDC-NHS/Streptavidin-Based Electrode Used in the Potentiostat/Galvanostat Instrument.
Here, we describe how plant miR393a can be used to build an efficient, modified, and selective capture probe for the detection of plant target miR393a. This is a useful first step in the development of a reasonable, sensitive, and high-throughput assay for creating relatively stress-free and rapid laboratory detection techniques for miR393a.
2. Results and Discussion
2.1. Surface Plasmon Resonance Characterization
2.1.1. Sensor Surface Chemistry and Analysis of Immobilized Probe over the Modified Gold Surface
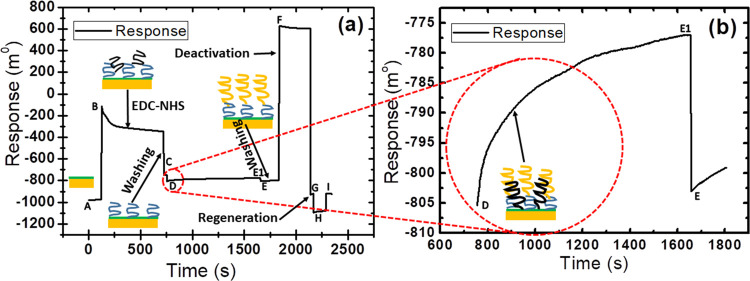
The absolute immobilization procedure from surface activation to blocking steps was probed in real-time using the wavelength interrogation setup, as shown in Figure 1. Here, in the first step, a ligand is immobilized onto the activated gold surface. The in situ immobilization measurement with a gold sensor chip is continuously monitored using an SPR detector, as shown in Figure 1. The technique allows a better comparison of the immobilized sample on all prepared gold surfaces. Figure 1a shows that initially buffer is allowed to flow continuously in the sensor cell for a reference baseline at the A point. After that, the EDC-NHS biolinker is injected using SPR needles over the activated surface at the B point. The coupling reaction of NHS-EDC hydrochloride in distilled water formed an active NHS ester. The activated carboxyl groups of the self-assembled monolayer support the formation of the amino-modified probe.7,28 Further, the unbound linker is removed from the modified surface by washing at the C point. Now, the probe is passed over the activated surface via the flow cell using ultrapure water of low ionic strength. Thereby, the probe is adsorbed over the activated exposed surface by electrostatic attraction forces at points D to E1. Figure 1b shows an enlarged image of the association phase of a probe with reactive esters at points D to E1. Ethanolamine is injected over the sensor surface for deactivation purpose at points F to G. The remaining esters are converted into amides upon the reaction with 1 M ethanolamine shown at the F point. Further, the sites washed with the buffer solution are shown at the G point. In the final step, the probe-immobilized surface is now ready to use the interaction step with the corresponding miR393a after conditioning with the regeneration buffer solution to be used at points H to I. The amount of immobilized probe is shown at the D point (Figure 1a).
Figure 1.
(a) Spectral sensorgram showing the immobilization steps of EDC-NHS, amine-modified probe, and deactivation by ethanolamine. (b) Sensorgram showing the immobilization step of an amine-modified probe in an enlarged form.
2.1.2. Sensorgram of the Interaction of the Corresponding miRNA393a with the Probe Immobilized over the Sensor Surface
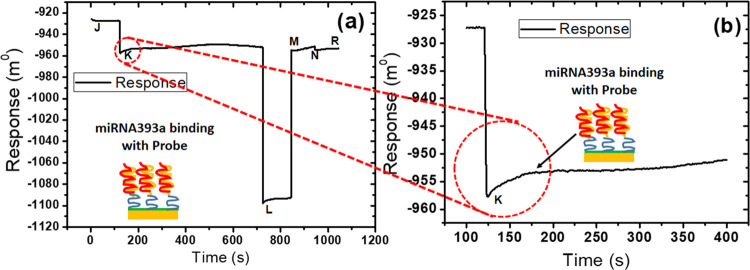
The sensorgram for the interaction of the corresponding miRNA393a over the probe-immobilized sensor surface, as shown in Figure 2, involves the baseline (J), association (K), dissociation (L), and regeneration (M). The response was enhanced in proportion to the corresponding miR393a due to the change in the refractive index near the sensor surface. The functionalized sensor surface has been developed by immobilizing an amine-modified probe, as shown in Figure 1. In the first instance of the mobile, a continuous flow of buffer solution was passed over the sensor surface at the J point, resulting in a resonance signal of −924 m0. During the period from I to K, miR393a was injected by switching one of the sample loops into the sensor surface cuvette. The instantaneous enhancement in the signal of resonance as the miR393a sample enters the sensor cuvette is due to the high concentration (100 μM). At point K, the sample was added, and once again, the buffer was passed over the surface. Therefore, a resonance signal level of −957 m0 could be noticed under the same properties as in the I point. The response signal is shifted due to the binding of the miR393a to the probe surface, i.e., −953 m0. During the period from K to L, the sample, corresponding to the attached probe, is introduced, as shown in the enlarged form in Figure 2b. The response signal is successively elongated (−950 m0). At point L, the buffer is again washed to remove the unbound sample; the dissociation curve of the sample–probe complex is shown in Figure 2. The sample is removed by introducing a regenerating agent at point M, and the response signal decreases to its initial level. Finally, the probe surface is again ready for other sample analyses at N or R.
Figure 2.
(a) SPR surface response after the interaction of miRNA393a binding with the probe. (b) Enlarged form of the interaction of miRNA393a binding with probe.
2.1.3. FESEM Characterization of the Bare SPCE and Streptavidin-Modified SPCE
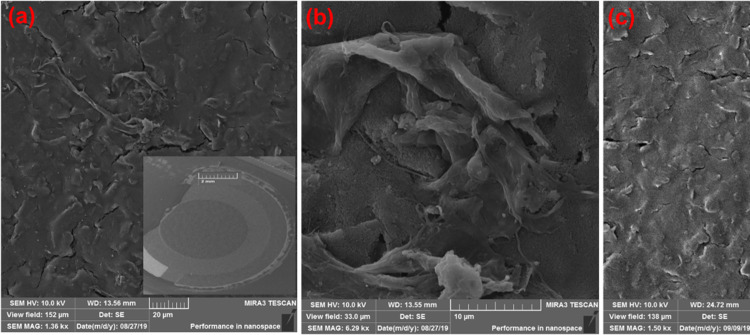
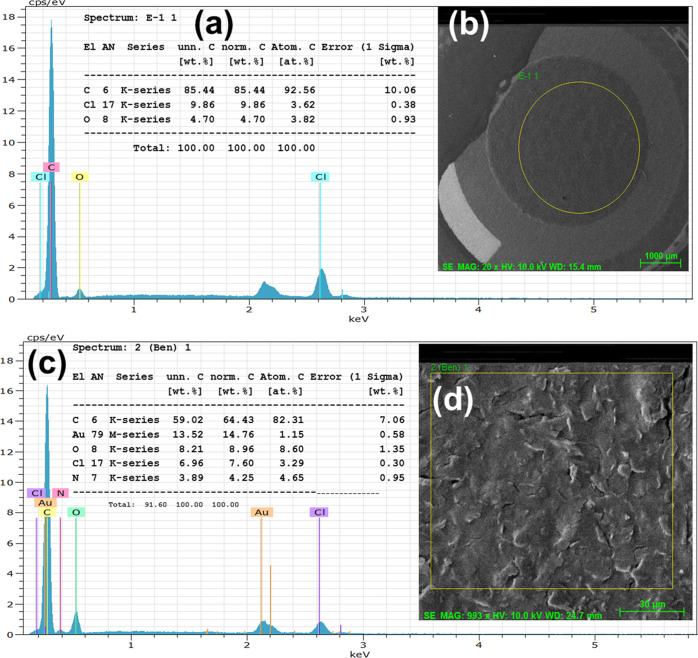
The morphological structures of bare and streptavidin-coated electrodes before and after streptavidin incorporation have been validated by FESEM studies, as shown in Figure 3a–c. Figure 3a,b shows the FESEM images of the working carbon electrode at different scales, and the inset image of 3a shows the full view of the bare electrode at a 2 mm scale. Furthermore, Figure 3c shows the FESEM image of streptavidin protein on the working carbon electrode using the simple drop-casting technique at room temperature and deposition time. The streptavidin protein deposition amount is generally increased with increasing deposition time. Streptavidin protein is more closely packed with some carbon surface of the electrode on increasing the deposition time to 13 min at room temperature, as shown in Figure 3c. However, the streptavidin protein structure remains the same throughout the deposition procedure, and there is no change in its size and shape after the deposition process. The deposition of streptavidin protein was further confirmed by EDX, as shown in Figure 4. In the EDX study, the bare carbon working electrode (Figure 4b) exhibits characteristic peaks along with elemental carbon (C), chloride (Cl), and oxygen (O) peaks can be evidently noticed, as shown in Figure 4a. The C peak was gradually increased and Cl and O peaks were of low values in accordance with the FESEM data in Figure 4b. Similarly, the streptavidin-coated working electrode (Figure 4d) exhibits characteristic peaks along with elemental carbon (C), gold (Au), chloride (Cl), oxygen (O), and nitrogen (N) peaks, as shown in Figure 4c. The C and Cl peaks gradually decreased on increasing the streptavidin protein over the exposed electrode, as shown in Figure 4c, in accordance with the FESEM data in Figure 4d. Then, N and O peaks were gradually increased due to streptavidin immobilization over the working electrode.
Figure 3.
(a) FESEM images of the working carbon electrode (20 μm scale); inset: image of the bare electrode at 2 mm scale and at 10 μm scale (b). (c) Morphology of the streptavidin-coated SPC electrode after deposition (20 μm scale).
Figure 4.
EDX spectra of the electrode and high-magnification FESEM images. (a) EDX spectrum of the bare electrode with the scanning area of the FESEM shown in the inset (b). (c) EDX spectrum of the streptavidin-coated electrode with the scanning area of FESEM shown in inset (d).
2.1.4. Electrochemical Characterization of the Bare SPCE and the Streptavidin-Modified SPCE
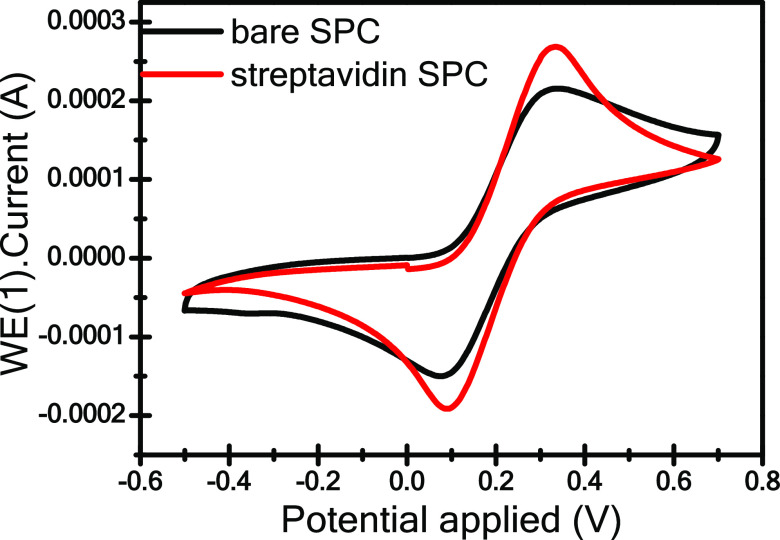
The electrochemical merits of the SPC electrode were determined by carrying out cyclic voltammetry studies upon modifying the electrode surface with streptavidin protein using an electrochemical glass cuvette structure. CV of the uncoated SPC and streptavidin-modified SPC probes, as shown in Figure 5, immersed in 20 mM K4(CN)6 and 100 mM KCl solution was recorded at a scan rate of 0.05 Vs–1. Herein, a sharp increase in redox peak currents (i.e., Ipa and Ipc) and peak separation potential (ΔEp) were observed in the case of the streptavidin-modified SPCE when compared to the uncoated SPCE. The increase in current peak observed for the SPC electrode modified with streptavidin protein is mainly attributed to the uniformly dispersed streptavidin inside the carbon matrix, which supports good electrical conductivity, large surface area, and excellent electron mobility at an ambient temperature. In addition, the peak extension in connection with ΔEp ranging from 0.2270 V for the unmodified SPC electrode to 0.2294 V for the streptavidin-modified SPC electrode illustrates that the process of electron transfer is irreversible (ΔEp > 0.059 V).38,39 For a more detailed analysis of the role of electron transfer in the streptavidin-coated electrode, CV was performed at varying scan rates, and a heterogeneous electron transfer rate constant was recorded for ferrocyanide electroactive species.
Figure 5.
Cyclic voltammograms of the uncoated and streptavidin-modified SPC electrodes in Zobell’s solution at 0.05 Vs–1.
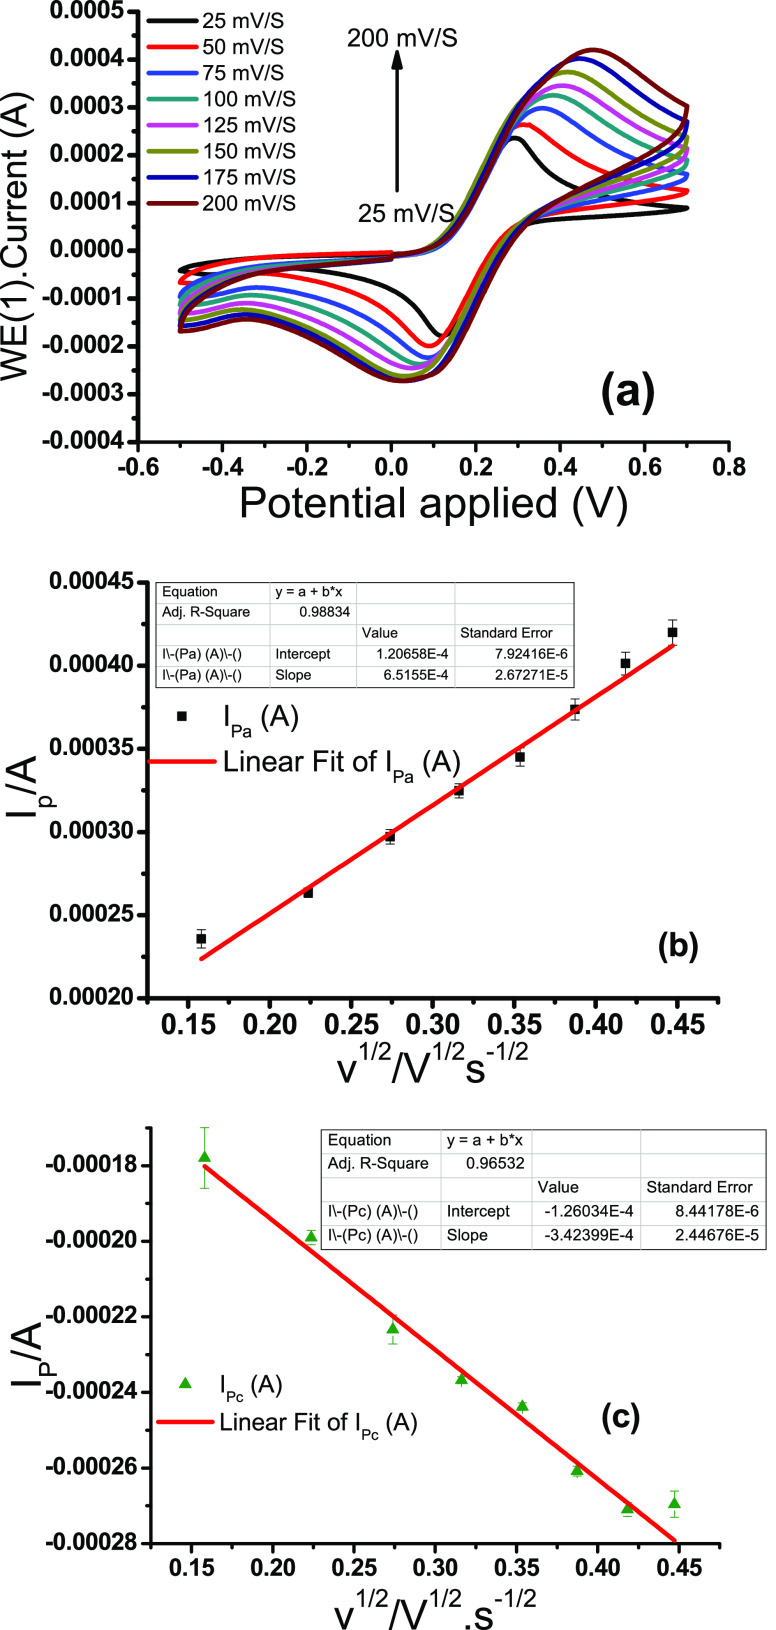
Figure 6a presents CV curves of streptavidin-coated electrodes at different scan rates (25–200 mV·s–1). A significant increase in the value of ΔEp and peak current (Ipa and Ipc) is noticed at the highest scan rates and the peak current ratio is also observed, i.e., Ipa/Ipc = 1.67, which does not fall in the range of 1.0–1.27 but is quite close to the range. These data clearly demonstrate the nature of the process, i.e., from the reversible-to-irreversible shift,38 suggesting that the process is quasireversible. Figure 6b,c shows the graph of anodic (Ipa) and cathodic (Ipc) peak currents as the function of the square root of different scan rates (v1/2, eqs 1 and 2). All linear patterns along with the correlation coefficients (R2 = 0.98834 for Ipa and 0.96532 for Ipc) are presented in these graphs, demonstrating the diffusion curbed nature of the electrochemical process40
| 1 |
| 2 |
| 3 |
where the anodic peak current value (Ip) is 0.26 mA, the surface area of the electrode (A) is 0.13 cm2, the number of electrons (n) transferred in the redox phenomenon is 1, the diffusion coefficient of the transferred species is D, the concentration (C) is 20 mM, and the scan rate (v) is 50 mV/s. The coefficient of dispersion [D] was calculated and found to be 2.76 × 10⁻¹² cm2 s–1 using Randles-Sevcik eq 3.41
Figure 6.
(a) Cyclic voltammograms of the streptavidin-coated SPC electrode immersed in Zobell’s solution obtained at different scan rates (range: 25 to 200 mV·s–1). (b) Plot of the anodic peak current (Ipa) vs the square root of the scan rate (v1/2) and applied linear fit. (c) Plot of the cathodic peak current (Ipc) vs the square root of the scan rate (v1/2) and applied linear fit.
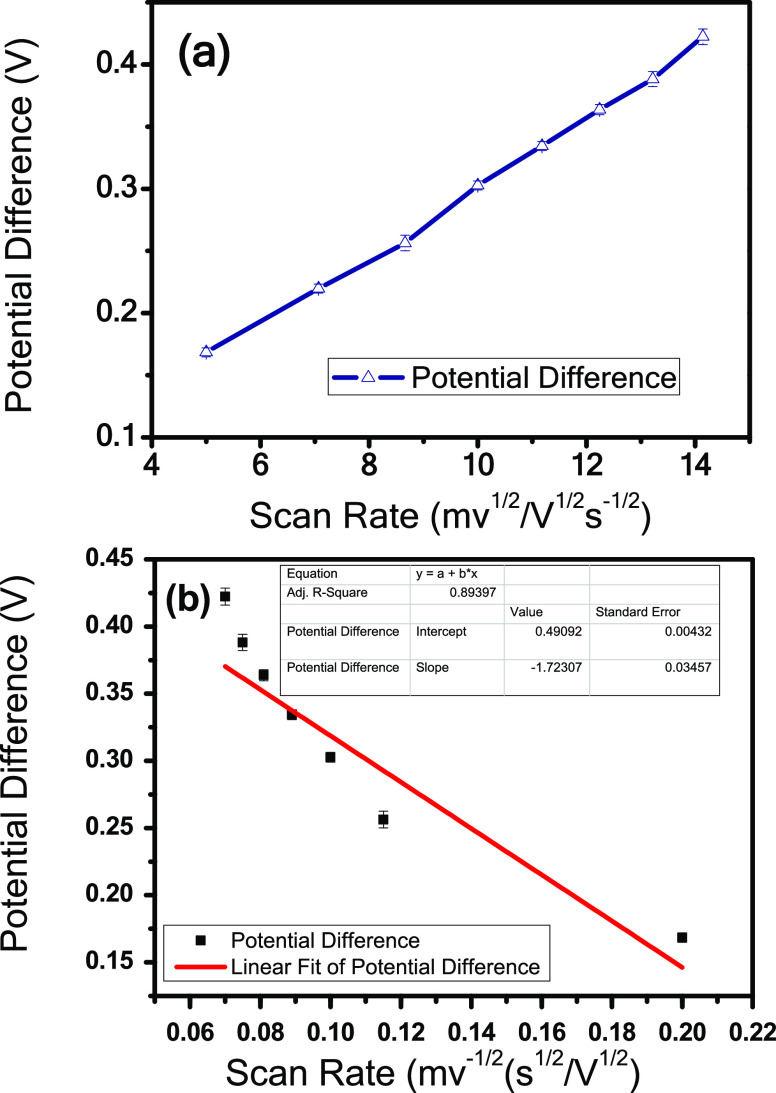
Figure 7a shows the potential difference (ΔEp) as an element of the square root of sweep rate that shows that ΔEp increases at extreme scan rates, semireversible dynamic expression in the biosensor. The obtained values of ΔEp are converted into an active parameter “ψ” (a dimensionless quantity) using Nicholson’s working curve,38 which straightforwardly corresponds to the reciprocal of the square root of scan rate (v–1/2), eq 4
| 4 |
Figure 7b illustrates the k° value, i.e., the standard heterogeneous rate constant of [Fe(Cn)]3– deduced from a plot of straight fit versus ψ-v–1/2 relation. The value of k° (standard heterogeneous rate constant) was found to be −1.7 cm.s–1 from the slope value, falling in the scope of 0.3 > k° > (2 × 10⁵) v1/2 cms–1, which is ideally exhibited for a reversible and irreversible process.
Figure 7.
(a) Peak separation (ΔEp) versus square root of the scan rate (v1/2). (b) Peak separation (ψ) versus reciprocal of the square root of the scan rate (v–1/2). ψ is the potential difference shown in (b).
2.1.5. Detection of miR393a
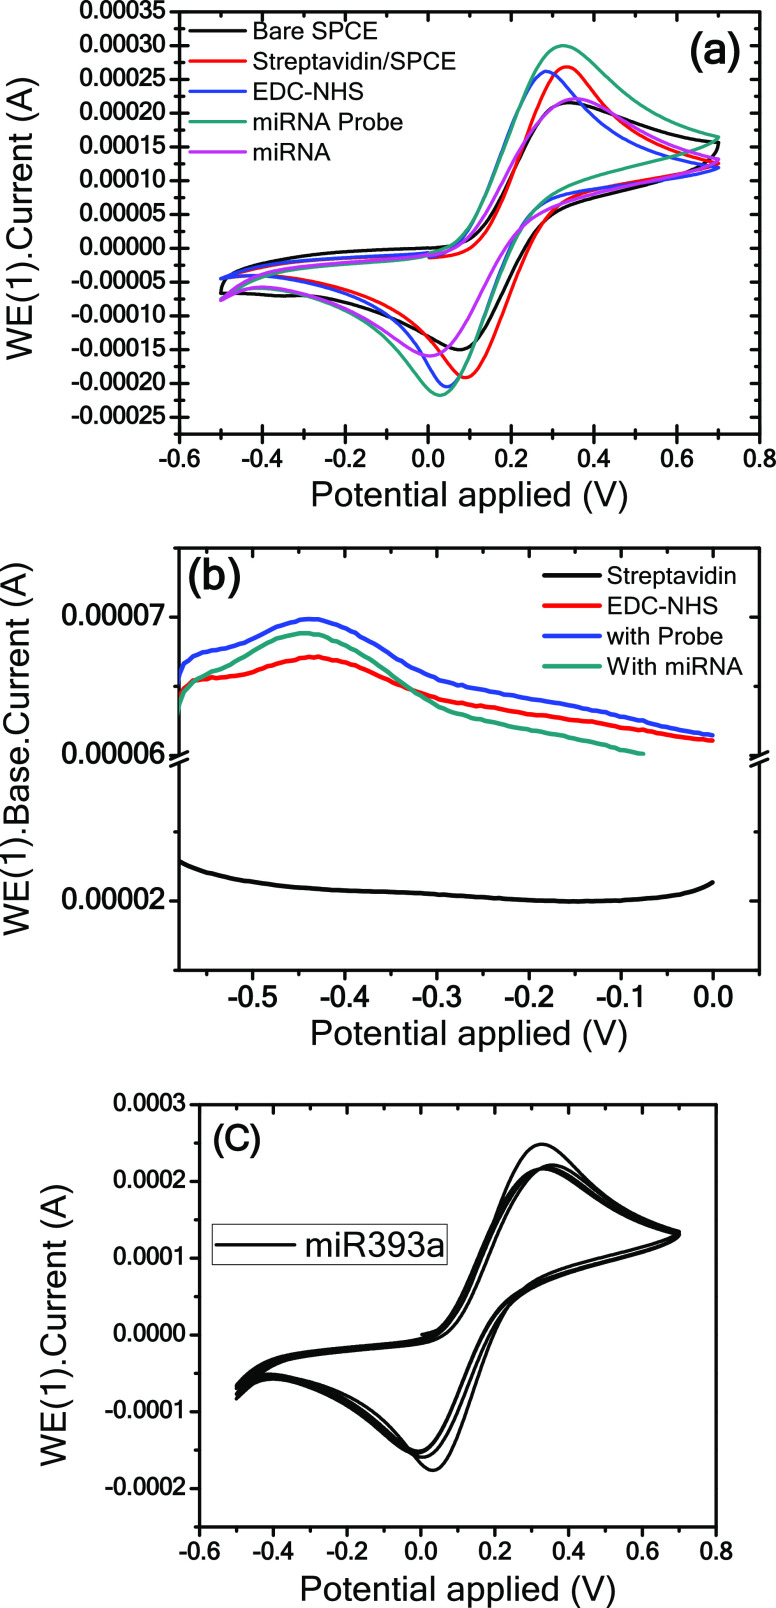
Figure 8a presents the CVs of bare SPC, streptavidin-modified SPC, EDC-NHS-linked streptavidin, probe/EDC-NHS/streptavidin/SPC, and miR393a/probe/EDC-NHS/streptavidin/SPC electrodes at a scan rate of 50 mV/s. As mentioned above, the streptavidin-coated SCP electrode exhibits an increased peak current compared with the bare SCP electrode. The peak current slightly changes on functionalization with an EDC-NHS cross-linker (zero-length). This is attributed to the hidden electroactive exposed surface by EDC-NHS linkers, which are nonconductive in their natural state and do not prompt diverting the electron communication. Following immobilization of the miRNA probe onto the EDC-NHS-functionalized streptavidin electrode surface, an increase in peak current is observed, which can be attributed to the charge transfer due to ionic conductivity and π–π interactions of the probe.42 Moreover, the phosphosugar skeleton is by and large negatively charged due to being encompassed by positive ions “as a counterion”. This may result in a probe/water/positive particle complex that will emphasize result in an increase in oxidoreduction current.
Figure 8.
(a) Cyclic voltammograms of the bare SPC, streptavidin-coated SPC, EDC-NHS-linked streptavidin, probe/EDC-NHS/streptavidin/bare, and miRNA393a/probe/EDC-NHS/streptavidin/bare electrodes immersed in Zobell’s solution recorded at 50 mV/s. (b) DPV analysis of streptavidin, EDC-NHS-linked streptavidin, probe/EDC-NHS/streptavidin, and miR393a/probe/EDC-NHS/streptavidin SPC electrodes at a modulation amplitude of 25 mV and modulation time of 50 ms at room temperature. (c) Repeatability cyclic voltammetry graph of four miRNA393a-probe-EDC/NHS-streptavidin biorecognition surfaces employed for 100 μM miRNA.
Figure 8b shows DPV studies of streptavidin/bare, EDC-NHS-linked streptavidin/bare, probe/EDC-NHS/streptavidin/bare, and miR393a/probe/EDC-NHS/streptavidin/bare electrodes in a 20 mM Zobell’s solution at a modulation amplitude of 25 mV and a modulation time of 50 ms at room temperature. The oxidation characteristic of ferrocyanide solution (1 M KCl) (ferrocyanide oxidizes at −0.43 V to ferricyanide solution and reduces to ferrocyanide solution at −0.50 V) is used as a marker for the identification of miR393a and probe. Moreover, it is shown that the streptavidin-coated electrode does not show any oxidation peak current at −0.43 V, demonstrating the absence of any hybridization event. The peak current detected at −0.43 V for EDC-NHS/streptavidin/bare and probe/EDC-NHS/streptavidin/bare electrodes increases due to ferrocyanide oxidation and results in a decline in the peak current immediately following exposure to miR393a, confirming the occurrence of hybridization. Furthermore, Figure 8c depicts the repeatability cyclic voltammetry curve of four miRNA393a-probe-EDC-NHS-streptavidin biorecognition surfaces employed for 100 μM miRNA.
2.1.6. Analysis of Response Studies
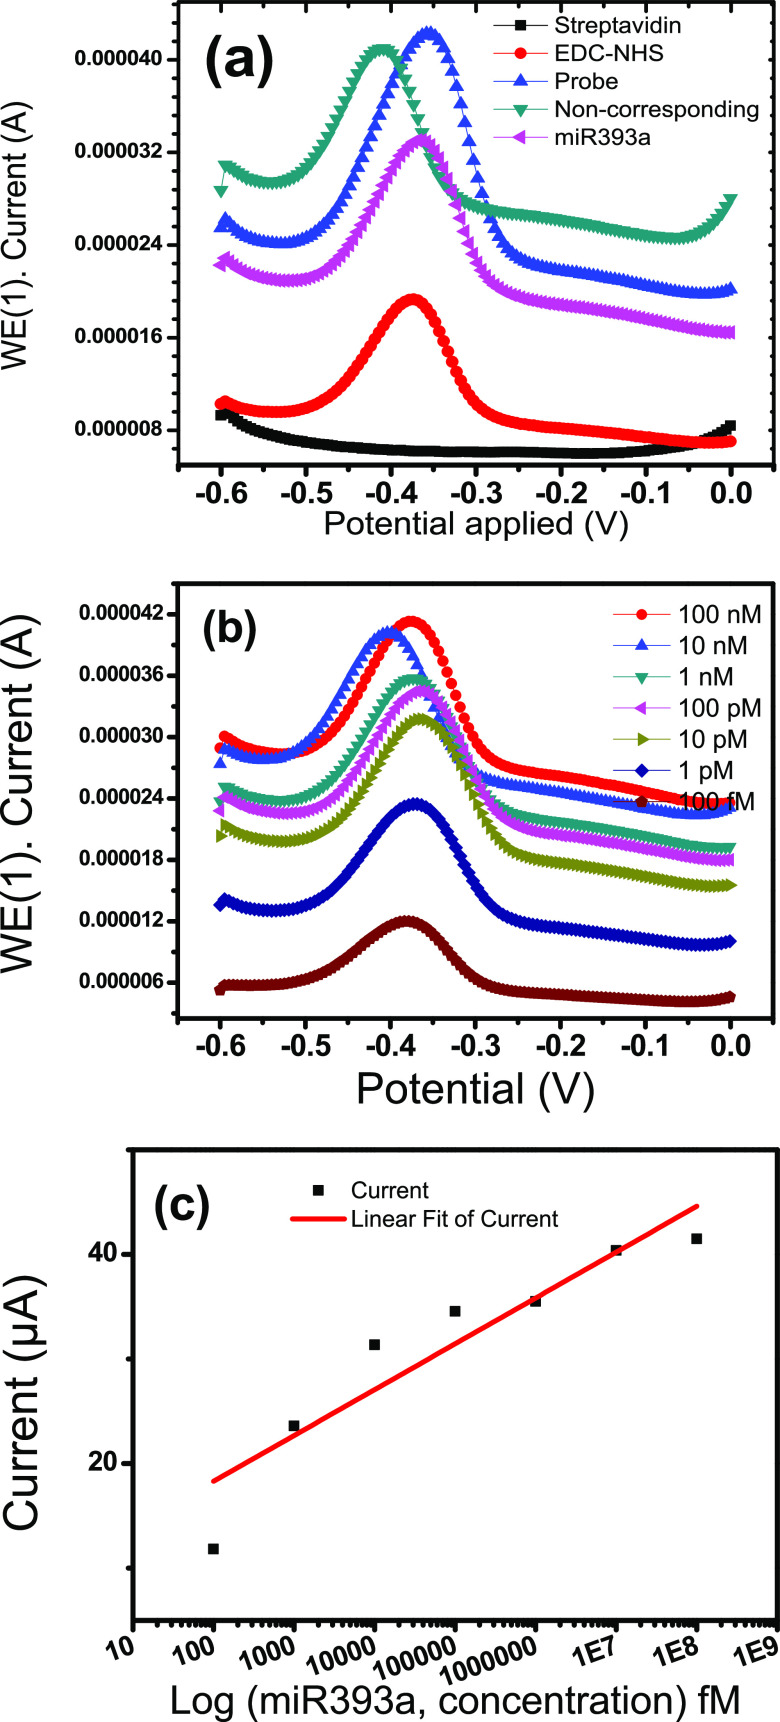
Figure 9a,b presents the DPV response studies of the probe-EDC-NHS-streptavidin-SPCE without any hybridization indicator. Figure 9a shows the DPV response curves of probe-EDC-NHS-streptavidin-SPCE for miRNA hybridization with corresponding (miR393a) and noncorresponding sequences without any hybridization indicator. As seen in Figure 9a, the miR393a corresponding response curve is observed, and the peak current decreases from 42 to 32 μA when the probe immobilized on the electrode hybridizes with the corresponding miR393a. This decrease in the peak current may be ascribed to the fact that free electrons are not easily accessible43,44 as compared to the probe electrode. However, a slight change in the peak current was observed after hybridization with a noncorresponding sequence. Thus, the results clearly show that the probe-EDC-NHS-streptavidin-SPCE exhibits great selectivity toward the corresponding and noncorresponding target sequences.
Figure 9.
DPV studies of the streptavidin/SPCE in Zobell’s solution at a modulation amplitude of 25 mV and a modulation time of 50 ms at room temperature after exposing with (a) streptavidin, EDC-NHS, probe, noncorresponding, and miR393a, and (b) hybridization with the complementary miR393a target (100 nM, 10 nM, 1 nM, 100 pM, 10 pM, 1 pM, and 100 fM). (c) DPV response curves of the probe-EDC-NHS-streptavidin-SPCE toward the miR393a concentration range of 10 μM–100 fM.
This biosensor platform demonstrated clear and static oxidation peaks that may be ascribed to rapid electron transfer over all concentration ranges. This phenomenon can be attributed to the fact that the negatively charged backbone of target miRNA causes increased negative charges on the surface, resulting in increased repulsive forces to the [Fe(CN)6]3–/4–ions.45,46 A successive increase in the peak current value was noticed with increasing miR393a concentrations at the fabricated probe electrode in the presence of the mediator [Fe(CN)6]3–/4– that promoted the catalytic oxidation of miR393a. Figure 9c shows the linear curve exhibiting the linear regression equation ΔI = 4.384.6 [miR393a] + 9.52734, between peak currents vs concentration in the log format with a correlation coefficient of 0.96963. The sensitivity of the platform was found to be 33.72 μA fM–1 cm–2. The limit of detection value was determined using the following equation.47,48
where SB is the standard deviation of seven response curves taken from the response obtained from the blank (a solution identical to that analyzed but without the analyte) and S is the slope of the calibration curve (sensitivity of the analytical method).
The limit of detection of 0.33 fM indicated by the platform is significantly lower than the other ranges of miR393a concentration.
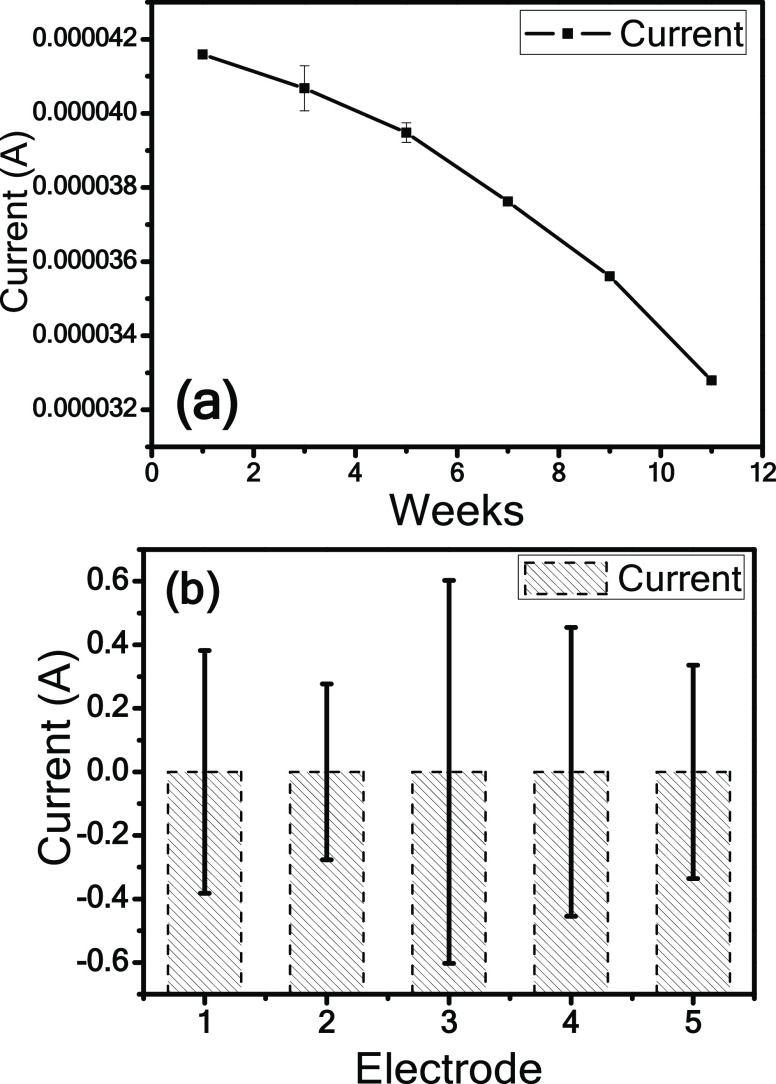
Figure 10a shows the stability curve of the biorecognition platform up to 12 weeks with an equal interval. The biorecognition platform is stable up to 6 weeks, it decreases by only 15% of its activity after miRNA immobilization, and furthermore, it decreases to approximately 14% of the initial current response after 12 weeks. This platform presents excellent reproducibility for an apparent miR393a concentration of 100 pM by minimum relative standard deviations (RSDs), showing its good quality precision of the biorecognition platform, as shown in Figure 10b.
Figure 10.
(a) Stability curve of the miRNA393a-probe-EDC-NHS-streptavidin biorecognition platform as a function of weeks and current response. (b) Reproducibility curve of five miRNA393a-probe-EDC-NHS-streptavidin biorecognition platforms for 100 pM miRNA concentration.
2.1.7. SECM Studies
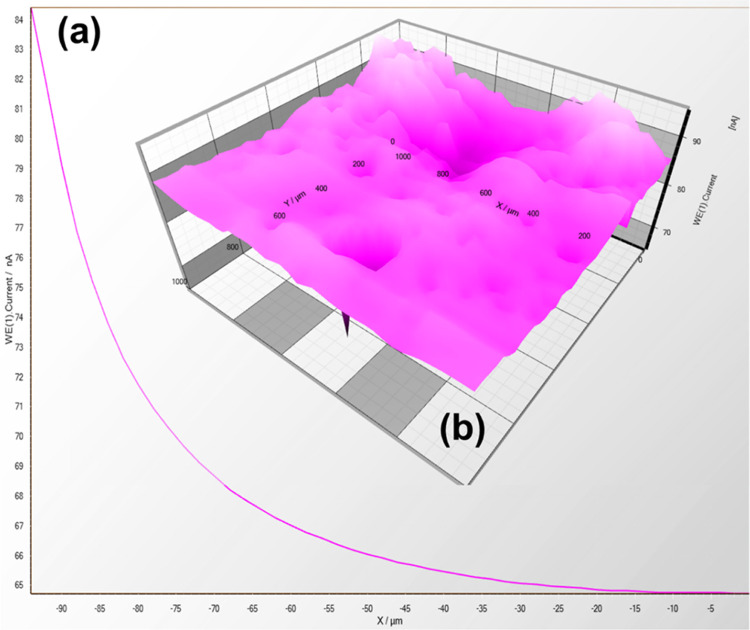
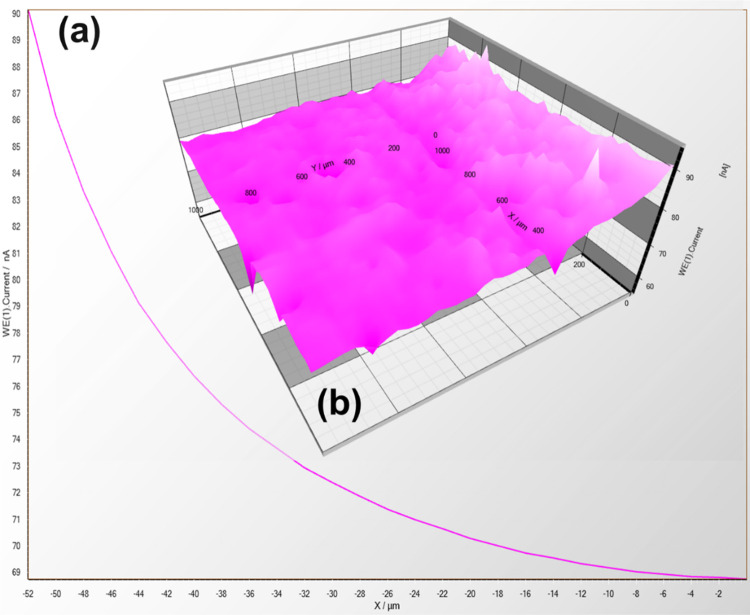
SECM was carried out to determine the electrical conductivity of streptavidin-coated carbon and bare carbon (without coating) electrodes, as shown in Figures 11,12, respectively. Before SECM measurement, a 20 mM potassium ferrocyanide electrolyte solution (with 0.1 M KCl) was filled in the solution holder so that the peak current takes place near the Pt microelectrode (diameter = 25 μm) because of the response of electrode in a proper voltage reach. A power of 500 mV was recorded and enforced toward the carbon and streptavidin-coated electrode tip to effectuate the SECM. The tip current is affected due to the electrochemical reaction between the tip and the nature of the electrode (i.e., carbon and streptavidin-coated carbon electrode) present close to it.49−51
Figure 11.
(a) Current–distance graph showing the screen-printed carbon electrode through the 25 μm microelectrode (Pt). (b) Plot of current variation with electrode surface area in the XY directions retaining the Z direction with height being constant.
Figure 12.
(a) Current–distance curve showing the streptavidin-coated screen-printed carbon electrode through the Pt microelectrode (25 μm). (b) Plot showing the variation current with an area of electrode surface in the XY directions retaining the Z direction with height being constant.
Figures 11a and 12a show the approach curve using the Pt microelectrode (diameter = 25 μm), and the current value is increased for the streptavidin-coated SPCE compared to the bare SPCE at the microelectrode in the approach curve. The streptavidin-coated electrode confirmed the enhancement in electric conductance by introducing black carbon as stuffing in the streptavidin biomolecule. Figures 11b and 12b show the SECM three-dimensional (3D) plot of ionic current variation over the microelectrode tip accompanied by the surface plane of an electrode in the two-dimensional (2D) direction (i.e., XY). This platform showed a larger current produced for the streptavidin-coated SPC electrode as compared to the uncoated and streptavidin-coated electrodes, thus confirming its electroconductive nature keeping the height (Z) constant. The “Z” value, which lies near the electrode surface, is a highly electrochemical active area being chosen by the approach curve.
3. Conclusions
In summary, we successfully constructed a highly simple, rapid, sensitive, and selective electrochemical biosensor for the determination of plant miR393a, capable of detecting mild, moderate, and severe drought stress in plants. In the current study, the electrochemical response is employed in the fabricated microelectrode biosensors for the one-step detection of miRNAs within 5–10 min. The design mechanism of the fabricated biosensor was based on the main reductant, streptavidin, and a target sequence, miR393a, as the model structure to indicate the biosensor efficacy calculated by potential sweeping CV and pulsed DPV techniques. The use of streptavidin to modify SPCEs must generate a stable high-affinity surface for a large number of biomolecules. The advantage of the streptavidin system used in the electrochemical biosensor leads to well-oriented capture antibody immobilization, which, in turn, enhances the sensitivity of the assay. Improving from the multistep surface alteration methods, the background current response was reduced to the baseline level. A signal-on DPV biosensor for miR393a detection was fabricated based on a single-signaling amplification strategy. A detection limit of 0.33 fM was displayed by this method, with high specificity and superior sensitivity as compared to the other studies in Table 1. It had an enormously great dynamic range of 7 orders of magnitude in the range of 100 nM to 100 fM. In addition, the proposed method may be adopted to effectively analyze miR393a in real samples extracted from affected plants.
Table 1. Comparison of the Analytical Performance of the Developed Biosensor Employed for microRNA Detection with Other Biosensors.
| S. No | amplification strategy/sensing method | analyte/target molecule | material used | probe used | linear range | detection limit | refs |
|---|---|---|---|---|---|---|---|
| 1. | fluorescence resonance energy transfer-based biosensor | miRNA-167 | CDs-pDNA and Fe3O4@PDA NPs | DNA | 0.5–100 nM | 76 pM | (30) |
| 2. | optical biosensor | miRNA-1886 | P-AuNPs | C–AuNP (probe) | 100–6800 fM | 2 fM | (31) |
| 3. | photoelectrochemical biosensor | miRNA-319a | indium tin oxide (ITO) electrode deposited with CuO-CuWO4 | miRNA-319a-specific linear padlock DNA probe | 1 fM to 0.1 nM | 0.47 fM | (32) |
| 4. | electrochemical biosensor | miRNA-122 | gold electrode | capture probe: 5′-TTG TCA CAC TCC ATT TTT TTT TTT T-SH-3′ | 1 pM to 100 nM | 0.4 pM | (33) |
| 5. | electrochemical biosensor | miRNA-159a | AuNPs/Au electrode | DNA probe | 0.01 to 10 pM | 3.5 fM | (34) |
| 6. | electrochemical biosensor | miRNA-319a | AuNPs/glassy-carbon Electrode (GCE) | ssDNA probe | 1000–5 pM | 1.8 pM | (35) |
| 7. | electrochemical biosensor | microRNA-159a | AuNPs/GCE | ssDNA probe | 0.5 pM–1.0 nM | 0.17 pM | (36) |
| 8. | electrochemistry | miRNA | ITO-coated glass slides/Ag/AgCl electrodes | oligonucleotide capture probes | 0.50–400 pM | 0.20 pM | (37) |
| 9. | streptavidin-coated SPCE | miR393a | streptavidin-coated SPCE | DNA probe | 100 nM to 100 fM | 0.33 fM | this work |
4. Materials and Methods
4.1. Materials/Reagents/Chemicals
Potassium persulfate GR (assay 98.0%), potassium permanganate (assay 99%), phosphorus pentoxide GR (assay 98%), sulfuric acid (assay NLT 97.0%), streptavidin, and hydrogen peroxide (30%) were purchased from Sigma-Aldrich. In addition, hydrochloric acid, sodium chloride, sodium hydrogen phosphate, and potassium dihydro phosphate were also obtained from Sigma-Aldrich. The latter chemicals were used for preparing 0.01 M phosphate buffer saline (PBS) solution. Furthermore, 1-ethyl-3-(3-dimethylaminopropyl)carbodiimide (EDC), N-hydroxysuccinimide (NHS), 11-mercaptoundecanoic acid (11-MUA), ethanolamine, and nuclease-free water (MW = 18.02 g/mol), and Tris Buffer (100 mM, pH 7.4) were purchased from Sigma-Aldrich. miR393a oligomer (Apt), UCCAAAGGGAUCGCAUUGAUC (CC = 392 μL for 100 μM), its complementary strand, 5′-[AmC6]AGGTTTCCCTAGCGTAACTAG-3′ (CC = 550 μL for 100 μM), noncomplementary strand, AGGTTGAGAGGAATGTTGTCT (missr2F and CC = 268.00 Vol for 100 pmol/μL), and CTGGTCCGAGAATCAATTT (missr2R and CC = 373.20 Vol for 100 pmol/μL) were synthesized by Sigma-Aldrich (India).
4.2. Instrumentation and Apparatus
The modified DNA probe with miR393a interactions was examined using a surface plasmon resonance (SPR) instrument (ESPRIT, Netherlands). The planar gold disks of SPR were provided with the system. The buffer solutions were injected with a needle in the optical chamber using a peristaltic pump at a constant flow rate (i.e., 1 μL/s). The electrochemical detections were accomplished on screen-printed carbon (DropSens-110D, India) electrodes using a μstat 400 portable Biopotentiostat/Galvanostat (Metrohm Autolab, Netherlands). Nove 2.1.1 software was used to calculate the values of oxidation and reduction signals. Cyclic voltammetry (CV) and DPV measurements were recorded by a 20 mM Zobell’s solution containing 1 M KCl solution with ferrocyanide using an Autolab potentiostat fitted with a three-electrode in glass cell setup where carbon mesh, Ag/AgCl, and the streptavidin nanolayer deposited over the bare electrode were employed as the counter, reference, and working electrodes, respectively. Scanning electrochemical microscopy (SECM) and SPR spectra were collected on an Autolab Metrohm (Netherlands). Field emission scanning electron microscopy (FESEM) images and energy-dispersive X-ray spectroscopy (EDX) spectrum of the bare electrode were recorded on a Tescan Mirab3 microscope.
4.3. Fabrication of the Streptavidin-Coated SPCE
Streptavidin was coated over the exposed working carbon electrode according to the method described by Hernández-Santos et al.52 In this method, the electrodes were pretreated before each voltammetry experiment to improve the sensitivity and repeatability of the results. Fifty microliters of 0.1 M H2SO4 was dropped on the electrode, and an anodic current of +3.0 μA was applied for the pretreatment of the electrode. After this, the electrodes were washed using a 0.1 M Tris buffer of pH 7.2. An aliquot of 10 μL of 10-5 M streptavidin solution was drop cast on the treated electrode, and it was left overnight at 4 °C. To remove the excess protein, the electrode was washed with 0.1 M Tris buffer (pH 7.2). Then, the free surface sites were blocked using 40 μL of 2% (w/v) bovine serum albumin (BSA), followed by a washing step with the same Tris buffer containing 1% BSA. Finally, the fabricated electrode was stored at 4 °C before use.
4.4. Functionalized and Activated Gold Disk
First of all, the disk surface of a thin gold layer-coated glass disk was washed by argon plasma treatment. After that, the gold surface of the disk was functionalized with a self-assembled monolayer of 11-MUA by immersing the gold disk in a 2 mM ethanol solution of mercaptoundecanoic acid for 12 h, followed by rinsing with distilled water and ethanol and drying in the fume hood. Then, an 11-MUA-functionalized gold disk was fitted with a flow channel. The PBS solution (pH = 7.4) was injected onto the functionalized gold surface at a flow rate of 100 μL/min for further cleaning, and the correct baseline was fixed. The surface of the 11-MUA self-assembled layer was activated by injecting 400 mM EDC and 100 mM NHS mixture (1:1) at a flow rate of 100 μL/min for 5–6 min. Both biolinkers were formulated in distilled water, and the mixture was prepared just before use. Diluted amine-modified sequence/probe (50 μg/mL) in 0.1 mM nuclease-free water was injected through a needle onto the exposed activated gold surface at a flow rate of 50 μL/min for 4 min. Amine-modified sequence/probe was immobilized over the activated gold surface by amine coupling chemistry at room temperature, as shown in Figure 1. Following probe immobilization, free EDC-NHS ester sites were blocked by the exposure of the 1 M ethanolamine solution at a flow rate of 100 μL/min for 6 min to inhibit nonspecific analytes’ linkage. The gold sensor surface was automatically rinsed by PBS wash for 6 min after each step.
4.5. Scanning Electrochemical Microscopy (SECM)
The electroconductivity of the SPC electrode and streptavidin-coated SPC electrodes was examined by employing the Sensolytics SECM arrangement linked with Autolab (PGSTAT 128N) in a responsive manner. Streptavidin was coated on a screen-printed carbon electrode for conducting SECM. It was directly coated over the working electrode of the SPC electrode by the spin-coating method. The thickness of the coated streptavidin layer was kept on the nanometer scale. Consequently, roughness in the streptavidin layer was less and in the nanometer range when compared with carbon by Pt microelectrode size (25 μm). Hence, a superb SECM assessment was guaranteed. SECM data were obtained for bare and streptavidin-coated SPC electrodes for correlation. Three different electrodes were utilized for recording the data using SECM. Here, Ag/AgCl was used as the reference electrode, carbon (4 mm) was used as the working electrode, and a carbon coil as the counter electrode. Two different sweeps at various tip areas were examined for simple uncoated and streptavidin-coated SPC electrodes, as shown in Figures 7b and 8b, respectively. Bare and coated electrodes were immersed in a 20 mM K4Fe(CN) aqueous solution and in a 0.1 M KCl solution for recording further measurements. SECM data for simple and streptavidin-coated SPC electrodes with a large conductive substrate surface were recorded at 0.550 V with a 25 μm radius Pt tip.
Acknowledgments
This research work received financial support from the Department of Nematology under gap-filling project/scheme-C(a)Dte-R-3-Agri.(A)/1161 of Director of Research (DR/B1/2020/2959-66), Chaudhary Charan Singh Haryana Agricultural University, Hisar, and Haryana, India. The authors thank Dr. Prakash Banakar, Centre for Bio-Nanotechnology, for providing research facilities.
The authors declare no competing financial interest.
References
- Zhang B.; Pan X.; Cobb G. P.; Anderson T. A. Plant MicroRNA: A Small Regulatory Molecule with Big Impact. Dev. Biol. 2006, 289, 3–16. 10.1016/j.ydbio.2005.10.036. [DOI] [PubMed] [Google Scholar]
- Sunkar R.; Zhu J.-K. Novel and Stress-Regulated MicroRNAs and Other Small RNAs from Arabidopsis. Plant Cell 2004, 16, 2001–2019. 10.1105/tpc.104.022830. [DOI] [PMC free article] [PubMed] [Google Scholar]
- Xin M.; Wang Y.; Yao Y.; Xie C.; Peng H.; Ni Z.; Sun Q. Diverse Set of MicroRNAs Are Responsive to Powdery Mildew Infection and Heat Stress in Wheat (Triticum Aestivum L.). BMC Plant Biol. 2010, 10, 123. 10.1186/1471-2229-10-123. [DOI] [PMC free article] [PubMed] [Google Scholar]
- Chen F.; Fu X.; Meng Y.; Jiang M.; Wang J.; Zhou Y.-L.; Zhang D.-W. A Novel Miniaturized Homogeneous Label-Free Electrochemical Biosensing Platform Combining Integrated Microelectrode and Functional Nucleic Acids. Anal. Chim. Acta 2021, 1158, 338415 10.1016/j.aca.2021.338415. [DOI] [PubMed] [Google Scholar]
- Feng C.; Zhang C.; Guo J.; Li G.; Ye B.; Zou L. Novel Electrochemical Biosensor Based on Exo III-Assisted Digestion of DsDNA Polymer from Hybridization Chain Reaction in Homogeneous Solution for CYFRA 21-1 DNA Assay. Anal. Chim. Acta 2021, 1158, 338413 10.1016/j.aca.2021.338413. [DOI] [PubMed] [Google Scholar]
- Nehra A.; Pandey K.; Singh K. P.; Ahalawat S.; Joshi R. P. Determination of E. coli by a Graphene Oxide-Modified Quartz Crystal Microbalance. Anal. Lett. 2017, 50, 1897–1911. 10.1080/00032719.2016.1253708. [DOI] [Google Scholar]
- Singh K. P.; Dhek N. S.; Nehra A.; Ahlawat S.; Puri A. Applying Graphene Oxide Nano-Film over a Polycarbonate Nanoporous Membrane to Monitor E. coli by Infrared Spectroscopy. Spectrochim. Acta, Part A 2017, 170, 14–18. 10.1016/j.saa.2016.06.053. [DOI] [PubMed] [Google Scholar]
- Ahlawat S.; Nehra A.; Pandey V.; Singh K. P. Gold-Coated Nanoporous Polycarbonate Track–Etched Solid Platform for the Rapid Detection of Mesothelin. Ionics 2019, 25, 1887–1896. 10.1007/s11581-018-2761-6. [DOI] [Google Scholar]
- Li F.; Peng J.; Wang J.; Tang H.; Tan L.; Xie Q.; Yao S. Carbon Nanotube-Based Label-Free Electrochemical Biosensor for Sensitive Detection of MiRNA-24. Biosens. Bioelectron. 2014, 54, 158–164. 10.1016/j.bios.2013.10.061. [DOI] [PubMed] [Google Scholar]
- Cissell K. A.; Rahimi Y.; Shrestha S.; Hunt E. A.; Deo S. K. Bioluminescence-Based Detection of MicroRNA, MiR21 in Breast Cancer Cells. Anal. Chem. 2008, 80, 2319–2325. 10.1021/ac702577a. [DOI] [PubMed] [Google Scholar]
- Bi S.; Zhang J.; Hao S.; Ding C.; Zhang S. Exponential Amplification for Chemiluminescence Resonance Energy Transfer Detection of MicroRNA in Real Samples Based on a Cross-Catalyst Strand-Displacement Network. Anal. Chem. 2011, 83, 3696–3702. 10.1021/ac200096b. [DOI] [PubMed] [Google Scholar]
- Yin B.-C.; Liu Y.-Q.; Ye B.-C. One-Step, Multiplexed Fluorescence Detection of MicroRNAs Based on Duplex-Specific Nuclease Signal Amplification. J. Am. Chem. Soc. 2012, 134, 5064–5067. 10.1021/ja300721s. [DOI] [PubMed] [Google Scholar]
- Šípová H.; Zhang S.; Dudley A. M.; Galas D.; Wang K.; Homola J. Surface Plasmon Resonance Biosensor for Rapid Label-Free Detection of Microribonucleic Acid at Subfemtomole Level. Anal. Chem. 2010, 82, 10110–10115. 10.1021/ac102131s. [DOI] [PMC free article] [PubMed] [Google Scholar]
- Driskell J. D.; Seto A. G.; Jones L. P.; Jokela S.; Dluhy R. A.; Zhao Y.-P.; Tripp R. A. Rapid MicroRNA (MiRNA) Detection and Classification via Surface-Enhanced Raman Spectroscopy (SERS). Biosens. Bioelectron. 2008, 24, 917–922. 10.1016/j.bios.2008.07.060. [DOI] [PubMed] [Google Scholar]
- Lee R. C.; Ambros V. An Extensive Class of Small RNAs in Caenorhabditis Elegans. Science 2001, 294, 862–864. 10.1126/science.1065329. [DOI] [PubMed] [Google Scholar]
- Cui A.; Zhang J.; Bai W.; Sun H.; Bao L.; Ma F.; Li Y. Signal-on Electrogenerated Chemiluminescence Biosensor for Ultrasensitive Detection of MicroRNA-21 Based on Isothermal Strand-Displacement Polymerase Reaction and Bridge DNA-Gold Nanoparticles. Biosens. Bioelectron. 2019, 144, 111664 10.1016/j.bios.2019.111664. [DOI] [PubMed] [Google Scholar]
- Hansen T. B.; Jensen T. I.; Clausen B. H.; Bramsen J. B.; Finsen B.; Damgaard C. K.; Kjems J. Natural RNA Circles Function as Efficient MicroRNA Sponges. Nature 2013, 495, 384–388. 10.1038/nature11993. [DOI] [PubMed] [Google Scholar]
- Singh V.; Misra A. K. Detection of Plant Leaf Diseases Using Image Segmentation and Soft Computing Techniques. Inf. Process. Agric. 2017, 4, 41–49. 10.1016/j.inpa.2016.10.005. [DOI] [Google Scholar]
- Xiong L.; Schumaker K. S.; Zhu J.-K. Cell Signaling during Cold, Drought, and Salt Stress. Plant Cell 2002, 14, S165–S183. 10.1105/tpc.000596. [DOI] [PMC free article] [PubMed] [Google Scholar]
- Creelman R. A.; Mullet J. E. Biosynthesis And Action Of Jasmonates In Plants. Annu. Rev. Plant Physiol. Plant Mol. Biol. 1997, 48, 355–381. 10.1146/annurev.arplant.48.1.355. [DOI] [PubMed] [Google Scholar]
- Li W.-X.; Oono Y.; Zhu J.; He X.-J.; Wu J.-M.; Iida K.; Lu X.-Y.; Cui X.; Jin H.; Zhu J.-K. The Arabidopsis NFYA5 Transcription Factor Is Regulated Transcriptionally and Posttranscriptionally to Promote Drought Resistance. Plant Cell 2008, 20, 2238–2251. 10.1105/tpc.108.059444. [DOI] [PMC free article] [PubMed] [Google Scholar]
- Jia X.; Wang W.-X.; Ren L.; Chen Q.-J.; Mendu V.; Willcut B.; Dinkins R.; Tang X.; Tang G. Differential and Dynamic Regulation of MiR398 in Response to ABA and Salt Stress in Populus Tremula and Arabidopsis Thaliana. Plant Mol. Biol. 2009, 71, 51–59. 10.1007/s11103-009-9508-8. [DOI] [PubMed] [Google Scholar]
- Ni Z.; Hu Z.; Jiang Q.; Zhang H. GmNFYA3, a Target Gene of MiR169, Is a Positive Regulator of Plant Tolerance to Drought Stress. Plant Mol. Biol. 2013, 82, 113–129. 10.1007/s11103-013-0040-5. [DOI] [PubMed] [Google Scholar]
- Sunkar R.; Kapoor A.; Zhu J.-K. Posttranscriptional Induction of Two Cu/Zn Superoxide Dismutase Genes in Arabidopsis Is Mediated by Downregulation of MiR398 and Important for Oxidative Stress Tolerance. Plant Cell 2006, 18, 2051–2065. 10.1105/tpc.106.041673. [DOI] [PMC free article] [PubMed] [Google Scholar]
- Zhang B. MicroRNA: A New Target for Improving Plant Tolerance to Abiotic Stress. J. Exp. Bot. 2015, 66, 1749–1761. 10.1093/jxb/erv013. [DOI] [PMC free article] [PubMed] [Google Scholar]
- Nehra A.; Ahlawat S.; Singh K. P. A Biosensing Expedition of Nanopore: A Review. Sens. Actuators, B 2019, 284, 595–622. 10.1016/j.snb.2018.12.143. [DOI] [Google Scholar]
- Nehra A.; Pal Singh K. Current Trends in Nanomaterial Embedded Field Effect Transistor-Based Biosensor. Biosens. Bioelectron. 2015, 74, 731–743. 10.1016/j.bios.2015.07.030. [DOI] [PubMed] [Google Scholar]
- Nehra A.; Chen W.; Dimitrov D. S.; Puri A.; Singh K. P. Graphene Oxide-Polycarbonate Track-Etched Nanosieve Platform for Sensitive Detection of Human Immunodeficiency Virus Envelope Glycoprotein. ACS Appl. Mater. Interfaces 2017, 9, 32621–32634. 10.1021/acsami.7b12103. [DOI] [PubMed] [Google Scholar]
- Rosas-Cárdenas F.; de F.; Escobar-Guzmán R.; Cruz-Hernández A.; Marsch-Martínez N.; de Folter S. An Efficient Method for MiRNA Detection and Localization in Crop Plants. Front. Plant Sci. 2015, 6, 99 10.3389/fpls.2015.00099. [DOI] [PMC free article] [PubMed] [Google Scholar]
- Cao X.; Zhang K.; Yan W.; Xia Z.; He S.; Xu X.; Ye Y.; Wei Z.; Liu S. Calcium Ion Assisted Fluorescence Determination of MicroRNA-167 Using Carbon Dots–Labeled Probe DNA and Polydopamine-Coated Fe3O4 Nanoparticles. Microchim. Acta 2020, 187, 212. 10.1007/s00604-020-4209-8. [DOI] [PubMed] [Google Scholar]
- Asefpour Vakilian K. Gold Nanoparticles-Based Biosensor Can Detect Drought Stress in Tomato by Ultrasensitive and Specific Determination of MiRNAs. Plant Physiol. Biochem. 2019, 145, 195–204. 10.1016/j.plaphy.2019.10.042. [DOI] [PubMed] [Google Scholar]
- Li B.; Yin H.; Zhou Y.; Wang M.; Wang J.; Ai S. Photoelectrochemical Detection of MiRNA-319a in Rice Leaf Responding to Phytohormones Treatment Based on CuO-CuWO4 and Rolling Circle Amplification. Sens. Actuators, B 2018, 255, 1744–1752. 10.1016/j.snb.2017.08.192. [DOI] [Google Scholar]
- Wu S.; Chen H.; Zuo Z.; Wang M.; Luo R.; Xu H. A Simple Electrochemical Biosensor for Rapid Detection of MicroRNA Based on Base Stacking Technology and Enzyme Amplification. Int. J. Electrochem. Sci. 2015, 10, 3848–3858. [Google Scholar]
- Wang M.; Yin H.; Fu Z.; Guo Y.; Wang X.; Zhou Y.; Ai S. A Label-Free Electrochemical Biosensor for MicroRNA Detection Based on Apoferritin-Encapsulated Cu Nanoparticles. J. Solid State Electrochem. 2014, 18, 2829–2835. 10.1007/s10008-014-2531-y. [DOI] [Google Scholar]
- Zhou Y.; Wang M.; Yang Z.; Lu L.; Yin H.; Ai S. Electrochemical Biosensor for MicroRNA Detection Based on Hybridization Protection against Nuclease S1 Digestion. J. Solid State Electrochem. 2016, 20, 413–419. 10.1007/s10008-015-3005-6. [DOI] [Google Scholar]
- Zhou Y.; Wang M.; Xu Z.; Ni C.; Yin H.; Ai S. Investigation of the Effect of Phytohormone on the Expression of MicroRNA-159a in Arabidopsis Thaliana Seedlings Based on Mimic Enzyme Catalysis Systematic Electrochemical Biosensor. Biosens. Bioelectron. 2014, 54, 244–250. 10.1016/j.bios.2013.11.026. [DOI] [PubMed] [Google Scholar]
- Gao Z.; Yu Y. H. Direct Labeling MicroRNA with an Electrocatalytic Moiety and Its Application in Ultrasensitive MicroRNA Assays. Biosens. Bioelectron. 2007, 22, 933–940. 10.1016/j.bios.2006.04.020. [DOI] [PubMed] [Google Scholar]
- Singh A.; Sinsinbar G.; Choudhary M.; Kumar V.; Pasricha R.; Verma H. N.; Singh S. P.; Arora K. Graphene Oxide-Chitosan Nanocomposite Based Electrochemical DNA Biosensor for Detection of Typhoid. Sens. Actuators, B 2013, 185, 675–684. 10.1016/j.snb.2013.05.014. [DOI] [Google Scholar]
- Nicholson M. M. Diffusion Currents at Cylindrical Electrodes. A Study of Organic Sulfides. J. Am. Chem. Soc. 1954, 76, 2539–2545. 10.1021/ja01638a072. [DOI] [Google Scholar]
- Dreyer D. R.; Park S.; Bielawski C. W.; Ruoff R. S. The Chemistry of Graphene Oxide. Chem. Soc. Rev. 2010, 39, 228–240. 10.1039/B917103G. [DOI] [PubMed] [Google Scholar]
- Randles J. E. B. A Cathode Ray Polarograph. Trans. Faraday Soc. 1948, 44, 322. 10.1039/tf9484400322. [DOI] [Google Scholar]
- Johnson R. R.; Johnson A. T. C.; Klein M. L. Probing the Structure of DNA–Carbon Nanotube Hybrids with Molecular Dynamics. Nano Lett. 2008, 8, 69–75. 10.1021/nl071909j. [DOI] [PubMed] [Google Scholar]
- Wang J.; Rivas G.; Cai X.; Palecek E.; Nielsen P.; Shiraishi H.; Dontha N.; Luo D.; Parrado C.; Chicharro M.; Farias P. A. M.; Valera F. S.; Grant D. H.; Ozsoz M.; Flair M. N. DNA Electrochemical Biosensors for Environmental Monitoring. A Review. Anal. Chim. Acta 1997, 347, 1–8. 10.1016/S0003-2670(96)00598-3. [DOI] [Google Scholar]
- Singh A.; Choudhary M.; Singh M. P.; Verma H. N.; Singh S. P.; Arora K. DNA Functionalized Direct Electro-Deposited Gold Nanoaggregates for Efficient Detection of Salmonella Typhi. Bioelectrochemistry 2015, 105, 7–15. 10.1016/j.bioelechem.2015.03.005. [DOI] [PubMed] [Google Scholar]
- Rafiee-Pour H.-A.; Behpour M.; Keshavarz M. A Novel Label-Free Electrochemical MiRNA Biosensor Using Methylene Blue as Redox Indicator: Application to Breast Cancer Biomarker MiRNA-21. Biosens. Bioelectron. 2016, 77, 202–207. 10.1016/j.bios.2015.09.025. [DOI] [PubMed] [Google Scholar]
- Jolly P.; Batistuti M. R.; Miodek A.; Zhurauski P.; Mulato M.; Lindsay M. A.; Estrela P. Highly Sensitive Dual Mode Electrochemical Platform for MicroRNA Detection. Sci. Rep. 2016, 6, 36719 10.1038/srep36719. [DOI] [PMC free article] [PubMed] [Google Scholar]
- Verma S.; Choudhary J.; Singh K. P.; Chandra P.; Singh S. P. Uricase Grafted Nanoconducting Matrix Based Electrochemical Biosensor for Ultrafast Uric Acid Detection in Human Serum Samples. Int. J. Biol. Macromol. 2019, 130, 333–341. 10.1016/j.ijbiomac.2019.02.121. [DOI] [PubMed] [Google Scholar]
- Benedito da Silva O.; Machado S. A. S. Evaluation of the Detection and Quantification Limits in Electroanalysis Using Two Popular Methods: Application in the Case Study of Paraquat Determination. Anal. Methods 2012, 4, 2348 10.1039/c2ay25111f. [DOI] [Google Scholar]
- Jindal A.; Basu S. Improvement in Electrocatalytic Activity of Oxygen Reduction Reaction of Electrospun Carbon Nitride/Polyacrylonitrile Nanofibers by Addition of Carbon Black and Nafion Fillers. Int. J. Hydrogen Energy 2016, 41, 11624–11633. 10.1016/j.ijhydene.2016.02.136. [DOI] [Google Scholar]
- Kwak J.; Bard A. J. Scanning Electrochemical Microscopy. Apparatus and Two-Dimensional Scans of Conductive and Insulating Substrates. Anal. Chem. 1989, 61, 1794–1799. 10.1021/ac00192a003. [DOI] [Google Scholar]
- Wipf D. O.; Bard A. J. Scanning Electrochemical Microscopy. J. Electrochem. Soc. 1991, 138, 469 10.1149/1.2085612. [DOI] [Google Scholar]
- Hernández-Santos D.; Díaz-González M.; González-García M. B.; Costa-García A. Enzymatic Genosensor on Streptavidin-Modified Screen-Printed Carbon Electrodes. Anal. Chem. 2004, 76, 6887–6893. 10.1021/ac048892z. [DOI] [PubMed] [Google Scholar]


