Abstract
Fibrous scaffolds have been extensively used in three-dimensional (3D) cell culture systems to establish in vitro models in cell biology, tissue engineering, and drug screening. It is a common practice to characterize cell behaviors on such scaffolds using confocal laser scanning microscopy (CLSM). As a noninvasive technology, CLSM images can be utilized to describe cell-scaffold interaction under varied morphological features, biomaterial composition, and internal structure. Unfortunately, such information has not been fully translated and delivered to researchers due to the lack of effective cell segmentation methods. We developed herein an end-to-end model called Aligned Disentangled Generative Adversarial Network (AD-GAN) for 3D unsupervised nuclei segmentation of CLSM images. AD-GAN utilizes representation disentanglement to separate content representation (the underlying nuclei spatial structure) from style representation (the rendering of the structure) and align the disentangled content in the latent space. The CLSM images collected from fibrous scaffold-based culturing A549, 3T3, and HeLa cells were utilized for nuclei segmentation study. Compared with existing commercial methods such as Squassh and CellProfiler, our AD-GAN can effectively and efficiently distinguish nuclei with the preserved shape and location information. Building on such information, we can rapidly screen cell-scaffold interaction in terms of adhesion, migration and proliferation, so as to improve scaffold design.
Keywords: Unsupervised learning, 3D nuclei segmentation, Aligned disentangled generative adversarial network, Fibrous scaffold-based cell culture, Cell-scaffold interaction
1. Introduction
Scaffold-based three-dimensional (3D) cell culture systems have gained great attention as a replacement of two-dimensional (2D) planar culture to mimic extracellular matrix environments[1]. Unlike the 2D environment, 3D cell culture makes cell-cell contacts in all dimensions to obtain oxygen and nutrition, all of which lead to more in vivo-like gene expression and cell behavior. Fibrous scaffolds have been extensively used in 3D cell culture systems to establish in vitro models in cell biology, tissue engineering, and drug screening[2]. It is a common practice to characterize cell behaviors on these scaffolds using confocal laser scanning microscopy (CLSM)[3]. This technology scans the whole models layer by layer to collect CLSM image volumes and then stack them together. As a noninvasive technology, CLSM images can not only visualize cell behaviors, but also reveal cell-scaffold interaction under varied morphological features, biomaterial composition and architectural structure. However, such information has not been fully translated and delivered to researchers, due to the complex nature of these images and the lack of effective analysis tools.
To quantitatively analyze the cell culture model in image-based cellular research, the first step is to extract individual cells or ellipsoids-like nuclei, that is, cell/nuclei segmentation[4]. As such, several rule-based methods have been developed, which commonly apply visual features to discriminate regions-of-interest on microscopy images. For example, a global threshold is utilized to determine if one individual image pixel is an object or not. This approach is easy to implement but fails to tackle noisy images or de-convolute clustered nuclei[5,6]. Meanwhile, how to extract and select features is always arguable[7]. Marker-based watershed segmentation is capable of separating cells, but the relevant marker detection highly depends on parameter selection[8,9]. Standard edge-detection algorithms can only discriminate the lateral boundaries under low cell density[10]. Despite the great interest and expectation from the research community on these rule-based methods, they are not scalable when analyzing a large number of cells[11], or clustered cells with weak boundary gradients. To meet the growing demand from biological image analysis, some stand-alone commercial software has been developed to segment nuclei such as CellProfiler[12] and Squassh[13] in ImageJ. In general, they are convenient to use but lack of flexibility when dealing with 3D segmentation applications.
Over the past decade, machine learning (ML) has been introduced to segment CLSM images and has demonstrated state-of-the-art performance under varied image resolution, signal-to-noise ratio, contrast, and background[14,15]. Supervised ML-based nuclei segmentation methods consist of three key elements: derived staining patterns, extracted features of nuclei morphology, and annotated training data. The current bottleneck of applying such methods lies in the expensive and tedious process of appropriate annotating thousands of nuclei with irregular or deformed shapes as training data. Particularly, the poor Z axial resolution of CLSM images causes difficulties and defects when delineating the top and bottom boundaries of nuclei[16].
To deal with this dilemma, unsupervised ML methods have been introduced for nuclei segmentation. Unsupervised methods can learn relatively consistent pattern from large scale of data without expensive annotation and personal bias. They can make use of prior knowledge from human beings at abstract level, which may be closer to the essence of learning. Thus, unsupervised methods with appropriate prior knowledge can obviously minimize the influence from the poor Z-axis resolution, in comparison with supervised ML methods using concrete annotation. Liu et al.[17] took advantages of unsupervised domain adaptation (UDA) to transfer knowledge of nuclei segmentation from fluorescence microscopy images to histopathology images. However, this UDA requires labeled fluorescence microscopy images. Generative adversarial network (GAN) has also been introduced to label images, where a generator and a discriminator are trained to compete against each other. The former learns to create images that look real, and the latter learns to distinguish real or fake images. Hou et al.[18] proposed a GAN-based method to refine synthetic histopathology nuclei images. The pairs of the refined synthetic nuclei images and the corresponding masks were used to train a task-specific segmentation model, which is too complicated for practical applications. In most cases, translating images cross domains requires datasets with paired information, which may not be available in real-world applications. To enforce stronger cross-domain connection, Dunn et al.[16] proposed a cycle-consistent adversarial network (CycleGAN) to translate the synthetic semantic label maps from mask style to fluorescence microscopy image style and use the pairs for training a segmentation model. Unfortunately, this CycleGAN cannot achieve one-to-one nuclei mapping between the images and corresponding masks.
Content and style are the two most inherent attributes to characterize nuclei visually. Recent achievement shows that disentangling content and style representations in image-to-image translation can significantly improve GAN’s performance. Yang et al.[19] applied this technology to attain cross-modality domain adaptation between computed tomography and magnetic resonance imaging images using a shared content space. Inspired by this idea, we apply this disentanglement technology to align the domains’ content representation under a novel end-to-end model, called Aligned Disentangling GAN (AD-GAN). As shown in Figure 1, two style representations are involved in this AD-GAN model with different structure rendering, that is, image and mask. This AD-GAN can extract content and style representation from CLSM image separately. As a result, CLSM images can be disentangled into content representation (underlying nuclei spatial structure) and image style (rendering of the structure). As shown on the right side of Figure 1, the same content representation can be entangled with mask style as the output of this AD-GAN model, that is, nuclei segmentation results. Meanwhile, spatial structure (the shape and position information of nuclei) is preserved with content consistency during this image-to-mask translation.
Figure 1.
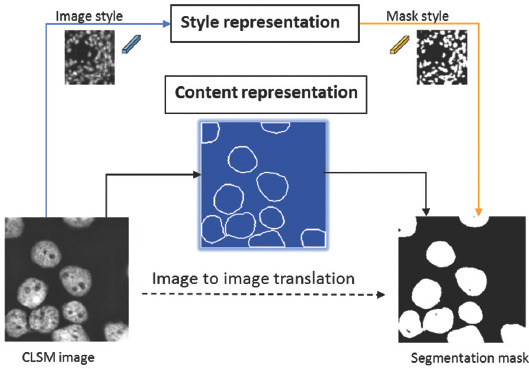
Principle of nuclei segmentation using aligned disentangled generative adversarial network.
The overall flow of this paper is organized as follows. The relevant methods are discussed in Section 2, including CLSM image collection in fibrous scaffold-based cell culture, overview of AD-GAN, its training strategy and loss function. Section 3 covers the performance comparison of the segmentation methods including AD-GAN, CycleGAN, Squassh, and CellProfiler under low/high cell density or cross cell lines. Cell adhesion and proliferation analysis based on the segmentation results are reported in Section 4. Finally, the conclusion and future work are set out in Section 5.
2. Methods
The workflow of cell-scaffold interaction analysis through nuclei segmentation is shown in Figure 2. The six-step procedure includes: (A-F): Scaffold-based cell culture process; (B) CLSM image collection in the cell culture process; (C) AD-GAN model training; (D) 3D nuclei segmentation results with position, size and shape information; (E) cell-scaffold interaction analysis using heat map produced by segmented nuclei; (F) scaffold design revision. Figure 2(E) is obtained by projecting all the center point of segmented nuclei from step (D) on the XY plane, and demonstrates nuclei density distribution using the brightness of red color. To further clarify the procedure, two key steps, i.e., CLSM image collection and nuclei segmentation are described as follows.
Figure 2.
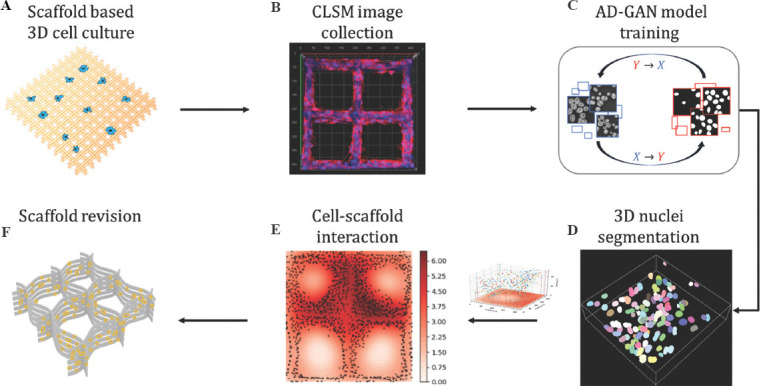
(A-F) Schematic diagram of cell-scaffold interaction analysis using nuclei segmentation.
2.1. CLSM image collection from fibrous scaffold-based cell culture
CLSM images collected from three types of fibrous scaffolds are utilized for cell segmentation study: Poly-E-caprolactone (PCL) scaffolds and two types of surface engineered nanoporous scaffolds, namely, PCL-10-D and PCL-20-D[21]. The schematic diagram of scaffold with fiber stacking structure is shown in (Figure 3A), the scanning electron microscope (SEM) image of the overall fibrous PCL scaffold structure is shown in (Figure 3B), and the cross-section of fiber stacking is shown in (Figure 3C). It can be seen that the pores of the scaffold are uniformly distributed within the structure, and fibers are well oriented and orderly stacked in a layer-by-layer manner. The SEM images of PCL-10-D and PCL-20-D are almost the same as those of PCL scaffolds. The overall thickness of these 12-layer scaffolds is between 110 µm and 127 µm, with an average fiber diameter of around 10 µm. Meanwhile, they have varied surface morphology. The fiber surface of the PCL scaffolds is smooth (Figure 3D), the PCL-10-D scaffold surface is covered by nanopits with an average size of 133.1 ± 47.4 nm (Figure 3E), and the PCL-20-D scaffold surface is covered by much larger nanopits and nanogrooves with lengths ranging from a few hundred nanometers to a few microns (Figure 3F).
Figure 3.
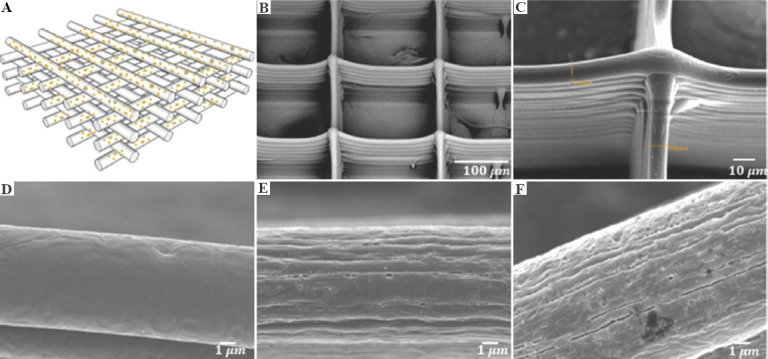
(A) Schematic diagram of scaffold with fiber stacking structure. (B) scanning electron microscope images of overall fibrous scaffold structure. (C) Cross-section of fiber stacking. (D-F) Fiber surface morphology of poly-E-caprolactone (PCL), PCL-10-D and PCL-20-D scaffold, respectively. Figure 3(A)-(D) are original images, and Figure 3(E) and (F) are adapted from ref.[20] licensed under Creative Commons Attribution-NonCommercial-NoDerivatives 4.0 International (CC BY-NC-ND 4.0), https://creativecommons.org/licenses/by-nc-nd/4.0.
These scaffolds are used to culture NIH-3T3 mouse embryonic fibroblast cells, A549 human non-small cell lung cancer cells and HeLa cells. The nuclei and membrane of the three cell lines are stained with Hoechst 33342 (blue) and DiI (red) for CLSM imaging. The living-image of cell-seeded scaffolds after fluorescent staining are taken by CLSM (LSM-880, ZEISS, Germany) with an EC Plan-Neofluar 20X/0.5 air immersion objective. The CLSM images are compiled using Z-stack mode by ZEN software, and reconstructed using Imaris software (Bitplane Inc). The collected CLSM images have been resized to 512×512×64 voxels by spatial normalization to remove redundant information (data available at: https://github.com/Kaiseem/Scaffold-A549). The processed images are split into 16 image patches with the size of 128×128×64 voxels as the inputs of AD-GAN model.
2.2. AD-GAN method and training strategy
Unsupervised nuclei segmentation can be considered an image-to-image translation task as shown in Figure 4, where the inputs are the grayscale CLSM images, and the output images are the segmentation results. Our AD-GAN model is essentially designed to deal with two domains: domain A with image style including input image, reconstructed image and cyclic image, and domain B with mask style including input mask, reconstructed mask and fake mask. The synthetic mask is generated by non-overlapping ellipsoid structures with random rotations and translations, which would stimulate the developed AD-GAN model to output non-overlapping 3D nuclei. The probability of rotating directions of ellipsoids is assumed the same in all directions to mimic real nuclei, which encourages the AD-GAN model to map Z-axis elongated nuclei caused by light diffraction and scattering in real CLSM images to the ellipsoids in the synthetic masks. To achieve one-to-one mapping between real images and synthetic masks, the proposed AD-GAN training includes both same-domain translation (image-to-image and mask-to-mask) and cross-domain translation (image-to-mask and mask-to-image) as shown in (Figure 4B). A single GAN-based auto-encoder is designed to build a bidirectional mapping between each real image and the corresponding content representation in the shared content space.
Figure 4.
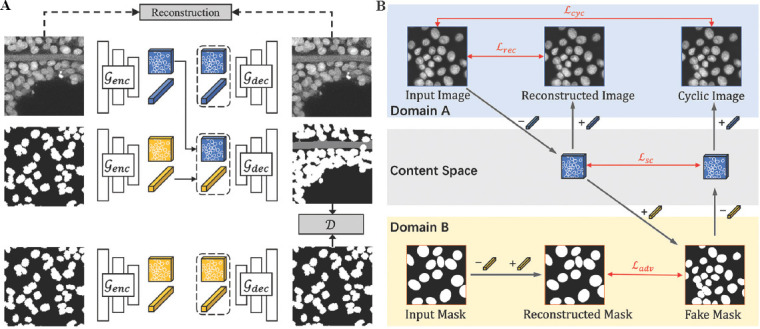
(A and B) Our Aligned Disentangled Generative Adversarial Network model consists of same-domain translation (top and bottom) and cross-domain translation (middle). The content representation ( ) is a tensor with spatial dimensions, while the style representation (
 ) is a learned vector by multilayer perceptron from domain label. During same-domain translation, the encoder genc embeds an input into the shared content space and the decoder gdec reconstructs the content to image. Cross-domain translation is performed by swapping content representation.
Our proposed AD-GAN model consists of a unified conditional generator and a PatchGAN discriminator D, both of which use 3D convolutional layers. As shown in (Figure 4A), the designed generator in each domain contains two parts: an encoder (ꞔenc) which encodes the input volume to content representation, and a decoder (ꞔdec) which reconstructs the content representation to the output volume. In the same-domain translation, the generator is trained to extract useful information by auto-encoding. In the cross-domain translation, the decoder ꞔdec is frozen and the encoder ꞔenc is trained to generate fake images to fool the discriminator by aligning the content for each domain. The encoder contains two down-sampling modules and four ResNet blocks, and the decoder has a symmetric architecture with four ResNet blocks and two up-sampling modules. Both the encoder and decoder are equipped with Adaptive Instance Normalization layers to integrate the style representations, which are generated from domain labels through a multilayer perceptron. A single style representation is assigned for each domain using one-hot domain labels. Therefore, we can disentangle content representations (underlying spatial structure) from styles (rendering of the structure) under specific domain.
The PatchGAN discriminator in this AD-GAN model can identify the inputs’ domain and their verisimilitude, that is, the reconstructed images (microscopy images or synthetic masks) or generated fake images. Rather than defining a global discriminator network, this discriminator can classify local image patches and force the generator to learn local properties in real CLSM images or synthetic masks. ADAM solver[22] is used to train the model from scratch with a learning rate of 0.0002. As empirically tuned in the experiments, the learning rate keeps consistent for the first 100 epochs and linearly decays to zero over the next 100 epochs. Common data augmentation, including random crop, random rotations are applied to avoid overfitting.
The loss function in AD-GAN contains four terms: reconstructed loss Lrec, cycle-consistency loss Lcyc, semantic consistency loss Lsc, and adversarial loss Ladv. Lrec measures the difference between the original inputs and reconstructed outputs in the same-domain translation so as to extract useful features. Lcyc measures the consistency between the original inputs and cycled outputs so as to keep the transferred content in unpaired image-to-image translation. Lsc measures the difference of the disentangled features between the original inputs and transferred images in the content space. To keep more low frequency details, Mean Absolute Error is used to calculate the above three losses. The domain discriminator loss Ladv is to measure the verisimilitude of the reconstructed images/masks and generated fake images/masks. The loss function is defined as Equation 1.

where λsc, λcyc and λrec are used to adjust the importance of each term.
During training, we followed the setting in CycleGAN[23] and used LSGANs[24] to stabilize the training. We randomly cropped the original volumes with size of 64 × 64 × 64, and train the model with the batch size of 4. With this novel training strategy, the proposed AD-GAN model can readily align the disentangled content representation of the two domains in one latent space.
3. Segmentation results and discussion
Several commercial software with numerous tutorials is available to segment/analyze nuclei in cell aggregation, spheroids and organoids. The most well-known 3D nuclei segmentation tools are Cellprofiler 3.0, and Squassh in ImageJ. Their specific image processing pipeline/steps/approach can be incorporated into 3D segmentation workflows based on user needs. Accordingly, we have decided to include them for both visual and quantitative comparison in this study. The relevant parameters were set either using default or optimal settings to the best of our ability. The direct output from CellProfiler and Squassh were the segmented nuclei instances.
3.1. Segmentation methods in comparison
To benchmark the nuclei segmentation performance, the AD-GAN was compared with CycleGAN, and Squassh in ImageJ and CellProfiler 3.0. In CellProfiler, functional modules were arranged into specific “pipelines” to identify cells and their morphological features. We corrected the illumination of CLSM images by a sliding window, and then applied the “MedianFilter” to remove artifacts within the images, the “RescaleIntensity” to reduce the image variation among batches, and the “Erosion” to generate markers for the “Watershed” module.
Squassh can globally segment 3D objects with constant internal intensity by regulating three parameters “Rolling ball window size,” “Regularization parameter,” and “Minimum object intensity.” To produce visually optimal segmentation results, these parameters were adjusted independently to subtract an object within the window from the background, avoid segmenting noise-induced small intensity peaks and force object separation.
CycleGAN was adapted from the official code 2 by replacing 2D convolutional layers with 3D convolutional layers for this task. Half of the default channels in the intermediate layers were kept for memory saving and redundancy reduction. The ResNet with 9 blocks was chosen as the generator architecture and the receptive field of the discriminator was reduced to 16 × 16 × 16 to improve translation performance.
Our AD-GAN model (code is available at: https://github.com/Kaiseem/AD-GAN) was built with open-source software library PyTorch 1.4.0 on a workstation with one NVIDIA GeForce RTX 2080Ti GPU. The training process took 9 – 11 min per epoch, and the segmentation of an unseen image took <1 s. The direct outputs of CycleGAN or AD-GAN were semantic segmentation results, thus a post-process using OpenCV library was applied to obtain segmented nuclei instances. Specifically, the morphological erosion with a cube of 3 × 3 × 3 voxel could filter noises or very small instances. The erosion results could serve as markers for the watershed algorithm to separate the clustered nuclei into instances, and the binarized outputs were the segmented nuclei.
(1) Comparison of performance under low cell density
An original CLSM image with low cell density is shown in (Figure 5A) and its grayscale image is shown in Figure S1 (452.5KB, pdf) , which demonstrates the initial stage of scaffold-based cell culture. Both of them were generated using Mayavi2 by maximum intensity projection. In (Figure 5A), it is hard to identify nuclei boundaries for cells adhered on the scaffold fibers. The corresponding 2D slices at the depth of 8 μm, 24 μm and 40 μm below the surface of the scaffold are shown in the first column of Figure 6.
Figure 5.
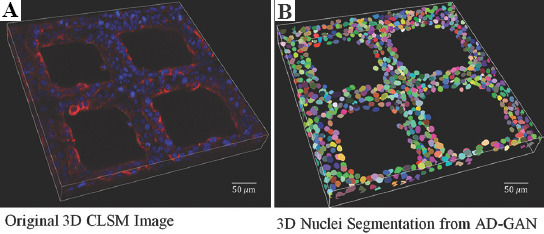
(A and B) Confocal laser scanning microscopy image and 3D nuclei segmentation under lower cell density when culturing at day 1 using A549.
Figure 6.
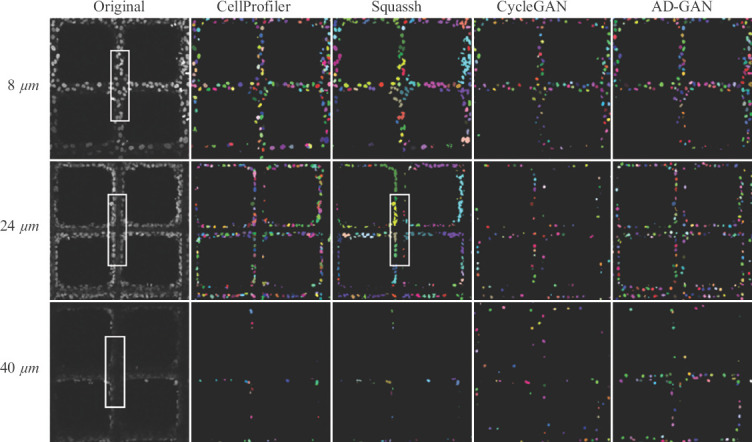
Comparison of segmentation performance from Squassh, Cellprofiler, CycleGAN and AD-GAN under low cell density when culturing at day 1 using A549. Grayscale CLSM images with low cell density collected from different depths of the volume are shown in the first column. Segmentation results from the four methods are shown in column. Different colors are used to discriminate individual nuclei.
As indicated by the white rectangle box, cells were observed to adhere on top of the fibers at 8 μm, and on the fiber side walls at 24 μm. This indicates that cells can attach to the varied fiber surface. Only a small amount of blurred nuclei could be observed at the depth of 40 μm since the laser scanning capability of CLSM was seriously blocked by non-transparent fiber and cell cluster[25]. Obviously, most of existing imaging technologies and protocols originally designed for 2D culture systems are insufficient to visualize 3D cell culture model at deeper depth, and technologies with more powerful 3D visualization capabilities are expected.
To demonstrate the 3D segmentation results more comprehensively, the outputs of the AD-GAN model with volume renderings are shown in (Figure 5B), and the corresponding results from CellProfiler, CycleGAN, and Squassh are shown in Figure S2 (452.5KB, pdf) -S4 (452.5KB, pdf) , respectively. The slices of these results at the depth of 8 μm, 24 μm, and 40 μm are shown in Figure 6. A demonstration about the nuclei segmentation process using AD-GAN is shown in the supplementary video, which consists of an original CLSM image with low cell density, its grayscale image and the segmented 3D nuclei results.
The segmentation results obtained from CellProfiler and CycleGAN at 8 μm and 24 μm look similar in two dimensions. In 3D visualization as shown in Figure S2 (452.5KB, pdf) and S4 (452.5KB, pdf) , CellProfiler tended to identify elongated nuclei. This is probably attributed to Otsu threshold used in CellProfiler, which can only distinguish nuclei from the foreground and background, but not the shadow above or below. Using Squassh, adjacent nuclei were found to be segmented as one object at the depth of 8 μm. Therefore, the size of segmented nuclei was obviously larger than those identified by the other methods. More often, cells adhered on the scaffold fibers led to more geometrically complex scenarios. As indicated by the white rectangle box under the third column, Squassh could not identify nuclei along the fiber edge at the depth of 24 μm. Indeed, the existence of fibers had significantly lowered the nuclei segmentation performance. CycleGAN tended to learn one-to-one mapping at image-level instead of object-level. Consequently, nuclei addition/deletion, position offset and unmatched shape could be widely found in its segmentation results as shown in Figure S4 (452.5KB, pdf) and the fourth column in Figure 6.
Compared with the grayscale image in Figure S1 (452.5KB, pdf) , the proposed AD-GAN could retrieve most of the nuclei with the correct positions and shapes. It also outperformd when identifying multiple nuclei shapes within an image, which are difficult to define using mathematical models.
(2) Comparison of performance under high cell density
With the increase of cell culture time, cells migrate, proliferate and form some kind of sheet or circular structure within the cavity of the scaffolds, indicating an improved cell-scaffold interaction. The 3D CLSM image under high cell density is shown in (Figure 7A) and its grayscale image is shown in Figure S5 (452.5KB, pdf) . Under higher cell densities, the outputs of the AD-GAN model with volume renderings are shown in (Figure 7B). Their 2D slices at the depth of 8 μm, 24 μm and 40 μm below the surface of the scaffold are shown in the first column of Figure 8. Similar to the situation under low cell density, only a very small amount of nuclei was captured at the depth of 40 μm. The segmented nuclei in (Figure 7B) looked visually close to those in Figure S5 (452.5KB, pdf) . Moreover, AD-GAN could identify multiple nuclei which are spatially close in dense cell regions. The corresponding segmentation results from CellProfiler, Squassh and CycleGAN are shown in Figure S6 (452.5KB, pdf) -S8 (452.5KB, pdf) .
Figure 7.
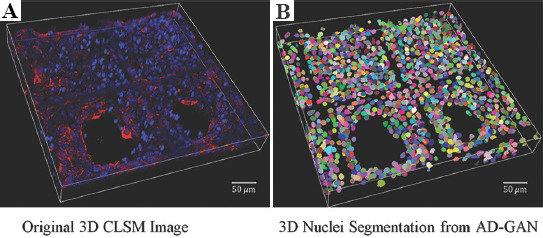
(A and B) Confocal laser scanning microscopy image and 3D nuclei segmentation under higher cell density when culturing at day 3 using A549.
Figure 8.
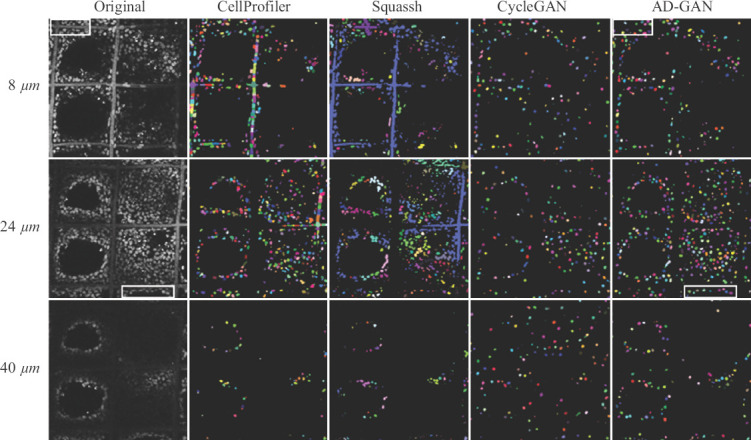
Comparison of segmentation performance from Squassh, Cellprofiler, cycle-consistent adversarial network and Aligned Disentangled Generative Adversarial Network under high cell density when culturing at day 1 using A549. Grayscale confocal laser scanning microscopy images with low cell density collected from different depths of the volume are shown in the left column. Segmentation results from the four methods are shown in column 2 to 5. Different colors are used to discriminate individual nuclei.
Different from the results under low cell density, Cellprofiler identified some portion of fibers as nuclei at the depth of 8 μm and 24 μm under high cell density. The segmentation results became even worse when using Squassh. A large portion of straight fibers were identified as nuclei indicated by blue curves. On the other hand, CycleGAN led to a large amount of nuclei addition/deletion, position offset and unmatched shapes at all depths as shown in the fourth column of Figure 8 and Figure S8 (452.5KB, pdf) . Under the higher cell density, the AD-GAN could retrieve nuclei from the CLSM images, even in the corner region as indicated by the white rectangle box. It seems that the inhomogeneity of microscopy images does not cause obvious negative effects in nuclei segmentation. Even at the depth of 40 μm, the captured nuclei could be segmented as shown in the last column of Figure 8.
(3) Evaluation of AD-GAN segmentation model across cell lines
Nuclei shape and cellular morphology vary among cell types. The majority of attached epithelial A549 cancer cells were prone to gather together and formed cell clusters that were partially adhered on the fiber surface, and then elongated along the fiber directions. When seeding fibroblast cell NIH-3T3, some of them partially adhered on fibers and their cellular skeleton assembled into an annular structure and interwove within the pores[21]. NIH-3T3 cells could grow indefinitely and show spindle-shaped and multilayered during transformation. In addition, different cell experiment protocols may generate morphological characteristics with varied noise, background, contrast and resolution. A generic segmentation method is capable of coping with such scenario. To verify the proposed AD-GAN method, the model was trained and tested using CLSM images from the same cell lines or different cell lines. We also tested the generic performance of this method using unseen data from the HeLa cell line.
(Figure 9A-C) are grayscale CLSM images of A549, NIH-3T3 and HeLa cell line cultured on fibrous scaffolds, respectively, and (Figure 9D-F) are their enlarged volume patch. (Figure 9G) and (Figure 9J) show the segmentation performance of A549 in (Figure 9D), when the model was trained using A549 or NIH-3T3 cell line. To test the generalization performance of AD-GAN method cross cell lines, (Figure 9G and J) were paired for comparison. Similarly, (Figure 9H and K), the segmentation results of (Figure 9E) were paired for comparison, where the model was trained using A549 and NIH-3T3 cell line correspondingly. (Figure 9I and L), the segmentation results of (Figure 9F), were also paired for comparison.
Figure 9.
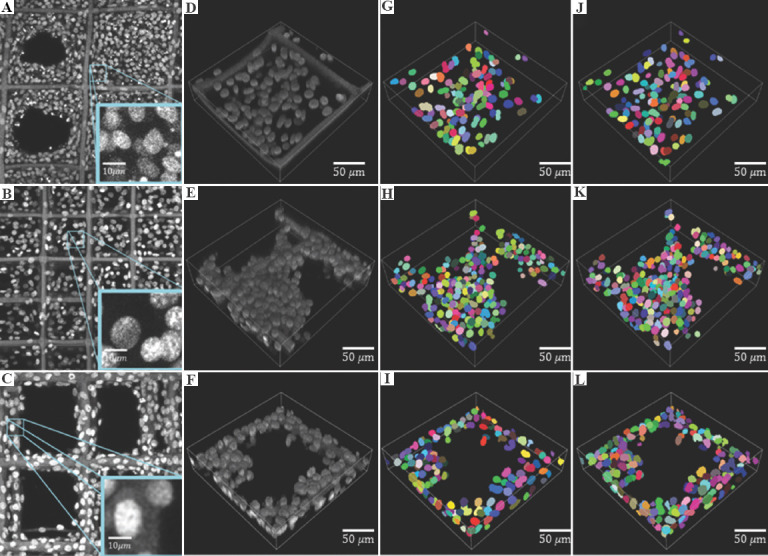
Segmentation performance comparison cross cell lines. (A-C) Grayscale confocal laser scanning microscopy images of A549, NIH-3T3 and HeLa cells cultured on scaffolds, respectively. (D-F) 3D nuclei of A549, NIH-3T3 and HeLa. (G-I) Segmentation results of (D), (E) and (F) using the Aligned Disentangled Generative Adversarial Network (AD-GAN) model trained with A549 cell lines. (J-L): Segmentation results of (D), (E) and (F) using the AD-GAN model trained with NIH-3T3.
A high visual similarity was reported between (Figure 9G and J), between (Figure 9H) and (K), and between (Figure 9I and L). This indicates that the AD-GAN performed well in segmenting nuclei in CLSM images from unseen cell lines, when the nuclei had similar visual properties on distribution, size and morphology. In other words, this method can capture nuclei based on general properties rather than specifics.
3.2. Quantitative measurement of segmentation performance
To quantitatively measure segmentation performance, a testing dataset was prepared by manually labeling a full volume of CLSM image (512 × 512 × 64 voxel). This volume with a relatively smaller number of nuclei was annotated slice-by-slice from axial, sagittal and coronal views by three expert users. The final annotation was determined by comparing the average of the manual-labeled annotations with a threshold of 0.5. In general, the three expert users achieved similar accuracy in their manual annotation.
To prepare a training dataset, 20 CLSM images from culturing A549 cells were collected and each image was divided into 16 patches. This generated 320 cropped images in total for training. Most voxels in CLSM images were background and its numbers were much more than that of the voxels of foreground, which caused imbalanced data distribution. Thus, the commonly used voxel-based metrics such as voxel-based accuracy, Type-I and Type-II become distorted in training and testing[3,4]. To better reflect the classification accuracy, the segmentation performance was measured using precision, recall and DICE[26,27]. In this study, the segmentation performance was measured using precision, recall and DICE, which are defined as Equation (2).

where NTP, NFP, and NFN are defined as the number of true-positive segmented samples, false-positive segmented samples (voxels wrongly detected as nuclei), and false-negative segmented samples (voxels wrongly detected as background), respectively. For example, wrongly identified nuclei may increase NFP, and nuclei with poor staining may lead to the increase of NFN. In general, larger precision and recall indicate accurate segmentation, and larger DICE indicates better similarity between the ground truth and the segmentation results.
The quantitative evaluation results among the different segmentation methods are listed in Table 1 based on the fully annotated testing dataset. We believe the size and diversity of this dataset is sufficient to reflect the performance of different segmentation models. As shown in Table 1, CellProfiler achieved the highest recall (91.3%), but the poorest precision (37.5%). This is because the shadow regions along Z axis were detected as the nuclei. Squassh also achieved good recall but low precision, since the segmented objects consisted of connected nuclei or fibers. A takeaway from this is that Squassh or CellProfiler generally suffers from low performance in analyzing CLSM images consisting of scaffold fibers. Besides, hours of effort in image preprocessing and parameter setting cannot improve their global segmentation performance.
Table 1.
Segmentation results comparison on A549 scaffold-based cell culture images
| Methods | Precision (%) | Recall (%) | DICE (%) |
|---|---|---|---|
| CellProfiler | 37.5 | 91.3 | 53.1 |
| Squassh | 51.7 | 78.6 | 62.3 |
| CycleGAN | 53.9 | 41.7 | 47.0 |
| AD-GAN | 89.0 | 78.2 | 83.3 |
The DICE of CycleGAN was only 47.0%, due to the inconsistent mapping of nuclei between the CLSM image and synthetic mask. With the minimum effort on parameter tuning, our AD-GAN method performed well with precision (89%), accuracy (78.2%) and DICE (83.3%), reflecting its better capability in identifying nuclei in CLSM images. Moreover, the majority of the identified nuclei are true-positive samples.
3.3. Segmentation performance in 2D CLSM images
Our AD-GAN method can also be applied to segment nuclei in 2D CLSM images by replacing the 3D convolutional layers with 2D. This is tested using the recently released public dataset HaCaT[28]. This dataset with highly over-lapping nuclei and partially invisible borders had been annotated by biological and annotation experts. It consists of 26 training images and 15 test images with human keratinocyte cell line.
The visualization of a HaCaT raw image, the corresponding ground truth and the prediction of AD-GAN are shown in Figure 10. As reported by Kromp et al.[28], the biological experts obtained DICE 93.2% and annotation experts obtained DICE (89.2%) when annotating this dataset. As an unsupervised method, our AD-GAN achieved precision 85.4%, recall 95.2% and DICE 89.3%, which are close to the human expert recognition capability. Hence, we can conclude the proposed AD-GAN can replace manual annotation with performance similar to human experts.
Figure 10.

Visualization of (A) HaCaT raw image, (B) the corresponding ground truth, and (C) the prediction of Aligned Disentangled Generative Adversarial Network.
4. Cell adhesion and proliferation analysis using segmented nuclei
Researchers have reported that the cell adhesion, proliferation and migration heavily depend on scaffold pore size, surface morphology, biomaterials and internal structure[29]. The cell attachment rate lowers with increasing pore size, while relatively larger pore size may improve cell migration and proliferation[30]. Meanwhile, the preferred pore size is highly cell-dependent. Pore sizes of 30 – 80 μm were reported as an optimal choice for endothelial cell adhesion in porous silicon nitride scaffolds, but fibroblasts usually preferred larger pores[31]. In an effort to reconcile the conflicting reports, it is important to evaluate cell-scaffold interaction with convincing evidence.
Besides, multiple factors are involved in scaffold design such as material composition, surface roughness and internal structures. To clarify their influences on cell culture, automated nuclei segmentation is a prerequisite, which is particularly pronounced in the stage of scaffold design. Consequently, the information of nuclei number, size and position can be collected to analyze scaffold design. In this study, we used segmented nuclei from 3D CLSM images to explore how scaffold properties can modulate cell adhesion, proliferation and migration in a computational manner. This provides a rapid screening method to analyze cell-scaffold interaction.
4.1. A549 cell adhesion and proliferation analysis
Figure 11A and B demonstrate CLSM images of A549 cell cultured on PCL-10-D scaffold on day 1 and 3. The positions and size information were identified and plotted using black dots as the heatmap, as shown in (Figure 11C and D). The nuclei density distribution provides visual cues about cell proliferation over time within the scaffold structure. As expected, a very low nuclei density was identified on day 1 and most of the nuclei gathered close to fiber structures. In (Figure 11D), higher nuclei density was observed after 3 days’ culture and many nuclei were identified close to fiber surface. Besides, the majority of nuclei were closely packed together, which means strong cell-cell interaction within this scaffold. The number of nuclei under varied size on PCL-10-D on day 1 and day 3 is plotted in (Figure 12A) using blue and orange column. The area below the orange or blue dot line represents the overall number of nuclei on day 1 and day 3, respectively. In total, 522 nuclei were identified on the PCL-10-D scaffold on day 1, and this number increased to 1439 on day 3. This result indicates that nanoporous fiber surface on PCL-10-D can facilitate the adhesion, migration and proliferation of A549 cells efficiently.
Figure 11.

A549 cell adhesion and proliferation analysis on poly-E-caprolactone-10-D scaffold. (A and B) confocal laser scanning microscopy images of cell culture A549 on day 1 and 3. (C and D) Heat map of cell distribution on day 1 and 3.
Figure 12.
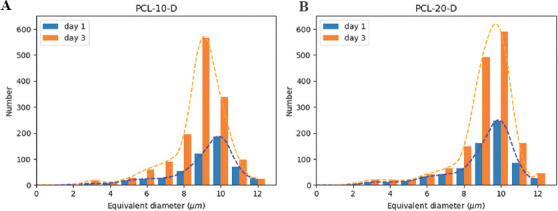
Nuclei size and number of A549 under varied surface nanotopography on day 1 and 3. (A) poly-E-caprolactone (PCL)-10-D scaffold. (B) PCL-20-D scaffold.
To study cell adhesion under varied morphology, CLSM images collected from two types of surfaces engineered nanoporous scaffolds (PCL-10-D and PCL-20-D) were compared. The number of nuclei on PCL-20-D on day 1 and day 3 is plotted in (Figure 12B) according to their size. For the PCL-20-D scaffold with larger nanopits and nanogrooves, 710 nuclei were identified on day 1 and 1623 on day 3. Indeed, more cells could to adhere PCL-20- D scaffold than that to PCL-10-D scaffold under the same cell seeding condition on day 1. It is also noticeable that the cell proliferation rate on PCL-10-D was almost 20% faster than that on PCL-20-D scaffold. These results are slightly different from the reported living cells analysis using the colorimetric method[32]. This is probably because the CLSM images used in the current analysis only come from part of the scaffold. More CLSM images reflecting the whole scaffold-based cell culture status are expected for comprehensive analysis.
This nuclei size in Figure 12 was estimated by transforming the voxel value within the 3D segmented nuclei to a spheroid volume. Note that the nuclei with the size around 2−3 μm mostly likely are fragment, and should be clipped to prevent further analysis from becoming skewed by such outliers. Under 95% confidence, the average nuclei size on day 1 is about 9.22 μm on PCL-10-D and 9.18 μm on PCL-20-D scaffolds. This corresponds to the reported cell diameter of A459 which is about 10.59 μm from transmission electron microscopy images[33]. Besides, no obvious size difference was identified under varied surface morphology during cell adhesion on day 1.
On day 3, the difference of the average nuclei size was less than 4% when culturing on the PCL-10-D and PCL-20-D scaffolds. It is worth mentioning that more nuclei with the size of 10 μm were observed on the PCL-20-D scaffold, and more nuclei with the size of 9 μm were observed on the PCL-10-D scaffold. The slightly larger nuclei size found on PCL-20-D scaffold may be induced by rougher surface. Overall, this quick screening method would facilitate scaffold design modification for better cell culture performance. Of course, further studies and more data are expected for detailed analysis.
4.2. NIH-3T3 cell proliferation analysis
CLSM images from culturing NIH-3T3 cells on PCL scaffold on days 3 and 6 as shown in (Figure 13A and B) were collected to study cell proliferation. Building on the segmentation results, the corresponding heat maps with nuclei density distribution are shown in (Figure 13C and D), respectively. Cells exhibited different proliferation and migration characteristics in the porous network with the pore size of 100 μm. On day 3, NIH-3T3 nuclei had proliferated along fibers and clustered in some pores. On day 6, the pores were fully filled with nuclei and there were no clear migration directions as in (Figure 13D), since NIH-3T3 cells used neighboring cells as support to cross pores. The number of nuclei under varied size is plotted in Figure 14. Although NIH-3T3 cells were of irregular size and difficult to count[34], the majority of nuclei were found ellipsoid with the size ranging 9-10 μm and the number of nuclei doubled from day 3 to day 6.
Figure 13.

NIH-3T3 cell proliferation analysis on poly-E-caprolactone scaffold with pore size of 100 μm. (A and B) confocal laser scanning microscopy images of cell culture on days 3 and 6. (C and D) Heatmap of cell distribution in (A) and (B).
Figure 14.
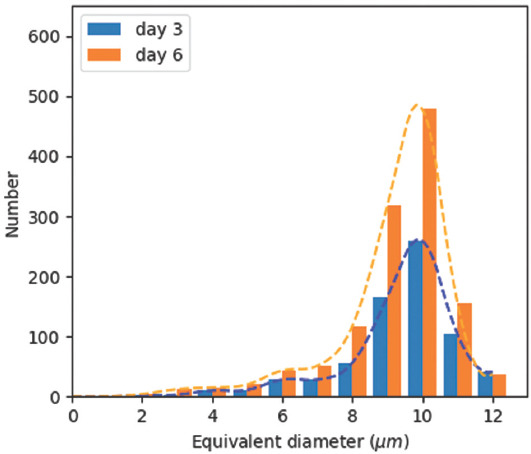
Nuclei size and number analysis of culturing NIH-3T3 on poly-E-caprolactone scaffold with pore size of 100 μm on days 3 and 6.
Fibrous scaffolds can be designed in terms of size, morphology, surface roughness and complexity. These factors can directly impact cell adhesion, proliferation and migration. A good balance between the diffusion of nutrients and removal of waste within the scaffold construct can lead to ideal cell proliferation and migration. The above analysis method provides an intuitive tool to optimize scaffold design for specific cell types and develop appropriate cell culture protocols.
5. Ongoing research issues and future perspectives
With the aid of the unsupervised ML method AD-GAN, we have successfully segmented nuclei and performed cell-scaffold interaction analysis using CLSM images from scaffold-based cell culture. Nevertheless, some ongoing issues need to be further researched.
5.1. CLSM image quality
The effective laser penetration in scaffolds is the key to obtaining high-quality CLSM images. To a large extent, the quality of collected CLSM images is determined by the level of the scaffolds’ transparency and optical uniform. The fabricated scaffolds’ porosity is usually around 80 – 90% with interconnected pores, while most of biopolymer materials used for fibrous scaffold fabrication such as PCL, are nontransparent. In addition, most of the scaffolds collected from the cell culture process have closely packed cell clusters. Thus, the CLSM technology can only visualize scaffold regions within a smaller depth and subsurface which are not obstructed by fibers or cell clusters. Cells in deeper pores of the scaffolds or below fibers are not visible. This may lower the effectiveness of nuclei segmentation and cell-scaffold interaction analysis. A possible solution is to develop transparent biopolymer scaffold materials for better CLSM visualization capability.
In addition, confocal microscopes have anisotropic spatial sampling frequency, which has particularly low resolution along Z-axis. One common workaround is to apply a simple trilinear interpolation for spatial normalization to ensure the same resolution of each axis. However, the normalized images more or less become blurry. More seriously, nuclei elongated along Z-axis by light diffraction and scattering, leading to an unexpected position offset in 3D voxels. Although the influence of biological components under the light scattering and refractive indexes has been studied[35], their impact on nuclei segmentation performance has not been fully explored.
5.2. Generalization performance of AD-GAN
Segmenting nuclei is typically the first step of any quantitative analysis in cell culture tasks. However, extracting subjective and quantitative nuclei information embedded in the enormous volume of CLSM images is challenging, particularly in scaffold-based cell culture. This study clarifies the capabilities and realistic expectations of different nuclei segmentation methods. For example, supervised ML models typically face a critical issue coming from insufficient training data and difficulties related to data annotation[36]. Our proposed unsupervised ML method has outperformed the available methods and demonstrated comparable capabilities to identify nuclei similar to that of human professionals. The method should also be tested using a larger database covering diverse cell lines and scaffold types.
The generalization of the AD-GAN model across different cell lines is limited by the nature of GAN, since GAN tends to overfit on training data distribution. When the properties of the testing data vary significantly, AD-GAN may fail to generate decent segmentation results. To improve the generalization performance under diverse cell lines, one way is to develop a multi-modal AD-GAN structure with a series model and each model can be directly trained under specific cell lines. Another possible way is to train multiple AD-GANs on different cell lines independently. When testing on an unseen cell line, the output of multiple AD-GANs shall be merged or fused. Moreover, a few aspects of our method should be further improved, such as network architecture, loss function design, and data augmentation strategies in synthetic mask generation. Last but not least, the very practical dilemma to most researchers is that they may not be familiar with ML or image processing methods. It is essential to develop a user-friendly interface so that researchers without expertise in image analysis and ML can incorporate 3D nuclei segmentation flow to perform nuclei classification and cell culture model analysis.
6. Conclusions and future perspectives
The desire to assess 3D culture models in a low-cost and rapid way is the driving force to investigate nuclei segmentation. In this study, we presented an unsupervised learning method AD-GAN to segment 3D nuclei labeled with fluorescent in CLSM images, which utilizes both same-domain translation and cross-domain translation to achieve one-to-one mapping between real nuclei images and synthetic masks (segmented nuclei). This method has been compared with some general-purpose image analysis software, such as Cellprofiler and Squassh for 3D nuclei segmentation, and achieves better performance in both visual and quantitative comparison. Of course, our purpose is not to rank these segmentation methods but to evaluate their suitability in cell segmentation using CLSM images with fiber structures. The segmented nuclei could help us to bridge the knowledge gap about cell activities within fibrous scaffolds. Building on the segmentation results, we can use the identified the nuclei number, size and position to assess cell adhesion and proliferation, and address cell-scaffold interaction in high-throughput 3D cell culture model. The segmented nuclei can serve as seeds to outline the entire cellular structure, and possibly associate with the locations of genomic and proteomic products for morphometry analysis of biological structures.
We would like to extend our method to analyze cell behaviors in spheroid, tumoroid, hydrogel scaffolds, organoids which can better recapitulate in vivo morphology, cell connectivity, polarity, gene expression and tissue architecture. This may open up new avenues to study cell behaviors in disease progression and drug release. Besides, we would explore segmentation tasks using complex image data derived from the microscopic imaging technology such as electron, light and X-ray to obtain more nuclei information in the near future.
Acknowledgments
This work was financially supported by Key Program Special Fund in Xi’an Jiaotong-Liverpool University under Grant KSF-E-37.
Appendix
Publisher’s note
Whioce Publishing remains neutral with regard to jurisdictional claims in published maps and institutional affiliations.
Conflict of interest
The authors declare that there is no conflict of interest.
Author contributions
K.Y., L.J., and H.L. designed the overall experimental plan and performed experiments. K.Y. interpreted data and wrote the manuscript with support from D.H. and K.H. J.S. supervised the project and conceived the original idea. All authors read and approved the manuscript.
References
- 1.Ravi M, Paramesh V, Kaviya SR, et al. 3D Cell Culture Systems:Advantages and Applications. J Cell Physiol. 2015;230:16–26. doi: 10.1002/jcp.24683. https://doi.org/10.1002/jcp.24683. [DOI] [PubMed] [Google Scholar]
- 2.Pampaloni F, Reynaud EG, Stelzer EH. The Third Dimension Bridges the Gap between Cell Culture and Live Tissue. Nat Rev Mol Cell Biol. 2007;8:839–45. doi: 10.1038/nrm2236. https://doi.org/10.1038/nrm2236. [DOI] [PubMed] [Google Scholar]
- 3.Paddock SW. Confocal Laser Scanning Microscopy. Biotechniques. 1999;27:992–1004. doi: 10.2144/99275ov01. https://doi.org/10.2144/99275ov01. [DOI] [PubMed] [Google Scholar]
- 4.Al-Kofahi Y, Zaltsman A, Graves R, et al. A Deep Learning-based Algorithm for 2-D Cell Segmentation in Microscopy Images. BMC Bioinformatics. 2018;19:1–11. doi: 10.1186/s12859-018-2375-z. [DOI] [PMC free article] [PubMed] [Google Scholar]
- 5.Vahadane A, Sethi A. Towards Generalized Nuclear Segmentation in Histological Images. 13th IEEE International Conference on Bioinformatics and Bioengineering. 2013:1–4. [Google Scholar]
- 6.Xue JH, Titterington DM. t-Tests, f-Tests and Otsu's methods for image thresholding. IEEE Trans Image Proc. 2011;20:2392–96. doi: 10.1109/TIP.2011.2114358. https://doi.org/10.1109/TIP.2011.2114358. [DOI] [PubMed] [Google Scholar]
- 7.Jie S, Hong GS, Rahman M, et al. Australian Joint Conference on Artificial Intelligence. Berlin, Heidelberg: Springer; 2002. Feature Extraction and Selection in tool Condition Monitoring System; pp. 487–497. [Google Scholar]
- 8.Veta M, Van Diest PJ, Kornegoor R, et al. Automatic Nuclei Segmentation in H&E Stained Breast Cancer Histopathology Images. PLoS One. 2013;8:e70221. doi: 10.1371/journal.pone.0070221. https://doi.org/10.1371/journal.pone.0070221. [DOI] [PMC free article] [PubMed] [Google Scholar]
- 9.Zhang C, Sun C, Pham TD. Segmentation of Clustered Nuclei Based on Concave Curve Expansion. J Microsc. 2013;251:57–67. doi: 10.1111/jmi.12043. https://doi.org/10.1111/jmi.12043. [DOI] [PubMed] [Google Scholar]
- 10.Xing F, Yang L. Robust Nucleus/Cell Detection and Segmentation in Digital Pathology and Microscopy Images:A Comprehensive Review. IEEE Rev Biomed Eng. 2016;9:234–63. doi: 10.1109/RBME.2016.2515127. https://doi.org/10.1109/RBME.2016.2515127. [DOI] [PMC free article] [PubMed] [Google Scholar]
- 11.Yang Z, Bogovic JA, Carass A, et al. Automatic Cell Segmentation in Fluorescence Images of Confluent Cell Monolayers Using Multi-object Geometric Deformable Model. Proc SPIE Int Soc Opt Eng. 2013;8669:2006603. doi: 10.1117/12.2006603. https://doi.org/10.1117/12.2006603. [DOI] [PMC free article] [PubMed] [Google Scholar]
- 12.McQuin C, Goodman A, Chernyshev V, et al. CellProfiler 3.0:Next-generation Image Processing for Biology. PLoS Biol. 2018;16:e2005970. doi: 10.1371/journal.pbio.2005970. https://doi.org/10.1371/journal.pbio.2005970. [DOI] [PMC free article] [PubMed] [Google Scholar]
- 13.Rizk A, Paul G, Incardona P, et al. Segmentation and Quantification of Subcellular Structures in Fluorescence Microscopy Images Using Squassh. Nat Protoc. 2014;9:6–596. doi: 10.1038/nprot.2014.037. https://doi.org/10.1038/nprot.2014.037. [DOI] [PubMed] [Google Scholar]
- 14.Kumar N, Verma R, Sharma S, et al. A Dataset and a Technique for Generalized Nuclear Segmentation for Computational Pathology. IEEE Trans Med Imaging. 2017;36:1550–60. doi: 10.1109/TMI.2017.2677499. [DOI] [PubMed] [Google Scholar]
- 15.Xing F, Xie Y, Yang L. An Automatic Learning-based Framework for Robust Nucleus Segmentation. IEEE Trans Med Imaging. 2015;35:550–66. doi: 10.1109/TMI.2015.2481436. [DOI] [PubMed] [Google Scholar]
- 16.Dunn KW, Fu C, Ho DJ, et al. DeepSynth:Three-dimensional Nuclear Segmentation of Biological Images Using Neural Networks Trained with Synthetic Data. Sci Rep. 2019;9:1–15. doi: 10.1038/s41598-019-54244-5. [DOI] [PMC free article] [PubMed] [Google Scholar]
- 17.Liu D, Zhang D, Song Y, et al. Unsupervised Instance Segmentation in Microscopy Images Via Panoptic Domain Adaptation and Task Re-weighting. Proceedings of the IEEE/CVF Conference on Computer Vision and Pattern Recognition. 2020:4243–4252. [Google Scholar]
- 18.Hou L, Agarwal A, Samaras D, et al. Robust Histopathology Image Analysis:To Label or to Synthesize? Proceedings of the IEEE/CVF Conference on Computer Vision and Pattern Recognition. 2019:8533–8542. doi: 10.1109/CVPR.2019.00873. [DOI] [PMC free article] [PubMed] [Google Scholar]
- 19.Yang J, Dvornek NC, Zhang F, et al. Unsupervised Domain Adaptation Via Disentangled Representations:Application to Cross-modality Liver Segmentation. International Conference on Medical Image Computing and Computer-Assisted Intervention. 2019:255–263. doi: 10.1007/978-3-030-32245-8_29. [DOI] [PMC free article] [PubMed] [Google Scholar]
- 20.Sun J, Jing L, Liu H, et al. Generating Nanotopography on PCL Microfiber Surface for Better Cell-Scaffold Interactions. Proc. Manufact. 2020;48:619–24. [Google Scholar]
- 21.Jing L, Wang X, Leng B, et al. Engineered Nanotopography on the Microfibers of 3D-Printed PCL Scaffolds to Modulate Cellular Responses and Establish an In Vitro Tumor Model. ACS Appl Biomater. 2021;4:1381–94. doi: 10.1021/acsabm.0c01243. [DOI] [PubMed] [Google Scholar]
- 22.Kingma DP, Ba J. Adam:A Method for Stochastic Optimization. arXiv. 2014;2014:6980. https://arxiv.org/abs/1412.6980. [Google Scholar]
- 23.Zhu JY, Park T, Isola P, et al. Unpaired Image-to-image Translation Using Cycle-consistent Adversarial Networks. Proceedings of the IEEE International Conference on Computer Vision. 2017:2223–32. [Google Scholar]
- 24.Mao X, Li Q, Xie H, et al. Least Squares Generative Adversarial Networks. Proceedings of the IEEE International Conference on Computer Vision. 2017:2794–802. [Google Scholar]
- 25.Boutin ME, Voss TC, Titus SA, et al. A High-throughput Imaging and Nuclear Segmentation Analysis Protocol for Cleared 3D Culture Models. Sci Rep. 2018;8:1–14. doi: 10.1038/s41598-018-29169-0. [DOI] [PMC free article] [PubMed] [Google Scholar]
- 26.Milletari F, Navab N, Ahmadi SA. V-net:Fully Convolutional Neural Networks for Volumetric Medical Image Segmentation. 2016 4th International Conference on 3D Vision. 2016:565–71. [Google Scholar]
- 27.Ker J, Wang L, Rao J, et al. Deep Learning Applications in Medical Image Analysis. IEEE Access. 2017;6:9375–89. [Google Scholar]
- 28.Kromp F, Bozsaky E, Rifatbegovic F, et al. An Annotated Fluorescence Image Dataset for Training Nuclear Segmentation Methods. Sci Data. 2020;7:1–8. doi: 10.1038/s41597-020-00608-w. [DOI] [PMC free article] [PubMed] [Google Scholar]
- 29.Sun J, Vijayavenkataraman S, Liu H. An Overview of Scaffold Design and Fabrication Technology for Engineered Knee Meniscus. Materials. 2017;10:29. doi: 10.3390/ma10010029. https://doi.org/10.3390/ma10010029. [DOI] [PMC free article] [PubMed] [Google Scholar]
- 30.Murphy MB, Blashki D, Buchanan RM, et al. Adult and Umbilical Cord Blood-derived Platelet-rich Plasma for Mesenchymal Stem Cell Proliferation, Chemotaxis, and Cryo-preservation. Biomaterials. 2012;33:5308–16. doi: 10.1016/j.biomaterials.2012.04.007. https://doi.org/10.1016/j.biomaterials.2012.04.007. [DOI] [PubMed] [Google Scholar]
- 31.Salem AK, Stevens R, Pearson RG, et al. Interactions of 3T3 Fibroblasts and Endothelial Cells with Defined Pore Features. J Biomed Mater Res. 2002;61:212–7. doi: 10.1002/jbm.10195. https://doi.org/10.1002/jbm.10195. [DOI] [PubMed] [Google Scholar]
- 32.Jing L, Sun J, Liu H, et al. Using Plant Proteins to Develop Composite Scaffolds for Cell Culture Applications. Int J Bioprint. 2021;7:298. doi: 10.18063/ijb.v7i1.298. https://doi.org/10.18063/ijb.v7i1.298. [DOI] [PMC free article] [PubMed] [Google Scholar]
- 33.Jiang RD, Shen H, Piao YJ. The Morphometrical Analysis on the Ultrastructure of A549 Cells. Rom J Morphol Embryol. 2010;51:663–7. [PubMed] [Google Scholar]
- 34.Theiszova M, Jantova S, Dragunova J, et al. Comparison the Cytotoxicity of Hydroxiapatite Measured by Direct Cell Counting and MTT Test in Murine Fibroblast NIH-3T3 Cells. Biomed Papers Palacky Univ Olomouc. 2005;149:393. [PubMed] [Google Scholar]
- 35.Pawley J. Handbook of Biological Confocal Microscopy. Vol. 236. Berlin: Springer Science and Business Media; 2006. [Google Scholar]
- 36.Tasnadi EA, Toth T, Kovacs M, et al. 3D-Cell-Annotator:An Open-source Active Surface Tool for Single-cell Segmentation in 3D Microscopy Images. Bioinformatics. 2020;36:2948–9. doi: 10.1093/bioinformatics/btaa029. https://doi.org/10.1093/bioinformatics/btaa029. [DOI] [PMC free article] [PubMed] [Google Scholar]
Associated Data
This section collects any data citations, data availability statements, or supplementary materials included in this article.


