

Summary
Genetic risk for autism spectrum disorders (ASD) is associated with hundreds of genes spanning a wide range of biological functions1–6. The alterations in the human brain resulting from mutations in these genes remain unclear. Furthermore, their phenotypic manifestation varies across individuals6,7. Here, we leveraged organoid models of the human cerebral cortex to identify cell type-specific developmental abnormalities resulting from haploinsufficiency in three ASD risk genes, SUV420H1 (KMT5B), ARID1B, and CHD8, in multiple cell lines from different donors, using single-cell RNA-seq (scRNA-seq) of over 745,000 cells and proteomic analysis of individual organoids, to identify phenotypic convergence. Each of the three mutations demonstrates asynchronous development of two main cortical neuronal lineages, GABAergic neurons and deep-layer excitatory projection neurons, but acts through largely distinct molecular pathways. Although these phenotypes are consistent across cell lines, their expressivity is influenced by the individual genomic context, in a manner that is dependent on both the risk gene and the developmental defect. Calcium imaging in intact organoids shows that these early-stage developmental changes are followed by abnormal circuit activity. This work uncovers cell type-specific neurodevelopmental abnormalities shared across ASD risk genes that are finely modulated by human genomic context, revealing convergence in the neurobiological basis of how different risk genes contribute to ASD pathology.
Introduction
Autism spectrum disorder (ASD) is a childhood-onset neurodevelopmental disorder characterized by cognitive, motor, and sensory deficits8. ASD has a strong genetic component, with risk contribution from hundreds of genes1–5. Furthermore, the same mutation can result in varied clinical manifestations, likely reflecting a modulatory effect of the overall genetic and epigenetic background6,7. The shared developmental effects that cause this large and heterogeneous collection of genes to converge on the phenotypic features of ASD remain poorly understood.
Here, we applied reproducible organoid models of the developing human cerebral cortex9 to investigate the roles of three ASD risk genes, across multiple human stem cell lines. SUV420H1, ARID1B, and CHD8 have emerged repeatedly as top hits in studies of ASD genetic risk5,10–13. All three genes are associated with severe neurodevelopmental abnormalities, including high frequencies of macrocephaly11,14–16. We show that mutations in these genes converge on asynchronous development of shared neuronal classes, rather than on shared molecular mechanisms. The degree of expressivity varies depending on risk gene and phenotype, highlighting the nuanced interactions between genetic variants and genomic contexts that produce the phenotypic manifestation of ASD.
Results
Organoids as models of ASD risk genes
To investigate whether mutations in different ASD risk genes converge on shared phenotypes, we generated cortical organoids9 from different human induced pluripotent stem cell (iPSC) lines (Methods) and profiled individual organoids by scRNA-seq at three stages: one month, when organoids contain mostly progenitors and neurogenesis is beginning; three months, when progenitor diversity increases and multiple subtypes of cortical excitatory neurons emerge; and six months, when interneurons and astroglia are present. We first verified that these organoids initiate appropriate neurodevelopment and express known ASD risk genes5 (Supplementary Notes and Extended Data Fig. 1–2)
We then selected three ASD risk genes, SUV420H1, ARID1B, and CHD8 (see Supplementary Notes) and engineered heterozygous protein-truncating indel mutations in multiple parental lines, targeting protein domains mutated in patients (Methods, Supplementary Table 1, and Extended Data Fig. 3a–c). Notably, for all genes, different parental lines showed substantial differences in endogenous expression of the risk proteins, consistent with documented inter-individual variability6,7, which in turn influenced the absolute amount of protein remaining in the heterozygote (Supplementary Notes and Extended Data Fig. 3d–f). These differences underscore the importance of investigating risk genes across multiple genomic contexts.
As all three genes are linked to macrocephaly and/or microcephaly in patients, we quantified organoid size in each background, at two weeks and one month (Supplementary Table 2). Mutant lines showed size defects resembling the abnormalities seen in patients, with varying severity between different genomic contexts (Supplementary Notes, Extended Data Fig. 3g–j and Extended Data Fig. 2a). These data indicate that organoids can capture clinically-relevant features of ASD pathology.
Asynchronous development in SUV420H1 mutants
We profiled early stages of SUV420H1+/− and control organoids by scRNA-seq, for Mito294 (30,733 cells, 35 d.i.v.), PGP1 (37,510 cells, 35 d.i.v.), and Mito210 (two independent differentiations: 57,941 cells, 28 d.i.v., and 33,313 cells, 35 d.i.v.). Strikingly, mutants showed a consistent presence of GABAergic neurons in all backgrounds (Fig. 1a–c and Extended Data Fig. 2b–e), although these neurons are rare or absent in controls until approximately 3.5 months9. The GABAergic population in mutant organoids at one month expressed broad markers of GABAergic identity (henceforth referred to as “GABAergic neurons”).
Fig. 1. SUV420H1+/− induces asynchronous generation of GABAergic neurons and deep-layer projection neurons, and changes in circuit activity.
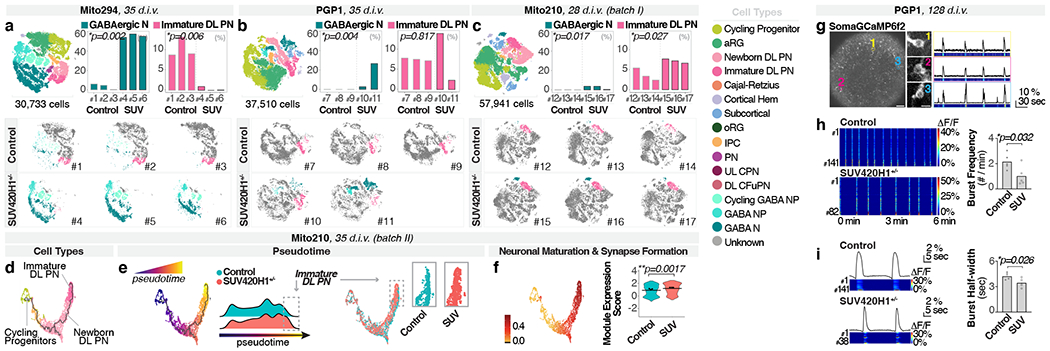
a-c, Combined t-SNE of all organoids (top left, with total cells per dataset) and percentage of indicated cell types per organoid (top right), color-coded by cell type. Adjusted p-values: difference in cell-type proportions between genotypes (logistic mixed models; Methods). Bottom, t-SNE for individual organoids, with cell types of interest colored. d-e, Pseudotime UMAP for indicated batch, color-coded by cell type (d), pseudotime (early, blue; late, yellow; e, left), or genotype (e, right). Insets: cells from dotted boxes, separated by genotype. f, Module of highly correlated genes in cells from d-e, showing UMAP plot of module scores (left) and score distribution across genotypes (right). Horizontal bars: median scores, dots: average score per organoid. Adjusted p-values: differences between control and mutant (linear mixed models; Methods). g-i, Calcium imaging of neuronal activity in intact organoids. g, Left, representative organoid transduced with SomaGCaMP6f2. Scale bar: 100 μm. Insets: high-magnification image of individual cells (1-3). Scale bar: 10 μm. Right, spontaneous calcium signal for each example cell as ΔF/F (top) and pseudocolor heatmap (bottom). h, Left, representative heatmaps of calcium signal per condition. Right, spontaneous network burst frequency. Dots: average values per organoid, bars: mean across all organoids. i, Left, population-averaged calcium transients (top) and heatmap for individual cells (bottom). Right, spontaneous network burst duration. Bar plot format as in h. aRG, apical radial glia; DL, deep layer; UL, upper layer; PN, projection neurons; oRG, outer radial glia; IPC, intermediate progenitor cells; CPN, callosal projection neurons; CFuPN, corticofugal projection neurons; GABA, GABAergic; NP, neuron progenitors; N, neurons; SUV, SUV420H1+/−.
Despite the consistency of this phenotype across lines and differentiations, there were noticeable differences in phenotypic severity (expressivity) across genomic contexts. Specifically, the Mito294 SUV420H1 line showed the most dramatic increase in GABAergic neurons, with over 50% of the cells in all mutant organoids belonging to the GABAergic lineage, and <5% belonging to the excitatory projection neuron lineage (n = 3 organoids per genotype, adjusted p = 0.002, logistic mixed models; Fig. 1a and Extended Data Fig. 2b–c). PGP1 SUV420H1 showed intermediate severity, with up to 35% of cells belonging to the GABAergic lineage (n = 2-3 organoids per genotype, adjusted p = 0.004, logistic mixed models, Fig. 1b and Extended Data Fig. 2d). Finally, Mito210 SUV420H1 showed the mildest phenotype, with no more than 5% of cells belonging to the GABAergic lineage in one batch (28 d.i.v., n = 3 organoids per genotype, adjusted p = 0.017, logistic mixed models; Fig. 1c and Extended Data Fig. 2e) and no GABAergic neurons in a second differentiation batch at 35 d.i.v. (Extended Data Fig. 2f). This suggests that while converging on the same phenotype of premature generation of GABAergic neurons, the genetic and epigenetic context of each cell line modulates phenotypic expressivity.
We then investigated whether the increase in GABAergic neurons persisted at later stages. We profiled organoids from the two lines that showed the greatest difference in phenotypic severity (Mito294 and Mito210) at three months in vitro. At three months and beyond, GABAergic populations expressed clear molecular features of cortical interneurons (therefore indicated as “GABAergic interneurons”). The Mito294 SUV420H1+/− organoids still showed a disproportionately large GABAergic population (32,276 cells, n = 3 single organoids per genotype; Extended Data Fig. 5a). However, two distinct batches of Mito210 SUV420H1 organoids showed no GABAergic interneurons in mutant or control (Extended Data Fig. 5b–c). This indicates that depending on its expressivity, the GABAergic phenotype can resolve over development (Mito210) or persist (Mito294).
We next sought to examine changes in other cell types. Due to the pronounced overgrowth of the GABAergic lineage in the Mito294 SUV420H1+/− organoids, most other cell types had reduced proportions (Fig. 1a, Extended Data Fig. 2c and Extended Data Fig. 5a). However, in one-month Mito210 SUV420H1+/− organoids, the milder GABAergic phenotype allowed us to detect an increase in immature deep-layer projection neurons, the first-born neurons of the cortical plate17,18, in two differentiation batches (batch I, 28 d.i.v., adjusted p = 0.027; batch II, 35 d.i.v., adjusted p = 0.001; logistic mixed models, n = 3 single organoids per genotype; Fig. 1c and Extended Data Fig. 2e–f). Earlier cell types of the deep-layer projection neuron lineage (intermediate progenitor cells and early-postmitotic newborn deep-layer projection neurons) were also increased (Extended Data Fig. 4f). Similar to the transient GABAergic phenotype in this line, the deep-layer projection neuron phenotype was rescued after three months in vitro (two batches, 92 and 90 d.i.v., Extended Data Fig. 5b–c).
In the PGP1 background, although the GABAergic phenotype was consistently seen, we did not observe an increase in the number of deep-layer projection neurons at one month (35 d.i.v., Fig. 1b, Extended Data Fig. 2d). However, genes upregulated in the deep-layer projection neuron lineage in mutants from both the PGP1 and Mito210 lines were enriched in gene ontology (GO) terms related to neuronal differentiation and maturation (Supplementary Notes, Extended Data Fig. 4g, Supplementary Table 3, Methods), indicating a molecular profile consistent with more advanced neuronal maturation in both backgrounds. Interestingly, although the Mito210 line showed a more severe phenotype for the deep-layer projection neurons than the PGP1 line, the latter showed a more severe phenotype for the GABAergic neurons, indicating that different features of the mutant phenotype can be differentially modulated by the same genomic context.
Accelerated maturation of neuron classes
We next examined the developmental dynamics of the affected cell types within a specific lineage. Due to the low numbers of GABAergic neurons in the control lines at one month, we focused on the deep-layer projection neuron phenotype. We calculated pseudotime trajectories, and identified the portion of the trajectory corresponding to the development of the affected cell types (the “partition of interest”, Extended Data Fig. 5d, Methods). The deep-layer projection neuron lineage in the combined 35 d.i.v. Mito210 SUV420H1+/− and control organoids (batch II) showed an increased distribution of mutant cells toward the end point of the trajectory (p < 2.2x10⁻¹⁶, one-sided Kolmogorov–Smirnov test, Fig. 1d–e), supporting accelerated development of these neurons in the mutants. Co-expression analysis by WGCNA19 (Methods, Supplementary Table 4, and Extended Data Fig. 5e) identified a module containing multiple genes associated with neuronal maturation and synapse formation, which was positively correlated with pseudotime progression (Fig. 1f; Pearson correlation r = 0.94, p < 2.2x10⁻¹⁶), and was significantly upregulated in mutant organoids (adjusted p = 0.0017, linear mixed models, Fig. 1f). These results support an accelerated differentiation phenotype in deep-layer projection neurons induced by SUV420H1+/−.
We next explored mechanisms for the premature expression of maturation-associated genes in this mutant. As SUV420H1 is a Histone-Lysine N-Methyltransferase20, we examined changes in chromatin accessibility. We performed scATAC-seq on Mito210 SUV420H1 organoids at one and three months (31 d.i.v., 84,696 nuclei; 93 d.i.v., 23,669 nuclei; n = 3 single organoids per genotype and timepoint). Co-embedding scATAC-seq and scRNA-seq data showed that chromatin accessibility captures most of the cell types identified by gene expression (Extended Data Fig. 6a).
At one month, most of the significant differentially accessible regions (DARs) between mutant and control overlapped across cell types (Supplementary Table 5). We therefore combined all cells, and identified 414 DARs (Methods). The genes nearest (within 10Kb) to DARs with increased accessibility in mutant organoids were enriched for GO terms associated with synaptic transmission and neuronal maturation, whereas genes nearest to DARs with reduced accessibility were enriched for negative regulation of neuronal maturation and connectivity (Extended Data Fig. 6b–d, Supplementary Table 5), consistent with the phenotypes observed by scRNA-seq.
At a later developmental stage (93 d.i.v.), we detected only 43 significant DARs (adjusted p < 0.1) across all cells (Supplementary Table 5). However, regions that were more accessible in the mutant were enriched for GO terms linked to synaptic function (Extended Data Fig. 6b), suggesting that differential regulation of genes important to neuronal maturation and function remains.
Regions with increased accessibility in the mutant were enriched for Transcription factor (TF) binding sites for regulators of neurogenesis and patterning of the developing nervous system, including multiple genes involved in the development of the GABAergic lineage (Methods, Supplementary Table 5, and Extended Data Fig. 6e).
Our results show that in SUV420H1+/− organoids, both GABAergic and deep-layer projection neurons exhibit accelerated development, and that genomic context can differentially modulate phenotypic abnormalities affecting distinct cell types.
Reduced spontaneous circuit activity
The early developmental abnormalities in GABAergic and deep-layer projection neurons, along with the changes in expression and accessibility of synapse-associated genes, prompted us to investigate circuit activity.
We analyzed spontaneous neuronal activity in a line with an intermediate phenotype (PGP1 SUV420H1, Fig. 1b), using adeno-associated viruses driving GCaMP (Methods) to record intracellular calcium dynamics in intact four-month organoids (128 d.i.v.) (Fig. 1g, Extended Data Fig. 7a; Supplementary Video 1). The predominant form of activity was a tetrodotoxin (TTX)-sensitive calcium signal (n=10/10 organoids, Extended Data Fig. 7b), whose large amplitude, slow kinetics, and multi-peak structure suggested it was mediated by trains of action potentials (Extended Data Fig. 7c); this result was confirmed by extracellular single-unit recordings using a multi-electrode array (MEA) (Extended Data Fig. 7d). These large calcium spikes occurred in periodic, synchronized bursts across most neurons (Extended Data Fig. 7e–f), resembling early network activity observed in the developing brain21,22. Network bursting was abolished upon bath application of NBQX, an antagonist of non-NMDA glutamate receptors (Methods, Extended Data Fig. 7g), suggesting that coordinated network activity was driven by excitatory synaptic transmission.
Notably, after blockade of excitatory synapses with NBQX, only controls displayed calcium transients (Extended Data Fig. 7g–h), indicating that control cells were more excitable, and likely more immature compared to the mutants. This is consistent with the accelerated molecular differentiation observed in SUV420H1+/−.
Mutants showed a relative reduction in both frequency (p = 0.032, t-test, Fig. 1h) and duration (p = 0.026, t-test, Fig. 1i) of network bursts (Extended Data Fig. 7i–j), indicating that SUV420H1+/− reduced spontaneous activity, consistent with mouse models23. These data suggest that, beyond the molecular and cellular changes observed in mutant organoids, SUV420H1+/− can also induce long-term abnormalities in circuit activity.
ARID1B and SUV420H1 share target neurons
We sought to investigate whether changes in the production of neuronal classes were a shared feature of ASD risk genes. We profiled individual Mito210 ARID1B+/− and control organoids from two independent differentiations at one month (35 d.i.v.) by scRNA-seq (batch I: 43,556 cells; batch II: 35,000 cells; Fig. 2a–b and Extended Data Fig. 8a–c).
Fig. 2. ARID1B+/− induces asynchronous generation of GABAergic neurons and deep-layer projection neurons.
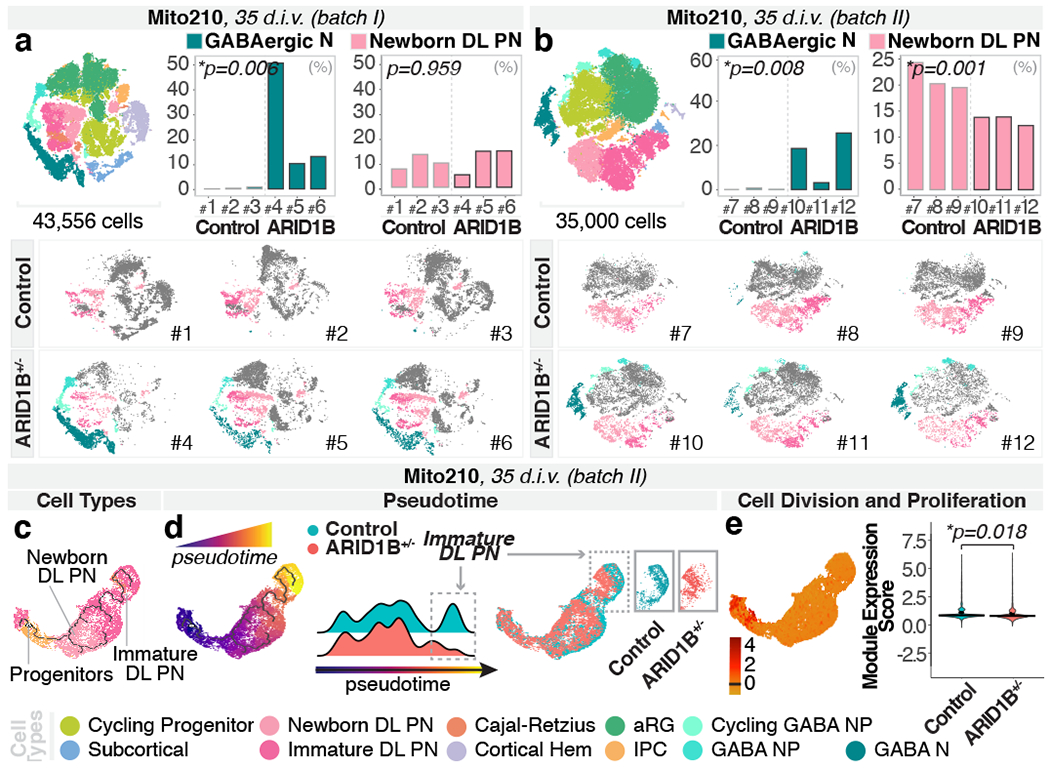
a-b, Combined t-SNE of all organoids (top left), percentage of indicated cell-types per organoid (top right), and t-SNEs for individual organoids (bottom), as in Fig. 1a–c. c-d, Pseudotime UMAPs for indicated batch, as in Fig. 1d–e. e, Module of highly correlated genes by co-expression network analysis on cells in c-d, as in Fig. 1f. INP, interneuron progenitors; IN, interneurons; other cell-type abbreviations as in Fig. 1.
While controls had few or no GABAergic lineage cells at this age, Mito210 ARID1B+/− organoids showed a consistent increase in the proportions of GABAergic neurons and their progenitors (batch I and II, respectively: GABAergic neurons: adjusted p = 0.0057, 0.0076; GABAergic neuron progenitors: adjusted p = 0.0004, 0.0128; cycling GABAergic neuron progenitors: adjusted p = 0.0004, 0.0001; logistic mixed models, n = 3 single organoids per genotype; Fig. 2a–b and Extended Data Fig. 8b–c). In the first batch, GABAergic neurons constituted up to 50% of the profiled cells, making it difficult to draw conclusions about other cell types (Fig. 2a and Extended Data Fig. 8b). In the second batch, the GABAergic phenotype was less severe, allowing us to detect a significant reduction in newborn deep-layer projection neurons (adjusted p = 0.001, logistic mixed models; Fig. 2b and Extended Data Fig. 8c). Notably, these are the same two neuron populations affected in SUV420H1+/−. While ARID1B+/− had an opposite effect on the deep-layer projection neuron lineage, the data shows convergence of two previously-unrelated risk genes in the classes of cells they affect. This phenotype of increased GABAergic populations was still detectable at a later developmental stage, three months, although it was less severe (Extended Data Fig. 8d–f).
To test genomic context, we generated control and ARID1B+/− organoids in the Mito294 background, and profiled 50,081 cells at 35 d.i.v. (n = 3 per genotype). Consistent with the Mito210 ARID1B phenotype, there was a decreased number of newborn deep-layer projection neurons in the mutant (p = 0.025, logistic mixed models; Extended Data Fig. 8g). However, there was no significant increase in the GABAergic population in this background (p = 0.24, logistic mixed models; Extended Data Fig. 8g). This line, Mito294, had the most pronounced increase in GABAergic neurons in SUV420H1+/−, showing that genomic context modifies the expressivity of each mutation differently.
Pseudotime analysis (Extended Data Fig. 8h) showed decreased distribution of cells toward the endpoint of the trajectory progressing from progenitors to deep-layer projection neurons in Mito210 ARID1B+/− organoids at one month (35 d.i.v., batch II; p < 2.2x10⁻¹⁶, one-sided Kolmogorov–Smirnov test, Fig. 2c–d). Gene module analysis (Extended Data Fig. 8i) identified a module containing multiple DNA replication and cell cycle genes (Supplementary Table 3), which was enriched in progenitor cells, and was significantly upregulated in mutants (adjusted p = 0.018, linear mixed models, Fig. 2e). These data indicate delayed differentiation of deep-layer projection neurons in ARID1B+/− organoids.
In sum, like SUV420H1+/−, ARID1B+/− organoids exhibit both a phenotype of premature expansion of the GABAergic neuron lineage, and asynchronous development of deep-layer projection neurons. Notably, as in SUV420H1+/−, these two phenotypes were differentially modulated in distinct parental lines in the ARID1B+/− organoids.
CHD8+/− promotes interneuron development
To further explore the hypothesis of convergent phenotypes among ASD risk genes, we profiled HUES66 CHD8+/− and control organoids at 3.5 months (109 d.i.v., 67,024 cells, n = 3 single organoids per genotype; Fig. 3a and Extended Data Fig. 9a). Mutants had an increased number of GABAergic interneurons and their progenitors (GABAergic interneurons: adjusted p = 0.079, cycling GABAergic interneuron progenitors: adjusted p = 0.031, GABAergic interneuron progenitors: adjusted p = 0.0012, logistic mixed models; Fig. 3a and Extended Data Fig. 9a). A second independent batch of HUES66 CHD8 organoids showed an even more dramatic increase (n = 2-3 single organoids per genotype; cycling GABAergic interneuron progenitors: adjusted p = 7.2x10⁻⁵, GABAergic interneuron progenitors: adjusted p = 1.8x10⁻⁵, GABAergic interneurons: adjusted p = 8.9x10⁻⁶, logistic mixed models; Fig. 3b and Extended Data Fig. 9b–d). Notably, at six months (190 d.i.v., 39,285 cells, n = 3 individual organoids per genotype), the GABAergic interneuron phenotype was still present (adjusted p = 0.002, logistic mixed models; Extended Data Fig. d-f).
Fig. 3. CHD8+/− leads to asynchronous generation of GABAergic interneurons.
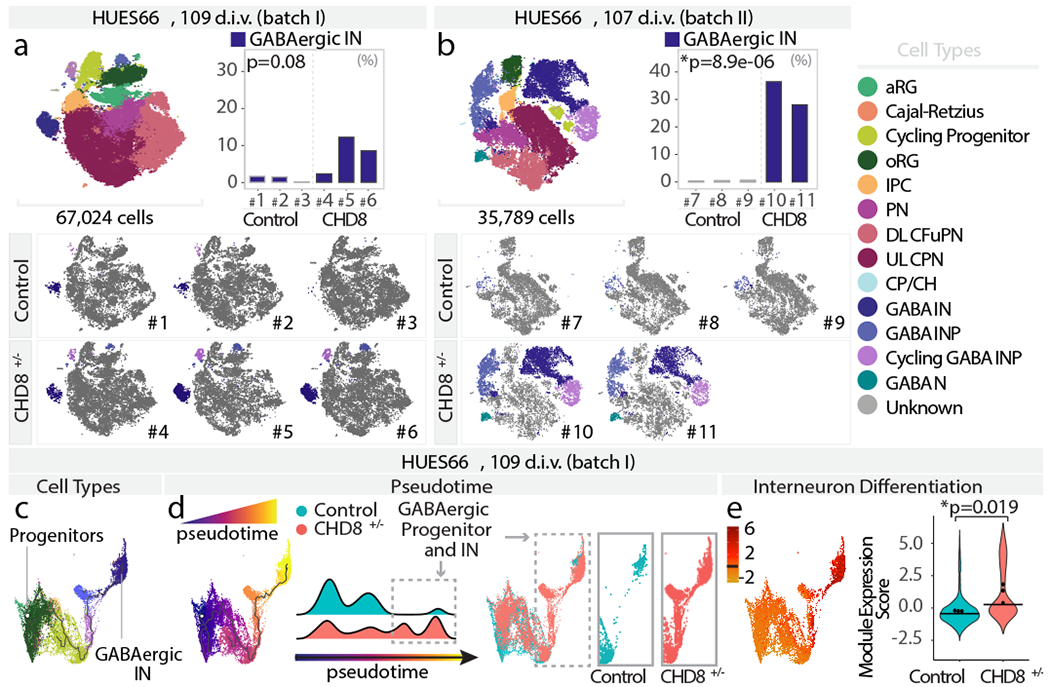
a-b, Combined t-SNE of all organoids (top left), percentage of indicated cell-types per organoid (top right), and t-SNEs for individual organoids (bottom), as in Fig. 1a–c. c-d, Pseudotime UMAPs for indicated batch, as in Fig. 1d–e. e, Module of highly correlated genes by co-expression network analysis on cells in c-d, as in Fig. 1f. INP, interneuron progenitors; IN, interneurons; other cell-type abbreviations as in Fig. 1.
This increase in GABAergic populations is consistent with two recent reports showing that CHD8+/− affects expression of GABAergic interneuron marker genes, in two additional human parental lines24,25. However, as we found for SUV420H1+/− and ARID1B+/−, genomic context was able to modulate the expressivity of the CHD8+/− phenotype. We compared CHD8+/− and control organoids generated from four different parental lines spanning different basal levels of CHD8 protein expression (Extended Data Fig. 3c, f and Supplementary Table 1). Bulk RNA-seq of 35 d.i.v. organoids showed that while differentially expressed genes (DEG) between mutant and control did not significantly overlap between lines, DEGs from three of the four lines (HUES66, GM08330, and H1) shared GO terms related to neurodevelopment and neuronal maturation (Extended Data Fig. 10a, Supplementary Table 6). However, scRNA-seq on CHD8+/− and control organoids from GM08330 and H1 at 3.5 months showed no significant difference in the number of GABAergic interneurons (105-108 d.i.v., n=3 individual organoids per genotype, 107,490 cells; Extended Data Fig. 10b–d).
Pseudotime analysis of the GABAergic lineage (progressing from radial glia to GABAergic interneurons) in 3.5 months HUES66 CHD8+/− and control organoids showed an increased distribution of mutant cells toward the end point of the developmental trajectory (p < 2.2*10−16, one-sided Kolmogorov–Smirnov test, Fig. 3c–d and Extended Data Fig. 9g). Gene module analysis of the GABAergic lineage (Extended Data Fig. 9h and Supplementary Table 4) identified a module of interneuron differentiation genes that was upregulated in HUES66 CHD8+/− (adjusted p = 0.019, linear mixed models, Fig. 3e), and two modules related to progenitor biology that were downregulated in the mutant (Extended Data Fig. 9h).
Thus, similarly to SUV420H1+/− and ARID1B+/−, CHD8+/− leads to accelerated development of the GABAergic lineage, which for CHD8 leads to a persistent increase in the proportion of these cell types. For all three risk genes, this phenotype occurs in multiple parental lines, but with different degrees of phenotypic expressivity.
Convergence through distinct mechanisms
We next investigated whether SUV420H1+/−, ARID1B+/−, and CHD8+/− converge on asynchronous development of the same neuronal lineages by acting through common molecular pathways. We compared gene expression changes across the three ASD risk genes in cell lines that showed a strong phenotype (Mito210 SUV420H1, Mito210 ARID1B, and HUES66 CHD8). Although mutations shared enrichment for GO categories, DEGs from bulk or pseudobulk RNA-seq showed little overlap (Supplementary Notes, Supplementary Table 7 and Extended Data Fig. 11a–d). Similarly, while related cell types within the same mutation shared overlapping DEGs, DEGs caused by different mutations rarely overlapped, even for identical or closely-related cell types (Supplementary Notes, Supplementary Table 7 and Fig. 4). Thus, although these three mutants share a degree of convergence in altered neurodevelopmental processes, they affect largely distinct genes.
Fig. 4. SUV420H1+−, ARID1B+−, and CHD8+/− act through distinct gene targets.
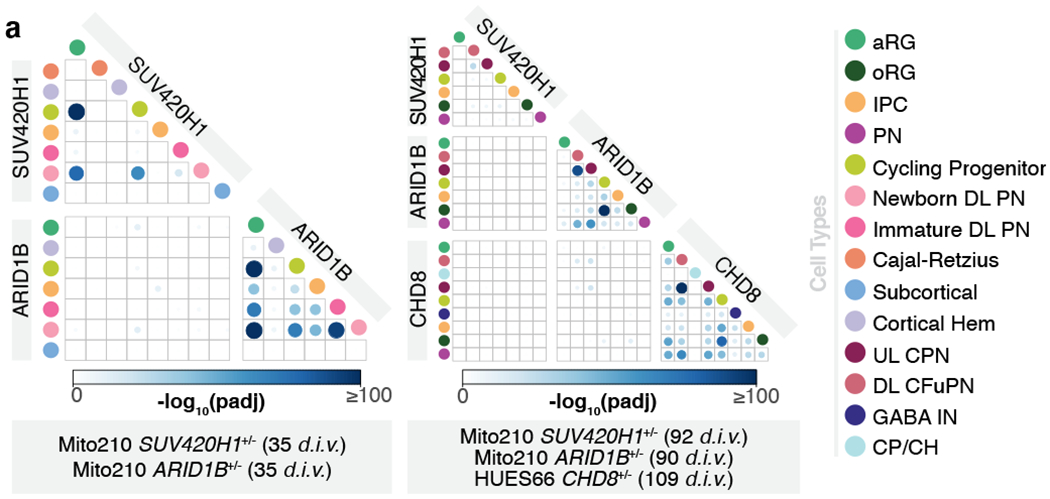
a, Overlap between the sets of differentially expressed genes (mutant vs. control) in individual cell types from the scRNA-seq datasets. Color and size of boxed circles indicates the significance of the number of overlapping genes between the corresponding cell populations (Bonferroni-adjusted p-value of a hypergeometric test). GABA IN, GABAergic interneurons; CP/CH, Choroid Plexus/Cortical Hem; other cell-type abbreviations as in Fig. 1.
Whole-proteome mass spectrometry of mutant and control single organoids (Methods) identified 233 significantly differentially expressed proteins (DEPs; FDR < 0.1) for SUV420H1 (≥ 4,000 proteins detected per sample), 24 for ARID1B (≥ 900 proteins), and 34 for CHD8 (≥ 2,800 proteins; Extended Data Fig. 12a–c and Supplementary Table 8). DEPs had very low overlap between mutations, with only five proteins significantly dysregulated in at least two mutations (Supplementary Table 8). DEPs and enriched biological processes (Gene Set Enrichment) for all mutations resembled the gene modules previously identified by scRNA-seq (Supplementary Notes and Extended Data Fig. 12d–f).
To evaluate whether the affected proteins in the three mutants were predicted to interact with one another, or with shared target proteins, the top 50 DEPs (adjusted p-value) for each mutation were used to create a network of interacting proteins26,27, followed by clustering to identify subnetworks (Methods). Each subnetwork contained DEPs from multiple mutations (Supplementary Notes and Extended Data Fig. 12g–i), indicating that these three risk genes affect shared processes, albeit by dysregulating different proteins.
Discussion
The process by which mutations in ASD risk genes converge on the neurobiology of this multifaceted disorder remains unclear. Our results define two neuronal classes of the local cortical circuit (GABAergic and deep-layer projection neurons) as specifically-affected populations. Excitatory/inhibitory imbalance of the cortical microcircuit is a major hypothesis for the etiology of ASD28–30, and prior studies have implicated dysregulation of GABAergic and glutamatergic cortical neurons in ASD patients and experimental models31–37. Notably, we show that different human genomic contexts modulate phenotypic expressivity, based on both the risk gene and the specific abnormalities caused by each mutation. This is interesting, as many ASD risk gene mutations show variable clinical manifestations in humans6,7,14,38.
Our finding that different ASD risk genes converge on a phenotype of asynchronous neuronal development but mostly diverge at the level of molecular targets, suggests that shared clinical pathology of these genes may derive from higher-order processes of neuronal differentiation and circuit wiring. These results encourage future investigation of therapeutic approaches aimed at the modulation of shared dysfunctional circuit properties in add-on to shared molecular pathways.
Materials and Methods
Pluripotent stem cell culture
The HUES66 CHD8 parental hESC line39 and CHD8 mutant line (HUES66 AC2), a clone which has a heterozygous 13 nucleotide deletion, resulting in a stop codon at amino acid 1248 (CHD8 gRNA: 5’-TTCTTACTGTGTACCCGGGC-3’ (TGG)), were kindly provided by N. Sanjana, X. Shi, J. Pan, and F. Zhang (Broad Institute of MIT and Harvard). The psychiatric control Mito210 and Mito294 parental iPSC lines were provided by B. Cohen (McLean Hospital); the parental PGP1 iPSC line by G. Church (Harvard University)40; the GM08330 iPSC line (a.k.a. GM8330-8) by M. Talkowski (MGH) and was originally from Coriell Institute and the H1 parental hESC line (a.k.a. WA01) was purchased from WiCell. Cell lines were cultured as previously described9,41. Among these cell lines we included iPSC lines from individuals with no known history of ASD or other psychiatric condition (Mito210 and Mito294 confirmed by structured psychiatric interview, PGP1 with publicly available records). All human pluripotent stem cell lines were maintained below passage 50, were negative for mycoplasma (assayed with MycoAlert PLUS Mycoplasma Detection Kit, Lonza), and karyotypically normal (G-banded karyotype test performed by WiCell Research Institute). The HUES66 and PGP1 lines were authenticated using STR analysis completed by GlobalStem (in 2008) and TRIPath (in 2018), respectively. The Mito210 and Mito294 lines were authenticated by genotyping analysis (Fluidigm FPV5 chip) performed by the Broad Institute Genomics Platform (in 2017). The H1 and GM08330 lines were authenticated using STR analysis completed by WiCell (in 2021). In Mito294 ARID1B control line a CNV smaller than 0.5Mb on Ch19 was detected via SNP array analysis. The GM08330 parental line and modified lines have all an interstitial duplication in the long (q) arm of chromosome 20. All experiments involving human cells were performed according to ISSCR 2021 guidelines42, and approved by the Harvard University IRB and ESCRO committees.
CRISPR guide design
The CRISPR guides for SUV420H1 and ARID1B were designed using the Benchling CRISPR Guide Design Tool (Benchling Biology Software, 2017). The guides were designed to maximize on-target efficiency and minimize off-target sites in intragenic regions43,44. For SUV420H1, a guide was designed to target the N-terminal domain to create a protein truncation early in the translated protein in all known protein coding transcripts (SUV420H1 gRNA: 5’-CAAGAACCAAACTGGTTGCT-3’ (AGG)). The ARID1B guide was chosen to induce a stop codon immediately before the ARID domain (ARID1B gRNA: 5’-CTCTAGCCTGATGAACACGC-3’ (AGG)). For CHD8, all the mutant lines were generated using the same gRNA previously used for the generation of the HUES66 AC2 (CHD8 gRNA: 5’-TTCTTACTGTGTACCCGGGC-3’ (TGG)).
CRISPR-mediated gene editing
Mutations in SUV420H1 were introduced in the Mito210, Mito294 and PGP1 iPSC lines. For the Mito210 and Mito294 SUV420H1 mutant lines, nanoblades generated as previously described45 were mixed with 300 μl of mTeSRI and 4 μg/ml of polybrene and added to 80% confluent cells. For selection of the edited clones, cells were enzymatically detached and plated at a ratio of ~5,000 cells per 60 mm dish with 10 μM of ROCK inhibitor (Y-27632, Millipore-Sigma) to increase single-cell survival. When the colonies started to appear, each clone was manually collected and transferred into a single well of a 96-well plate. During colony picking, some cells were reserved for DNA extraction and clonal screening. The PGP1 SUV420H1 mutant line was generated in collaboration with the Harvard Stem Cell Institute (HSCI) iPS Core Facility. Briefly, parental cells were transfected with the Neon system (1,000v, 1, 100v or 1,200v, 30ms, 1 pulse). For 100,000 cells 6.25pmol TrueCut TM Cas9 Protein v2 (Thermo Fisher Cat: A36496) and 12.5pmol of sgRNA (Synthego) were used. Post transfection, the pools of cells were harvested to test knock-out efficiency. The best pool was then selected for low density plating (600 to 2,000 cells per 10cm dish). A week later, colonies were picked into one 96 well plate. Clones were screened by PCR and Sanger sequencing. Heterozygous clones were expanded and the genotypes were re-confirmed post expansion.
Mito210 and Mito294 ARID1B edited lines were generated by the Broad Institute Stem Cell Facility. The guide RNA and Cas9 (EnGen Cas9 NLS from New England Biolabs) were transfected by using the NEON transfection system (Thermo Fisher Scientific, 1050 V, 30 ms, 2 pulses and 2.5x10⁵ cells).
Mutations in CHD8 were introduced in the Mito210 and Mito294 lines using the Amaxa 4D-Nucleofector® (Lonza), using the protocol optimized for pluripotent stem cell lines. Parental cell lines were transfected with gRNA-CHD8-Cas92APuro and immediately plated in mTeSRI for 24 hours. Selection of transfected cells was done by adding 0.25–0.5 μg/ml of puromycin after 48 hours of transfection, for two days. Selection of the edited clones was performed according to the protocol described for the Mito210 and Mito294 SUV420H1 clones. The H1 and GM08330 CHD8 mutant lines were generated in collaboration with the HSCI iPS Core Facility following the protocol used to generate the PGP1 SUV420H1 mutant line.
Sequence confirmation of edits
Insertions/deletions in individual clones were screened via PCR amplification using primers flanking the guide. For more details about Insertions/deletions see Supplementary Table 1.
Organoid differentiation
Cortical organoids were generated as previously described9,41. Embryoid bodies were formed in the same pluripotent media in which they were maintained for 1-2 days in order to better enable the formation of embryoid bodies from each line.
Immunohistochemistry
Samples were prepared as previously described9. Cryosection thickness varied from 14-18 μm. Primary and secondary antibodies are listed in Supplementary Table 9.
Whole-organoid imaging
Organoids were processed using the SHIELD protocol46. Briefly, organoids were fixed for 30 minutes in 4% paraformaldehyde (PFA) at room temperature (RT) and were then treated with 3% (wt/v) polyglycerol-3-polyglycidyl ether (P3PE) for 48 hours in ice cold 0.1 M phosphate buffer (pH 7.2) at 4° C then transferred to 0.3% P3PE in 0.1 M sodium carbonate (pH 10) for 24 hours at 37° C. Samples were rinsed and cleared in 0.2 M SDS in 50 mM phosphate buffered saline (PBS, pH 7.3) for 48 hours at 55° C. Organoids were stained with Syto16 (Thermo Fisher Scientific #S7578) and anti-SOX2 using the SmartLabel system (Lifecanvas). Primary antibodies are listed in Supplementary Table 9. Tissues were washed extensively for 24 hours in PBS + 0.1% Triton-X-100 and antibodies were fixed to the tissue using a 4% PFA solution overnight at RT. Tissues were refractive index-matched in PROTOS solution (RI = 1.519) and imaged using a SmartSPIM axially-swept light-sheet microscope (LifeCanvas Technologies). 3D image datasets were acquired using a 15x 0.4 NA objective (ASI-Special Optics, #54-10-12). Optical sections from whole-organoid datasets are shown in Extended Data Fig. 4a.
Microscopy and organoid size analysis
Images of organoids in culture were taken with an EVOS FL microscope (Invitrogen), Lionheart™ FX Automated Microscope (BioTek Instruments), or with an Axio lmager.Z2 (Zeiss). Immunofluorescence images were acquired with the latter two and analyzed with the Gen5 (BioTek Instruments) or Zen Blue (ZEN 2.6 – blue edition, Zeiss) image processing software. ImageJ47 (v.2.0) was used to quantify organoid size. Area values were obtained by tracing individual organoids on ImageJ software which measured area pixels. Measurements were plotted as a ratio to the average value for control organoids of each experimental batch. Number of organoids and differentiations used for the measurements are summarized in Supplementary Table 2.
Western blotting
Proteins were extracted from iPSC using N-PER™ Neuronal Protein Extraction Reagent (Thermo Fisher Scientific) supplemented with protease (cOmplete™ Mini Protease Inhibitor Cocktail, Roche) and phosphatase inhibitor (PhosSTOP, Sigma). Lysates were centrifuged for 10 minutes at 13,500 rpm at 4° C. Protein concentration was quantified using the Pierce™ BCA Protein Assay Kit (Thermo Fisher Scientific). 15-20 μg of protein lysates were separated on a NuPAGE™ 4-12%, Bis-Tris Gel (Invitrogen) or Mini-PROTEAN 4–15% Gels (Bio-Rad) and transferred onto PVDF membrane. Blots were blocked with 5% nonfat dry milk (Bio-Rad) and incubated with primary antibodies overnight (Supplementary Table 9). Blots were then washed and incubated at room temperature (RT) with secondary horseradish peroxidase-conjugated antibodies (Abcam) for 1 hour. Blots were developed using SuperSignal™ West Femto Maximum Sensitivity Substrate (Thermo Fisher Scientific) or ECL™ Prime Western Blotting System (Millipore), and a ChemiDoc System (Bio-Rad). Densitometry band quantification was done using Fiji software48 v2.0 and normalized on housekeeping genes (GAPDH or β-actin). The bands used for quantification are marked with an asterisk in Extended Data Fig. 3d–f. Uncropped gel images of western blots can be found in Supplementary Figure 1.
Calcium Imaging
Organoids were transduced with pAAV-CAG-SomaGCaMP6f2 (Addgene, #158757) by pipetting 0.2 μl of stock virus to 500 μl of Cortical Differentiation Medium IV (CDMIV, without matrigel) in a 24 well containing a single organoid. On the next day, each organoid was transferred to a 6-well plate filled with 2 ml of fresh medium. On the third day after transduction, organoids were transferred to low attachment 10-cm plates and on the seventh day, medium was switched to BrainPhys (5790 STEMCELL Technologies) supplemented with 1% N2 (17502-048 Thermo Fisher), 1% B27 (17504044 Thermo Fisher), GDNF (20 ng/ml, Cat. No. 78139 STEMCELL Technologies), BDNF (20 ng/ml, 450-02 Peprotech), cAMP (1mM, 100-0244 Stemcell Technologies), Ascorbic acid (200 nM, Cat. No. 72132 STEMCELL Technologies), and laminin (1 μg/ml, 23017015 Life Technologies). Organoids were cultured in BrainPhys for at least 2 weeks before imaging.
Brain organoids were randomly selected and transferred to a recording chamber containing BrainPhys. Imaging was performed using a confocal scanner (CSU-W1, Andor confocal unit attached on an inverted microscope [Ti-Eclipse and NIS-elements imaging software (NIS-Elements Advance Research (Ver.4.51.01)), both from Nikon]), while the organoids were kept at 37°C using a heating platform and a controller (TC-324C, Warner Instruments). The use of a 10x objective (Plan Apo λ, 10x/0.45) resulted in a field of view of 1.3 x 1.3 mm2 and a pixel size of 0.6 pm. Imaging took place in fast-time-lapse mode, with an exposure time of 100ms, resulting in an acquisition rate of 8 frames/sec. Spontaneous activity was recorded in three different z-planes, for at least 22 minutes of baseline activity in total (with no pharmacology treatment).
Stock solutions of 2,3-dioxo-6-nitro-1,2,3,4-tetrahydrobenzo[f]quinoxaline-7-sulfonamide disodium salt (NBQX disodium salt, Abcam; 100 mM) and Tetrodotoxin citrate (TTX, Abcam; 10 mM) were prepared in ddH2O. Bath application of NBQX (antagonist of AMPA/kainate glutamate receptors) and TTX (voltage-gated sodium-channel antagonist) was applied to achieve a final bath concentration of 20 μM and 2 μM, respectively.
Data were converted from nd2 format to tiff, and automated motion correction and cell segmentation were performed using Suite2p49, followed by manual curation of segmented cells (we examined the spatial footprint and temporal characteristics of each candidate cells, as well as manually adding neurons with clear cell body morphology [see Fig. 1g]). Then, mean raw fluorescence for each cell was measured as a function of time.
Analysis of calcium imaging data
Analysis was done using in-house MATLAB scripts. Raw calcium signals for each cell, F(t), were converted to represent changes from baseline level, ΔF/F(t) defined as (F(t) – Fo(t))/Fo(t). The time varying baseline fluorescence, Fo(t), for each cell was a smoothed fluorescence trace obtained after applying a 10-second-order median filter centered at t. Calcium events elicited by action potentials were detected based on a threshold value given by their peak amplitude (5 times the standard deviation of the noise value) and their first time derivative (2.5 times the standard deviation of the noise value).
The analysis of network bursting was performed based on the population-averaged calcium signal along all segmented cells. A peak in the population signal was considered a network burst if it met the following criteria: (1) the peak amplitude was greater than 10 times the standard deviation of the noise value, (2) a set of bursting cells composed of at least 20% of total cells were active during that population calcium transient, and (3) a cell was considered part of the set of bursting cells only if it participated in at least 50% of the network bursts. Under these criteria, 89.3 ± 14 % (range from 60.5 % to 100 %) and 95.5 % ± 6.8 % (range from 77.6 % to 100 %) of segmented cells participated in network bursting in control and mutant organoids, respectively.
The peaks of the network bursts were used to measure the inter-spike interval (ISI), and the burst frequency was obtained from the average ISI. The burst half-width was also measured from the population-averaged calcium signal by calculating the width of the transient at 50% of the burst peak amplitude.
For analyses of the synchronicity, the ΔF/F(t) signal was used to calculate the cross-correlation between all pairs of cells at zero lag (Extended Data Fig. 7e) as well as the cross-correlogram between a reference cell and the rest of the cells (Extended Data Fig. 7f). Along with the original signal, we randomly selected 10 active cells, circularly shifted their ΔF/F(t) signal by random phases (keeping their internal temporal structure but altering their temporal relationship with the network) and used them as control.
Multi-electrode array
Extracellular neurophysiological signals were recorded using a Maxwell Biosystems CMOS-HD-MEA system50 (MaxOne System, MaxWell Biosystems AG, Switzerland). MaxOne chip contains 26,400 platinum electrodes in a sensing area of 3.85 × 2.10 mm2 with 17.5 μm center-to-center pitch, 3265 electrodes/mm2 density, and 1024 configurable low noise readout channels (2.4 μVr.m.s. in the 300 Hz–10 kHz band) with a sampling rate of 20 kHz/s at 10-bit resolution. Acute recordings were performed at room temperature, with the intact organoid in fresh BrainPhys.
For the recordings, we used MaxLab Live Software (v.20.1.6. MaxWell Biosystems AG, Switzerland). Briefly, spontaneous activity of neurons was measured using the Activity Scan Assay where the whole chip area was scanned with a sparse recording (30s/configuration, seven configurations). Active neurons were automatically identified, based on the firing rate and spike amplitude obtained from the Activity Scan. Based on the activity of the neurons, the most active electrodes were routed for the creation of the network configuration based on units of 4x3 electrodes each, with 1024 recording electrodes in total (Extended Data Fig. 7d top). Selected electrodes were then simultaneously recorded using the Network Assay to investigate the spontaneous neuronal network activity.
For spike detection, the software used a finite impulse response bandpass filter between 300-3000 Hz to pre-process the raw data (Extended Data Fig. 7d middle). The root mean square (RMS) noise per electrode was calculated and every negative peak larger than 6 RMS was considered a spike.
When extracting the waveform of the electrodes in a single unit (set of neighboring 4x3 electrodes; Extended Data Fig. 7d bottom), we used the spike time of one selected electrode as a reference to extract the simultaneous signal across the different electrodes (instead of using their individual spike times).
All descriptive statistics and statistical tests were performed in Matlab (Version 9.5, R2018b, The MathWorks, Inc.), using the Statistics Toolbox (version 11.4, R2018b, The MathWorks, Inc.). The Lilliefors test was used to test for normality of data distributions. All datasets met the assumptions of the applied statistical tests. When comparing groups, the equality of the variance was tested at the 5% significance level by a two-tailed squared-ranks test. All statistical tests applied to the electrophysiological data were two-tailed, with a 5% significance level.
Cell lysis and filter-aided sample preparation (FASP) digestion for mass spectrometry
For SUV420H1, 4 mutant and 4 control organoids, for CHD8, 3 mutant and 3 control organoids and for ARID1B, 5 mutant and 4 control organoids were used. Cells were placed into microTUBE- 15 (Covaris) microtubes with TPP buffer (truXTRAC Protein Extraction Buffer TP, Covaris SKU: 520103) and lysed using a S220 Focused-ultrasonicator instrument (Covaris) with 125 W power over 180 seconds at 10% max peak power. Upon precipitation with chloroform/methanol, extracted proteins were weighed and digested according to the FASP protocol51,52 (100 μg for ARID1B and CHD8; 150 μg for SUV420H1). Briefly, the 10K filter was washed with 100 μl of 50mM triethylammonium bicarbonate (TEAB). Each sample was added, centrifuged, and the supernatant discarded. Then, 100 μl of 20mM Tris (2-carboxyethyl) phosphine (TCEP) at 37° C was added for one hour, centrifuged, and the supernatant discarded. While shielding from light, 100 μl of 10mM IAcNH2 was added for 1 hour followed by spinning and discarding the supernatant. Next, 150 μl of 50 mM TEAB + 3 μg of Sequencing Grade Trypsin (Promega) was added to each sample and left overnight at 38° C. The samples were then centrifuged and the supernatants collected. Finally, 50 μl of 50 mM TEAB was added to the samples, followed by spinning and supernatant collection. The samples were then transferred to HPLC.
TMT mass tagging protocol peptide labeling
TMT (Tandem Mass Tag) Label Reagents (TMTPro, ThermoFisher Scientific, 16plex Label Reagent Set Catalog number: A44521) were equilibrated to RT and resuspended in anhydrous acetonitrile or ethanol (for the 0.8 and 5mg vials, 41 μl and 256 μl were added, respectively). The reagent was dissolved for 5 minutes with occasional vortexing. TMT Label Reagent (41 μl, equivalent to 0.8 mg) was added to each 100-150 μg sample. The reaction was incubated for one hour at RT. The reaction was quenched after adding 8 μl of 5% hydroxylamine to the sample and incubating for 15 minutes. Samples were combined, dried in a speedvac (Eppendorf) and stored at −80°C.
Hi-pH separation and mass spectrometry analysis
Before submission to Liquid Chromatography with tandem mass spectrometry (LC-MS/MS), each experiment sample was separated on a Hi-pH column (Thermo Fisher Scientific) according to the vendor’s instructions. After separation into 40 (20 for the ARID1B experiment) fractions, each fraction was submitted for a single LC-MS/MS experiment performed on a Lumos Tribrid (Thermo Fisher Scientific) equipped with 3000 Ultima Dual nanoHPLC pump (Thermo Fisher Scientific). Peptides were separated onto a 150 μm inner diameter microcapillary trapping column packed first with approximately 3 cm of C18 Reprosil resin (5 μm, 100 Å, Dr. Maisch GmbH) followed by PharmaFluidics micropack analytical 50 cm column. Separation was achieved by applying a gradient from 5–27% acetonitrile (ACN) in 0.1% formic acid over 90 minutes at 200 nl per minute. Electrospray ionization was enabled by applying a voltage of 1.8 kV using a home-made electrode junction at the end of the microcapillary column and sprayed from stainless-steel tips (PepSep). The Lumos Orbitrap was operated in data-dependent mode for the MS methods. The MS survey scan was performed in the Orbitrap in the range of 400 −1,800 m/z at a resolution of 6 xχ 104, followed by the selection of the 20 most intense ions (TOP20) for CID-MS2 fragmentation in the Ion trap using a precursor isolation width window of 2 m/z, AGC setting of 10,000, and a maximum ion accumulation of 50 ms. Singly-charged ion species were not subjected to CID fragmentation. Normalized collision energy was set to 35 V and an activation time of 10 ms. Ions in a 10 ppm m/z window around ions selected for MS2 were excluded from further selection for fragmentation for 90 seconds. The same TOP20 ions were subjected to HCD MS2 events in the Orbitrap part of the instrument. The fragment ion isolation width was set to 0.8 m/z, AGC was set to 50,000, the maximum ion time was 150 ms, normalized collision energy was set to 34 V and an activation time of 1 ms for each HCD MS2 scan.
Mass spectrometry data generation
Raw data were submitted for analysis in Proteome Discoverer 2.4 software (Thermo Fisher Scientific). Assignment of MS/MS spectra was performed using the Sequest HT algorithm by searching the data against a protein sequence database including all entries from the Human Uniprot database53,54 and other known contaminants such as human keratins and common lab contaminants. Sequest HT searches were performed using a 10 ppm precursor ion tolerance and requiring each peptides N-/C termini to adhere with Trypsin protease specificity, while allowing up to two missed cleavages. 16plex TMTpro tags on peptide N termini and lysine residues (+304.207 Da) was set as static modifications while methionine oxidation (+15.99492 Da) was set as variable modification. A MS2 spectra assignment false discovery rate (FDR) of 1% on protein level was achieved by applying the target-decoy database search. Filtering was performed using a Percolator (64 bit version)55. For quantification, a 0.02 m/z window centered on the theoretical m/z value of each of the 6 reporter ions and the intensity of the signal closest to the theoretical m/z value was recorded. Reporter ion intensities were exported in the result file of Proteome Discoverer 2.4 search engine as Excel tables. The total signal intensity across all peptides quantified was summed for each TMT channel, and all intensity values were normalized to account for potentially uneven TMT labeling and/or sample handling variance for each labeled channel.
Mass spectrometry data analysis
Potential contaminants were filtered out and proteins supported by at least two unique peptides for the SUV420H1 and CHD8 experiment and at least one for the ARID1B experiment were used for further analysis. We kept proteins that were missing in at most one sample per condition. Data were transformed and normalized using variance stabilizing normalization using the DEP package of Bioconductor56. To perform statistical analysis, data were imputed for missing values using random draws from a Gaussian distribution with 0.3 width and a mean that was down-shifted from the sample mean by 1.8. To detect statistically significant differential protein abundance between conditions, we performed a moderated t-test using the LIMMA package of Bioconductor57, employing an FDR threshold of 0.1. GSEA was performed using the GSEA software58. GO and KEGG pathway annotation were utilized to perform functional annotation of the significantly regulated proteins. GO terms and KEGG pathways with FDR q-values < 0.05 were considered statistically significant.
To build protein interaction networks, we used the prize-collecting Steiner forest algorithm26,59 using the top 50 DEPs (ranked by adjusted p value) from each mutation as terminals, with the absolute value of their log fold change as prizes. This algorithm optimizes the network to include high-confidence protein interactions between protein nodes with large prizes. We used the PCSF R package v0.99.160 to calculate networks, with the STRING database as a background protein-protein interactome27, using parameters n = 10, r = 0.1, w = 2, b = 40, and mu = 0.01. As by default in that package, the network was subclustered using the edge-betweenness clustering algorithm from the igraph package, and functional enrichment was performed on each cluster using the ENRICFIR API. Cytoscape software version 3.8.2 was used for network visualization61. To assess relationships between the three sets of differential proteins, a PPI-weighted gene distance (pMM)62 was calculated between each pair of protein sets. A background distribution was calculated by drawing size-matched random lists of proteins from all detected proteins in each dataset and calculating the pMM between these sets. This was repeated 1000 times, and an empirical p-value was calculated by evaluating the number of times randomized pMMs were lower than the value calculated using DEPs.
Dissociation of brain organoids and scRNA-seq
Organoids were dissociated as previously described41,63. Volumes of reagents were scaled down 25x for one month old organoids. Cells were loaded onto either a Chromium™ Single Cell B or G Chip (10x Genomics, PN-1000153, PN-1000120), and processed through the Chromium Controller to generate single cell GEMs (Gel Beads in Emulsion). scRNA-seq libraries were generated with the Chromium™ Single Cell 3’ Library & Gel Bead Kit v3 or v3.1 (10x Genomics, PN- 1000075, PN-1000121), with the exception of a few libraries in the earlier experiments that were prepared with a v2 kit (10x Genomics, PN- 120237). See Supplementary Table 10 for information on the estimated number of cells loaded and version of kit used. We pooled libraries from different samples based on molar concentrations and sequenced them on a NextSeq 500 or NovaSeq instrument (Illumina) with 28 bases for read 1 (26 bases for v2 libraries), 55 bases for read 2 (57 bases for v2 libraries) and 8 bases for Index 1. If necessary, after the first round of sequencing, we re-pooled libraries based on the actual number of cells in each and re-sequenced with the goal of producing approximately equal number of reads per cell for each sample.
scRNA-seq data analysis
Reads from scRNA-seq were aligned to the GRCh38 human reference genome and the cell-by-gene count matrices were produced with the Cell Ranger pipeline (10x Genomics)64. Cell Ranger version 2.0.1 was used for experiments using the GM08330 control “single cell map” and for HUES66 CHD8 mutant and control organoids at 3.5 months, batch I, while version 3.0.2 was used for all other experiments. Default parameters were used, except for the ‘–cells’ argument. Data was analyzed using the Seurat R package v3.1.565 using R v3.6. Cells expressing a minimum of 500 genes were kept, and UMI counts were normalized for each cell by the total expression, multiplied by 106, and log-transformed. Variable genes were found using the “mean.var.plot” method, and the ScaleData function was used to regress out variation due to differences in total UMIs per cell. Principal component analysis (PCA) was performed on the scaled data for the variable genes, and top principal components were chosen based on Seurat’s ElbowPlots (at least 15 PCs were used in all cases). Cells were clustered in PCA space using Seurat’s FindNeighbors on top principal components, followed by FindClusters with resolution = 1.0 (briefly, a 20-nearest neighbor graph was constructed and modularity optimization using the Louvain algorithm was performed to identify clusters). Variation in the cells was visualized by t-distributed stochastic neighbor embedding (t-SNE) on the top principal components.
In the case of the GM08330 one month organoids (single-cell map), cells were demultiplexed using genotype clustering from cells from a different experiment that were sequenced in the same lane. To demultiplex, SNPs were called from CellRanger BAM files with the cellSNP tool v0.1.5, and then the vireo function was used with default parameters and n_donor = 2, from the cardelino R library v0.4.066,67 to assign cells to each genotype.
In two cases, one organoid was excluded from the analysis as outliers. See the “Statistics and reproducibility” section for details.
For each dataset, upregulated genes in each cluster were identified using the VeniceMarker tool from the Signac package v0.0.7 from BioTuring (https://github.com/bioturing/signac). Cell types were assigned to each cluster by looking at the top most significant upregulated genes. In a few cases, clusters were further subclustered to assign identities at higher resolution. At one month, the excitatory projection neurons included a gradient of immature neurons, which were split into two clusters: we labelled the cluster representing the earlier developmental stage “newborn deep-layer projection neurons” and the cluster representing the later stage “immature deep-layer projection neurons”. At three months and beyond, excitatory projection neuron clusters could be identified as deep-layer corticofugal neurons and upper-layer callosal projection neurons. For the GABAergic populations, one month organoids included neurons expressing broad markers of GABAergic identity (labelled as “GABAergic neurons”), progenitor cells expressing markers of GABAergic lineage identity (“GABAergic Neuron Progenitors”), and progenitor cells with high expression of cell cycle markers in addition to the progenitor identity markers (“Cycling GABAergic Neuron Progenitors”). At three months and beyond, GABAergic neurons expressed more specific markers of cortical interneurons (hence labelled “GABAergic Interneurons”), and GABAergic lineage progenitors at these ages were divided into “GABAergic Interneuron Progenitors” and “Cycling GABAergic Interneuron Progenitors”, based on level of expression of cell cycle markers.
To assess gene expression of ASD risk genes in GM08330 and Mito210 control organoids across timepoints, datasets from one, three, and six months were merged using Seurat v3.1.5, then batch corrected using Harmony v1.0 with default parameters68. Since the one month data are dominated by cell cycle signal, the ScaleData function was used to regress out variation due to both total UMI count per cell and to cell cycle stage differences, calculated using Seurat’s CellCycleScore. Variation was visualized using t-SNE on the first 30 Harmony dimensions. Broad cell types were assigned as above, and mutual information was calculated between cell type assignments and individual organoids with the mpmi R package69. Expression of the 102 ASD risk genes identified in the Satterstrom et. al. study5 was evaluated using Seurat’s AddModuleScore function using default parameters. This function calculates the average expression level per cell of the set of genes (based on log-normalized, unsealed data), and then subtracts the average expression of a randomly-selected expression-matched control set of genes. A resulting score above zero indicates that the ASD risk gene set is expressed more highly in that cell than would be expected, given the average expression of the gene set across the dataset.
To compare cell type proportions between control and mutant organoids, for each cell type present in a dataset, the glmer function from the R package Ime4 v1.1-2370 was used to estimate a mixed-effect logistic regression model71. The output was a binary indicator of whether cells belong to this cell type, the control or mutant state of the cell was a fixed predictor, and the organoid that the cell belonged to was a random intercept. Another model was fit without the control-versus-mutant predictor, and the ANOVA function was used to compare the two model fits. P-values for each cell type were then adjusted for multiple hypothesis testing using the Benjamini-Hochberg correction.
Pseudotime, gene module, and differential expression analysis
Pseudotime analysis was performed using the Monocle3 v. 0.2.0 software package72 with default parameters. The cells were first subset to contain an equal amount from control and mutant. A starting point for the trajectory was chosen manually by finding an endpoint of the tree located in the earliest developmental cell type (generally, cycling progenitors). Where the cells were split into more than one partition, the starting point was chosen within the partition of interest, and a new UMAP was calculated using just these cells. To test whether mutant trajectories were accelerated compared to control, a one-sided Kolmogorov–Smirnov test was applied comparing the distribution of psuedotime values of control vs. mutant cells, using the stats R package.
In order to learn patterns of coordinated gene regulation across the cells, we applied WGCNA19 to each dataset. Where cells were split into partitions in the above pseudotime analysis, only cells belonging to the partition of interest were used. Normalized gene expression data was further filtered to remove outlying genes, mitochondrial and ribosomal genes. Outliers were identified by setting the upper (> 9) and lower (< 0.15) thresholds to the average normalized expression per gene. After processing, blockwiseModules function from the WGCNA v1.69 library was performed in R with the parameters networkType=”signed”, minModuleSize=4, corType=“Bicor”, maxPOutliers=0.1, deepSplit=3,trapErrors=T, and randomSeed=59069. Other than power, remaining parameters were left as the default setting. To pick an adequate power for each dataset, we used the pickSoftThreshold function from WGCNA to test values from 1 to 30. Final resolution was determined by choosing the resolution that captured most variation in the fewest total number of modules - this resulted in a power of 3 for SUV420H1 35 d.i.v., and 9 for ARID1B 35 d.i.v. and 12 for CHD8 109 d.i.v.
To calculate differential expression of modules, Seurat objects were downsampled to have an equal number of cells per organoid, and then the AddModuleScore function was used, using gene lists from WGCNA results. For each module, linear mixed-effect models were fit to the data, with the modules scores as the output, the organoid the cell belongs to as a random intercept, and with or without the control-versus-mutant state as a predictor. The ANOVA function was used to compare the models, and p-values were then adjusted across modules using the Benjamini-Hochberg correction.
Differentially expressed genes between control and mutant organoids were assessed after datasets were subset to the cells from the partition of interest in the above pseudotime analysis, to the cells from each individual cell type, or not subset at all for pseudobulk analysis. Reads were then summed across cells in each organoid. Genes with less than 10 total reads were excluded, and DESeq273 was used to calculate DEGs, with each organoid as a sample74. The clusterProfiler75 R package was used to find enriched biological processes in these gene sets, with the enrichGO function and the compareCluster function to highlight processes the gene sets might have in common.
Single nucleus isolation and single-cell ATAC-seq
Nuclei from one month and three month organoids were extracted with two types of procedures according to their size differences. For the one month organoids, the nuclei were extracted following a protocol provided by 10x Genomics76 to minimize material loss, while a sucrose-based nucleus isolation protocol77 was used for the three month organoids to better remove debris. Single-nucleus ATAC-Seq libraries were prepared with the Chromium™ Single Cell ATAC Library & Gel Bead v1 Kit (10x Genomics, PN-1000110) and around 15,300 nuclei per channel were loaded to give an estimated recovery of 10,000 nuclei per channel. Libraries from different samples were pooled based on molar concentrations and sequenced with 1% PhiX spike-in on a NextSeq 500 instrument (Illumina) with 33 bases each for read 1 and read 2, 8 bases for Index 1 and 16 bases for Index 2.
Single-cell ATAC-seq data analysis
Reads from scATAC-seq were aligned to the GRCh38 human reference genome and the cell-by-peak count matrices were produced with the Cell Ranger ATAC pipeline v2.0.0 (10x Genomics) with default parameters. Data were analyzed using the Signac R package v1.2.178 using R v4.0. Annotations from the EnsDb.Hsapiens.v86 package79 were added to the object. After consideration of QC metrics recommended in that package, cells with 1500-20,000 fragments in peak regions, at least 35% of reads in peaks, a nucleosome signal of less than 4, and a TSS Enrichment score of greater than 2 were retained for further analysis. Latent semantic indexing (LSI) was performed to reduce data dimensionality (counts were normalized using term frequency inverse document frequency, all features were set as top features, and singular value decomposition (SVD) was performed). The top LSI component was discarded as it correlated strongly with sequencing depth, and components 2-30 were used for downstream analysis. Cells were clustered using Seurat’s FindNeighbors, followed by FindClusters with the SLM algorithm (a 20-nearest neighbor graph was constructed and modularity optimization using the smart local moving algorithm was performed to identify clusters). Variation in the cells was visualized by UMAP (Uniform Manifold Approximation and Projection) on the top LSI components.
ScATAC-seq data were integrated with scRNA-seq data from the corresponding Mito210 dataset for each timepoint, using Seurat’s TransferData to predict cell type labels for the ATAC profiles. Concurrently, differentially accessible (DA) peaks per cluster were called using FindMarkers with the logistic regression framework with the number of fragments in peak regions as a latent variable. These DA peaks were mapped to the closest genes. Top genes per cluster were used to confirm and refine cluster cell type assignments from those based on transferring RNA labels.
DA peaks between control and SUV420H1 mutant organoids were calculated per cell type, using the same method as above. We noticed that most cell types had very few significantly differentially accessible regions (range 6-34, except for apical radial glia cells, the most prevalent, and thus most powered, cell type at this time point, which had 515 differentially accessible regions), and that the differentially accessible regions were almost entirely overlapping in all cell types. Therefore, differentially accessible regions were calculated using all cells together to improve power. Differentially accessible regions were visualized using Signac’s CoveragePlot function with default parameters.
To find transcription factor motifs enriched in differentially accessible regions, the top 400 up- and down-regulated peaks for each time point differentially accessible peaks were supplied to the HOMER software v4.11.180, using a 300bp fragment size and masking repeats. In the case of upregulated regions in three month mutant organoids, only 341 regions were supplied, since that was the total number of regions with logFC>0.1 and p>0.1. The top 5 de novo motifs per cell type found by HOMER with a p value <= 10−10 are reported, along with all TFs who’s known binding sites match that motif with a score >= 0.59.
Statistics and reproducibility
Organoid size analysis:
see Supplementary Table 2 for the number of organoids used. In summary, SUV420H1+/− organoids: n = 132 for total control organoids, n = 132 for total mutant organoids, from 6 experimental batches. For ARID1B+/− organoids: n = 109 for total control organoids, n = 122 for total mutant organoids, from 4 experimental batches. For CHD8+/− organoids: n = 472 for total control organoids, n = 482 for total mutant organoids, from 7 experimental batches. P-values were calculated from a two-sided t-test and then submitted to Bonferroni adjustment.
Proteomic analysis:
four mutant and four control organoids were used for SUV420H1. Three mutant and three control and five mutant and four control organoids were used for CHD8 and ARID1B, respectively. To detect statistically significant differential protein abundance between conditions a moderated t-test was performed (see Methods, FDR threshold of 0.1; Extended Data Fig. 12a–c). GO terms and KEGG pathways were calculated using the GSEA software (see Methods; Extended Data Fig. 12d–f) and FDR q-values < 0.05 were considered statistically significant. For each pair of protein set distances between pairs of DEP sets (Extended Data Fig. 12h–i), a PPI-weighted protein set distance was calculated between all significant DEPs (FDR < 0.1). To determine if this distance was smaller than would be expected by chance, size-matched sets were randomly chosen from the proteins detected in each experiment, and distance between these random sets was calculated 1000 times per pair. P-values were assigned by counting the fractions of times this random distance was less than the actual distance value between differential sets.
scATAC-seq analysis:
detailed information can be found on Supplementary Table 10. In summary, three SUV420H1 mutant and three control organoids were used for each of the one month and three month timepoints, being a total of twelve individually sequenced organoids. The total number of cells sequenced was 45,988.
scRNA-seq analysis:
detailed information can be found on Supplementary Table 10. In summary, in each dataset, three individual organoids per genotype were profiled. In two cases, one organoid was excluded from the analysis as an outlier: in PGP1 SUV420H1 organoids at one month, a mutant organoid was excluded due to very low average nUMI and nGene in that sequencing lane, and in the HUES66 CHD8 organoids at 3.5 months batch II, a mutant organoid was excluded because it mostly contained interneuron lineage cells, with very few projection neuron cells. Although an increase in interneuron-lineage cells was seen in all mutant organoids, this organoid was excluded to be conservative. This left a total of 112 single organoids that passed quality control and were considered in downstream analysis, with a total of 749,370 cells. Adjusted p-values for difference in cell type proportions between control and mutant (Fig. 1a–c; Fig. 2a–b; Fig. 3a–b; Extended Data Fig. 4c–f; Extended Data Fig. 5a–c; Extended Data Fig. 8b–c,e,g; Extended Data Fig. 9a–b,e; Extended Data Fig. 10b–d) were based on logistic mixed models (see scRNA-seq data analysis section). Adjusted p-values for differences in distribution of module scores between control and mutants (Fig. 1f; Fig. 2e; Fig. 3e; Extended Data Fig. 5e; Extended Data Fig. 8i; Extended Data Fig. 9h) were based on linear mixed models (see Pseudotime, gene module, and differential expression analysis section). In Fig. 4 for each comparison of two gene lists, circles inside box are colored and sized according to the significance of the number of overlapping genes in those two lists, reported as the Bonferroni-adjusted p-value of a hypergeometric test.
Bulk RNA-seg analysis:
three organoids were sequenced per genotype being a total of 30 individual organoids.
Calcium imaging analysis:
five organoids were analyzed per genotype. Spontaneous activity was recorded in three different z-planes (120 ± 803 neurons/plane [range from 25 to 294 neurons/plane] in control organoids, and 107 ± 75 neurons/plane [range from 32 to 255 neurons/plane] in SUV420H1+/− organoids). P-values were calculated from two-tailed t-tests (Fig. 1h–i). P-value for cumulative frequency distribution (Extended Data Fig. 7j) of ISI for control and SUV420H1+/− organoids based on two-sided Kolmogorov-Smirnov test. Representative images in Fig. 1g and Extended Data Fig. 7a show one control organoid out of five control and five SUV420H1+/− organoids.
Immunohistochemistry:
at least three organoids of each condition were used for verifying the expression of the indicated markers in Extended Data Fig. 1a–c; Extended Data Fig. 3g; Extended Data Fig. 4a–b; Extended Data Fig. 8a,d,f; Extended Data Fig. 9c,d,f.
Western Blot:
each control and mutant protein lysate was blotted at least twice in Extended Data Fig. 3d–f.
Extended Data
Extended Data Fig. 1. Cortical organoids cultured for one, three and six months generate the cellular diversity of the human cerebral cortex with high organoid-to-organoid reproducibility.
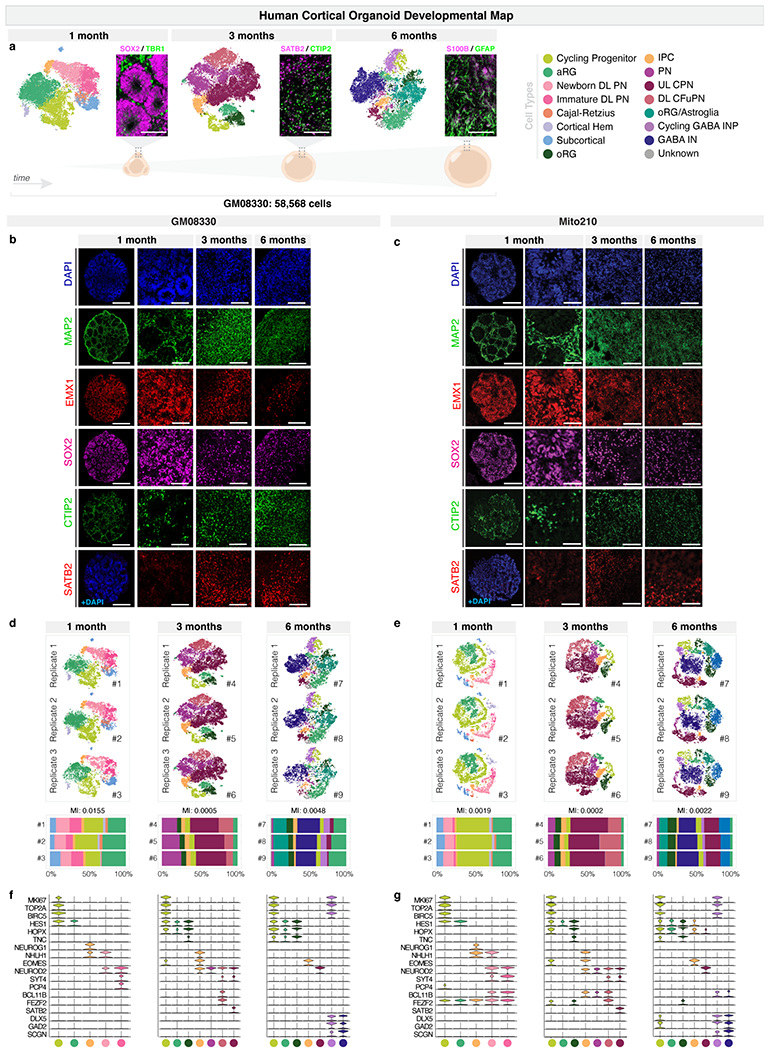
a, scRNA-seq and immunohistochemistry analysis of organoids cultured for one month (32 d.i.v.), three months (98 d.i.v.), and six months (190 d.i.v.). Left, t-SNE plots (n = 3 organoids per timepoint, co-clustered). Cells are colored by cell-type. Right, immunohistochemistry for specific markers. Neural progenitor marker SOX2 (magenta) and postmitotic neuronal marker TBR1 (green) are shown at one month. CPN marker SATB2 (magenta) and CFuPN marker CTIP2 (green) are shown at three months. The astroglia markers S100B (magenta) and GFAP (green) are shown at six months. Below, schematic images of brain organoids in each timepoint. Scale bars are 100 μm. b, Immunohistochemistry for neuronal (MAP2), dorsal forebrain neural progenitor (EMX1, SOX2), CFuPN (CTIP2), and CPN (SATB2) markers in GM08330 organoids at one, three, and six months. Scale bars: whole organoids (leftmost column), 200 μm; others, 50 μm. c, Immunohistochemistry for cell-type specific markers in Mito210 organoids, as in b. d, Top, t-SNE plots of the scRNA-seq data from individual replicates from three organoids at one month, three organoids at three months, and three organoids at six months from the GM08330 cell line shown in b. Bottom, bar charts showing the cell-type composition of each individual organoid. On top of the bar charts, mutual information (MI) scores between cell-type proportions and organoid identities are displayed. A MI score of 0 would indicate identical cell type proportions between organoids, while a score of 1 would indicate completely divergent profiles. In previous work, MI scores for endogenous brain datasets were reported to range from 0.008 to 0.0649. e, scRNA-seq data of organoids from the Mito210 cell line at one month (35 d.i.v.), three months (92 d.i.v.), and six months (178 d.i.v.), as in d. Organoids for the one and three month timepoints are the same as the control organoids in Extended Data Fig. 4f and Extended Data Fig. 5b. f, Expression of selected marker genes used in cell-type identification. Violin plots show distribution of normalized expression in cells from GM08330 organoids at one, three and six months (n = 3 individual organoids per timepoint). g, Expression of marker genes in Mito210 organoids, as in f. Number of organoids used for each analysis can be found in the (Methods under “Statistics and reproducibility”. aRG, apical radial glia; DL, deep layer; UL, upper layer; PN, projection neurons; oRG, outer radial glia; IPC, intermediate progenitor cells; CPN, callosal projection neurons; CFuPN, corticofugal projection neurons; GABA INP, GABAergic interneuron progenitors; GABA IN, GABAergic interneurons.
Extended Data Fig. 2. Expression of selected ASD risk genes in cortical organoids cultured for one, three, and six months.
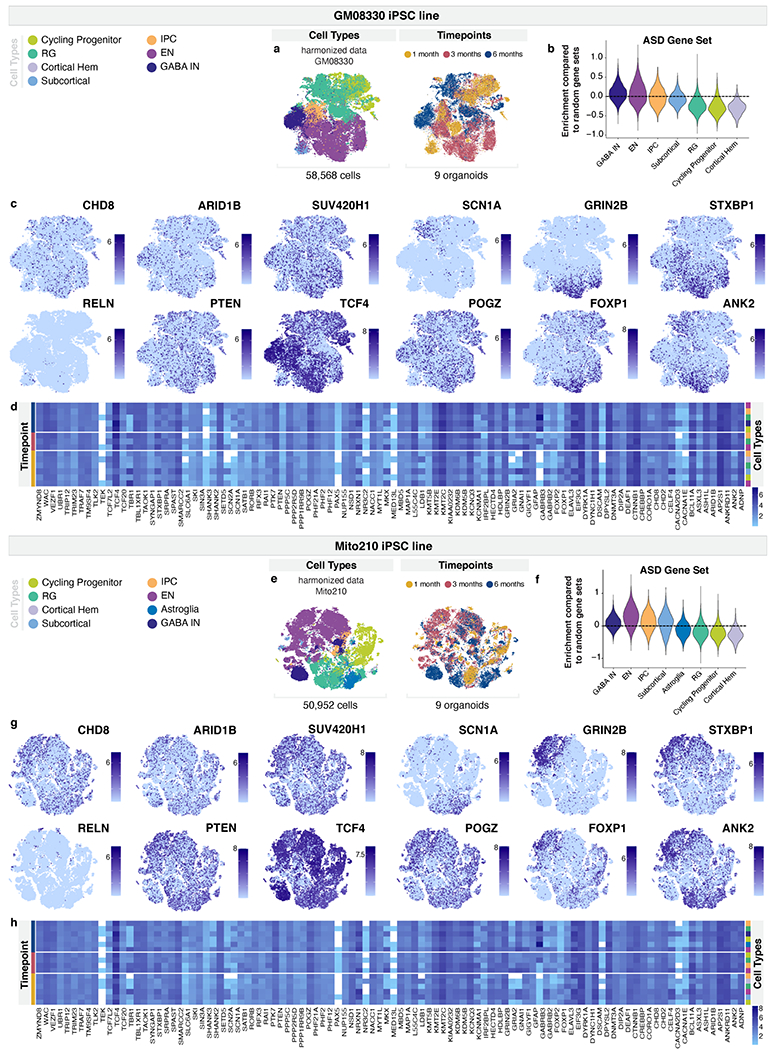
a, t-SNE plots of 58,568 cells from nine organoids from the GM08330 cell line, shown in Extended Data Fig. 1d, after Harmony batch correction. Cells are colored according to cell-type (left) and timepoint (right). b, Gene set expression scores for a set of 102 genes associated with ASD risk5 across cell-types, in cells from a. Scores above 0 indicate enriched expression over similar sets of randomly chosen genes. c, t-SNE plots showing normalized expression of selected ASD risk genes in cells from a. d, Average expression of 102 genes associated with ASD risk across cell-types and timepoints in the GM08330 cell line. e, t-SNE plots of nine organoids from the Mito210 cell line, shown in Extended Data Fig. 1e, after Harmony batch correction. Cells are colored according to cell-type (left) or timepoint (right). f, Gene set scores for the set of ASD risk genes as in b, in cells from e. Scores above 0 indicate higher expression than similar modules of randomly chosen genes. g, t-SNE plots showing normalized expression of selected ASD risk genes in cells from e. h, Expression of 102 genes associated with ASD risk across cell-types and timepoints in Mito210 cell line. RG, radial glia (aRG, oRG, and oRG/Astroglia), IPC, intermediate progenitor cells; CPN, callosal projection neurons; CFuPN, corticofugal projection neurons; EN, Excitatory neurons (CPN, CFuPN and PN); GABA IN, GABAergic interneurons.
Extended Data Fig. 3. Generation and characterization of SUV420H1, ARID1B, and CHD8 mutant organoids.
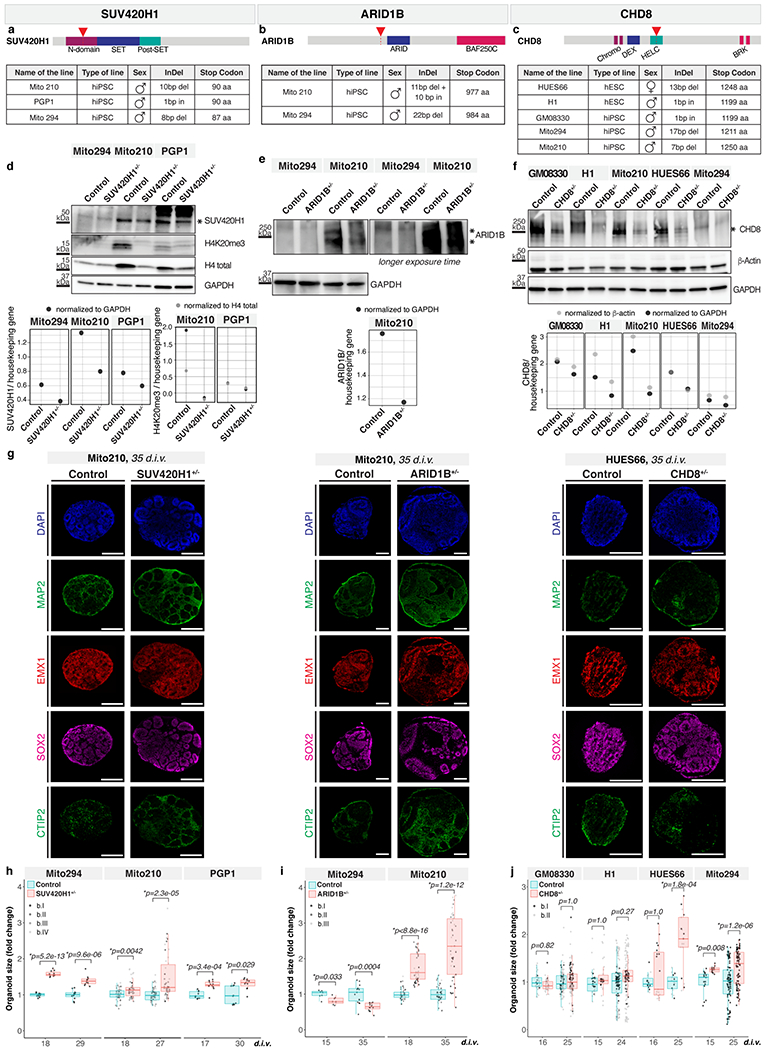
a, Protein domain structure of SUV420H1. Arrow indicates the region (N-domain) mutated in the Mito210, PGP1 and Mito294 parental lines (bottom). b, Protein domain structure of ARID1B. Arrow indicates the region before the ARID domain mutated in the Mito210 and Mito294 parental lines (bottom). c, Protein domain structure of CHD8. Arrows indicates the helicase C-terminal (HELC) domain mutated in the HUES66, H1, GM08330, Mito294 and Mito210 lines (bottom). d-f, Western blot analysis showing presence of SUV420H1 (d), ARID1B (e) and CHD8 (f) protein expression in control lines, and its reduction in the mutant lines. Molecular weight in kDa is shown on the left of the gel. H4K20me3, a target of SUV420H1 activity, and total levels of histone H4 were also detected in control and in SUV420H1+/− lines (d). ARID1B was not detectable in Mito294 even with a longer exposure of the blotted membrane (e, right). Asterisks indicate the bands used for quantification. Bottom, protein levels in control and mutant lines were quantified and normalized for housekeeping genes β-Actin or GAPDH. For gel source data, see Supplementary Figure 1. g, Immunohistochemistry for neuronal (MAP2), dorsal forebrain neural progenitor (EMX1, SOX2) and CFuPN (CTIP2) markers in organoids at 35 d.i.v. derived from the Mito210 SUV420H1+/−, Mito210 ARID1B+/− and HUES66 CHD8+/− and isogenic control cell lines. Scale bar, 300 μm. h-j, Size quantification of control and SUV420H1+/− (h), ARID1B1+/− (i) and CHD8+/− (j) organoids across lines and at different timepoints. The ratio of organoid size compared to the average of control organoids in each batch is plotted. Differentiation batch (b.) is indicated by the shade of the points. Lower and upper hinges correspond to the first and third quartiles (the 25th and 75th percentiles) and middle hinge is the median (50th). Both whiskers extends from the hinge to the largest or smallest value no further than 1.5 * IQR from the hinge (where IQR is the inter-quartile range, or distance between the first and third quartiles). P-values from a two-sided t-test, after Bonferroni adjustment within each mutation. Number of organoids and differentiations used for the measurement are summarized in Supplementary Table 2 and in the (Methods under “Statistics and reproducibility”.
Extended Data Fig. 4. Cell-type composition of SUV420H1+/− and isogenic control organoids.
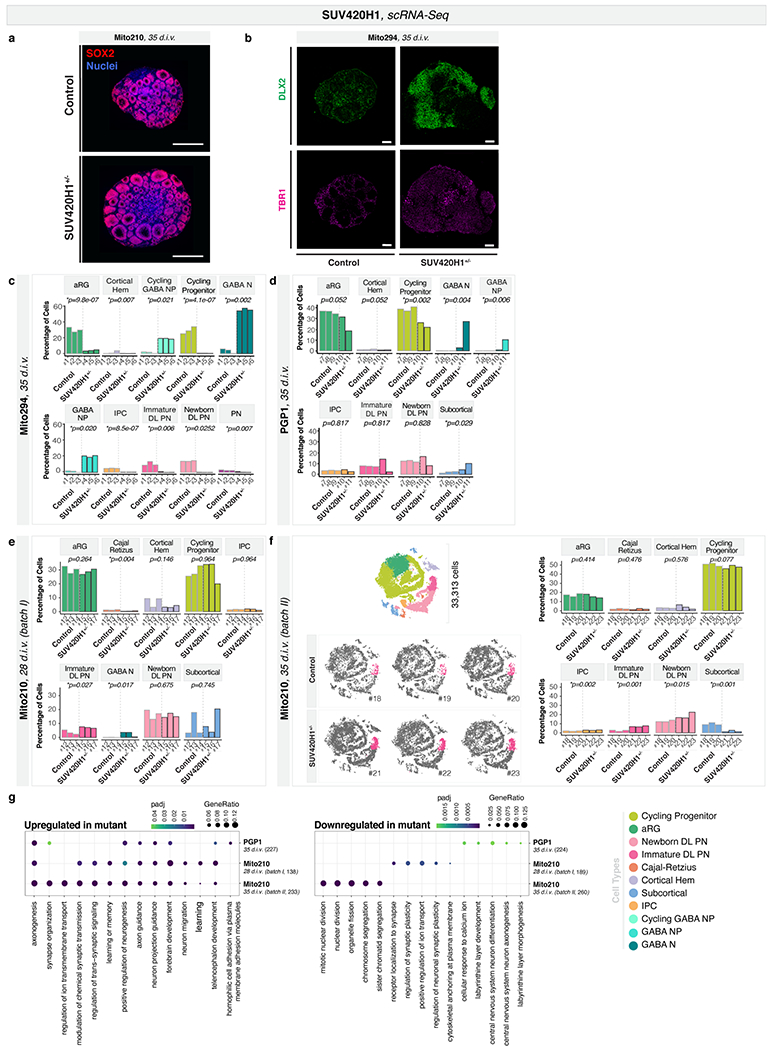
a, Immunohistochemistry of Mito210 SUV420H1+/− and control organoids cultured for one month (35 d.i.v.). Optical section from the middle of whole-organoid dataset. Scale bars are 500 μm. SOX2, a marker of neuronal progenitors, is shown in red, and nuclei (Syto16) are shown in blue. b, Immunohistochemistry for the postmitotic excitatory neuronal marker TBR1 and GABAergic marker DLX2 in Mito294 control and SUV420H1+/− organoids at one month (35 d.i.v.). Scale bars: 200 μm. c-e, scRNA-seq data from one month (Mito294 35d.i.v. (c), PGP1 35 d.i.v. (d) and Mito210 28 d.i.v., batch I (e)) control and SUV420H1+/− organoids. Bar charts show the percentage of cells for all the cell populations in each control and mutant organoid. Adjusted p-values for a difference in cell type proportions between control and mutant, based on logistic mixed models (see Methods) are shown. f, scRNA-seq data from Mito210 35 d.i.v. (batch II) control and SUV420H1+/− organoids. Left top shows combined t-SNE plots of control and mutant organoids (n = 3 single organoids per genotype). Cells are colored by cell-type, and the total number of cells per plot is indicated. Left bottom, t-SNE plots for control and mutant individual organoids. Immature deep-layer projection neuron populations are highlighted in color. Right, bar charts show the percentage of cells for all the cell populations in each control and mutant organoid, as in c-e. g, Enriched gene ontology terms for genes upregulated and downregulated in SUV420H1+/− vs. control across lines. Genes were calculated using cells from the partition of interest. The top 5 most significant terms per dataset are shown. Size of dot indicates the proportion of genes belonging to each term found in the list of dysregulated genes (“GeneRatio”). Color indicates enrichment adjusted p-value. Numbers in parentheses along the y axis indicate the number of differentially expressed genes in that dataset. As control, we calculated GO term enrichment for 100 random gene sets of the same size sampled from genes expressed in each dataset, and found no significant enrichment of these terms (see Methods). Number of organoids used for each analysis can be found in the (Methods under “Statistics and reproducibility”. aRG, apical radial glia; DL, deep layer; UL, upper layer; PN, projection neurons; oRG, outer radial glia; IPC, intermediate progenitor cells; CPN, callosal projection neurons; CFuPN, corticofugal projection neurons; GABA N, GABAergic neurons.
Extended Data Fig. 5. Cell-type composition, full pseudotime trajectories, and gene modules in SUV420H1+/− and isogenic control organoids.
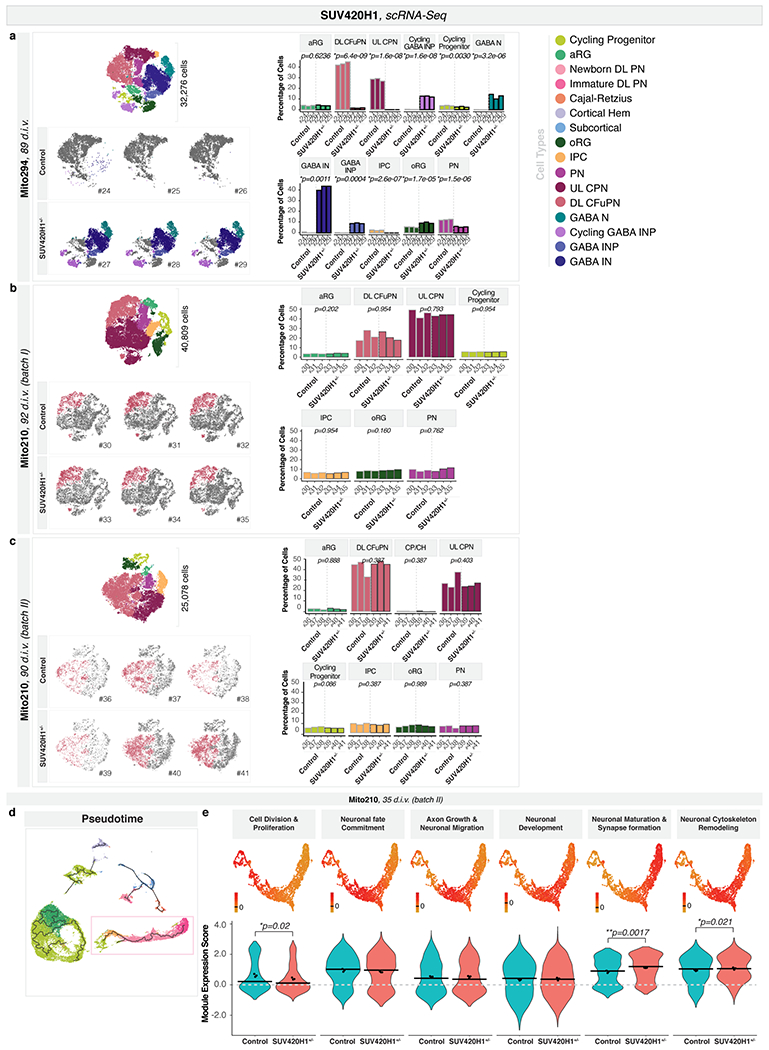
a-c, scRNA-seq data from three month Mito294 89 d.i.v. (a), Mito210 92 d.i.v. batch I (b), and 90 d.i.v. batch II (c) control and SUV420H1+/− organoids. Left top shows combined t-SNE plots of control and mutant organoids (n = 3 single organoids per genotype). Cells are colored by cell type, and the number of cells per plot is indicated. Left bottom, t-SNE plots for control and mutant individual organoids. Cell-types of interest are highlighted in color. Right, bar charts show the percentage of cells for all the cell populations in each control and mutant organoid. Adjusted p-values for a difference in cell type proportions between control and mutant, based on logistic mixed models (see Methods) are shown. d, Pseudotime trajectory from the full dataset of Mito210 SUV420H1+/− 35 d.i.v. (batch II) and control organoids, calculated with Monocle3. The partition highlighted by a box was subsetted and the trajectory is shown in Fig. 1d. e, Module scores (top) and their distribution across mutant and control cells (bottom) for all modules resulting from WGCNA analysis of the partition of interest from Mito210 SUV420H1+/− and control organoids at 35 d.i.v. (batch II). Cells were downsampled to have an equal number of cells per organoid. Names were assigned to each module based on the known functions of the genes included in each one. Horizontal bars show median scores, and dots show average score per organoid. Adjusted p-values show differences between control and mutant based on linear mixed models (see Methods). aRG, apical radial glia; DL, deep layer; UL, upper layer; PN, projection neurons; CP/CH, Choroid Plexus/Cortical Hem; oRG, outer radial glia; IPC, intermediate progenitor cells; CPN, callosal projection neurons; CFuPN, corticofugal projection neurons; GABA INP, GABAergic interneuron progenitors; GABA IN, GABAergic interneurons; GABA N, GABAergic neurons.
Extended Data Fig. 6. scATAC-seq analysis in SUV420H1+/− and isogenic control organoids.
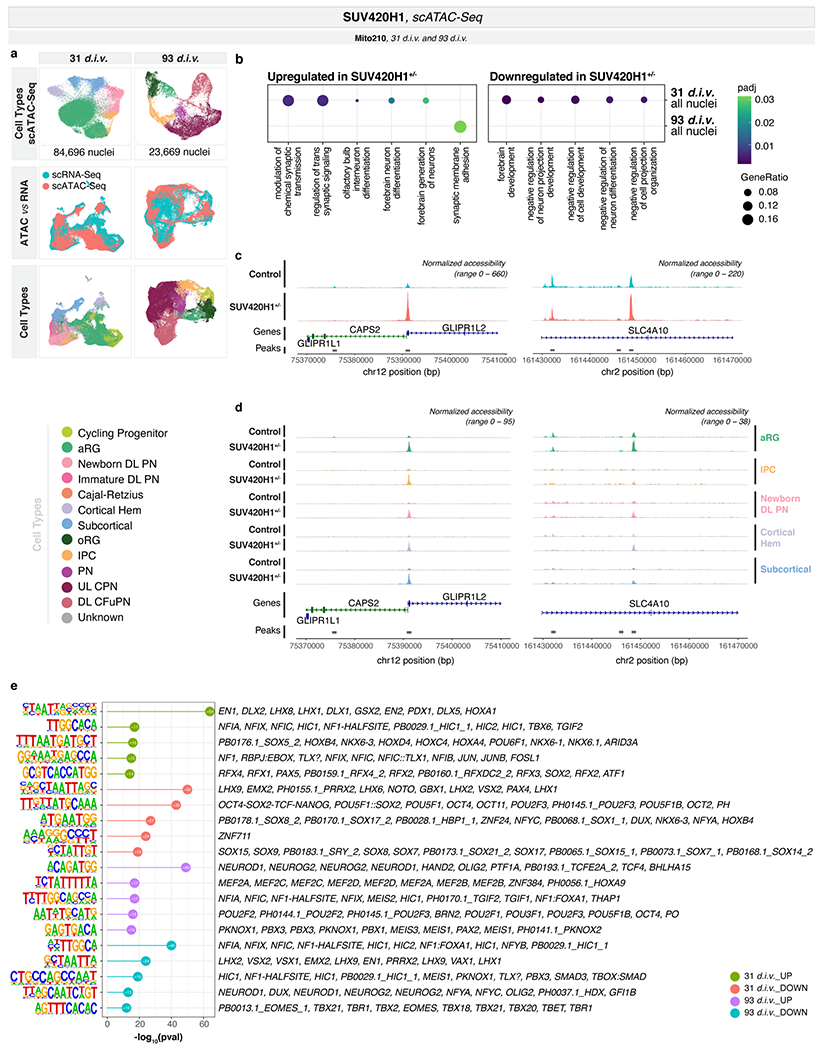
a, UMAPs of scATAC-seq data in Mito210 SUV420H1+/− and control organoids at one month (31 d.i.v., upper left) and three months (93 d.i.v., upper right), and coembedded UMAPs with scRNA-seq in Mito210 SUV420H1+/− and control organoids at one month (28 d.i.v., middle bottom left) and three months (90 d.i.v., middle bottom right). Number of nuclei per plot is indicated. b, Enriched gene ontology terms for the nearest genes to regions with increased and decreased accessibility in SUV420H1+/− compared to control organoids. c, Genome tracks showing read coverage for representative regions with increased accessibility between SUV420H1+/− and control organoids. Scales for the y axes (normalized counts) are displayed on the top right. d, Genome tracks showing read coverage for representative regions with increased accessibility between Mito210 SUV420H1+/− and control organoids, split by cell-type. Scales for the y axes (normalized counts) are displayed on the top right. e, Top 5 de novo motifs enriched in the regions with altered accessibility in Mito210 SUV420H1+/− compared to control organoids at one month (31 d.i.v.) and three months (93 d.i.v.), as calculated with HOMER (see Methods). Regions that showed increased accessibility in mutant compared to control organoids are in green and purple, while those with decreased accessibility are in red and blue. Transcription factors with known binding sites resembling the discovered motifs are shown.
Extended Data Fig. 7. Neuronal spontaneous activity in SUV420H1+/− and isogenic control organoids.
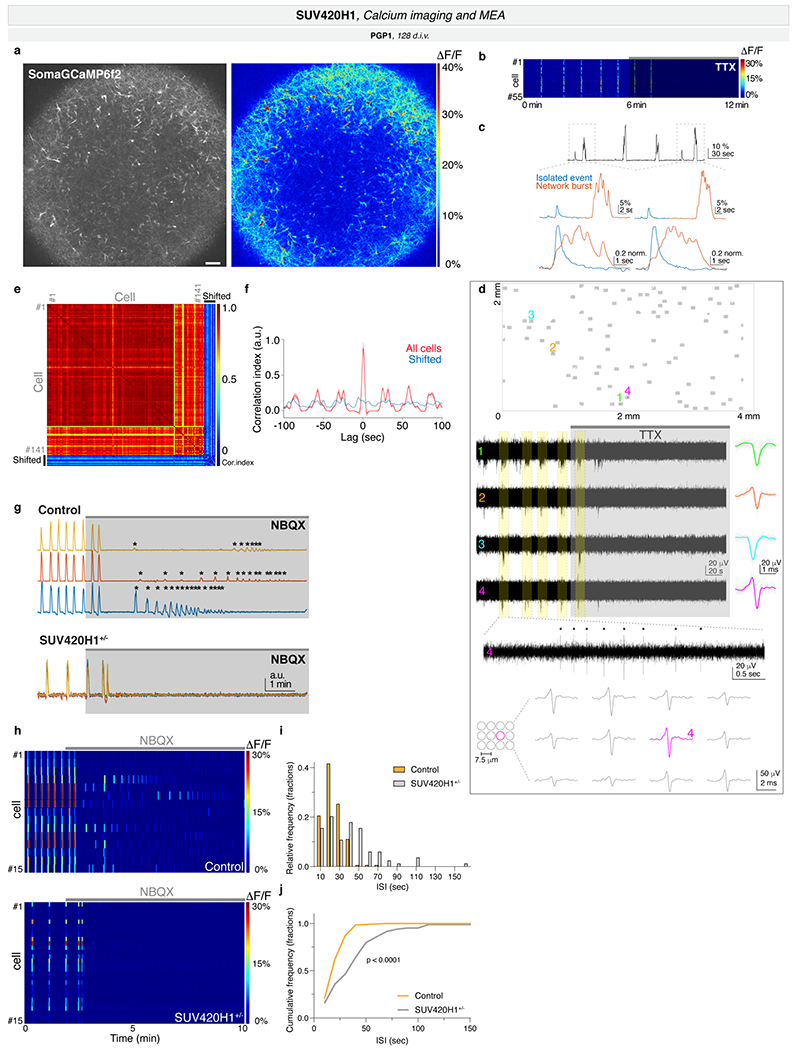
a, Left, Representative image of a PGP1 SUV420H1 organoid infected with SomaGCaMP6f2. Right, ΔF/F signal at the peak of a network burst. Scale bar: 100 μm. b, Heat map of calcium signal from individual cells (rows), showing the effect of 2 μM TTX. c, Top, representative trace of spontaneous calcium signal (corresponding to cell #3 in Fig. 1g). Bottom, high magnification traces of calcium transients, displaying the difference in amplitude between the isolated event and the network burst (top), and normalized traces (bottom) showing their kinetics and the multiple peaks of the burst signal. d, MEA recordings. Top, Spatial configuration of recording electrodes. Middle, example raw traces for the numbered electrodes shown at the top, and the effect upon 2 μM TTX application. Yellow columns indicate the network bursts. Right, individual (grey) and average (color) spike waveforms for each electrode. High magnification of the trace #4 showing the individual spikes (asterisk) during a burst event. Bottom, average spike waveform (right) in a unit of electrodes (left), extracted at the time points determined by the spikes in electrode #4. e-f, Synchronous network activity in human brain organoids. Heatmap of cross-correlation index (e) and cross-correlogram against a reference signal (cell #135) for a representative recording. As a control, the signal of 10 cells were circularly shifted by a random phase and the cross-correlation was then calculated. In f, the average value was plotted, and the synchronous activations as well as the periodic bursting can be seen (“All cells” in red). g, Effect of NBQX on neuronal activity. Representative traces for individual cells were normalized (3 traces for SUV420H1+/− are superimposed) and post-NBQX residual/isolated calcium transients are indicated by asterisks. h, Effect of NBQX on calcium signal. Heatmap of ΔF/F signal for 15 representative cells in control (top) and SUV420H1+/− (bottom) organoids. i-j, Inter-spike interval (ISI) analysis for the network bursting. Relative frequency (top) and cumulative frequency distribution (bottom) of ISI for control and SUV420H1+/− organoids. In j, two-sided Kolmogorov-Smirnov test (n = 5 organoids per genotype). Number of organoids used for each analysis can be found in the (Methods under “Statistics and reproducibility”.
Extended Data Fig. 8. Cell-type composition, full pseudotime trajectories, and gene modules of ARID1B+/− and isogenic control organoids.
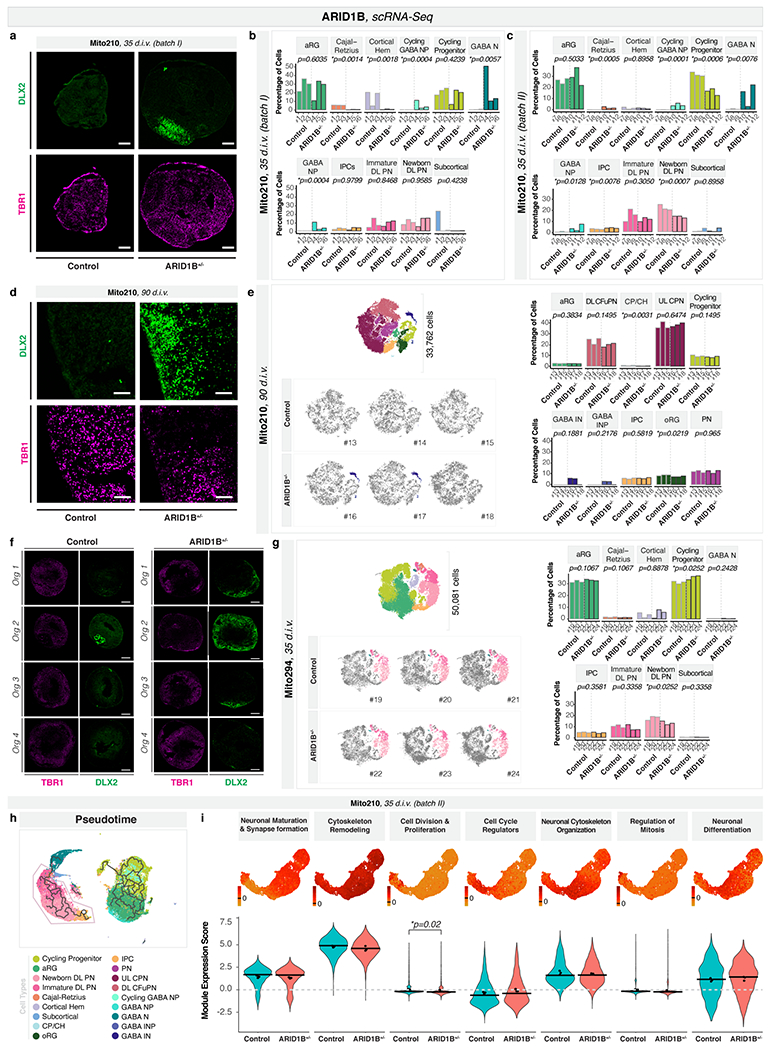
a, Immunohistochemistry for the postmitotic excitatory neuronal marker TBR1 (magenta) and GABAergic marker DLX2 (green) in Mito210 control and ARID1B+/− organoids at one month (35 d.i.v.). Scale bars: 200 μm. b-c, scRNA-seq data from Mito210 one month (35 d.i.v. batch I in b, batch II in c) control and ARID1B+/− organoids. Bar charts show the percentage of cells for all the cell populations in each control and mutant organoid. Adjusted p-values for a difference in cell-type proportions between control and mutant, based on logistic mixed models (see Methods) are shown. d, Immunohistochemistry for TBR1 (magenta) and DLX2 (green) in Mito210 control and ARID1B+/− organoids at three months (90 d.i.v.). Scale bars: 100 μm. e, scRNA-seq data from Mito210 three months (90 d.i.v.) control and ARID1B+/− organoids. Left top shows combined t-SNE plots of control and mutant organoids (n = 3 single organoids per genotype). Cells are colored by cell-type, and the number of cells per plot is indicated. Left bottom, t-SNE plots for control and mutant individual organoids. GABAergic interneurons are highlighted in color. Left, bar charts show the percentage of cells for all the cell populations in each control and mutant organoid, as shown in b-c. Two out of three mutant organoids show an increase in GABAergic interneurons, vs. zero out of three controls (adjusted p = 0.19, logistic mixed models). f, Immunohistochemistry for the postmitotic excitatory neuronal marker TBR1 (magenta) and GABAergic marker DLX2 (green) in Mito210 control and ARID1B+/− organoids at three months (90 d.i.v.). Three out of four mutant organoids contain DLX2-positive cells, while no DLX2 expression is detected in the four controls. Scale bars: 500 μm. g, scRNA-seq data from Mito294 one month (35 d.i.v.) ARID1B+/− and control organoids. Left top shows combined t-SNE plots of control and mutant organoids (n = 3 single organoids per genotype). Cells are colored by cell type, and the number of cells per plot is indicated. Left bottom, t-SNE plots for control and mutant individual organoids. GABAergic neurons, newborn deep-layer projection neurons and immature deep-layer projection neuron populations are highlighted in color. Right, bar charts show the percentage of cells for all the cell populations in each control and mutant organoid, as in b-c. h, Pseudotime trajectories from the full dataset of Mito210 ARID1B+/− 35 d.i.v. batch II and control organoids, calculated with Monocle3. The partition highlighted by a box was subsetted and the trajectory is shown in Fig. 2c. i, Module scores (top) and their distribution across mutant and control cells (bottom) for all modules resulting from WGCNA analysis of the partition of interest from Mito210 ARID1B1+/− and control organoids at 35 d.i.v. Cells were downsampled to have an equal number of cells per organoid. Names were assigned to each module based on the known functions of the genes included in each one. Horizontal bars show median scores, and dots show average score per organoid. Adjusted p-values show differences between control and mutant based on linear mixed models (see Methods). Number of organoids used for each analysis can be found in the (Methods under “Statistics and reproducibility”. aRG, apical radial glia; DL, deep layer; UL, upper layer; PN, projection neurons; CP/CH, Choroid Plexus/Cortical Hem; oRG, outer radial glia; IPC, intermediate progenitor cells; CPN, callosal projection neurons; CFuPN, corticofugal projection neurons; GABA NP, GABAergic neuron progenitors; GABA N, GABAergic neurons; GABA INP; GABAergic interneuron progenitors; GABA IN, GABAergic interneurons.
Extended Data Fig. 9. Cell-type composition, immunohistochemistry, and full pseudotime trajectories and gene modules of CHD8+/− and isogenic control HUES66 organoids.
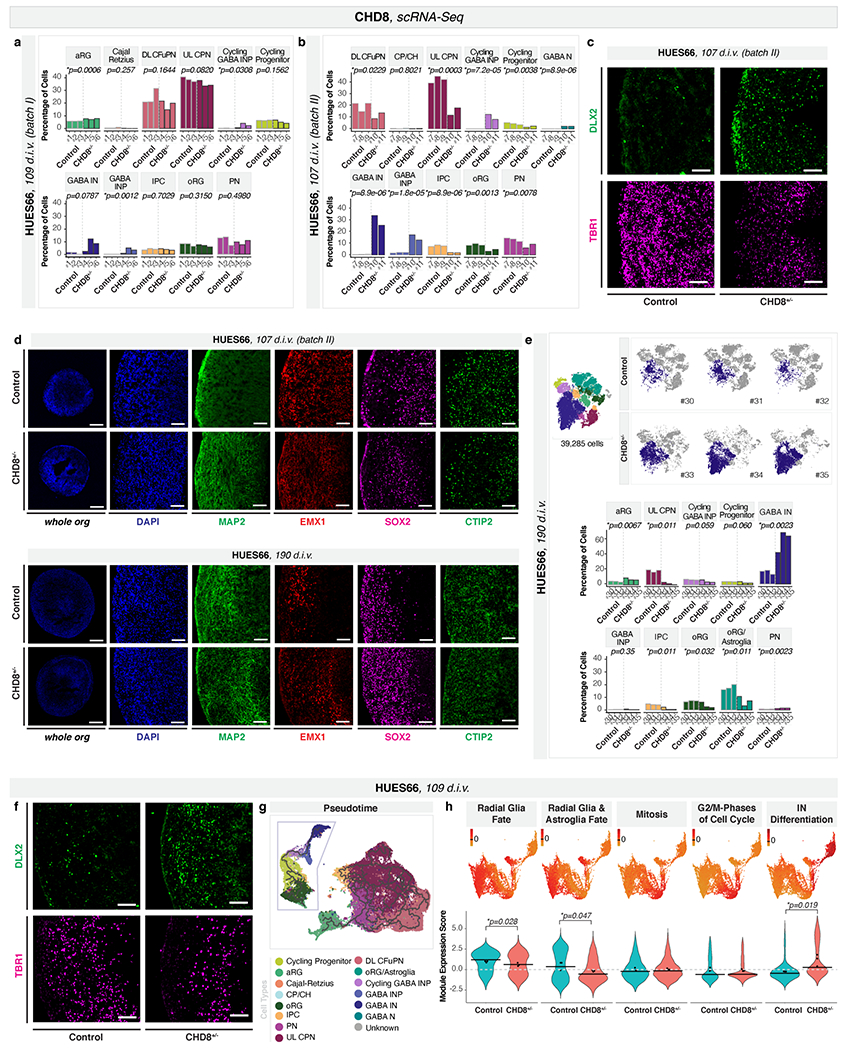
a-b, scRNA-seq data from HUES66 3.5-month (109 d.i.v. (a), batch I and 107 d.i.v. (b). batch II) CHD8+/− and control organoids. Bar charts show the percentage of cells for all the cell populations in each control and mutant organoid. Adjusted p-values for a difference in cell-type proportions between control and mutant, based on logistic mixed models (see Methods) are shown. c, Immunohistochemistry for the postmitotic excitatory neuronal marker TBR1 (magenta) and GABAergic marker DLX2 (green) in HUES66 control and CHD8+/− organoids at 3.5 months (107 d.i.v.). Scale bars: 100 μm. d, Immunohistochemistry for neuronal (MAP2), dorsal forebrain neural progenitor (EMX1, SOX2) and CFuPN (CTIP2) markers in HUES66 CHD8+/− and control organoids at 3.5 months (107 d.i.v., top), and six months (190 d.i.v., bottom). Scale bars: whole organoids, 500 μm; others, 100 μm. e, scRNA-seq data from HUES66 CHD8+/− and control organoids at six months (190 d.i.v.). Top left shows combined t-SNE plots of control and mutant organoids (n = 3 single organoids per genotype). Cells are colored by cell-type, and the number of cells per plot is indicated. Top right, t-SNE plots for control and mutant individual organoids. GABAergic interneurons are highlighted in color. Bottom, bar charts show the percentage of cells for all the cell populations in each control and mutant organoid, as in a-b. f, Immunohistochemistry for the post mitotic neuronal marker TBR1 (magenta) and GABAergic marker DLX2 (green) in HUES66 control and CHD8+/− organoids at six months (190 d.i.v.). Scale bars: 100 μm. g, Pseudotime trajectories from the full dataset of HUES66 batch I CHD8+/− and control organoids at 109 d.i.v., calculated with Monocle3. The partition highlighted by a box was subsetted and the trajectory is shown in Fig. 3c. h, Module scores (top) and their distribution across mutant and control cells (bottom) for all modules resulting from WGCNA analysis of the partition of interest from HUES66 CHD8+/− and control organoids at 109 d.i.v. Cells were downsampled to have an equal number of cells per organoid. Names were assigned to each module based on the known functions of the genes included in each one. Horizontal bars show median scores, and dots show average score per organoid. Adjusted p-values show differences between control and mutant based on linear mixed models (see Methods). Number of organoids used for each analysis can be found in the (Methods under “Statistics and reproducibility”. aRG, apical radial glia; DL, deep layer; UL, upper layer; PN, projection neurons; oRG, outer radial glia; IPC, intermediate progenitor cells; CPN, callosal projection neurons; CFuPN, corticofugal projection neurons; GABA INP, GABAergic interneuron progenitors; GABA IN, GABAergic interneurons.
Extended Data Fig. 10. Bulk RNA-seq and scRNA-seq of CHD8+/− and isogenic control organoids from multiple cell lines.
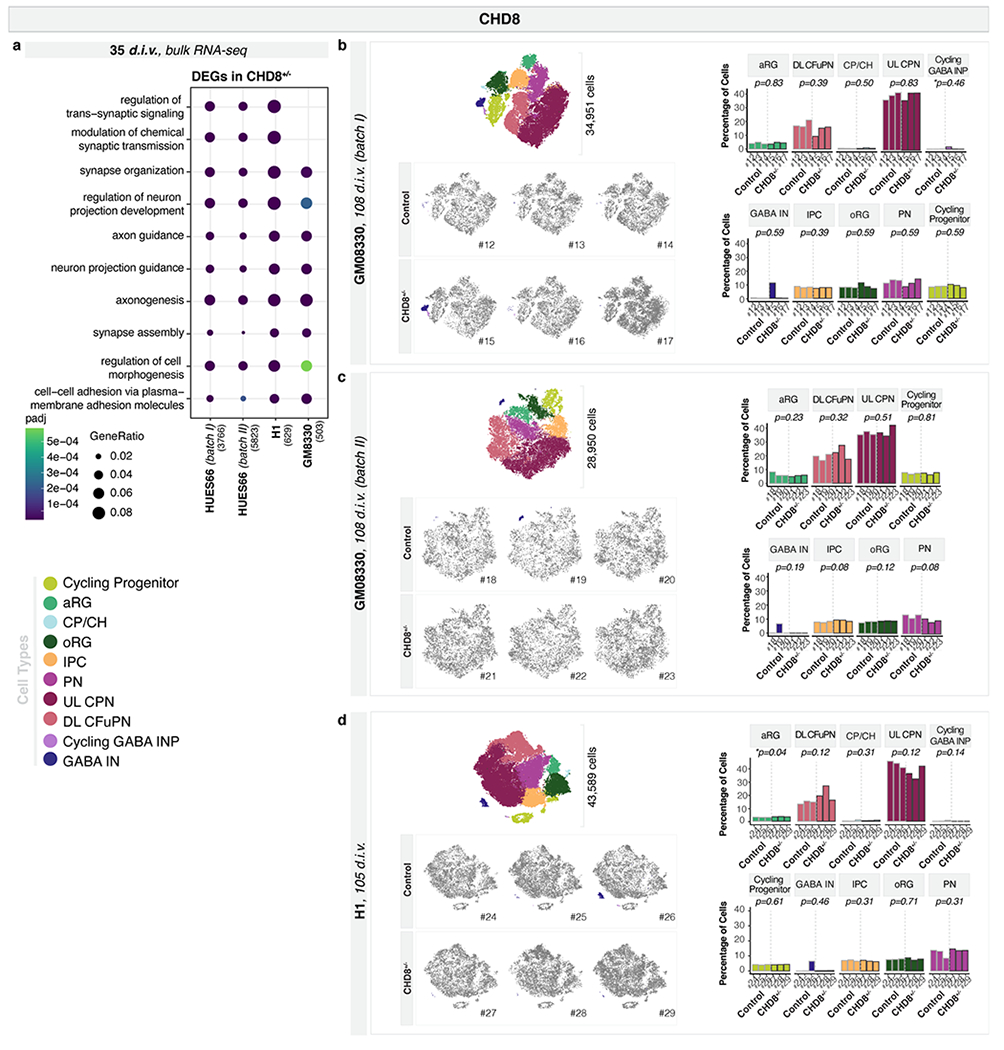
a, Bulk RNA-seq data from HUES66, GM83330 and H1 35 d.i.v. organoids. Enriched gene ontology terms for genes differentially expressed in CHD8+/− vs. control organoids. The top 5 most significant terms per dataset are shown. Size of dot indicates the proportion of genes belonging to each term found in the list of dysregulated genes (“GeneRatio”). Color indicates enrichment adjusted p-value. Numbers in parentheses along the y axis indicate the number of differentially expressed genes in that dataset. b-d, scRNA-seq data from control and CHD8+/− organoids at 3.5 months (GM83330 108 d.i.v., batch I (b), GM83330 108 d.i.v., batch II (c) and H1 105 d.i.v. (d)). Left top shows combined t-SNE plots of control and mutant organoids (n = 3 single organoids per genotype). Cells are colored by cell type, and the number of cells per plot is indicated. Left bottom, t-SNE plots for control and mutant individual organoids. GABAergic interneurons are highlighted in color. Right, bar charts show the percentage of cells for all the cell populations in each control and mutant organoid. Adjusted p-values for a difference in cell-type proportions between control and mutant, based on logistic mixed models (see Methods) are shown. aRG, apical radial glia; DL, deep layer; UL, upper layer; PN, projection neurons; CP/CH, Choroid Plexus/Cortical Hem; oRG, outer radial glia; IPC, intermediate progenitor cells; CPN, callosal projection neurons; CFuPN, corticofugal projection neurons; GABA INP, GABAergic interneuron progenitors; GABA IN, GABAergic interneurons; GABA N, GABAergic neurons.
Extended Data Fig. 11. Convergent differential expressed genes for the three mutations.
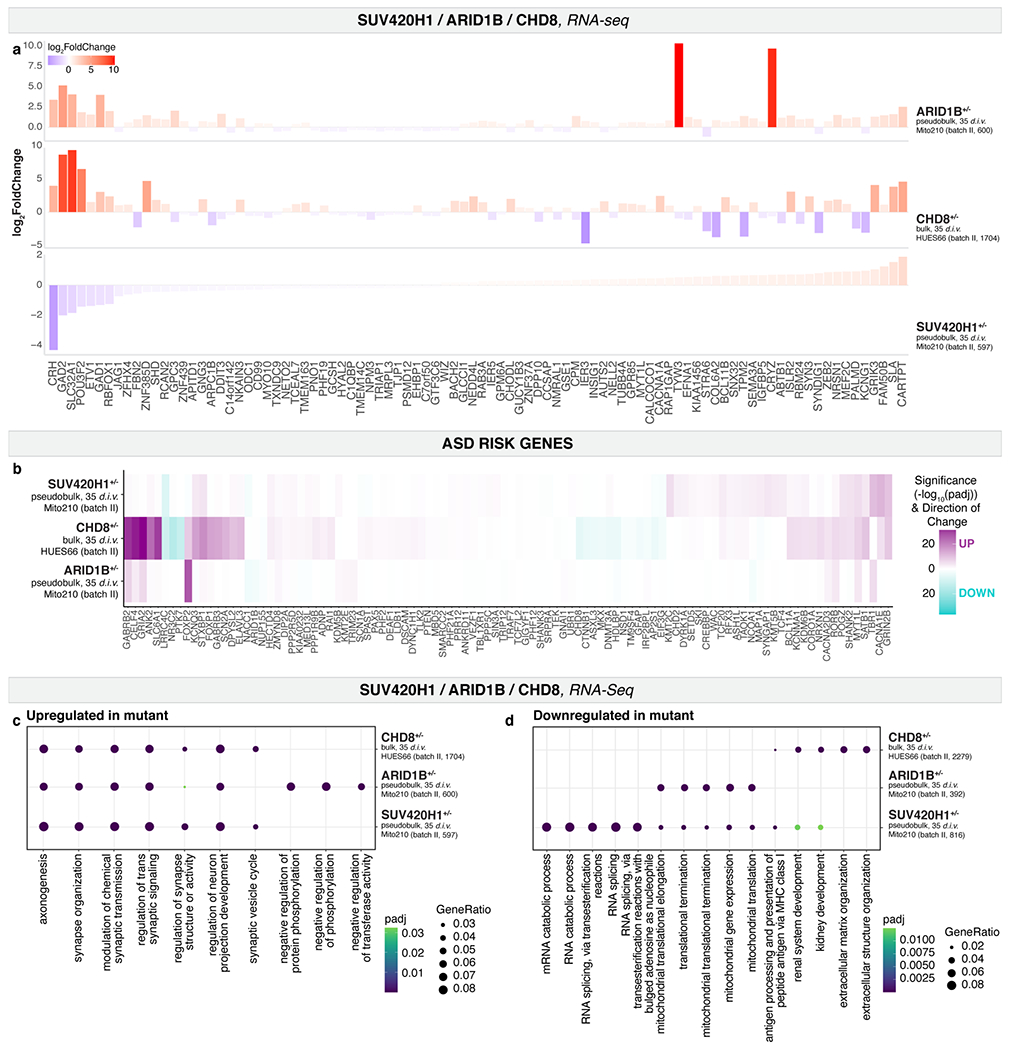
a, Log fold change of all genes which showed significant change (adjusted p < 0.05) in all three of the 1 month datasets: Mito210 SUV420H1+/− 35 d.i.v., Mito210 ARID1B+/− 35 d.i.v., and HUES66 CHD8+/− 35 d.i.v. Differentially expressed genes were calculated using all cells as a pseudobulk for Mito210 SUV420H1+/− and Mito210 ARID1B+/−. b, Differential expression of all 102 genes associated with ASD risk5 in the three datasets Mito210 SUV420H1+/− 35 d.i.v., Mito210 ARID1B+/− 35 d.i.v. and in HUES66 CHD8+/− 35 d.i.v. compared to relative controls. Expression of risk genes was calculated using all cells (pseudobulk) for Mito210 SUV420H1+/− and Mito210 ARID1B+/−. Boxes are colored according to −log10(adjusted p value) according to whether they are upregulated (purple), or downregulated (turquoise) in mutant vs. control. Genes are ordered according to hierarchical clustering (using Euclidean distance) of those values. c-d, Enriched gene ontology terms for genes upregulated (c) and downregulated (d) in mutant vs. control. Genes were calculated using the cells as in a-b. The top 5 most significant terms per dataset are shown. Size of dot indicates the proportion of genes belonging to each term found in the list of dysregulated genes (“GeneRatio”). Color indicates enrichment adjusted p-value. Numbers in parentheses along the x axis indicate the number of differentially expressed genes in that dataset.
Extended Data Fig. 12. Convergent differentially expressed proteins for the three mutations.
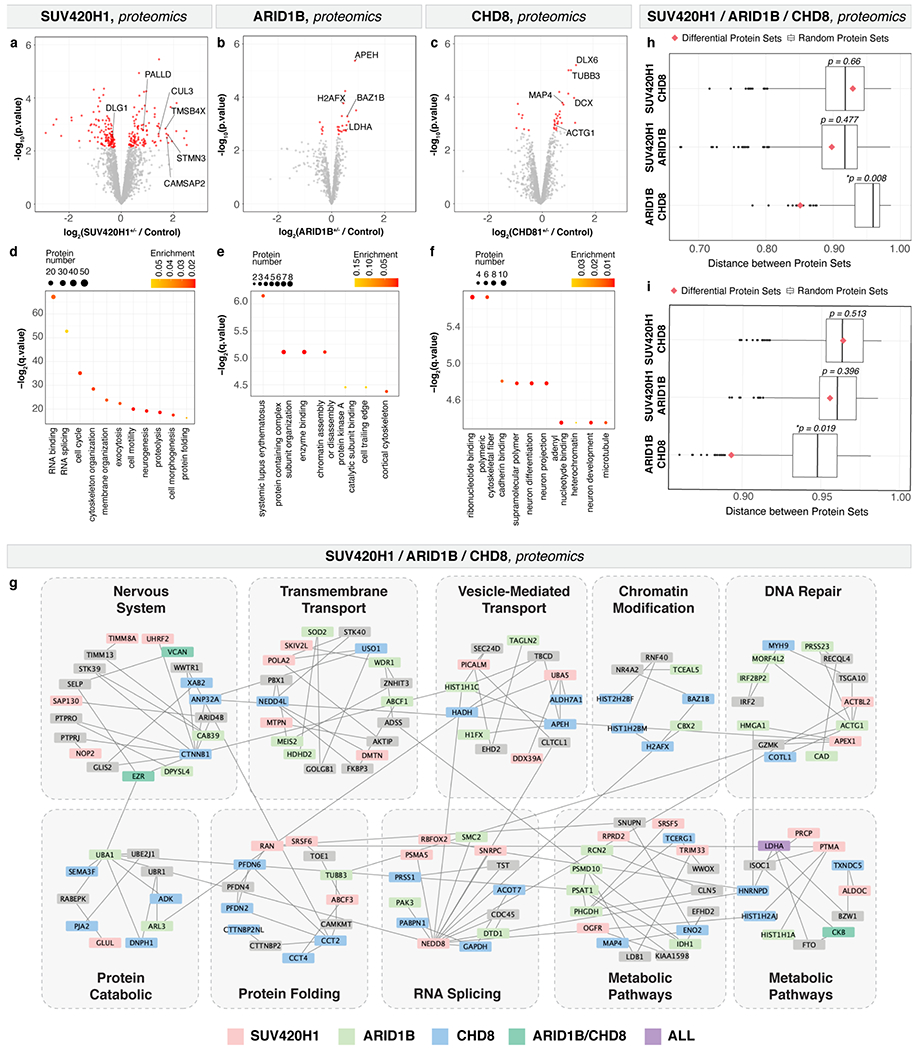
a-c, Volcano plot showing fold change versus adjusted p-value of measured proteins in MS experiments on Mito210 SUV420H1+/− (a), Mito210 ARID1B+/− (b), and HUES66 CHD8+/− (c) vs. control organoids at 35 d.i.v. (n = 4 single organoids per genotype for SUV420H1, 4 controls and 5 mutants for ARID1B, and n = 3 single organoids per genotype for CHD8). To detect statistically significant differential protein abundance between conditions a moderated t-test was performed (see Methods, FDR threshold of 0.1). Significant DEPs are shown in red (FDR < 0.1). d-f, Selected enriched gene ontology terms for DEPs in Mito210 SUV420H1+/− (d), Mito210 ARID1B+/− (e), and HUES66 CHD8+/− (f) vs. control organoids cultured for 35 d.i.v. GO terms and KEGG pathways were calculated using the GSEA software (see Methods) and FDR q-values < 0.05 were considered statistically significant. g, Protein-protein interaction network using the top 50 DEPs from the three sets of mutant versus control organoids, created using the prize-collecting Steiner forest algorithm (see Methods). Protein nodes are colored by the mutant in which they were differentially expressed. Gray nodes indicate “Steiner nodes”, proteins that did not result from any screen but were included by the algorithm to connect DEPs. Lines between nodes indicate physical protein-protein interactions from the STRING database, where line thickness correlates with interaction confidence. Subclusters of the network and significantly enriched terms for those subclusters are highlighted with gray rectangles and black text. h, Protein set distances between pairs of differentially expressed protein sets. For each pair of mutations, a PPI-weighted protein set distance was calculated between all significant DEPs (FDR < 0.1, pink diamond). To determine if this distance was smaller than would be expected by chance, size-matched sets were randomly chosen from the proteins detected in each experiment, and distance between these random sets was calculated 1000 times per pair. P-values were assigned by counting the fraction of times this random distance was less than the actual distance value between differential sets. Lower and upper hinges correspond to the first and third quartiles (the 25th and 75th percentiles) and middle hinge is the median (50th). Both whiskers extends from the hinge to the largest or smallest value no further than 1.5 * IQR from the hinge (where IQR is the inter-quartile range, or distance between the first and third quartiles). i, Protein set distances between the top 50 DEPs per mutation. For each pair of mutations, a PPI-weighted protein set distance was calculated as in h. Number of organoids used for the analyzes are summarized in the (Methods under “Statistics and reproducibility”. DEPs: differentially expressed proteins. MS: mass spectrometry.
Extended Data Fig. 13. Mutations in ASD Risk Genes in Human Brain Organoids Converge on Asynchronous Development of Shared Neuronal Classes.
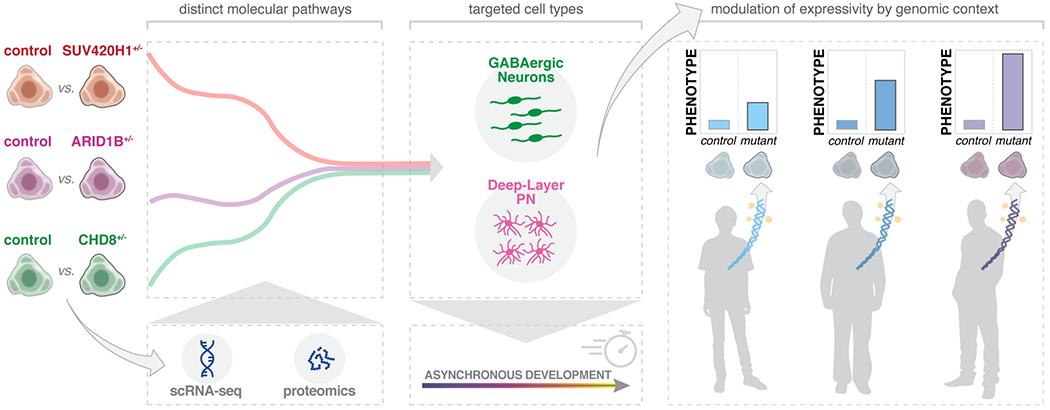
Conceptual schematics highlighting main results.
Supplementary Material
Acknowledgements
We thank J. R. Brown (from the P.A. laboratory) for assistance in editing the manuscript and the entire Arlotta Lab for insightful discussions; M. Daly, E. Robinson and B. Neale for insightful discussions on autism genetics; T. Nguyen (from G.Q. laboratory) for outstanding support with organoid generation; X. Jin (from the P.A. laboratory) for helping with designing and sequencing of edited lines; A. Shetty (from the P.A. laboratory) for help with scRNA-seq cell type classification; N. Haywood for help with scRNA-seq experiments; D. Di Bella (from P.A. laboratory) for help with final edits of the manuscript; S. Andreadis and S. Getz (from the P.A. laboratory) for help with editing images; F. Zhang and J. Pan for supporting the creation of the HUES66 CHD8 mutant line; the Talkowski laboratory for the GM08330 line; the Cohen laboratory for the Mito210 line; the Ricci laboratory for providing nanoblades for the generation of SUV420H1 edited cell lines; L.M. Daheron at the Harvard Stem Cell Facility for expanding edited lines; and B. Budnik at the Harvard Center for Mass Spectrometry for assisting with proteomics experiments. This work was supported by grants from the Stanley Center for Psychiatric Research, the Broad Institute of MIT and Harvard, the National Institutes of Health (R01-MH112940 to P.A. and J.Z.L.; P50MH094271, U01MH115727, and 1RF1MH123977 to P.A.), the Klarman Cell Observatory to J.Z.L. and A.R., and the Howard Hughes Medical Institute to A.R. The HUES66 CHD8 mutant line was created with support from the Simons Foundation (#346073 to F. Zhang) and the National Institutes of Health (MH099448 to J. Pan).
Footnotes
Reporting summary
Further information on research design is available in the Nature Research Reporting Summary linked to this paper.
Code availability
The code used for data analysis is available on GitHub at https://github.com/AmandaKedaigle/mutated-brain-organoids.
Competing Interest Statement
P.A. is a SAB member at System 1 Biosciences and Foresite Labs, and is a co-founder of Serqet. A.R. is a founder and equity holder of Celsius Therapeutics, an equity holder in Immunitas Therapeutics and until August 31, 2020 was a SAB member of Syros Pharmaceuticals, Neogene Therapeutics, Asimov and Thermo Fisher Scientific. From August 1, 2020, A.R. is an employee of Genentech. N.E.S. is an advisor to Vertex and Qiagen.
Supplementary Information is available for this paper. Correspondence and request for materials should be addressed to P.A. and S.V. Reprints and permissions information is available at www.nature.com/reprints.
Data availability
Read-level data from scRNA-seq and scATAC-seq, along with proteomics data, that support the findings of this study have been deposited in a controlled access repository at https://www.synapse.org with accession number project ID syn26346373, while count-level data and metadata have been deposited at the Single Cell Portal (https://singlecell.broadinstitute.org/single_cell/study/SCP1129). The electrophysiology materials and data are available upon request.
Public data used in this paper includes the GRCh38 human reference genome and the EnsDb.Hsapiens.v86 annotation package.
References
- 1.Rosenberg RE et al. Characteristics and concordance of autism spectrum disorders among 277 twin pairs. Arch Pediatr Adolesc Med 163, 907–914 (2009). [DOI] [PubMed] [Google Scholar]
- 2.Sanders SJ et al. De novo mutations revealed by whole-exome sequencing are strongly associated with autism. Nature 485, 237–241 (2012). [DOI] [PMC free article] [PubMed] [Google Scholar]
- 3.Ruzzo EK et al. Inherited and De Novo Genetic Risk for Autism Impacts Shared Networks. Cell 178, 850–866.e26 (2019). [DOI] [PMC free article] [PubMed] [Google Scholar]
- 4.Grove J et al. Identification of common genetic risk variants for autism spectrum disorder. Nat Genet 51, 431–444 (2019). [DOI] [PMC free article] [PubMed] [Google Scholar]
- 5.Satterstrom FK et al. Large-Scale Exome Sequencing Study Implicates Both Developmental and Functional Changes in the Neurobiology of Autism. Cell 180, 568–584.e23 (2020). [DOI] [PMC free article] [PubMed] [Google Scholar]
- 6.Cooper D, Krawczak M, Polychronakos C, Tyler-Smith C & Kehrer-Sawatzki H Where genotype is not predictive of phenotype: towards an understanding of the molecular basis of reduced penetrance in human inherited disease. Human genetics 132, 1077–1130 (2013). [DOI] [PMC free article] [PubMed] [Google Scholar]
- 7.Zlotogora J Penetrance and expressivity in the molecular age. Genetics in medicine: official journal of the American College of Medical Genetics 5, 347–352 (2003). [DOI] [PubMed] [Google Scholar]
- 8.Lord C et al. Autism spectrum disorder. Nat Rev Dis Primers 6, 5 (2020). [DOI] [PMC free article] [PubMed] [Google Scholar]
- 9.Velasco S et al. Individual brain organoids reproducibly form cell diversity of the human cerebral cortex. Nature 570, (2019). [DOI] [PMC free article] [PubMed] [Google Scholar]
- 10.de Rubeis S et al. Synaptic, transcriptional and chromatin genes disrupted in autism. Nature 515, 209–215 (2014). [DOI] [PMC free article] [PubMed] [Google Scholar]
- 11.Stessman HAF et al. Targeted sequencing identifies 91 neurodevelopmental-disorder risk genes with autism and developmental-disability biases. Nature Genetics 49, 515–526 (2017). [DOI] [PMC free article] [PubMed] [Google Scholar]
- 12.Yuen RKC et al. Whole genome sequencing resource identifies 18 new candidate genes for autism spectrum disorder. Nature Neuroscience 20, 602–611 (2017). [DOI] [PMC free article] [PubMed] [Google Scholar]
- 13.Sanders SJ et al. Insights into Autism Spectrum Disorder Genomic Architecture and Biology from 71 Risk Loci. Neuron 87, 1215–1233 (2015). [DOI] [PMC free article] [PubMed] [Google Scholar]
- 14.Bernier R et al. Disruptive CHD8 mutations define a subtype of autism early in development. Cell 158, 263–276 (2014). [DOI] [PMC free article] [PubMed] [Google Scholar]
- 15.Faundes V et al. Histone Lysine Methylases and Demethylases in the Landscape of Human Developmental Disorders. Am J Hum Genet 102, 175–187 (2018). [DOI] [PMC free article] [PubMed] [Google Scholar]
- 16.Vais M et al. Coffin-Siris Syndrome with obesity, macrocephaly, hepatomegaly and hyperinsulinism caused by a mutation in the ARID1B gene. European journal of human genetics: EJHG 22, 1327–1329 (2014). [DOI] [PMC free article] [PubMed] [Google Scholar]
- 17.Lodato S & Arlotta P Generating neuronal diversity in the mammalian cerebral cortex. Annu Rev Cell Dev Biol 31, 699–720 (2015). [DOI] [PMC free article] [PubMed] [Google Scholar]
- 18.Greig LC, Woodworth ΜB, Galazo MJ, Padmanabhan H & Macklis JD Molecular logic of neocortical projection neuron specification, development and diversity. Nat Rev Neurosci 14, 755–769 (2013). [DOI] [PMC free article] [PubMed] [Google Scholar]
- 19.Langfelder P & Horvath S WGCNA: an R package for weighted correlation network analysis. BMC Bioinformatics 9, 559 (2008). [DOI] [PMC free article] [PubMed] [Google Scholar]
- 20.Wickramasekara RN & Stessman HAF Histone 4 Lysine 20 Methylation: A Case for Neurodevelopmental Disease. Biology 8, 11 (2019). [DOI] [PMC free article] [PubMed] [Google Scholar]
- 21.Garaschuk O, Linn J, Eilers J & Konnerth A Large-scale oscillatory calcium waves in the immature cortex. Nature Neuroscience 2000 3:5 3, 452–459 (2000). [DOI] [PubMed] [Google Scholar]
- 22.Adelsberger H, Garaschuk O & Konnerth A Cortical calcium waves in resting newborn mice. Nature Neuroscience 2005 8:8 8, 988–990 (2005). [DOI] [PubMed] [Google Scholar]
- 23.Wang Z-J et al. Autism risk gene KMT5B deficiency in prefrontal cortex induces synaptic dysfunction and social deficits via alterations of DNA repair and gene transcription. Neuropsychopharmacology 2021 46:9 46, 1617–1626 (2021). [DOI] [PMC free article] [PubMed] [Google Scholar]
- 24.Villa CE et al. CHD8 haploinsufficiency alters the developmental trajectories of human excitatory and inhibitory neurons linking autism phenotypes with transient cellular defects. bioRxiv 2020.11.26.399469 (2020). [Google Scholar]
- 25.Wang P et al. CRISPR/Cas9-mediated heterozygous knockout of the autism gene CHD8 and characterization of its transcriptional networks in cerebral organoids derived from iPS cells. Mol Autism 8, 11 (2017). [DOI] [PMC free article] [PubMed] [Google Scholar]
- 26.Tuncbag N et al. Network-Based Interpretation of Diverse High-Throughput Datasets through the Omics Integrator Software Package. PLoS Computational Biology 12, (2016). [DOI] [PMC free article] [PubMed] [Google Scholar]
- 27.Szklarczyk D et al. STRING v11: protein-protein association networks with increased coverage, supporting functional discovery in genome-wide experimental datasets. Nucleic Acids Res 47, D607–d613 (2019). [DOI] [PMC free article] [PubMed] [Google Scholar]
- 28.Rubenstein JLR & Merzenich MM Model of autism: increased ratio of excitation/inhibition in key neural systems. Genes, Brain and Behavior 2, 255–267 (2003). [DOI] [PMC free article] [PubMed] [Google Scholar]
- 29.Gogolla N et al. Common circuit defect of excitatory-inhibitory balance in mouse models of autism. Journal of neurodeveiopmentai disorders 1, 172–181 (2009). [DOI] [PMC free article] [PubMed] [Google Scholar]
- 30.Dani VS et al. Reduced cortical activity due to a shift in the balance between excitation and inhibition in a mouse model of Rett syndrome. Proc Natl Acad Sci U S A 102, 12560–12565 (2005). [DOI] [PMC free article] [PubMed] [Google Scholar]
- 31.Mariani J et al. FOXG1-Dependent Dysregulation of GABA/Glutamate Neuron Differentiation in Autism Spectrum Disorders. Cell 162, 375–390 (2015). [DOI] [PMC free article] [PubMed] [Google Scholar]
- 32.Marchetto MC et al. Altered proliferation and networks in neural cells derived from idiopathic autistic individuals. Mol Psychiatry 22, 820–835 (2017). [DOI] [PMC free article] [PubMed] [Google Scholar]
- 33.Adhya D et al. Atypical Neurogenesis in Induced Pluripotent Stem Cells From Autistic Individuals. Biol Psychiatry (2020). [DOI] [PMC free article] [PubMed] [Google Scholar]
- 34.Wade AA, Lim K, Catta-Preta R & Nord AS Common CHD8 genomic targets contrast with model-specific transcriptional impacts of CHD8 haploinsufficiency. Frontiers in Molecular Neuroscience 11, (2019). [DOI] [PMC free article] [PubMed] [Google Scholar]
- 35.Moffat JJ, Smith AL, Jung EM, Ka M & Kim WY Neurobiology of ARID1B haploinsufficiency related to neurodeveiopmentai and psychiatric disorders. Molecular Psychiatry (2021). [DOI] [PMC free article] [PubMed] [Google Scholar]
- 36.Velmeshev D et al. Single-cell genomics identifies cell type-specific molecular changes in autism. Science vol. 364 (2019). [DOI] [PMC free article] [PubMed] [Google Scholar]
- 37.Willsey AJ et al. Coexpression networks implicate human midfetal deep cortical projection neurons in the pathogenesis of autism. Cell 155, 997 (2013). [DOI] [PMC free article] [PubMed] [Google Scholar]
- 38.Bourgeron T From the genetic architecture to synaptic plasticity in autism spectrum disorder. Nature reviews. Neuroscience 16, 551–563 (2015). [DOI] [PubMed] [Google Scholar]
Methods References
- 39.Chen AE et al. Optimal timing of inner cell mass isolation increases the efficiency of human embryonic stem cell derivation and allows generation of sibling cell lines. Cell stem cell 4, 103–106 (2009). [DOI] [PMC free article] [PubMed] [Google Scholar]
- 40.Church GM The personal genome project. Molecular systems biology 1, 2005.0030–2005.0030 (2005). [DOI] [PMC free article] [PubMed] [Google Scholar]
- 41.Velasco S, Paulsen B & Arlotta P Highly reproducible human brain organoids recapitulate cerebral cortex cellular diversity. Protocol Exchange (2019). [Google Scholar]
- 42.Lovell-Badge R et al. ISSCR Guidelines for Stem Cell Research and Clinical Translation: The 2021 update. Stem Cell Reports 16, 1398–1408 (2021). [DOI] [PMC free article] [PubMed] [Google Scholar]
- 43.Doench JG et al. Rational design of highly active sgRNAs for CRISPR-Cas9–mediated gene inactivation. Nature Biotechnology 32, 1262–1267 (2014). [DOI] [PMC free article] [PubMed] [Google Scholar]
- 44.Hsu PD et al. DNA targeting specificity of RNA-guided Cas9 nucleases. Nature Biotechnology 31, 827–832 (2013). [DOI] [PMC free article] [PubMed] [Google Scholar]
- 45.Mangeot PE et al. Genome editing in primary cells and in vivo using viral-derived Nanoblades loaded with Cas9-sgRNA ribonucleoproteins. Nature Communications 10, 45 (2019). [DOI] [PMC free article] [PubMed] [Google Scholar]
- 46.Park Y-G et al. Protection of tissue physicochemical properties using polyfunctional crosslinkers. Nature Biotechnology 37, 73–83 (2019). [DOI] [PMC free article] [PubMed] [Google Scholar]
- 47.Schneider CA, Rasband WS & Eliceiri KW NIH Image to ImageJ: 25 years of image analysis. Nat Methods 9, 671–675 (2012). [DOI] [PMC free article] [PubMed] [Google Scholar]
- 48.Ohgane K Quantification of Gel Bands by an Image J Macro, Band/Peak Quantification Tool. (2019). [Google Scholar]
- 49.Pachitariu M et al. Suite2p: beyond 10,000 neurons with standard two-photon microscopy. bioRxiv 061507 (2017). [Google Scholar]
- 50.Müiller J et al. High-resolution CMOS MEA platform to study neurons at subcellular, cellular, and network levels. Lab on a Chip 15, 2767–2780 (2015). [DOI] [PMC free article] [PubMed] [Google Scholar]
- 51.Ostasiewicz P, Zielinska DF, Mann M & Wisniewski JR Proteome, phosphoproteome, and N-glycoproteome are quantitatively preserved in formalin-fixed paraffin embedded tissue and analyzable by high-resolution mass spectrometry. J Proteome Res. 9(7): 3688–700 (2010). [DOI] [PubMed] [Google Scholar]
- 52.Wiśniewski JR Quantitative Evaluation of Filter Aided Sample Preparation (FASP) and Multienzyme Digestion FASP Protocols. Analytical Chemistry 88, 5438–5443 (2016). [DOI] [PubMed] [Google Scholar]
- 53.Bairoch A & Apweiler R The SWISS-PROT protein sequence data bank and its supplement TrEMBL in 1999. Nucleic Acids Res 27, 49–54 (1999). [DOI] [PMC free article] [PubMed] [Google Scholar]
- 54.Consortium TU UniProt: a worldwide hub of protein knowledge. Nucleic Acids Research 47, D506–D515 (2018). [DOI] [PMC free article] [PubMed] [Google Scholar]
- 55.Käil L, Storey JD, MacCoss MJ & Noble WS Posterior error probabilities and false discovery rates: two sides of the same coin. J Proteome Res 7, 40–44 (2008). [DOI] [PubMed] [Google Scholar]
- 56.Zhang X et al. Proteome-wide identification of ubiquitin interactions using UblA-MS. Nature Protocols 13, 530–550 (2018). [DOI] [PubMed] [Google Scholar]
- 57.Ritchie ΜE et al. limma powers differential expression analyses for RNA-sequencing and microarray studies. Nucleic acids research 43, e47 (2015). [DOI] [PMC free article] [PubMed] [Google Scholar]
- 58.Subramanian A et al. Gene set enrichment analysis: A knowledge-based approach for interpreting genome-wide expression profiles. Proceedings of the National Academy of Sciences 102, 15545–15550 (2005). [DOI] [PMC free article] [PubMed] [Google Scholar]
- 59.Tuncbag N et al. Simultaneous reconstruction of multiple signaling pathways via the prize-collecting steiner forest problem. Journal of computational biology 20, 124–36 (2013). [DOI] [PMC free article] [PubMed] [Google Scholar]
- 60.Akhmedov M et al. PCSF: An R-package for network-based interpretation of high-throughput data. PLoS Computational Biology 13, (2017). [DOI] [PMC free article] [PubMed] [Google Scholar]
- 61.Shannon P et al. Cytoscape: A software Environment for integrated models of biomolecular interaction networks. Genome Research 13, 2498–2504 (2003). [DOI] [PMC free article] [PubMed] [Google Scholar]
- 62.Yoon S et al. GScluster: network-weighted gene-set clustering analysis. BMC Genomics 20, 352 (2019). [DOI] [PMC free article] [PubMed] [Google Scholar]
- 63.Quadrato G, Sherwood JL & Arlotta P Long term culture and electrophysiological characterization of human brain organoids. Protocol Exchange (2017). [Google Scholar]
- 64.Zheng GXY et al. Massively parallel digital transcriptional profiling of single cells. Nature Communications 8, 1–12 (2017). [DOI] [PMC free article] [PubMed] [Google Scholar]
- 65.Stuart T et al. Comprehensive Integration of Single-Cell Data. Cell 177, 1888–1902.e21 (2019). [DOI] [PMC free article] [PubMed] [Google Scholar]
- 66.McCarthy DJ et al. Cardelino: computational integration of somatic clonal substructure and single-cell transcriptomes. Nat Methods 17, 414–421 (2020). [DOI] [PubMed] [Google Scholar]
- 67.Huang Y, McCarthy DJ & Stegle O Vireo: Bayesian demultiplexing of pooled single-cell RNA-seq data without genotype reference. Genome Biology 20, 273 (2019). [DOI] [PMC free article] [PubMed] [Google Scholar]
- 68.Korsunsky I et al. Fast, sensitive and accurate integration of single-cell data with Harmony. Nature Methods 16, 1289–1296 (2019). [DOI] [PMC free article] [PubMed] [Google Scholar]
- 69.Pardy C mpmi: Mixed-Pair Mutual Information Estimators. (2020). [Google Scholar]
- 70.Bates D, Machler M, Bolker B & Walker S Fitting Linear Mixed-Effects Models Using Ime4. 2015. 67, 48. [Google Scholar]
- 71.Fonseka CY et al. Mixed-effects association of single cells identifies an expanded effector CD4+ T cell subset in rheumatoid arthritis. Science Translational Medicine 10, (2018). [DOI] [PMC free article] [PubMed] [Google Scholar]
- 72.Cao J et al. The single-cell transcriptional landscape of mammalian organogenesis. Nature 566, 496–502 (2019). [DOI] [PMC free article] [PubMed] [Google Scholar]
- 73.Love ΜI, Huber W & Anders S Moderated estimation of fold change and dispersion for RNA-seq data with DESeq2. Genome Biology 15, 550 (2014). [DOI] [PMC free article] [PubMed] [Google Scholar]
- 74.Lun ATL & Marioni JC Overcoming confounding plate effects in differential expression analyses of single-cell RNA-seq data. Biostatistics 18, 451–464 (2017). [DOI] [PMC free article] [PubMed] [Google Scholar]
- 75.Yu G, Wang L-G, Han Y & He Q-Y clusterProfiler: an R package for comparing biological themes among gene clusters. Omics : a journal of integrative biology 16, 284–287 (2012). [DOI] [PMC free article] [PubMed] [Google Scholar]
- 76.Genomics, 10x. Nuclei Isolation from Mouse Brain Tissue for Single Cell ATAC Sequencing · Rev B. Demonstrated Protocol (2019). [Google Scholar]
- 77.Corces MR et al. An improved ATAC-seq protocol reduces background and enables interrogation of frozen tissues. Nature Methods 14, 959–962 (2017). [DOI] [PMC free article] [PubMed] [Google Scholar]
- 78.Stuart T, Srivastava A, Lareau C & Satija R Multimodal single-cell chromatin analysis with Signac. b/’oRx/V 2020.11.09.373613 (2020). [Google Scholar]
- 79.Rainer J EnsDb.Hsapiens.v86: Ensembl based annotation package. (2017). [Google Scholar]
- 80.Heinz S et al. Simple combinations of lineage-determining transcription factors prime cis-regulatory elements required for macrophage and B cell identities. Mol Cell 38, 576–589 (2010). [DOI] [PMC free article] [PubMed] [Google Scholar]
Associated Data
This section collects any data citations, data availability statements, or supplementary materials included in this article.
Supplementary Materials
Data Availability Statement
Read-level data from scRNA-seq and scATAC-seq, along with proteomics data, that support the findings of this study have been deposited in a controlled access repository at https://www.synapse.org with accession number project ID syn26346373, while count-level data and metadata have been deposited at the Single Cell Portal (https://singlecell.broadinstitute.org/single_cell/study/SCP1129). The electrophysiology materials and data are available upon request.
Public data used in this paper includes the GRCh38 human reference genome and the EnsDb.Hsapiens.v86 annotation package.