

Abstract
Thyroid hormone (TH) action is essential for hepatic lipid synthesis and oxidation. Analysis of hepatocyte-specific thyroid receptor beta 1 (TRβ1) knockout mice confirmed a role for TH in stimulating de novo lipogenesis and fatty acid oxidation through its nuclear receptor. Specifically, TRβ1 and its principal corepressor NCoR1 in hepatocytes repressed de novo lipogenesis, whereas the TH-mediated induction of lipogenic genes depended on the transcription factor ChREBP. Indeed, mice with a hepatocyte-specific deficiency in ChREBP lost TH-mediated stimulation of the lipogenic program, which in turn impaired the regulation of fatty acid oxidation. TH regulated ChREBP activation and recruitment to DNA, revealing a mechanism by which TH regulates specific signaling pathways. Regulation of the lipogenic pathway by TH through ChREBP was conserved in hepatocytes derived from human induced pluripotent stem cells. These results demonstrate that TH signaling in the liver acts simultaneously to enhance both lipogenesis and fatty acid oxidation.
One-Sentence Summary:
The transcription factor ChREBP mediates lipid accumulation in the liver in response to thyroid hormone.
Editor’s Summary: Fattening livers with thyroid hormone
Nonalcoholic fatty liver disease can lead to impaired hepatic function and carcinogenesis. Analogs of the thyroid hormone T3 have been suggested as a possible therapy for NAFLD because T3 can promote fatty acid oxidation in the liver. However, T3 can also have the opposite effect on hepatic lipid metabolism, which Mendoza et al. investigated with mice with liver-specific deficiencies on diets that mimicked hypothyroidism or hyperthyroidism. The authors found that T3 enhanced de novo lipogenesis in the liver through the transcription factor ChREBP, which was recruited to the promoters of lipogenic genes by the T3 receptor TRβ1. Mice with a hepatocyte-specific deficiency of ChREBP had decreased hepatic triglyceride amounts in response to T3 treatment. These results suggest that T3 analogs may regulate both the accumulation and removal of lipids in the liver.
INTRODUCTION
Thyroid hormones (TH) are essential for the regulation of multiple metabolic pathways including the synthesis and oxidation of lipids in the liver (1). Indeed, there is an increasing interest in the production of thyroid hormone analogs for the treatment of NAFLD (non-alcoholic fatty liver disease) and its life-threatening complications, including NASH (non-alcoholic steatohepatitis), cirrhosis and hepatocellular carcinoma (HCC) which account for approximately 2 million death per year (2–4). Thus, it is critical to understand the molecular mechanisms engaged by thyroid hormone receptors (TRs) to control lipid metabolism in the liver (1).
TRs are ligand-dependent transcription factors that transduce TH signaling and that are responsible for the functional actions of T3, the principal mediator of TH action (5). In the absence or in the presence of limiting amounts of ligand, the TRs recruit the nuclear receptor corepressors (NCoR1 and SMRT), which are a scaffold for a multiprotein repressive complex that includes Tbl1x, Gps2 and HDAC3 (6). Increasing concentrations of T3 induce the dissociation of the corepressor complex and facilitate the interaction with coactivators including CBP and SRC1, which in turn promote the expression of genes that are positively regulated by T3 (7). T3 stimulates both fatty acid synthesis and oxidation through the engagement of the TRβ1 isoform in the liver (1, 8, 9). However, the mechanisms by which T3 induces these two apparently opposing metabolic pathways is not understood. Estrogen-related receptor α (ERRα) likely plays a role downstream of TRβ1 to mediate the actions of T3 on fatty acid oxidation by regulating mitochondrial turnover (10).
Previous work in our laboratory and those of others (11, 12) has demonstrated that NCoR1 controls a pathway for hepatic lipid synthesis and storage that requires the presence of TRβ1 (9, 13, 14). Indeed, disruption of NCoR1 function in hepatocytes increases the mRNA levels and H3K27 acetylation of T3-regulated lipogenic genes such as Acaca, Fasn, and Thrsp (9, 15, 16). In addition, hypothyroid mice with a hepatocyte-specific deficiency of NCoR1 maintain increased expression and histone acetylation of these lipogenic genes whereas liver-specific TRβ1KO mice lose their ability to downregulate or upregulate these genes in response to changes in thyroid status (9). Together, these data suggest that in the absence of NCoR1, TRβ1 can mediate upregulation of lipogenic genes in euthyroid and hypothyroid conditions.
Here, we further evaluated how TRβ1 regulates lipogenesis. Deletion of TRβ1 in hepatocytes led to a loss of T3-dependent lipid synthesis and TRβ1 cistromically regulated a key regulator of lipid synthesis, the transcription factor ChREBP. Indeed, disruption of both NCoR1 and TRβ1 in hepatocytes of mice (NTKO) resulted in enhanced lipogenesis associated with an upregulation of the ChREBPβ isoform, suggesting that TRβ1 served as a repressor of ChREBP that is regulated by T3. We confirmed this notion in mice with a liver-specific ChREBP knockout (ChREBPKO), in which T3 no longer upregulated lipogenic genes. Indeed, ChREBP recruitment to lipogenic genes was controlled by T3 through TRβ1. Finally, we observed that this same pathway was conserved in a human hepatocyte model. The ability of T3 to control lipogenesis through ChREBP raises the possibility that specific approaches to target T3-mediated fatty acid oxidation may be possible, which could enhance the therapeutic effects of T3 in NAFLD or NASH.
Results
T3 stimulates both fatty acid synthesis and oxidation in the liver
To demonstrate the physiologic role of TRβ1 in hepatic lipid metabolism, we used liver-specific TRβ1KO mice to examine the ability of T3 to regulate the genes encoding factors involved de novo lipogenesis and fatty acid oxidation (FAO) (Figure 1A, fig.S1A). Primary hepatocytes harvested from TRβ1KO mice on a PTU/LID+T3 diet showed significantly decreased rates of de novo lipogenesis and fatty acid oxidation in contrast to hepatocytes harvested from WT controls under the same condition, supporting the primary role of TRβ1 to regulate lipogenesis and FAO upon T3-stimulus (Figure 1B). The levels of hepatic triglycerides were not affected by T3 administration or by TRβ1 ablation (Figure 1C) . However, the T3-induced, TRβ1-dependent increase in lipogenesis and fatty acid oxidation was consistent with increased mRNA levels of genes regulating lipogenesis including Acacb, Fasn, Pnpala3, ChREBPα and ChREBPβ, and genes regulating FAO including Mgll, Atgl, Cgi-58, Fgf21 and Esrrα. In addition, Fasn, Pnpla3 and both ChREBP isoforms were not suppressed in hypothyroid TRβ1KO mice, suggesting that the TRβ1 may suppress this pathway (Figure 1D,E, fig.S1B,C).
Fig. 1. Thyroid hormone receptor β1 regulates hepatic lipid metabolism.

A. qPCR analysis for the indicated genes was performed on liver RNA from male mice with hepatocyte-specific deficiency of TRβ1 (TRβ1KO) and their WT controls (flox/flox−/−) on a hypothyroid (PTU/LID) or hyperthyroid diet (PTU/LID+T3). n=5-6 mice per group analyzed by Mann-Whitney U test. B. Rates of de novo lipogenesis and fatty acid oxidation were determined in primary hepatocytes from TRβ1KO and control mice on a PTU/LID or PTU/LID+T3 diet. n=3 mice per group, analyzed by two-way ANOVA and Tukey’s multiple comparisons test. C. Hepatic triglyceride levels were determined in TRβ1KO and control mice on a PTU/LID or PTU/LID+T3 diet. n=5-6 mice per group. D-E. qPCR analysis was performed for the indicated genes using liver tissue from TRβ1KO and control mice on a PTU/LID or PTU/LID+T3 diet. n=5-6 mice per group analyzed by Mann-Whitney U test. F. Heatmap of clustered TRβ1 ChAP peaks concordantly regulated by T3 in liver tissue from mice in which endogenous TRβ1 was tagged [Thrb-HAB (HAB), n=2 mice per group] or from mice with adenoviral-induced overexpression of TRβ1 [Ad-TRβ1-BirA (BirA); pooled library from 10 mice per group]. G. TRβ1 ChIP peaks in Mlxipl (ChREBP), Fasn, and Mgll visualized on a genome browser. nc negative control. H. Liver chromatin from WT mice on a chow, PTU/LID or PTU/LID+T3 diet and from ChREBPKO mice on a chow diet as a negative control was immunoprecipitated with a ChREBP antibody. qPCR analysis was performed on the immunoprecipitates to assess the enrichment of the indicated targets. n=3-4 mice per group analyzed by Mann-Whitney U test. Data are presented as mean±SD. *p<0.05, **p<0.01, ****p<0.0001.
To examine the ability of TRβ1 to regulate gene expression, we established the cistrome of TRβ1 using mice in which the endogenous TRβ is tagged at its C-terminus with a peptide that can be biotinylated by BirA in vivo. This system allows determination of endogenous TRβ1 binding by chromatin-affinity purification (ChAP)-Seq, which we have done previously with adenoviral overexpression of TRβ1 (17). We found 6935 overlapping ChAP peaks in the two different TRβ1 cistromes with or without TRβ1 overexpression. Moreover, 730 of those ChAP peaks were concordantly regulated by T3 levels, whereas we observed T3-induced recruitment to DNA in 553 ChAP peaks (Figure 1F, Data File S1). Indeed, we observed overlapping TRβ1 ChAP peaks in ChREBP (also known as Mlxipl), Fasn and Mgll, supporting that TRβ1 directly engages those genes to regulate both the lipogenic and FAO pathways, potentially by regulating secondary transcription factors such as Esrrα and ChREBP (Fig 1D,E,G). In this context, we observed that T3 regulated ChREBP recruitment to DNA in a TRβ1-dependent manner, suggesting that TRβ1 and ChREBP coordinate to control de novo lipogenesis (Fig. 1H).
TRβ1 and NCoR1 repress lipogenesis in liver by regulating ChREBP expression
We previously showed that the heptic ablation of NCoR1 in mice (NCOR1KO mice) upregulates lipogenic T3 target genes in euthyroid and hypothyroid conditions, suggesting that derepressed TR in these mice mediates the enhanced lipogenic gene expression (9). To determine if this pathway overlaps with the T3-mediated pathway that regulates lipogenesis, we generated mice with hepatocyte-specific deficiency of both NCoR1 and TRβ1 (NTKO) in female and male mice (Figure 2A fig.S2A, respectively). The lack of NCoR1 led to increased levels of hepatic triglycerides in the euthyroid and hypothyroid states, but hepatic TGs were decreased in hyperthyroid NCOR1KO mice (Figure 2B). Consistent with a role for the NCoR1/TRβ1 pathway in regulating lipogenesis, NTKO mice had higher levels of hepatic TGs that were not regulated by T3. This finding was supported by increased liver weights in euthyroid and hyperthyroid NTKO mice (Figure 2B, fig. S2B). Consistent with the increased liver weights and triglycerides, the ablation of TRβ1 and NCoR1 in NTKO mice derepressed T3-regulated lipogenic genes including Fasn, Acaca, Me1, and Elovl6 as compared to WT controls, and the increased mRNA levels were matched only by T3-stimulus in NCoR1KO and WT controls (Figure 2C, fig.S2C). In contrast, FAO-regulating genes including Mgll, Esrrα, Cox5a and Cpt1a were not derepressed by NCoR1 ablation or by the ablation of both NCoR1 and TRβ1, suggesting that two different TRβ1-mediated pathways are involved in the regulation of lipogenesis and FAO (Figure 2D). The upregulation of lipogenic target genes in NTKO mice was reversed by fasting, whereas the lipid oxidation pathway was upregulated by fasting, indicating that a nutrient deficit overrides the role of TRβ1/NCoR1 to control lipid metabolism. Both FGF21 hepatic mRNA and serum levels validated the effectiveness of the fast (fig. S3A, B).
Fig.2. TRβ1 and NCoR1 repress lipogenesis in the liver.

A. qPCR analysis for the indicated genes was performed on liver RNA from female WT mice, mice with a hepatocyte-specific deficiency of NCoR1 (NCoR1KO), or mice with a hepatocyte-specific deficiency of NCoR1 and TRβ1 (NTKO) on a chow diet. n=5-6 mice per group analyzed by Mann-Whitney U test. Liver proteins from WT, NCoR1KO, or NTKO mice were immunoblotted for NCoR1 or RNA Pol2 as control. n=3 mice per group, each lane represents a different mouse. B. Hepatic triglycerides and liver weight to body weight (LW/BW) ratios were measured in WT, NCoR1KO, or NTKO mice on a chow, PTU/LID or PTU/LID+T3 diet. n=5-6 mice per group, analyzed by two-way ANOVA and Tukey’s multiple comparisons test. C-E. qPCR analysis was performed for the indicated genes using liver RNA from WT, NCoR1KO, or NTKO mice on a chow, PTU/LID or PTU/LID+T3 diet. n=5-6 mice per group analyzed by Mann-Whitney U test. F-G. Liver chromatin from WT, NCoR1KO, or NTKO mice on a chow diet was immunoprecipitated with an H3K27ac antibody (F), ChREBP antibody (G) or rabbit IgG as control. qPCR analysis was performed on the immunoprecipitates to assess the enrichment of the indicated targets. n=3-4 mice per group, analyzed by Mann-Whitney U test. H. Liver proteins from WT, NCoR1KO, or NTKO mice on the indicated diets were immunoblotted for ChREBP (Chα) or actin as loading control. Liver proteins from ChREBPKO mice on a chow diet were used as negative control (nc). n=3 mice per group, each lane represents a different mouse analyzed by one-way ANOVA and Tukey’s multiple comparisons test. Data are presented as means±SD. *p<0.05, **p<0.01, ***p<0.005, ****p<0.0001.
We observed that under euthyroid or chow-fed conditions, Cd36, Scd1, Plin2 and G0S2 were further upregulated in NTKO mice as compared to NCoR1KO mice, suggesting that additional lipogenic transcription factors were active in NTKO mice (Figure 2E). Therefore, we investigated the hepatic expression of lipogenic transcription factors and found that both isoforms of ChREBP were upregulated in NCoR1KO and NTKO mice (Figure 2F, figS2C). The expression of ChREBPβ was upregulated in NTKO mice, which was consistent with increased H3K27 acetylation near the carbohydrate responsive element (ChoRE) located upstream of the ChREBPβ transcriptional start site, while Srebp1c mRNA was only minimally elevated (Figure 2F). Moreover, ChREBP target genes including Glut4, Pklr, G6pdx and Acly showed increased expression and increased ChREBP binding at regulatory sites in NTKO mice (Figure 2G). Thus, de novo lipogenesis and lipid storage in the liver appear to be governed by NCoR1 and TRβ1-mediated regulation of ChREBP activity. In this context, ChREBPα was regulated at the protein level by thyroid status in WT mice such that its levels were repressed by hypothyroidism and activated by hyperthyroidism, whereas thyroid status did not affect ChREBPα protein levels in NCoR1KO and NTKO mice (Figure 2H). Together, these data support the hypothesis that the lipogenic effects of T3 are mediated through ChREBP.
ChREBP mediates T3-induced lipogenesis
To test directly if ChREBP regulates the lipogenic effects of T3, we generated liver-specific ChREBPKO mice (ChREBPKO) (Figure 3A, fig. S4A). In both female and male ChREBPKO mice, T3 administration significantly decreased hepatic triglyceride levels, and hepatic triglyceride levels were higher in hypothyroid ChREBPKO mice than in the WT controls (Figure 3B, fig. S4B). Hepatic, serum triglyceride, and serum β-hydroxybutyrate (BHB) levels were similar in WT mice regardless of thyroid status, though serum triglyceride levels were lower in T3-treated ChREBPKO mice (Figure 3B). Oil red O staining demonstrated a decrease in hepatic lipid accumulation in ChREBPKO mice upon T3 administration (fig. S5). To determine the role of ChREBP in T3-induced lipogenesis and FAO, we examined de novo lipogenesis (DNL) and FAO in primary hepatocytes. The rates of DNL were increased by T3 in WT hepatocytes, but not in ChREBPKO hepatocytes, which also showed impaired T3-induced FAO (Figure 3C).
Fig. 3. Thyroid hormones regulate lipogenesis through ChREBP.

A. Liver cDNA or proteins from female WT mice or mice with a hepatocyte-specific deficiency of ChREBP (ChREBPKO) on a hypothyroid (PTU/LID) or a hyperthyroid (PTU/LID+T3) diet were used for qPCR analysis or were immunoblotted for ChREBP or actin as loading control. For the qPCR analysis, n=5-6 mice per group analyzed by Mann-Whitney U test. For the immunoblotting analysis, each lane represents a different mouse analyzed by two-way ANOVA and Tukey’s multiple comparisons test. B. Hepatic and serum triglyceride and BHB levels were measured in WT or ChREBPKO mice on the indicated diet. n=5-6 mice per group anlyzed by two-way ANOVA and Tukey’s multiple comparisons test. C. Rates of de novo lipogenesis and FAO were determined in primary hepatocytes from WT or ChREBPKO mice on the indicated diets. n=3 mice per group, anlyzed by two-way ANOVA and Tukey’s multiple comparisons test. D-F. qPCR analysis for the indicated genes was performed on liver cDNA from WT or ChREBPKO mice on the indicated diets. n=5-6 mice per group analyzed by Mann-Whitney U test. Mean±SD, Two-way ANOVA, *p<0.05, **p<0.01, ***p<0.005, ****p<0.0001.
To further confirm the role of ChREBP in T3-mediated lipogenesis, we next evaluated the hepatic expression of the DNL genes Acaca, Acacb, Fasn, Me1, and Pnpla3, which were all upregulated by T3 in control mice but not in ChREBPKO mice (Figure 3D, fig. S4C). The mRNA levels of Fatp1, which encodes a fatty acid transporter, were increased in hypothyroid ChREBPKO mice, which, along with increased mRNA levels of the glycerolipid biosynthesis pathway genes Plin3, Gpat3, and Lpin2, and decreased Mttp mRNA could mediate the increased hepatic triglyceride levels in ChREBPKO mice, despite the lack of DNL (Figure 3E, fig. S6A). The upregulation of Lpin2 in hypothyroid ChREBPKO mice could be caused by decreased Lpin1 mRNA levels, which similarly to Gpat1 was reduced by the ablation ChREBP; however neither of these genes was regulated by T3 levels in WT mice (Figure 3E, fig. S6A). In contrast, Fatp4, Gpat2, and Dgat2 mRNA levels were increased by T3 administration in WT mice, supporting the role of T3 signaling in triglyceride synthesis and storage in the liver (fig. S6A).
T3-responsive genes such as Dio1, Bcl3, Gsta2 and Fbxo21 were upregulated or downregulated by T3 in both control and ChREBPKO mice (Figure 3F, fig. S6B). Thus, ChREBP controls only the lipogenic targets of T3-signaling whereas non-lipogenic T3 targets are regulated independently of ChREBP. Indeed, the program of fatty acid mobilization was stimulated by T3 in ChREBPKO mice, as shown by upregulation of the lipolytic genes Mgll, Cgi-58, although T3-upregulation of Fgf21 mRNA was attenuated in ChREBPKO mice. Also, OXPHOS regulating genes including Cox10, Cox7a1 and Sdhd were upregulated by T3 in both WT and ChREBPKO mice (Figure 3F, fig. S6C). Fractionation demonstrated similar amounts of nuclear and cytosolic SREBP1c in both WT and liver-specific ChREBPKO mice in both hypothyroid and hyperthyroid conditions, suggesting that the lipogenic pathway mediated by SREBP1c plays little role in the lipogenic action of T3, which is consistent with the primary role of ChREBP in mediating T3-driven lipogenesis (fig. S6D).
Although the alterations in lipogenic gene expression by T3 might be explained by the induction of expression of ChREBP isoforms, we performed ChIP-Seq analysis to examine whether T3 might also control its recruitment to the regulatory regions of lipogenic genes. In WT mice, 1002 ChREBP ChIP peaks were significantly upregulated by T3 (Figure 4A). We validated the T3-elicited changes on ChREBP ChIP peaks using ChIP-PCR on various genes. Indeed, we confirmed increased ChREBP recruitment to the regulatory regions of lipogenic target genes including CHREBPβ, Acaca, Acacb, Fasn, Me1 and Thrsp in response to T3, which depended upon ChREBP upregulation and recruitment to their regulatory regions (Figure 4B). 543 ChREBP ChIP peaks were decreased by T3; however, these peaks were not associated with genes involved in the regulation of lipogenic gene expression (Figure 4A). We did not find identifiable peaks in ChREBPKO mice, thus confirming the fidelity of the antibody used in the ChIP-seq analysis. We observed overlapping peaks within a 100 Kb distance from most lipogenic genes in the ChREBP and TRβ1 cistromes (Figure 4C, D, Data File S2). Indeed, the intersection of both ChREBP and TRβ1 cistromes revealed 352 overlapping ChIP peaks, whereas the average distance between the centers of the overlapping ChIP-Peaks was 159 bp, suggesting that both ChREBP and TRβ1 can be simultaneously recruited to the same regions of DNA to regulate lipogenic genes (Figure 4E).
Fig. 4. Thyroid hormone signaling controls the cistrome of ChREBP.

A. Volcano plot from ChREBP ChIP peaks from WT mice on a hypothyroid (PTU/LID) or hyperthyroid (PTU/LID+T3) diet. Red dots indicate 1002 upregulated or 543 downregulated peaks. The significance threshold was FDR<=0.25, FC>=0.5 CPM>=2. n=2 mice per group. B. Liver chromatin from WT or mice with a hepatocyte-specific deficiency of ChREBP (ChREBPKO) on the indicated diets was immunoprecipitated with a ChREBP antibody. qPCR analysis was performed on the immunoprecipitates to assess the enrichment of the indicated targets. n=4 mice per group analyzed by Mann-Whitney U test, Mean±SD, **p<0.01, ***p<0.005. C. Heat map of clustered ChREBP ChIP peaks in WT mice on the indicated diets and the nearest ChAP peaks in TRβ1-HAB mice. n=2 mice per group. Scale represents log2 fold change. D. Violin plot depicts the distribution of the distances between the centers of overlapping ChREBP ChIP Peaks in WT mice on a hypothyroid (PTU/LID) or hyperthyroid (PTU/LID+T3) diet and TRβ1 ChAP peaks, and the distribution of distances between the center of ChREBP ChIP peaks to the nearest transcription start site (TSS; Chα-TSS). E. Genome browser visualization of TRβ1 ChAP peaks and ChREBP ChIP peaks on the indicated genes. ChIP-PCR amplicons are highlighted in yellow.
Although T3 injection increased ChREBP recruitment to DNA in 1002 ChREBP ChIP peaks, including those near DNL genes (Figure 4A), only 50 out of the 352 TRβ1 ChAP peaks that overlapped with ChREBP ChIP peaks were upregulated by T3 (Figure 4C), suggesting a marginal role for T3-induced recruitment of TRβ1 to DNA in the lipogenic pathway. These 50 TRβ1 ChIP peaks were upregulated by T3 in the two TRβ1 cistromes analyzed (fig. S7A). Furthermore, the ChREBP ChIP peaks overlapped with identical ChAP peaks across both TRβ1 cistromes with an average distance between the centers of the peaks of 159 and 151 bp, respectively. Additionally, the centers of the TRβ1 ChAP peaks were at an average distance of 143 bp, supporting the notion that both TRβ1 cistromes determined the same set of binding sites for TRβ1(fig S7B,C). ChIP-PCR analysis demonstrated that in ChREBPKO mice, T3 did not increase the histone acetylation of ChREBP target genes including ChREBP, Acaca, Acacb, Fasn, Thrsp, Me1 and Pnpla3, but did increase H3K27ac in the vicinity of TRβ1 binding sites at target genes such as Dio1 and Mgll (fig S7D).
The T3-ChREBP lipogenic pathway is conserved in human hepatocytes
To assess the role of thyroid hormone signaling on lipogenic pathways in human hepatocytes, we differentiated human induced pluripotent stem cells to hepatocytes (iHEPS) using a protocol we have previously validated (18). These hepatocytes are functionally and transcriptionally similar to human fetal hepatocytes and express albumin and alpha-1 antitrypsin amongst many other liver-specific proteins. RNA-Seq analysis showed that T3 upregulated 873 genes and repressed 677 genes in iHEPS (Figure 5A). Furthermore, David Gene Ontology revealed that lipid metabolism was among the most highly enriched pathways upregulated in these cells, consistent with observations in mice (Table S1). Moreover, various lipogenic and lipid oxidation related genes including Fasn, Acaca, Elovl6, Cpt1a, Lipc and Pnpla3 were upregulated by T3 in iHEPS. The expression of both isoforms of ChREBP were also upregulated by T3 in iHEPS, indicating that the T3-lipogenic signaling pathway is conserved in human hepatocytes (Figure 5B,C).
Fig. 5. T3-ChREBP regulation of lipogenesis is conserved in iHEPS.
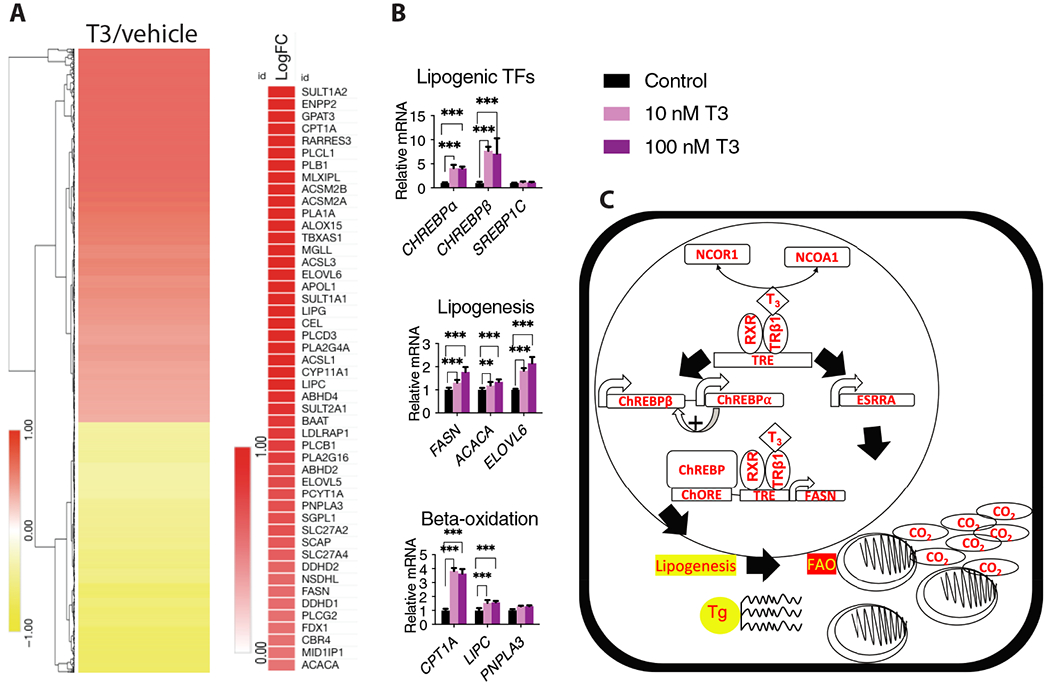
A. Clustered log2FC in mRNA expression in hepatocytes differentiated from iHEPS treated with T3 or vehicle. Fatty acid metabolism genes that were upregulated by T3 in iHEPS are also indicated. n=4 biological replicates per group. B. qPCR analysis for the indicated genes using cDNA from iHEPS treated with T3 or vehicle. n=4 biological replicates per group, analyzed by Mann-Whitney U test, Mean±SD. **p<0.01, ***p<0.005. C. TH stimulates both lipogenesis and fatty acid oxidation through independent signaling pathways. TH regulates the dissociation of NCoR1 and stimulates ChREBP isoform expression to regulate the lipogenic program. Conversely, lipid oxidation is regulated by the ability of T3/TR signaling to control ESRRA activity.
DISCUSSION
Thyroid hormones control multiple metabolic pathways, including those that regulate the synthesis and oxidation of lipids in the liver. However, most of these pathways remain to be defined at the molecular level, precluding our ability to target them to treat metabolic diseases such as obesity, type 2 diabetes and NAFLD. Here, we uncovered a T3-lipogenic pathway controlled by the TRβ1-dependent upregulation of ChREBP in mice that is also present in human hepatocytes (Figure 5C).
In the present report, we confirmed the primary role of TRβ1 to regulate both hepatic de novo lipogenesis and fatty acid oxidation. In addition, we demonstrated that the secondary induction of ChREBP isoforms by TRβ1 upon T3 activation regulates DNL, which might play a role to increase fatty acid oxidation. It was previously assumed that the nuclear hormone receptors govern gene expression exclusively through ligand-receptor interactions; however, it has become clear that the nuclear receptor-dependent activation and recruitment of secondary transcription factors is critical for regulating specific signaling pathways, as shown in the present report and by others (10, 19).
Here, NCoR1 and TRβ1 had a primarily repressive role in regulating the lipogenic program, whereas the coordinate activation and recruitment of ChREBP was needed to upregulate lipogenesis in response to T3 stimulus. These data also suggested that TRβ1 repressed the lipogenic program through NCoR1 and by recruiting additional corepressors. The ablation of TRβ1 in hepatocytes did not promote the upregulation of ChREBP isoforms in the euthyroid condition as observed in NTKO or NCoR1KO mice. However, T3 did not regulate ChREBP in TRβ1KO mice, confirming a direct role of TRβ1 in regulating ChREBP expression, as also demonstrated by others (20, 21). ChREBPβ expression is regulated through ChREBPα positive feedback, which in turn is regulated by intracellular glucose levels (22). Here, we observed that the positive regulation of ChREBPβ by ChREBPα was controlled by TRβ1 and NCoR1 activity on the ChREBPα promoter, and that the intracellular T3 levels were critical to controlling the expression of both ChREBP isoforms. Indeed, both NCoR1KO and NTKO mice showed similar levels of ChREBPα, but this increase in ChREBPα upregulated ChREBPβ only in NTKO mice, indicating that the TRβ1 plays a critical role to regulate the positive feedback between ChREBP isoforms. The regulation of ChREBP isoforms by thyroid hormone signaling was preserved at the mRNA and protein level.
The transcriptional activity of ChREBP was previously thought to be controlled by the translocation of ChREBPα into the nucleus through a series of protein-protein interactions and post-traslational modifications (23). We found that T3 recruited ChREBP to DNA, and given the role of ChREBP in lipogenesis, it is likely that its cistromic regulation by T3 is critical for this process. Additionally, the proximity of ChREBP and TR binding sites in lipogenic genes is striking. Although most TR-binding sites are remote from the transcription start site when viewed across the genome, the co-existence of nearby ChREBP sites in lipogenic genes suggests a cooperative mechanism of regulation. The requirement of ChREBP for T3 target gene upregulation was observed only for those genes involved in de novo lipogenesis and not for non-lipogenic genes, further supporting an exclusively lipogenic role for the TRβ1-ChREBP dyad.
Although the deletion of ChREBP led to a decrease in hepatic triglycerides in ChREBPKO mice in the presence of T3, hepatic TGs were higher in hypothyroid ChREBPKO mice despite the lack of DNL, suggesting that the pathogenesis of fatty liver is not only associated with increased DNL but also potentially with impaired VLDL secretion and triglyceride storage (24–26). Although the exact mechanism remains unclear, hypothyroid ChREBPKO mice showed increased expression of genes regulating fatty acid uptake and triglyceride synthesis, along with decreased mRNA levels of Mttp, a critical regulator of VLDL secretion. These observations support a role for ChREBP in hepatic triglyceride storage and secretion. (26, 27). Additionally, T3-increased FAO was also impaired in ChREBPKO mice, suggesting that the lipogenesis induced by T3 might provide substrate or cofactors that regulate fatty acid oxidation (28). Indeed, work by others support a role for ChREBP in basal fatty acid oxidation (29). The ablation of ChREBP had no effect on steady state TG levels, supporting the notion that ChREBP is primarily a driver of de novo lipogenesis rather than a mediator of basal triglyceride levels (25).
How T3 signaling in the liver induces both lipid oxidation and lipid synthesis is not understood. Because T3 analogs are being investigated as an NAFLD therapeutic, it is critical to understand if long term T3 analog treatment will eventually lead to lipid synthesis rather than oxidation. Our data from mice lacking ChREBP isoforms in hepatocytes show that this may be the case. ChREBPKO mice had lower hepatic lipid levels after T3 stimulation and T3-mediated induction of lipogenic genes was abrogated. Furthermore, the induction of lipogenesis by T3 was decreased in ChREBPKO primary hepatocytes. Thus, the induction of ChREBP isoforms by T3 is required for lipogenesis but T3-mediated action on the genomic pathways regulating lipid oxidation is not completely lost. Additionally, classical T3 target genes such as Dio1 and Bcl3 remained inducible in the absence of ChREBP. Together, these data demonstrates that T3-mediated lipogenesis plays a key role in maintaining hepatic lipid levels and that the pathways by which T3 regulates lipogenesis and lipid oxidation can be separated at the molecular level, as observed in work demonstrating that FAO is stimulated by T3 regulation of ERRα (10). Finally, the regulation of ChREBP by T3 signaling suggests that hypothyroid patients may be more susceptible to toxicity induced by fructose-containing compounds because of their lower levels of ChREBP, a critical mediator of fructose metabolism (30).
To determine if the regulation of lipogenesis is conserved in humans, we employed hepatocytes that derived from human iPSCs (iHeps) using a protocol that produces hepatocytes that are transcriptionally similar to fetal hepatocytes. To date, a protocol that produces a steady supply of adult hepatocytes has not been developed. Unlike most cellular systems used to study T3 action, iHEPS were responsive to T3 and showed induction of ChREBP isoforms and lipogenic target genes. Thus, the data from this model system suggest that it will be a valuable tool to assess the role of lipogenesis in thyroid hormone action in human cells.
MATERIALS AND METHODS
Animals
The protocol for housing and breeding mice was independently reviewed and approved by the Institutional Animal Care and Use Committee (IACUC) from Beth Israel Deaconess Medical Center and Weill Cornell Medical College. NCoR1 floxed mice were obtained from the Auwerx laboratory, Ecole Polytechnique Federale de Laussane (31, 32). Thrb floxed mice were obtained from the Gauthier laboratory, Institut de Génomique Fonctionnelle de Lyon Université de Lyon, Lyon, France (33). ChREBP floxed mice were obtained from the Horton laboratory (University of Texas Southwestern Medical Center) (26). Floxed mice were crossed to mice that express Cre recombinase under the control of albumin promoter, which produced Cre expression in hepatocytes only [(B6.Cg-Tg(Alb-cre)21Mgn/J), JAX Cat#003574]. The experimental cohorts were generated by crossing genotyped NCoR1f/f TRB f/+ AlbCre/− and NCoR1f/f TRBf/+ mice. The resulting experimental mice included littermate controls NCoR1f/f, NCoR1KO and NCoR1/TRβ1 double KO (NTKO). Liver-specific TRβ1KO mice were generated by crossing mice with the genotype TRβf/f to TRβf/f Alb-Cre/− mice which generated the littermate controls TRβf/f and TRβ1KO. Liver-specific ChREBPKO mice were generated by crossing mice with the genotype ChREBPf/f to ChREBPf/f-Alb-Cre/− which generated the littermate controls ChREBPf/f and ChREBPKO. All mice were maintained on a C57BL/6J genetic background.
Animal experiments
Animal experiments were approved by the IACUC at BIDMC and WCMC and NIDDK/NIH. Mice were housed on a 12-h light/dark cycle and supplied with food and water ad libitum. 6 week old male and female mice were maintained on standard chow diet or put on PTU/LID diet for 3 weeks [0.15% Propylthiouracil, Low iodine, 20% Protein, 51% Carbohydrate, 3.5% Fat, 3.2Kcal/g (TD.95125;Envigo)]. The PTU/LID +T3 groups received daily intraperitoneal injections of T3 (5ug/100g bodyweight) for the last 4 days of the experiment. On day 21 of experiments, mice were euthanized in the fed condition by CO2, blood was collected by cardiac puncture and tissues were quickly harvested frozen on liquid nitrogen and stored at −80°C. For fasting experiments, female mice were fasted for 18 hours and were euthanized by CO2. Blood was collected by cardiac puncture and tissues were quickly harvested, frozen in liquid nitrogen and stored at −80°C.
Hepatic triglycerides
Hepatic triglycerides were determined as previously described as follows (34). 200 mg of liver were extracted by chloroform:methanol (2:1) for two hours. Supernatants were washed with 0.9%NaCl and 0.9%NaCl-methanol. The organic phase was dried and dissolved in butanol–Triton X-100–methanol. Triglyceride concentrations were measured by enzymatic colorimetric assay (Stanbio). Serum FGF21 concentrations were measured using Quantikine mouse FGF21 ELISA (R&D Systems, Minneapolis, MN). Serum Triglycerides and BHB were measured by enzymatic colorimetric assay (Stanbio).
Rates of DNL from acetate
Rates of DNL were determined using primary cultured hepatocytes as previously described with modifications (35). Primary hepatocytes (4 × 10⁵ cells) isolated from WT (PTU/LID or PTU/LID+T3), ChREBPKO (PTU/LID or PTU/LID+T3) and TRβ1KO (PTU/LID or PTU/LID+T3) male mice were seeded in PrimariaTM 6-well plates (Corning) and incubated overnight in Medium 199 (Gibco) 10% charcoal/dextran treated fetal bovine serum (GE Healthcare). The following day, cells were incubated in 2 mL of serum-free Medium 199 for 2 h, then for 3h in fresh serum-free Medium 199 containing 1 μCi/ml [14C]-acetate (PerkinElmer; 50 μCi/μmol) supplemented with 1 mM acetate at 37°C. Plates were placed on ice, the medium was removed, and the cells were washed three times with ice-cold PBS. Cells were then scraped into 300µl of PBS and homogenized using a motor-driven pestle. The homogenate was divided for protein measurement (50µl) and for lipid extraction (250µl) using methanol:chloroform (1:2) (36). The radioactivity of lipid products present in the organic phase was measured using a liquid scintillation counter.
FAO Rates
Primary hepatocytes were isolated and plated overnight onto 24-well plates (125,000 cell/well) using M199 medium plus 10% dextran/charcoal stripped FBS. The next day the cells were washed twice with warm PBS and the medium was changed to serum-free M199 for 2h. 500µl of serum-free M199 medium containing 0.4 µCi [14C]-palmitate (American Radiolabeled Chemicals Inc; 55 μCi/μmol), 200 µM palmitate conjugated with FA-free BSA, and 1mM carnitine were added to each well. The plate was sealed with parafilm and incubated at 37°C for 3h. 400 µl of medium were then transferred to acidification vials containing 200 μL 1 M perchloric acid and filter papers soaked with 20 μL of 1 M NaOH to trap the [14C]CO2 produced by complete oxidation of radiolabeled palmitate. The tubes were shaken for 1 h at room temperature. Partially oxidized acid soluble metabolites ([14C]ASM) were separated by centrifugation at 14,000 g for 10 min at 4 °C. Aliquots of the supernatants (400 μL) and paper filters were placed into separate vials and subjected to scintillation counting. Total oxidation rates were calculated as sum of partial and complete oxidation rates.
Oil Red O Staining
Fresh liver samples were washed with ice cold PBS 1X, fixed overnight with 4% paraformaldehyde, washed with 15% sucrose and shipped in 30% sucrose. Histology was performed by HistoWiz Inc. (https://home.histowiz.com/). Liver samples were embedded in OCT, and 5 μm slides were prepared for staining. Fresh frozen sections were cut and air dried, placed in absolute propylene glycol, stained with Oil Red O solution, rinsed in 85% propylene glycol, rinsed in 2 changes of distilled water, stained with hematoxylin, washed with running tap water, placed in distilled water, and mounted with aqueous mounting medium.
Western Blot
Liver proteins were prepared as previously described (15). 50mg of liver was homogenized in 1 ml of cell lysis buffer ([20 mM Tris (pH 7.5), 150 mM NaCl, 1 mM EDTA, 1 mM EGTA, 1% Triton X-100, 2.5 mM sodium pyrophosphate, 1 mM B-glycerol phosphate, 1 mM Na3VO4, 1 mM PMSF, and 1x protease inhibitor mixture (Roche)]. Samples were sonicated 3 times for 5 seconds at power 4 and centrifuged a top speed for 15 min. Supernatants were aliquoted and stored at −80. Protein concentration was measured by using the Pierce BCA assay kit. For SDS-PAGE 50 ug of protein were resolved in 3-8% Tris-acetate or 12% Bis-Tris (Novex gel, invitrogen) and transferred to a nitrocellulose membrane. Blots were probed for NCoR1 (A301-145A; Bethyl) or ChREBP (Novus) at 4°C overnight and incubated with an HRP-conjugated secondary anti-rabbit antibody for 1 h at room temperature. Membranes were developed by using ECL substrate (BioRad) and visualized in a ChemiDoc MP Gel Imaging System. Membranes were stripped [2% SDS, 6.25 mM Tris (pH 6.8), 0.8% 2-mercaptoethanol] and re-blotted with anti-RNA polymerase II (05-952; EDM Millipore) or anti-Actin (Sigma A2066).
Nuclear and cytosolic fractions were isolated from freshly collected liver using NE-PER™ Nuclear and Cytoplasmic Extraction Reagents (Thermo fisher Scientific, 78833) with modifications. 100-130 mg of liver tissue was used for the fractionation. 50 μg of nuclear or cytosolic fraction was subjected to Western blotting for SREBP1 (Millipore Sigma, MABS1987), HDAC1 (Millipore Sigma, 05-100-I) and Actin (Sigma Aldrich, A5060).
RNA and QPCR
Total RNA was extracted from 50 mg of liver by using RNA-STAT following the vendor recommendations. 500ug RNA was reverse transcribed by using a cDNA kit (SuperScript-VILO, invitrogen). QPCR was performed on a Quantastudio 6 (Thermo Fisher). TaqMan assays were used to quantify all transcripts, except for ChREBP isoforms which were quantified by using Sybr Green (Applied Biosciences). Relative mRNA levels were calculated using standard curve and normalized to the expression of peptidyl isomerase A (Ppia) mRNA.
ChREBP CHIP-Sequencing
ChIP for ChREBP was performed on the livers of WT mice on either a PTU or PTU+T3 diet and ChREBPKO mice. Each ChIP was performed as previously described(9). 100 mg of liver was minced and cross-linked by DSG followed by paraformaldehyde (1%). Nuclei were obtained by dounce homogenizer in Hepes [10mM] pH7.9, KCl [10mM], EDTA [0.1mM], EGTA[0.1mM], DTT [1mM], protease inhibitors (Roche). Chromatin was resuspended in (Tris-HCl [50mM] pH8.0, EDTA [10mM], SDS [0.25%], protease inhibitors (Roche)) and sheared to 200-600 bp with an ultrasonicator (Branson). Sheared chromatin was diluted in ChIP dilution buffer (16.7mM Tris (pH8), 1.2mM EDTA, 167mM NaCl, 1.1% Triton X-100, 0.01% SDS) and subjected to immunoprecipitation with 6 μg of ChREBP antibody (Novus Biologicals, catalog number NB400-135) overnight at 4 °C. A 50/50 slurry of protein A and protein G Dynabeads (Invitrogen) was used to capture enriched chromatin. Reverse cross-linking and proteinase K digestion were performed at 65 °C for 6 hours. DNA was subsequently extracted using AMPure XP beads in accordance with the manufacturer’s manual. Extracted DNA (1-10ng, or all if less than 1ng) was used to generate sequencing libraries by following the “on-bead” sequencing library preparation method as previously described (37). Isolated DNA was processed by end repair/phosphorylation using the End-It DNA End-Repair Kit (Lucigen, A-tailing using the Klenow Fragment (NEB M0212) and index adaptor ligation using Quick Ligase (NEB M2200). AMPure XP beads were left in all reactions for DNA isolation, which was performed with PEG (Polyethylene Glycol 8000)/NaCl solution. After ligation, DNA was eluted from the beads and then PCR-amplified using the PfuUltra II Hotstart PCR Master Mix (Agilent 600850) for 18 cycles. DNA fragments between 250 and 600bp were selected via SPRISelect (Beckman Coulter, B23318). Quantity and quality of the libraries were analyzed by Qubit and Agilent Bioanalyzer, respectively, and the libraries were pooled at a final concentration of 12pM and sequenced on an Illumina NextSeq 500 system (36bp paired-end).
ChIP-PCR
The equivalent of 5mg of liver was incubated with 1 ug of anti-ChREBP (NB400-135 Novus), anti-H3K27 (Catalog no. 39133 Active Motif) or Rabbit igG as control (Jackson Immunoresearch) overnight at 4°C in Tris-HCl [10mM], pH8, EDTA [1mM] EGTA[0.5mM], NaCl [140mM], Triton X-100 [1%], Sodium Deoxycholate [0.1%] protease inhibitors (Roche). DNA-Protein complexes were pulled down with Protein A agarose beads (Thermo fisher) and were reverse crosslinked overnight at 65 C in Tris-HCl [50mM] pH8, EDTA [1mM], NaCl [100mM], SDS [0.5%]. DNA was extracted by phenol:chloroform:isoamyl alcohol and precipitated with ethanol. Purified DNA from 4 independent immunoprecipitations (IPs) was used as template in QPCR with SYBR Green Chemistry (Applied Biosystems). The results were quantified by standard curve and normalized to input DNA; data are reported as relative input DNA. Primers are in Table S2.
Chromatin affinity purification
TRβ-bound chromatin was isolated from mice that express tagged TRβ proteins from the natural promoter of the endogenous Thrb gene. The tag at the TRβ C-terminus included an HA epitope and a peptide for biotinylation by the prokaryotic BirA enzyme to enable high affinity streptavidin-selection of the protein and was introduced using standard procedures for homologous recombination in W9.5 embryonic stem cells from 129S1/Sv strain mice (38–40). ThrbHAB/+ mice were crossed with Rosa26+/BirA mice (Jackson Lab CAT# 010920, name Gt(ROSA)26Sortm1.1(birA)Mejr/J), backcrossed for 2 generations onto a C57BL/6J background, and intercrossed to produce ThrbHAB/HAB;Rosa26BirA/BirA test mice and Rosa26BirA/BirA control mice (abbreviated to “HAB” and “BirA”, respectively). Using established methods (41), adult male mice were made hypothyroid by adding 0.05% methimazole (Fluka) and 1% potassium perchlorate (Sigma-Adrich) to the drinking water for 5 weeks. Hyperthyroid groups were treated similarly but were additionally given T3 (Sigma-Aldrich) at 1 ug/ml in drinking water for the 5th week. Livers were taken from groups of treated 2 - 4-month-old male mice, immediately transferred into liquid nitrogen, and ground into powder. Frozen liver powder from 3 - 4 mice was pooled for one assay. Two separate pools were used per group for analysis. Experiments were performed in accordance with ethical guidelines and approved institutional protocols at the National Institutes of Health (NIH).
ChAP-Sequencing and data analysis
Chromatin affinity purification (ChAP) was performed using previously described methods with modifications (42). Pooled, powdered liver samples were cross-linked using 1.5% formaldehyde at room temperature for 15 min. The reaction was stopped by addition of glycine at a final concentration of 0.125 M. Cross-linked tissue was homogenized in lysis buffer using a 15 ml glass Dounce grinder with gentle twisting of the pestle 60 times, then placed on ice for 30 min. Samples were sonicated for 10 min using a sonic dismembrator (Model 505, Fisher Scientific) with 24% power output (repeated cycles of 20 s then 40 s pause). Magnetic streptavidin beads (40 μl, Dynabeads MyOne Streptavidin T1, Thermo Fisher Scientific) were incubated with the sonicated samples overnight at 4°C with gentle rotation. Beads were washed as described (42). Affinity-bound chromatin fragments were reverse-crosslinked, purified and used to construct DNA libraries for sequencing using the Illumina TruSeq ChIP Library Preparation Kit (Illumina) and an Illumina HiSeq 2500 sequencer at NIDDK Genomics Facility. Conversion of data format from bcl to fastq was performed using bclfastq software, version 2.17.1.14 from Illumina.
Computational ChIP-Seq analysis
For ChREBP ChIP-Seq and THRB ChAP-Seq analysis, reads were aligned to the mm10 mouse genome using Bowtie2 (43). PCR duplicates and low-quality reads were removed by Picard. Reads were processed using SAMtools (44) and subjected to peak-calling with MACS2 (45); called ChREBP peaks had ≥4-fold higher coverage than input genomic DNA and Thrb-HAB/BirA peaks had ≥4-fold higher coverage than BirA controls. Reads assigned to peaks were quantified using BEDTools (46) and normalization and differential analysis were performed using EdgeR (47). For differential analysis, peaks were considered significant only if they passed a fold-change (FC) cutoff of log2(FC) ≥ 1 and a false discovery rate (FDR) cutoff of FDR ≤ 0.05. To visualize ChIP-Seq signals, reads were converted to the BigWig file format using BEDTools and the bedGraphToBigWig utility (48). BigWig files were normalized based on library size (after filtering) and peak assignment efficiency. All peaks were annotated with nearest gene (exon) and nearest transcription start-site (TSS) information. Overlap and minimum distance between ChREBP and Thrb-HAB peaks were calculated using the GenomicRanges library (49), part of the Bioconductor package suite for R.
Stem Cell Culture and QPCR analysis
A previously published healthy control iPSC line, BU-3, was utilized for hepatic directed differentiation experiments (50). Undifferentiated iPSCs were adapted to feeder-free conditions, maintained on Matrigel (Corning) coated dishes in mTeSR1 media (Stem Cell Technologies), and dissociated for passaging with Gentle Cell Dissociation Reagent (Stem Cell Technologies). iPSCs were differentiated to the hepatic lineage with a previously published protocol (18) with modifications. On Day 0, cells were dissociated and approximately 40,000/cm2 were seeded in mTeSR media containing 10 mM Y-27632 (Tocris). The following day (Day 1), media was changed, and endodermal differentiation was initiated using the STEMdiff Definitive Endoderm Kit (Stem Cell Technologies). Cells were cultured in media according to the manufacturer’s instructions for 96 hours (Days 1-5). On Day 5, cells were dissociated with Gentle Cell Dissociation Reagent and split into new matrigel-coated wells at a ratio of approximately 1:3 in complete serum-free differentiation media containing 0.05ug/ml Activin A (R&D 338-AC), 0.01ug/ml BMP4 (R&D 314-BP), 0.01ug/ml FGF2 (R&D 233-FB), 0.01ug/ml VEGF (R&D 293VE), and 10 mM Y-27632. On Day 6, cells were refed with the same media without Y-27632. Cells were then differentiated in media conditions as previously described (18) for days 7-20. On Day 20, cells were refed with hepatic differentiation media containing T3 at a concentration of either 10nM or 100nM or control vehicle. 24 hours later, cells were harvested, and total RNA extracted using an miRNeasy kit (Qiagen). Quality of directed differentiation was confirmed by quantification of expression of markers of definitive endoderm (CKIT/CXCR4) on Day 5 of directed differentiation (18).
RNA-Seq analysis
Ribosomal RNA (rRNA) was removed from total RNA extracted as described above, using an NEBNext depletion kit (catalog no. E6310X) according to the manufacturer’s instructions. rRNA-depleted RNA was subsequently used to generate paired-end sequencing libraries using the Illumina RNA Nextera XT DNA Library Preparation Kit (FC-131) according to the manufacturer’s instructions. Quantity and quality of RNA-Seq libraries were analyzed by Qubit and Agilent Bioanalyzer, respectively. Libraries were pooled at a final concentration of 2.22pM and sequenced by a NextSeq 500 system (36bp, paired-end reads).
Computational RNA-Seq analysis
For RNA-Seq analysis, reads were aligned to the mm10 mouse genome using TopHat2 (51). PCR duplicates and low-quality reads were removed by Picard and processed using SAMtools (44). Filtered reads were assigned to the annotated transcriptome and quantified using feature Counts (52). Normalization and differential expression analysis were performed using EdgeR (47). For differential gene expression analysis, we tested only those genes that were detected in at least two samples with log2CPM ≥ 2. Genes were considered significant if they passed a fold change (FC) cutoff of log2FC ≥ 1 and a false discovery rate (FDR) cutoff of FDR ≤ 0.05. Gene set enrichment analysis was performed using DAVID Bioinformatics Resources 6.8 (53).
Statistical Analysis
The differences between groups across experiments were analyzed using GraphPad Prism 9 software by One-Way, Two-Way ANOVA and Tukeys multiple comparisons test or the Mann-Whitney U test as appropriate.
Supplementary Material
Acknowledgments
We thank Johan Auwerx (EPFL) for the NCoR1 floxed mice, Karine Gauthier (ENSL) for the floxed TRβ mice, and Jay Horton (UTSW) for the ChREBP floxed mice.
Funding:
This work was supported by the American Diabetes Association Grant 1-17-PMF-007 (to A.M.), the JumpStart Research Career Development Program (to A.M.), NIH Grants DK056123 and DK098525 (to A.N.H.), NIH Grants DK048873, DK056626 and DK103046 (to D.E.C.), the Boston Nutrition Obesity Research Center Functional Genomics Core Grant P30 DK046200 (to A.L., D.E.T., C.J., and L.T.), and the intramural research program at NIDDK at the National Institutes of Health (to Y.F., H.L., D.F.)
Footnotes
Competing interests: The authors declare that they have no competing interests.
Data and materials availability: The ChIP-seq and RNA seq data have been deposited to the NCBI GEO database, accession no. GSE133110. All other data needed to evaluate the conclusions in the paper are present in the paper or the Supplementary Materials.
References and Notes:
- 1.Sinha RA, Singh BK, Yen PM. Direct effects of thyroid hormones on hepatic lipid metabolism. Nature Reviews Endocrinology. 2018;14(5):259–69. doi: 10.1038/nrendo.2018.10. [DOI] [PMC free article] [PubMed] [Google Scholar]
- 2.Harrison SA, Bashir MR, Guy CD, Zhou R, Moylan CA, Frias JP, et al. Resmetirom (MGL-3196) for the treatment of non-alcoholic steatohepatitis: a multicentre, randomised, double-blind, placebo-controlled, phase 2 trial. Lancet. 2019;394(10213):2012–24. doi: 10.1016/s0140-6736(19)32517-6. [DOI] [PubMed] [Google Scholar]
- 3.Williams R, Aspinall R, Bellis M, Camps-Walsh G, Cramp M, Dhawan A, et al. Addressing liver disease in the UK: a blueprint for attaining excellence in health care and reducing premature mortality from lifestyle issues of excess consumption of alcohol, obesity, and viral hepatitis. Lancet. 2014;384(9958):1953–97. doi: 10.1016/s0140-6736(14)61838-9. [DOI] [PubMed] [Google Scholar]
- 4.Finan B, Clemmensen C, Zhu ZM, Stemmer K, Gauthier K, Muller L, et al. Chemical Hybridization of Glucagon and Thyroid Hormone Optimizes Therapeutic Impact for Metabolic Disease. Cell. 2016;167(3):843-+. doi: 10.1016/j.cell.2016.09.014. [DOI] [PubMed] [Google Scholar]
- 5.Cheng SY, Leonard JL, Davis PJ. Molecular Aspects of Thyroid Hormone Actions. Endocrine Reviews. 2010;31(2):139–70. doi: 10.1210/er.2009-0007. [DOI] [PMC free article] [PubMed] [Google Scholar]
- 6.Oberoi J, Fairall L, Watson PJ, Yang JC, Czimmerer Z, Kampmann T, et al. Structural basis for the assembly of the SMRT/NCoR core transcriptional repression machinery. Nature Structural & Molecular Biology. 2011;18(2):177–U239. doi: 10.1038/nsmb.1983. [DOI] [PMC free article] [PubMed] [Google Scholar]
- 7.McKenna NJ, Lanz RB, O’Malley BW. Nuclear receptor coregulators: Cellular and molecular biology. Endocrine Reviews. 1999;20(3):321–44. doi: 10.1210/er.20.3.321. [DOI] [PubMed] [Google Scholar]
- 8.Astapova I, Ramadoss P, Costa-E-Sousa RH, Ye F, Holtz KA, Li YX, et al. Hepatic nuclear corepressor 1 regulates cholesterol absorption through a TR beta 1-governed pathway. Journal of Clinical Investigation. 2014;124(5):1976–86. doi: 10.1172/jci73419. [DOI] [PMC free article] [PubMed] [Google Scholar]
- 9.Mendoza A, Astapova I, Shimizu H, Gallop MR, Al-Sowaimel L, MacGowan SMD, et al. NCoR1-independent mechanism plays a role in the action of the unliganded thyroid hormone receptor. Proceedings of the National Academy of Sciences. 2017. [DOI] [PMC free article] [PubMed] [Google Scholar]
- 10.Singh BK, Sinha RA, Tripathi M, Mendoza A, Ohba K, Sy JAC, et al. Thyroid hormone receptor and ERR. coordinately regulate mitochondrial fission, mitophagy, biogenesis, and function. Science Signaling. 2018;11(536):17. doi: 10.1126/scisignal.aam5855. [DOI] [PubMed] [Google Scholar]
- 11.Alenghat T, Meyers K, Mullican SE, Leitner K, Adeniji-Adele A, Avila J, et al. Nuclear receptor corepressor and histone deacetylase 3 govern circadian metabolic physiology. Nature. 2008;456(7224):997–U88. doi: 10.1038/nature07541. [DOI] [PMC free article] [PubMed] [Google Scholar]
- 12.You SH, Lim HW, Sun Z, Broache M, Won KJ, Lazar MA. Nuclear receptor corepressors are required for the histone-deacetylase activity of HDAC3 in vivo. Nature Structural & Molecular Biology. 2013;20(2):182–7. doi: 10.1038/nsmb.2476. [DOI] [PMC free article] [PubMed] [Google Scholar]
- 13.Mendoza A, Hollenberg AN. New insights into thyroid hormone action. Pharmacology & Therapeutics. 2017;173:135–45. doi: 10.1016/j.pharmthera.2017.02.012. [DOI] [PMC free article] [PubMed] [Google Scholar]
- 14.Shimizu H, Astapova I, Ye F, Bilban M, Cohen RN, Hollenberg AN. NCoR1 and SMRT Play Unique Roles in Thyroid Hormone Action In Vivo. Molecular and Cellular Biology. 2015;35(3):555–65. doi: 10.1128/mcb.01208-14. [DOI] [PMC free article] [PubMed] [Google Scholar]
- 15.Astapova I, Lee LJ, Morales C, Tauber S, Bilban M, Hollenberg AN. The nuclear corepressor, NCoR, regulates thyroid hormone action in vivo. Proceedings of the National Academy of Sciences of the United States of America. 2008;105(49):19544–9. doi: 10.1073/pnas.0804604105. [DOI] [PMC free article] [PubMed] [Google Scholar]
- 16.You SH, Lim HW, Sun Z, Broache M, Won KJ, Lazar MA. Nuclear receptor corepressors are required for the histone-deacetylase activity of HDAC3 in vivo. Nature Structural & Molecular Biology. 2013;20(2):182–7. doi: 10.1038/nsmb.2476. [DOI] [PMC free article] [PubMed] [Google Scholar]
- 17.Ramadoss P, Abraham BJ, Tsai L, Zhou YM, Costa-e-Sousa RH, Ye FL, et al. Novel Mechanism of Positive versus Negative Regulation by Thyroid Hormone Receptor beta 1 (TR beta 1) Identified by Genome-wide Profiling of Binding Sites in Mouse Liver. Journal of Biological Chemistry. 2014;289(3):1313–28. doi: 10.1074/jbc.M113.521450. [DOI] [PMC free article] [PubMed] [Google Scholar]
- 18.Wilson AA, Ying L, Liesa M, Segeritz CP, Mills JA, Shen SS, et al. Emergence of a Stage-Dependent Human Liver Disease Signature with Directed Differentiation of Alpha-1 Antitrypsin-Deficient iPS Cells. Stem Cell Reports. 2015;4(5):873–85. doi: 10.1016/j.stemcr.2015.02.021. [DOI] [PMC free article] [PubMed] [Google Scholar]
- 19.Hemmer MC, Wierer M, Schachtrup K, Downes M, Hübner N, Evans RM, et al. E47 modulates hepatic glucocorticoid action. Nat Commun. 2019;10(1):306. Epub 2019/01/20. doi: 10.1038/s41467-018-08196-5. [DOI] [PMC free article] [PubMed] [Google Scholar]
- 20.Gauthier K, Billon C, Bissler M, Beylot M, Lobaccaro JM, Vanacker JM, et al. Thyroid Hormone Receptor beta (TR beta) and Liver X Receptor (LXR) Regulate Carbohydrate-response Element-binding Protein (ChREBP) Expression in a Tissue-selective Manner. Journal of Biological Chemistry. 2010;285(36):28156–63. doi: 10.1074/jbc.M110.146241. [DOI] [PMC free article] [PubMed] [Google Scholar]
- 21.Hashimoto K, Ishida E, Matsumoto S, Okada S, Yamada M, Satoh T, et al. Carbohydrate Response Element Binding Protein Gene Expression Is Positively Regulated by Thyroid Hormone. Endocrinology. 2009;150(7):3417–24. doi: 10.1210/en.2009-0059. [DOI] [PMC free article] [PubMed] [Google Scholar]
- 22.Herman MA, Peroni OD, Villoria J, Schon MR, Abumrad NA, Bluher M, et al. A novel ChREBP isoform in adipose tissue regulates systemic glucose metabolism. Nature. 2012;484(7394):333–U66. doi: 10.1038/nature10986. [DOI] [PMC free article] [PubMed] [Google Scholar]
- 23.Katz LS, Baumel-Alterzon S, Scott DK, Herman MA. Adaptive and maladaptive roles for ChREBP in the liver and pancreatic islets. J Biol Chem. 2021;296:100623. Epub 2021/04/05. doi: 10.1016/j.jbc.2021.100623. [DOI] [PMC free article] [PubMed] [Google Scholar]
- 24.Benhamed F, Denechaud PD, Lemoine M, Robichon C, Moldes M, Bertrand-Michel J, et al. The lipogenic transcription factor ChREBP dissociates hepatic steatosis from insulin resistance in mice and humans. Journal of Clinical Investigation. 2012;122(6):2176–94. doi: 10.1172/jci41636. [DOI] [PMC free article] [PubMed] [Google Scholar]
- 25.Kim M, Astapova II, Flier SN, Hannou SA, Doridot L, Sargsyan A, et al. Intestinal, but not hepatic, ChREBP is required for fructose tolerance. Jci Insight. 2017;2(24). doi: 10.1172/jci.insight.96703. [DOI] [PMC free article] [PubMed] [Google Scholar]
- 26.Linden AG, Li SL, Choi HY, Fang F, Fukasawa M, Uyeda K, et al. Interplay between ChREBP and SREBP-1c coordinates postprandial glycolysis and lipogenesis in livers of mice. Journal of Lipid Research. 2018;59(3):475–87. doi: 10.1194/jlr.M081836. [DOI] [PMC free article] [PubMed] [Google Scholar]
- 27.Schlein C, Fischer AW, Sass F, Worthmann A, Tödter K, Jaeckstein MY, et al. Endogenous Fatty Acid Synthesis Drives Brown Adipose Tissue Involution. Cell Rep. 2021;34(2):108624. Epub 2021/01/14. doi: 10.1016/j.celrep.2020.108624. [DOI] [PMC free article] [PubMed] [Google Scholar]
- 28.Iizuka K, Miller B, Uyeda K. Deficiency of carbohydrate-activated transcription factor ChREBP prevents obesity and improves plasma glucose control in leptin-deficient (ob/ob) mice. American Journal of Physiology-Endocrinology and Metabolism. 2006;291(2):E358–E64. doi: 10.1152/ajpendo.00027.2006. [DOI] [PubMed] [Google Scholar]
- 29.Jois T, Chen WY, Howard V, Harvey R, Youngs K, Thalmann C, et al. Deletion of hepatic carbohydrate response element binding protein (ChREBP) impairs glucose homeostasis and hepatic insulin sensitivity in mice. Molecular Metabolism. 2017;6(11):1381–94. doi: 10.1016/j.molmet.2017.07.006. [DOI] [PMC free article] [PubMed] [Google Scholar]
- 30.Iizuka K, Bruick RK, Liang G, Horton JD, Uyeda K. Deficiency of carbohydrate response element-binding protein (ChREBP) reduces lipogenesis as well as glycolysis. Proceedings of the National Academy of Sciences of the United States of America. 2004;101(19):7281–6. doi: 10.1073/pnas.0401516101. [DOI] [PMC free article] [PubMed] [Google Scholar]
- 31.Li PP, Fan WQ, Xu JF, Lu M, Yamamoto H, Auwerx J, et al. Adipocyte NCoR Knockout Decreases PPAR gamma Phosphorylation and Enhances PPAR gamma Activity and Insulin Sensitivity. Cell. 2011;147(4):815–26. doi: 10.1016/j.cell.2011.09.050. [DOI] [PMC free article] [PubMed] [Google Scholar]
- 32.Yamamoto H, Williams EG, Mouchiroud L, Canto C, Fan WW, Downes M, et al. NCoR1 Is a Conserved Physiological Modulator of Muscle Mass and Oxidative Function. Cell. 2011;147(4):827–39. doi: 10.1016/j.cell.2011.10.017. [DOI] [PMC free article] [PubMed] [Google Scholar]
- 33.Selmi-Ruby S, Bouazza L, Obregon MJ, Conscience A, Flamant F, Samarut J, et al. The Targeted Inactivation of TR beta Gene in Thyroid Follicular Cells Suggests a New Mechanism of Regulation of Thyroid Hormone Production. Endocrinology. 2014;155(2):635–46. doi: 10.1210/en.2013-1435. [DOI] [PubMed] [Google Scholar]
- 34.Folch J, Lees M, Stanley GHS. A SIMPLE METHOD FOR THE ISOLATION AND PURIFICATION OF TOTAL LIPIDES FROM ANIMAL TISSUES. Journal of Biological Chemistry. 1957;226(1):497–509. [PubMed] [Google Scholar]
- 35.Alves-Bezerra M, Li YX, Acuna M, Ivanova AA, Corey KE, Ortlund EA, et al. Thioesterase Superfamily Member 2 Promotes Hepatic VLDL Secretion by Channeling Fatty Acids Into Triglyceride Biosynthesis. Hepatology. 2019;70(2):496–510. doi: 10.1002/hep.30411. [DOI] [PMC free article] [PubMed] [Google Scholar]
- 36.Folch J, Lees M, Sloane Stanley GH. A simple method for the isolation and purification of total lipides from animal tissues. J Biol Chem. 1957;226(1):497–509. Epub 1957/05/01. [PubMed] [Google Scholar]
- 37.Kang S, Tsai LT, Zhou YM, Evertts A, Xu S, Griffin MJ, et al. Identification of nuclear hormone receptor pathways causing insulin resistance by transcriptional and epigenomic analysis. Nature Cell Biology. 2015;17(1):44-+. doi: 10.1038/ncb3080. [DOI] [PMC free article] [PubMed] [Google Scholar]
- 38.Young-Wook C, Chen-Che JH, DV M, Hong L, Yulong F, Douglas F. Transcriptional and Genomic Regulation of Pituitary Function by Thyroid Hormone Receptor Beta. Journal of the Endocrine Society. 2021;Volume 5(Issue Supplement_1):A980–A1. [Google Scholar]
- 39.Forrest D, Hanebuth E, Smeyne RJ, Everds N, Stewart CL, Wehner JM, et al. Recessive resistance to thyroid hormone in mice lacking thyroid hormone receptor beta: Evidence for tissue-specific modulation of receptor function. Embo Journal. 1996;15(12):3006–15. [PMC free article] [PubMed] [Google Scholar]
- 40.Driegen S, Ferreira R, van Zon A, Strouboulis J, Jaegle M, Grosveld F, et al. A generic tool for biotinylation of tagged proteins in transgenic mice. Transgenic Research. 2005;14(4):477–82. doi: 10.1007/s11248-005-7220-2. [DOI] [PubMed] [Google Scholar]
- 41.Amma LL, Campos-Barros A, Wang ZD, Vennstrom B, Forrest D. Distinct tissue-specific roles for thyroid hormone receptors beta and alpha 1 in regulation of type 1 deiodinase expression. Molecular Endocrinology. 2001;15(3):467–75. doi: 10.1210/me.15.3.467. [DOI] [PubMed] [Google Scholar]
- 42.He A, Pu WT. Genome-wide location analysis by pull down of in vivo biotinylated transcription factors. Current protocols in molecular biology. 2010;Chapter 21:Unit 21.0-Unit .0. doi: 10.1002/0471142727.mb2120s92. [DOI] [PMC free article] [PubMed] [Google Scholar]
- 43.Langmead B, Salzberg SL. Fast gapped-read alignment with Bowtie 2. Nature Methods. 2012;9(4):357–U54. doi: 10.1038/nmeth.1923. [DOI] [PMC free article] [PubMed] [Google Scholar]
- 44.Li H, Handsaker B, Wysoker A, Fennell T, Ruan J, Homer N, et al. The Sequence Alignment/Map format and SAMtools. Bioinformatics. 2009;25(16):2078–9. doi: 10.1093/bioinformatics/btp352. [DOI] [PMC free article] [PubMed] [Google Scholar]
- 45.Zhang Y, Liu T, Meyer CA, Eeckhoute J, Johnson DS, Bernstein BE, et al. Model-based Analysis of ChIP-Seq (MACS). Genome Biology. 2008;9(9):9. doi: 10.1186/gb-2008-9-9-r137. [DOI] [PMC free article] [PubMed] [Google Scholar]
- 46.Quinlan AR, Hall IM. BEDTools: a flexible suite of utilities for comparing genomic features. Bioinformatics. 2010;26(6):841–2. doi: 10.1093/bioinformatics/btq033. [DOI] [PMC free article] [PubMed] [Google Scholar]
- 47.Robinson MD, McCarthy DJ, Smyth GK. edgeR: a Bioconductor package for differential expression analysis of digital gene expression data. Bioinformatics. 2010;26(1):139–40. doi: 10.1093/bioinformatics/btp616. [DOI] [PMC free article] [PubMed] [Google Scholar]
- 48.Kent WJ, Zweig AS, Barber G, Hinrichs AS, Karolchik D. BigWig and BigBed: enabling browsing of large distributed datasets. Bioinformatics. 2010;26(17):2204–7. doi: 10.1093/bioinformatics/btq351. [DOI] [PMC free article] [PubMed] [Google Scholar]
- 49.Lawrence M, Huber W, Pages H, Aboyoun P, Carlson M, Gentleman R, et al. Software for Computing and Annotating Genomic Ranges. Plos Computational Biology. 2013;9(8):10. doi: 10.1371/journal.pcbi.1003118. [DOI] [PMC free article] [PubMed] [Google Scholar]
- 50.Kurmann AAaSMaHFaRSAaMMaAIaUSaLSaBMaR. Regeneration of Thyroid Function by Transplantation of Differentiated Pluripotent Stem Cells. Stem Cell. 2015;17(5):527–42. doi: 10.1016/j.stem.2015.09.004. [DOI] [PMC free article] [PubMed] [Google Scholar]
- 51.Kim D, Pertea G, Trapnell C, Pimentel H, Kelley R, Salzberg SL. TopHat2: accurate alignment of transcriptomes in the presence of insertions, deletions and gene fusions. Genome Biology. 2013;14(4):13. doi: 10.1186/gb-2013-14-4-r36. [DOI] [PMC free article] [PubMed] [Google Scholar]
- 52.Liao Y, Smyth GK, Shi W. featureCounts: an efficient general purpose program for assigning sequence reads to genomic features. Bioinformatics. 2014;30(7):923–30. doi: 10.1093/bioinformatics/btt656. [DOI] [PubMed] [Google Scholar]
- 53.Huang DW, Sherman BT, Lempicki RA. Systematic and integrative analysis of large gene lists using DAVID bioinformatics resources. Nature Protocols. 2009;4(1):44–57. doi: 10.1038/nprot.2008.211. [DOI] [PubMed] [Google Scholar]
Associated Data
This section collects any data citations, data availability statements, or supplementary materials included in this article.