. 2022 Jan 27;11:e76554. doi: 10.7554/eLife.76554

Figure 3. Small molecule choline trimethylamine (TMA) lyase inhibition with fluoromethylcholine (FMC) protects mice against ethanol-induced liver injury.

Nine- to eleven-week-old female C57BL6/J mice were fed either ethanol-fed or pair-fed in the presence and absence of FMC as described in the methods. Plasma levels of TMA (A), trimethylamine N-oxide (TMAO) (B), choline (C), carnitine (D), and betaine (E) were measured by mass spectrometry (n = 3–5). Plasma alanine aminotransferase (ALT) (F) were measured at necropsy (n = 4–5). Liver triglycerides (G), total cholesterol (H), cholesterol esters (I), and free cholesterol (J) were measured enzymatically (n = 4–5). (K) Representative H&E staining of livers from pair and EtOH-fed mice in the presence and absence of FMC. (L) Hepatic messenger RNA levels of tumor necrosis factor alpha (Tnfα). Statistics were completed by a two-way analysis of variance (ANOVA) followed by a Tukey’s multiple comparison test. *p ≤ 0.05; **p ≤ 0.01; ***p ≤ 0.001; ****p ≤ 0.0001. All data are presented as mean ± SEM, unless otherwise noted.

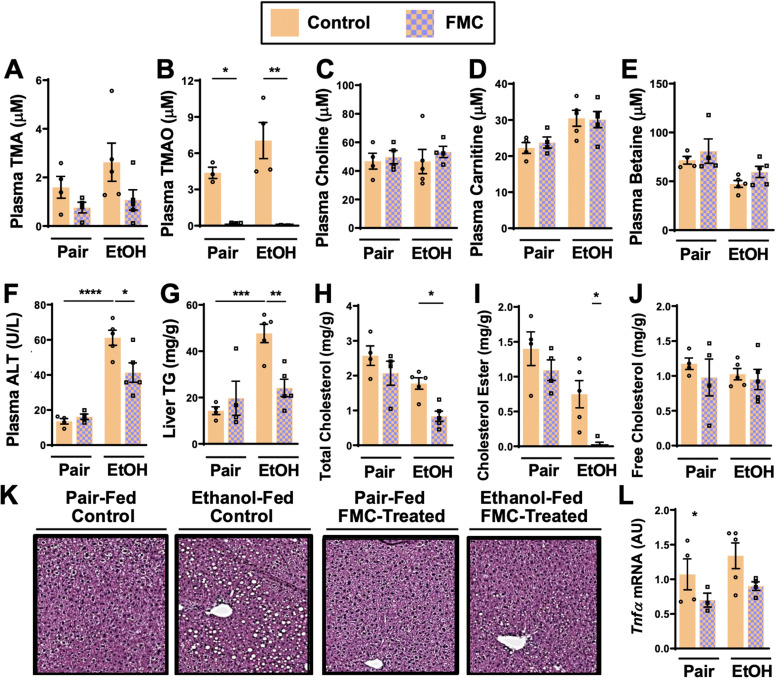
Figure 3.

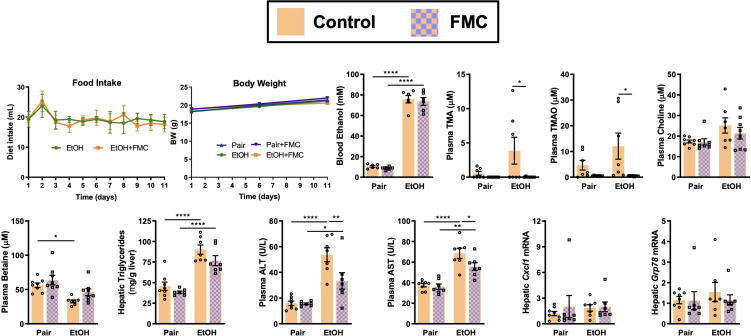
Figure 3—figure supplement 1. Small molecule inhibition of gut microbial trimethylamine (TMA) lyase activity with fluoromethylcholine (FMC) in a second model of ethanol-induced liver injury.

Figure 3—figure supplement 1.

In this study, mice were exposed to a 10-day chronic model in which mice were allowed free access to a 5% vol/vol (27% kcal) for 10 days (Bertola et al., 2013). Ethanol-fed mice were allowed ad libitum access to liquid diet. Control mice were pair-fed a diet that received isocalorically substituted maltose dextrin for ethanol. Some cohorts received choline TMA lyase inhibitor FMC (0.006% wt/wt) in these liquid diets throughout the entire 10-day feeding period. Statistics were completed by a two-way analysis of variance (ANOVA) followed by a Tukey’s multiple comparison test. *p ≤ 0.05; **p ≤ 0.01; ***p ≤ 0.001; ****p ≤ 0.0001. All data are (n = 5–8 per group) presented as mean ± SEM.
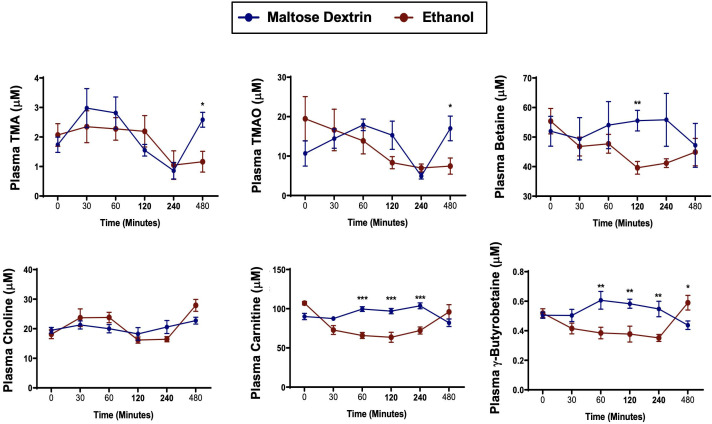
Figure 3—figure supplement 2. A single bolus of ethanol does not significantly alter trimethylamine (TMA) or trimethylamine N-oxide (TMAO) levels in mice.

Figure 3—figure supplement 2.

Nine- to eleven-week-old female C57BL6/J mice were fed Lieber DeCarli liquid control diet for 6 days (n = 5). On the seventh day, mice were gavaged with a bolus of maltose (9 g/kg) or ethanol (5 g/kg) and plasma was collected at several time points thereafter to examine acute alterations in TMA and related metabolites TMAO, betaine, choline, L-carnitine, and γ-butyrobetaine. Data were analyzed by a Student’s t-test comparing the ethanol-fed mice to the maltose dextrin-gavaged mice. *p ≤ 0.05; **p ≤ 0.01; ***p ≤ 0.001. All data are presented as mean ± SEM, unless otherwise noted.