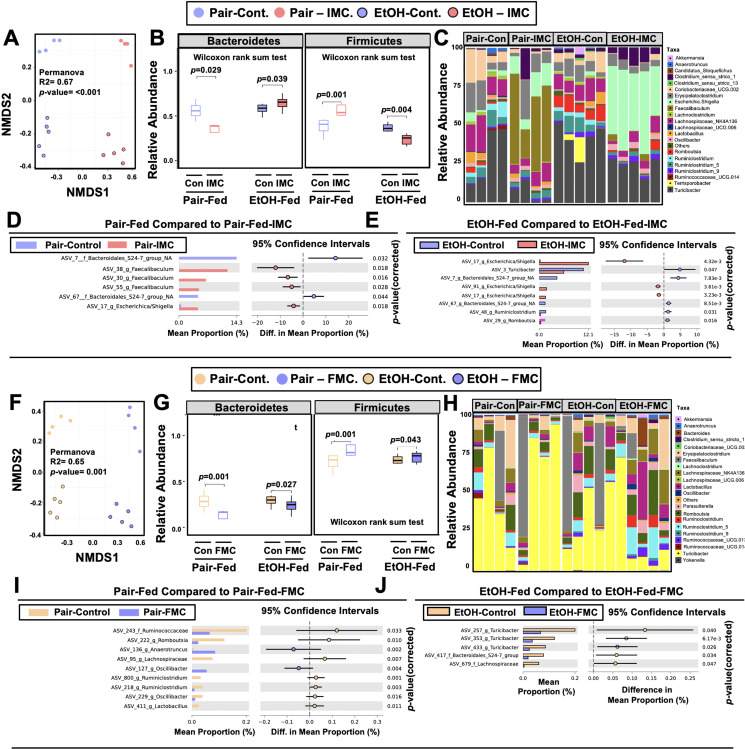
Figure 4. Small molecule choline trimethylamine (TMA) lyase inhibition promotes remodeling of the gut microbiome in an ethanol-dependent manner.
Nine- to eleven-week-old female C57BL6/J mice were fed either ethanol-fed or pair-fed in the presence and absence of iodomethylcholine (IMC) or fluoromethylcholine (FMC) as described in the methods. (A) Non-metric multidimensional scaling (NMDS) plots based on the Bray-Curtis index between the pair, EtOH, pair + 0.06% IMC, and EtOH + 0.06% IMC groups, Statistical analysis was performed with permutational multivariate analysis of variance (PERMANOVA), and p-values are labeled in plots. R2 values are noted for comparisons with significant p-values and stand for percentage variance explained by the variable of interest. (B) Boxplots of relative abundance patterns for Firmicutes and Bacteroidetes distinguishing pair, EtOH, pair + 0.06% IMC and EtOH + 0.06% IMC groups. Statistical analysis was performed with Mann-Whitney U test (also called the Wilcoxon rank-sum test, p-values are labeled in plots). Plotted are interquartile ranges (boxes), and dark lines in boxes are medians. (C) Stacked bar charts of relative abundance (left y-axis) of the top 20 genera assembled across all four groups (pair, EtOH, pair + 0.06% IMC, and EtOH + 0.06% IMC groups). Pairwise differential abundance analyses between (D) pair-fed and pair-fed + 0.06% IMC and (E) EtOH-fed and EtOH-fed + 0.06% IMC group. Statistical analysis was performed with White’s non-parametric t-test (p-values are labeled in plots). (F) NMDS plots based on the Bray-Curtis index between the pair, EtOH, pair + 0.006% FMC, and EtOH + 0.006% FMC groups, Statistical analysis was performed with permutational multivariate analysis of variance (PERMANOVA), and p-values are labeled in plots. R2 values are noted for comparisons with significant p-values and stand for percentage variance explained by the variable of interest. (G) Boxplots of relative abundance patterns for Firmicutes and Bacteroidetes distinguishing pair, EtOH, pair + 0.006% FMC, and EtOH + 0.006% FMC groups. Statistical analysis was performed with Mann-Whitney U test (also called the Wilcoxon rank-sum test, p-values are labeled in plots). Plotted are interquartile ranges (boxes), and dark lines in boxes are medians. (H) Stacked bar charts of relative abundance (left y-axis) of the top 20 genera assembled across all four groups (pair, EtOH, pair + 0.06% FMC, and EtOH + 0.006% FMC groups). Pairwise differential abundance analyses between (I) pair-fed and pair-fed + 0.06% FMC, and (J) EtOH-fed and EtOH-fed + 0.006% FMC group. Statistical analysis was performed with White’s non-parametric t-test (p-values are labeled in plots).

