

Abstract
Insulators play a critical role in spatiotemporal gene regulation in animals. The evolutionarily conserved CCCTC-binding factor (CTCF) is required for insulator function in mammals, but not all of its binding sites act as insulators. Here, we explore the sequence requirements of CTCF-mediated transcriptional insulation using a sensitive insulator reporter in mouse embryonic stem cells (mESCs). We find that insulation potency depends on the number of CTCF binding sites in tandem. Furthermore, CTCF-mediated insulation is dependent on upstream flanking sequences at its binding sites. CTCF binding sites at topologically associating domain (TAD) boundaries are more likely to function as insulators than those outside TAD boundaries, independently of binding strength. We demonstrate that insulators form local chromatin domain boundaries and weaken enhancer-promoter contacts. Taken together, our results provide genetic, molecular, and structural evidence connecting chromatin topology to the action of insulators in the mammalian genome.
The spatial and temporal patterns of gene expression are encoded in the genome in the form of cis-regulatory elements, which are categorized into promoters, enhancers, insulators, and other less-studied regulatory sequences, including repressive/silencing elements1–3. In animals, insulators play an essential role in cell-type-specific gene expression by protecting genes from improper regulatory signals from the neighboring chromatin environment4. Enhancer-blocking insulators act in a position-dependent manner in that they prevent enhancer-dependent gene activation only when placed in between the enhancer and target gene5–7. Insulators were initially identified in Drosophila, where the molecular machinery for insulation was first elucidated4, 5, 8. The first identified enhancer-blocking insulator in vertebrates is the 5’-HS4 element of the chicken β-globin locus9. Detailed analysis of this insulator led to the finding that the evolutionarily conserved zinc-finger family transcription factor CTCF, first identified as a DNA-binding protein at the chicken c-Myc gene promoter10, was essential for its enhancer-blocking activity11. Mutations in the CTCF protein or its binding sites at insulators have since been implicated in a broad spectrum of human diseases12–14. In addition to its function at insulators, CTCF has also been demonstrated to play roles in transcriptional repression, gene activation, alternative splicing, and class switch recombination depending on the context of genomic locus10, 15–19. There are reports that CTCF binding at gene promoters could promote, instead of block, enhancer-promoter interactions20, 21. To date, exactly how and where CTCF mediates insulator function remains unclear.
CTCF has long been postulated to function as an organizer of three-dimensional chromosome architecture1, 22, 23. Genome-wide chromosome conformation capture analyses showed that the interphase chromosomes in mammalian cells are partitioned into megabase-sized TADs24, 25, and CTCF binding sites were found at over 75% of TAD boundaries24, suggesting a probable link between TAD boundaries and CTCF-mediated transcriptional insulation. Supporting this connection, disruption of TAD boundaries has been shown to permit ectopic enhancer-promoter contacts and aberrant gene expression, thereby leading to developmental abnormalities and cancer16, 26. Additionally, depletion of CTCF can lead to the weakening or disappearance of TADs27–29. CTCF drives TAD formation by working together with the cohesin complex to establish dynamic chromatin loops between distant CTCF binding sites, likely through a loop-extrusion process29–39 or other mechanisms such as phase separation40–45. However, it is still debated whether TAD boundaries are sufficient to provide transcriptional insulation. Rapidly dissolving the global TAD structure by acute depletion of CTCF or cohesin subunits only altered transcription of a small number of genes in many different cellular contexts27, 29, 33, 35, 37, 46. Moreover, deletion of CTCF sites at the developmental locus Sox9-Kcnj2 TAD boundary did not cause discernible phenotypes47. Furthermore, a majority of CTCF binding sites are not located at TAD boundaries, and whether these CTCF sites may function as insulators is unclear. These observations warrant an in-depth investigation of the role that CTCF and TADs play in transcriptional insulation.
To better understand where and how CTCF may mediate transcriptional insulation in the genome, we have developed an insulator reporter assay to evaluate the function of any DNA fragments in blocking enhancer-dependent transcriptional activation in mESCs. Using this system, we demonstrated that isolated single CTCF sites have weak or no insulator activity, regardless of its DNA binding strength. Instead, multiple copies of CTCF sites placed in tandem can provide a potent insulation effect. We also observed that CTCF binding sites at TAD boundaries could function as potent insulators, while the CTCF sites not located at TAD boundaries were incapable of insulating transcription. We attributed this difference in insulation activity to a sequence located 10–20 bp upstream of the CTCF core motifs, which promotes optimal insulation likely through contacts with CTCF’s zinc fingers 9–11. We further discovered that insulators act by forming local TAD boundaries to reduce productive enhancer-promoter contacts, using both chromosome conformation capture assays and high-throughput multiplexed DNA fluorescence in situ hybridization (FISH) techniques. These results, taken together, shed light on how CTCF mediates transcriptional insulation in mammalian cells and establish a direct link between TAD boundaries and insulators.
Results
An insulator reporter assay in mouse embryonic stem cells
To quantitatively assay insulator activities in the context of native chromatin in cells, we engineered the Sox2 gene locus in the F123 hybrid mESC line (Mus musculus castaneus × S129/SvJae)48. We and others previously showed that a super-enhancer (SE) located ~110 kb downstream of the Sox2 gene was responsible for over 90% of its expression in the mESCs 49, 50. We reasoned that the insulator activity of DNA elements could be measured by the reduction in Sox2 gene expression when inserted between the Sox2 gene and the downstream super-enhancer. To create the insulator reporter, we first tagged the two copies of the Sox2 gene with egfp (CAST allele) and mcherry (129 allele) to quantify allelic Sox2 expression by live-cell fluorescence-activated cell sorting (FACS) (Fig. 1a, Extended Data Fig. 1a). Subsequently, we inserted a negative-selection fusion gene Tg(CAG-HyTK) flanked by a pair of heterotypic Flippase recognition sites (Frt/F3) between the Sox2 gene and its downstream super-enhancer on the CAST allele (Fig. 1a, Extended Data Fig. 1b). As enhancer-blocking insulation is position-dependent, we created a control clone with the same replaceable cassette placed further downstream of the Sox2 super-enhancer at equal distance on the CAST allele (Fig. 1a, Extended Data Fig. 1c). The Tg(CAG-HyTK) marker gene can be replaced by a donor sequence using the recombinase-mediated cassette exchange (RMCE) strategy (Fig. 1b, Supplementary Fig. 1a). By killing off unmodified mESCs with ganciclovir, we could achieve nearly 100% efficiency of marker-free insertion (Supplementary Fig. 1b).
Fig. 1 |. A sensitive insulator reporter assay measures the insulation activity of different CTCF binding sites at the Sox2 locus in mouse ES cells.

a, Left, the regulatory landscape of the Sox2 locus in mESCs. Orientations of CTCF sites are indicated on the top of the signal tracks; Right, genetic constructs of mESC lines. Boxed Sox2 in blue represents Sox2-p2a-egfp in situ fusion gene, boxed Sox2 in orange represents Sox2-p2a-mcherry in situ fusion gene. The hygromycin phosphotransferase-thymidine kinase fusion gene HyTK is flanked by Flippase recognition sites FRT and F3. b, Experimental scheme to insert a test sequence into the Sox2 locus by recombinase-mediated cassette exchange (RMCE). The Flippase expression plasmid and donor plasmid containing the test sequence were co-electroporated into cells. The orientation of the insert was controlled by the positions of the Not1 and Sbf1 restriction enzyme sites. Mouse ESC clones containing the insert were picked, genotyped, and allelic Sox2 expression was measured by FACS. c, A bar graph shows the normalized Sox2-eGFP expression of the no insertion clone (n = 8), different CBS insertion clones (n = 3; For Sox9_CBS1 in the forward orientation, n = 2.) and downstream insertion controls (n = 27). Each dot represents an independently picked colony. One-way analysis of variance with Bonferroni’s multiple comparisons test. Data are mean ± sd. The exact P values for each comparison are listed in Supplementary Table 9. ns P > 0.05, *P ≤ 0.05, **P ≤ 0.01, ***P ≤ 0.001, ****P ≤ 0.0001.
As the insertion was specifically on the CAST allele, we used the 129 allele as the internal control to correct clone-to-clone variations in Sox2 expression (Fig. 1b, Supplementary Fig. 2a–b), which allowed quantitative comparisons of insulator activities of different CTCF binding sites (CBSs). We tested the insulation activity of a total of 11 different CBSs selected from several known TAD boundaries and chromatin loop anchors (Supplementary Table 1). Each CBS insert was amplified from mouse or human genomic DNA by PCR and was 1–4 kb in length. Surprisingly, isolated single CBSs tested in both the forward and reverse orientations generally exhibited little or no insulator effect (Fig. 1c). Only two of the probed CBSs in reverse orientation and four of the probed CBSs in forward orientation showed significant yet modest insulator effects (Fig. 1c). The CBS of a canonical insulator, the HS5 sequence of the human beta-globin locus, reduced Sox2 expression by 11.0% ± 1.9% when inserted in forward orientation but had no effect in reverse orientation (Fig. 1c, Supplementary Fig. 2c–d). On average, individual isolated CBSs in forward and reverse orientations reduced Sox2 expression to 93.0%(±6.5%) and 97.0%(±6.0%) of parental cells with no insertion, respectively (Fig. 1c).
Tandem CTCF sites enable strong transcriptional insulation
We hypothesized that multiple CBSs collectively may provide more robust insulation, since TAD boundaries are enriched for clustered CTCF binding sites24, 51. To test this possibility, we constructed a series of insertion clones harboring multiple CBSs from the Sox9-Kcnj2 TAD boundary (Extended Data Fig. 2a). Two or more CBSs were PCR-amplified from mouse genomic DNA, ligated together and inserted in between the Sox2 gene and super-enhancer on the CAST allele by RMCE as described above. We found that two CBSs, in forward tandem, reverse tandem, or divergent orientations, all had significantly stronger insulation effect than individual CBSs alone (Fig. 2a). Notably, combining a weak CBS insulator with one that had a negligible insulator activity gave rise to stronger insulation than the summed effects of the two individual sites (Fig. 2a), suggesting that CBSs could have synergistic insulation effects. Nevertheless, a weak CBS insulator did not enhance the insulator activity of a stronger CBS insulator if placed in convergent orientation (Fig. 2a). Next, we measured the insulator activity of CBS clusters consisting of up to all four CBSs from the Sox9-Kcnj2 TAD boundary. ChIP-seq analyses indicated that CTCF was recruited to the extra copy of the boundary sequence inserted in the Sox2 domain (Extended Data Fig. 2b). We found that the insulation effect became stronger as the number of CBSs increased, regardless of the orientation of CTCF motifs (Fig. 2b, Supplementary Table 2). Interestingly, the enhancement of insulation conferred by each additional CBS became smaller when the number of CBSs exceeds two (Extended Data Fig. 2c). Consistent with the requirement for CTCF in transcriptional insulation, removal of the binding motifs of CTCF within the inserts completely abolished insulation effects of CBSs (Fig. 2c). Furthermore, introducing CTCF sites downstream of the Sox2 super-enhancer did not reduce but rather slightly increased Sox2 expression (Fig. 2b), likely due to the insulation of interactions between the super-enhancer and further downstream chromatin. Taken together, these results suggest that multiple CTCF binding sites arranged in tandem can function as a potent insulator due to synergistic or additive effects from individual sites.
Fig. 2 |. Multiple CTCF sites in tandem enable strong transcriptional insulation.
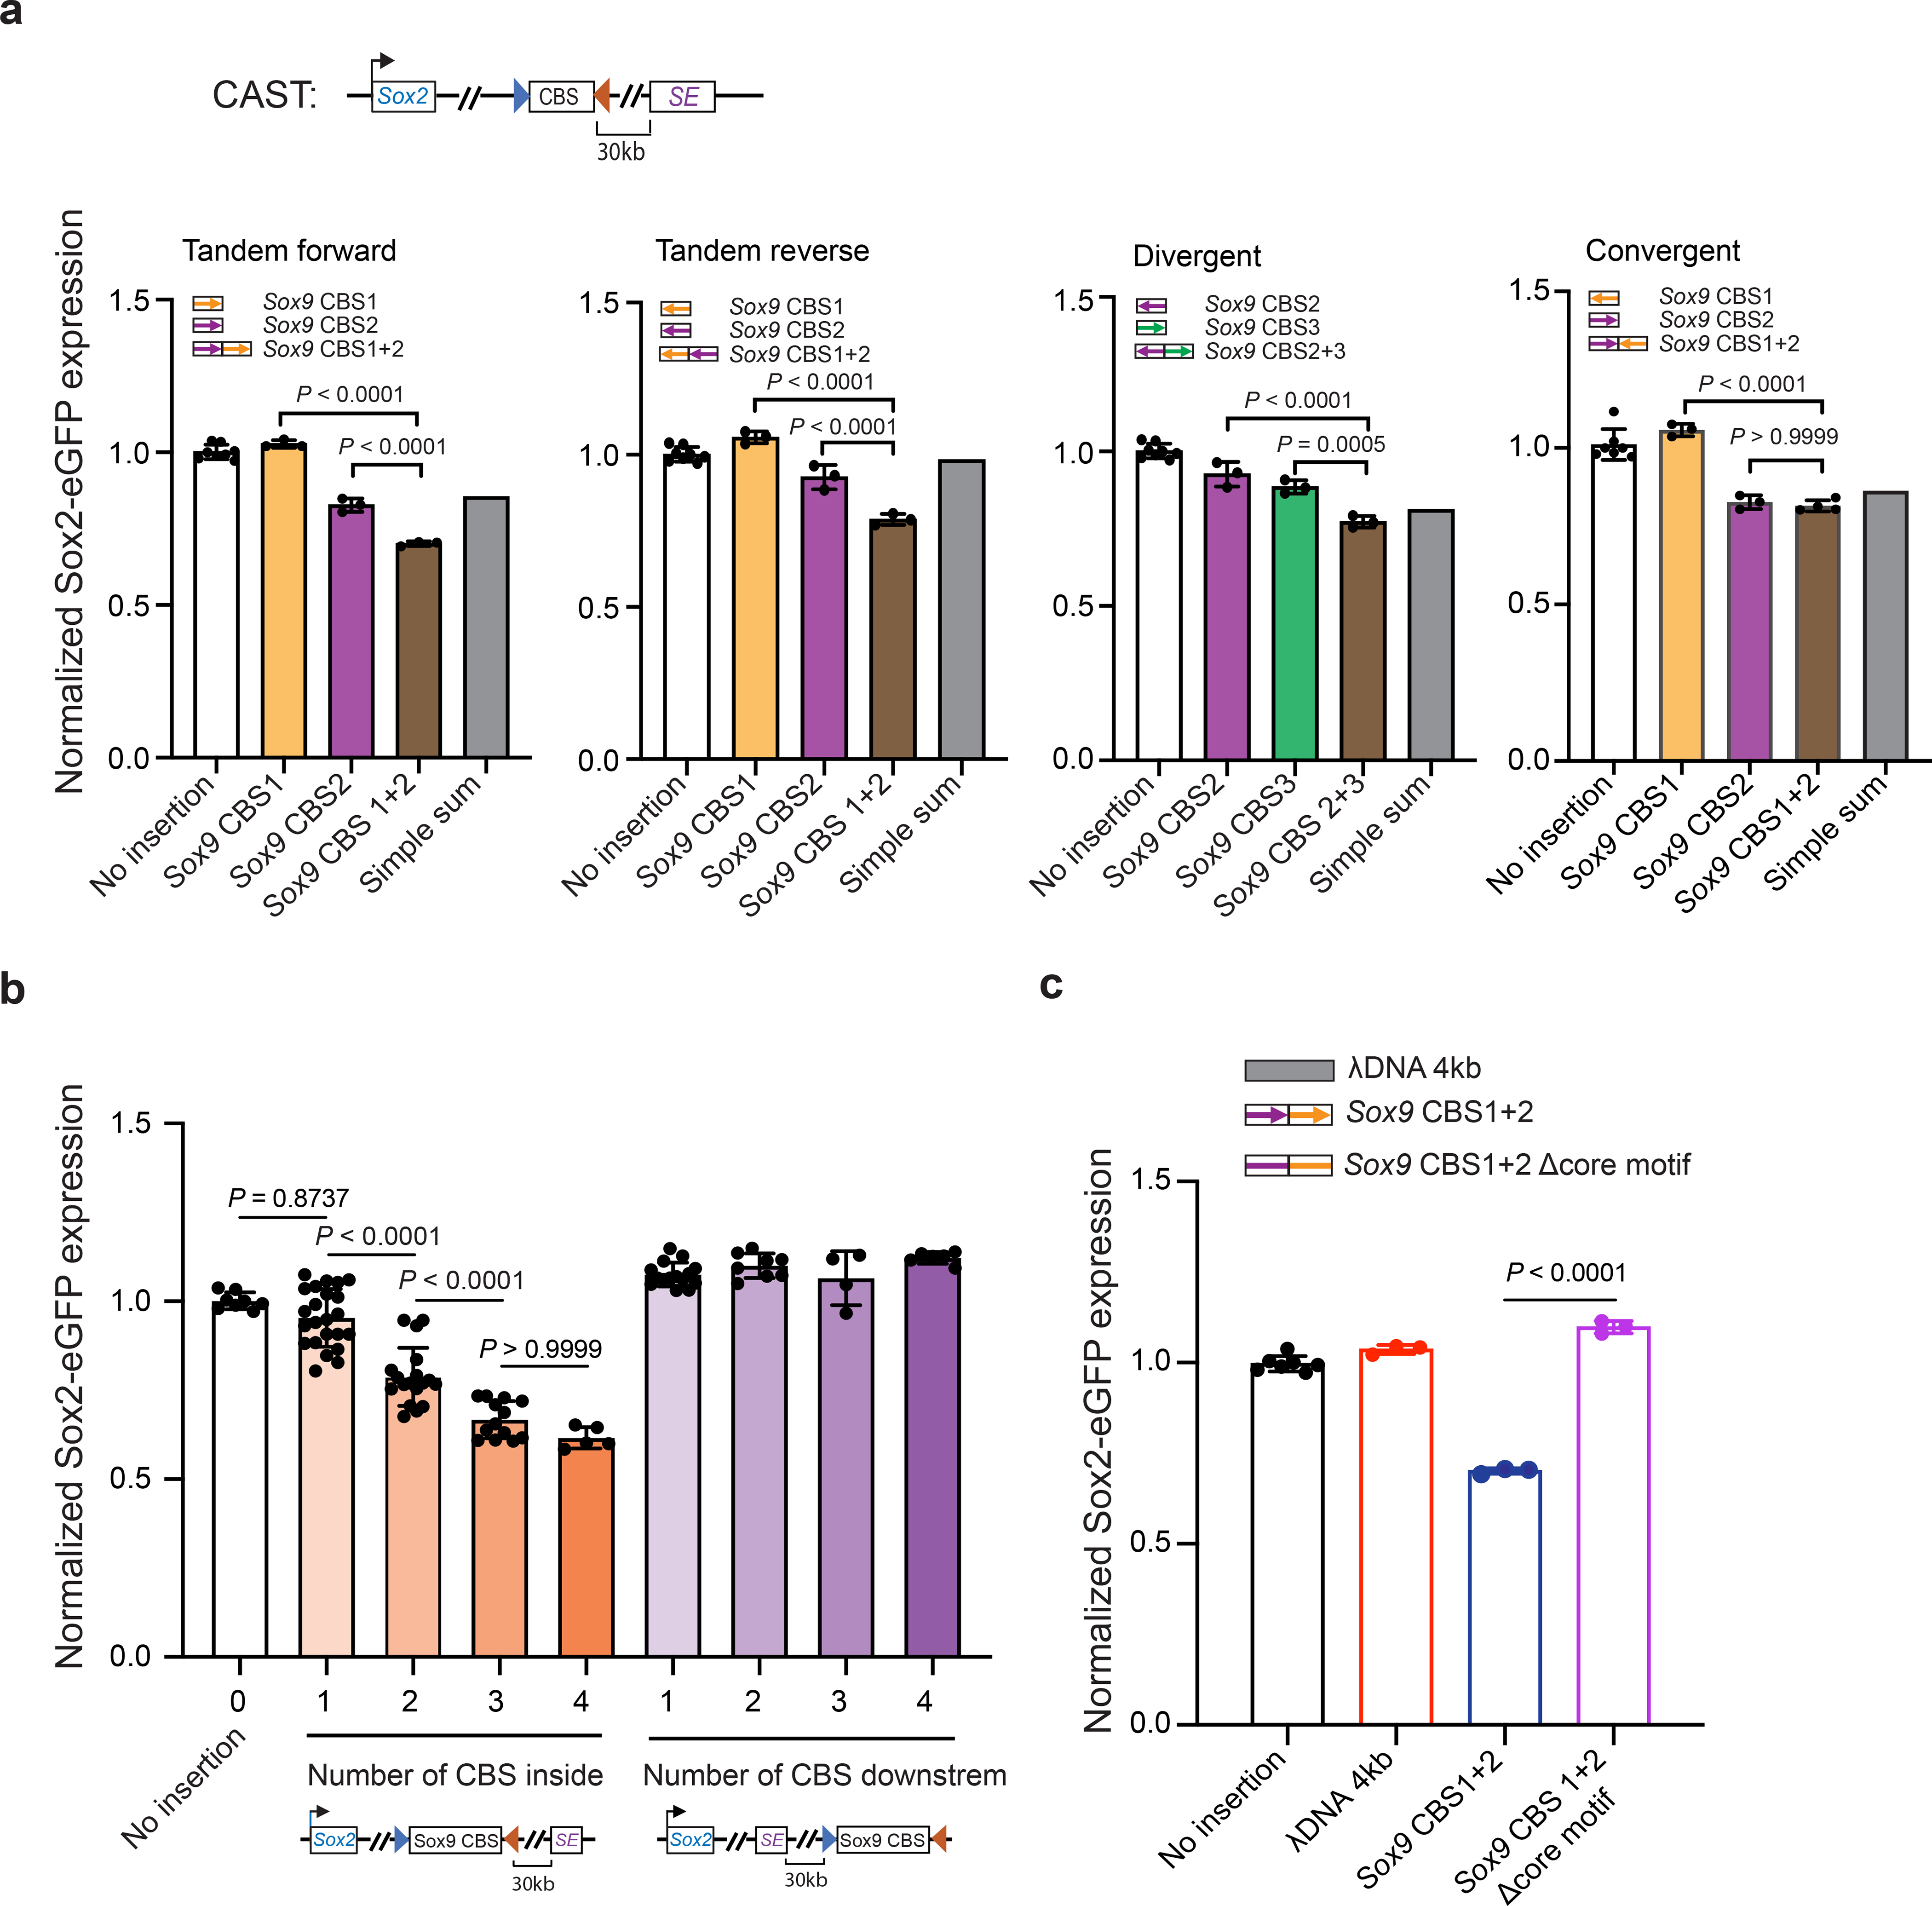
a, Bar graphs showing insulation effects of two combined CBSs from the Sox9-Kcnj2 TAD boundary (no insertion n = 8, for convergent group, n = 7; insertion clones n = 3, for Sox9 CBS1+2 in convergent group n = 4). Individual CBS sequences were combined by PCR to create two-CBS insertions. Arrows indicate the motif orientation of each individual CBS. Every insertion construct was created by an independent RMCE experiment. b, A bar graph shows insulation effects of multiple CBS from the Sox9-Kcnj2 TAD boundary. Individual or combined CBS sequences were PCR cloned from mouse genomic DNA. Every insertion construct was created by an independent RMCE experiment (0 CBS, n = 8; 1 CBS inside, n = 23; 2 CBS inside, n = 18; 3 CBS inside, n = 13; 4 CBS inside, n = 5; 1 CBS downstream, n = 15; 2 CBS downstream, n = 8; 3 CBS downstream, n = 4; 4 CBS downstream, n = 6.). c, A bar graph shows insulation effects of λ DNA (n = 3), a combined two-CBS sequence, Sox9 CBS1+2 (n = 3), and Sox9 CBS1+2 Δcore motifs, which is the same two-CBS sequence but with the two19-bp CTCF core motifs deleted (n = 3). Inserts were comparable in length (~4 kb). Data are mean ± sd. P values were determined by one-way analysis of variance with Bonferroni’s multiple comparisons test.
Surprisingly, we observed that the insulator containing four CBSs was able to reduce Sox2 expression by 38.47 ± 3.16%, rather than completely blocking the Sox2 super-enhancer activity (Fig. 2b). The reduction of Sox2 expression from the CAST allele was further confirmed by allele sensitive RNA-seq analysis (Extended Data Fig. 2d–e). Interestingly, this insulator substantially increased cell-to-cell variations in Sox2 expression, evidenced by the accumulation of cells with extremely low Sox2-eGFP signals (Extended Data Fig. 2f). Moreover, the sub-population of cells expressing ultra-low Sox2-eGFP could revert to the state of higher expression level after extended culturing, suggesting that the cell-to-cell variation of Sox2 gene expression was a metastable state (Extended Data Fig. 2g). Furthermore, CTCF insulation did not change the active chromatin state on either the Sox2 promoter or its enhancer (Extended Data Fig. 2h–i). Collectively, these results suggest that CBS-mediated insulation is permissive and highly dynamic.
CTCF-mediated insulation depends on sequence context
To better understand the sequence requirements for CTCF-mediated insulation, we synthesized insulators by concatenating multiple 139-bp genomic DNA sequences, each containing a 19-bp CTCF motif and two 60-bp flanking sequences. Each site was selected from the aforementioned CBSs (Supplementary Table 3–4). Consistent with the observations described above, the synthetic DNA sequences showed additive effects in transcriptional insulation (Extended Data Fig. 3a). Additionally, ChIP-seq analyses confirmed the recruitment of CTCF and the cohesin complex to the synthetic insulators (Fig. 3a). Interestingly, we observed that CBSs with longer flanking sequences (1 kb or longer) had stronger insulation effects than the shorter 139-bp CBSs, suggesting the existence of additional elements that could facilitate insulation (Extended Data Fig. 3b).
Fig. 3 |. Synthetic insulators reveal sequence requirements for CTCF-mediated enhancer-blocking.
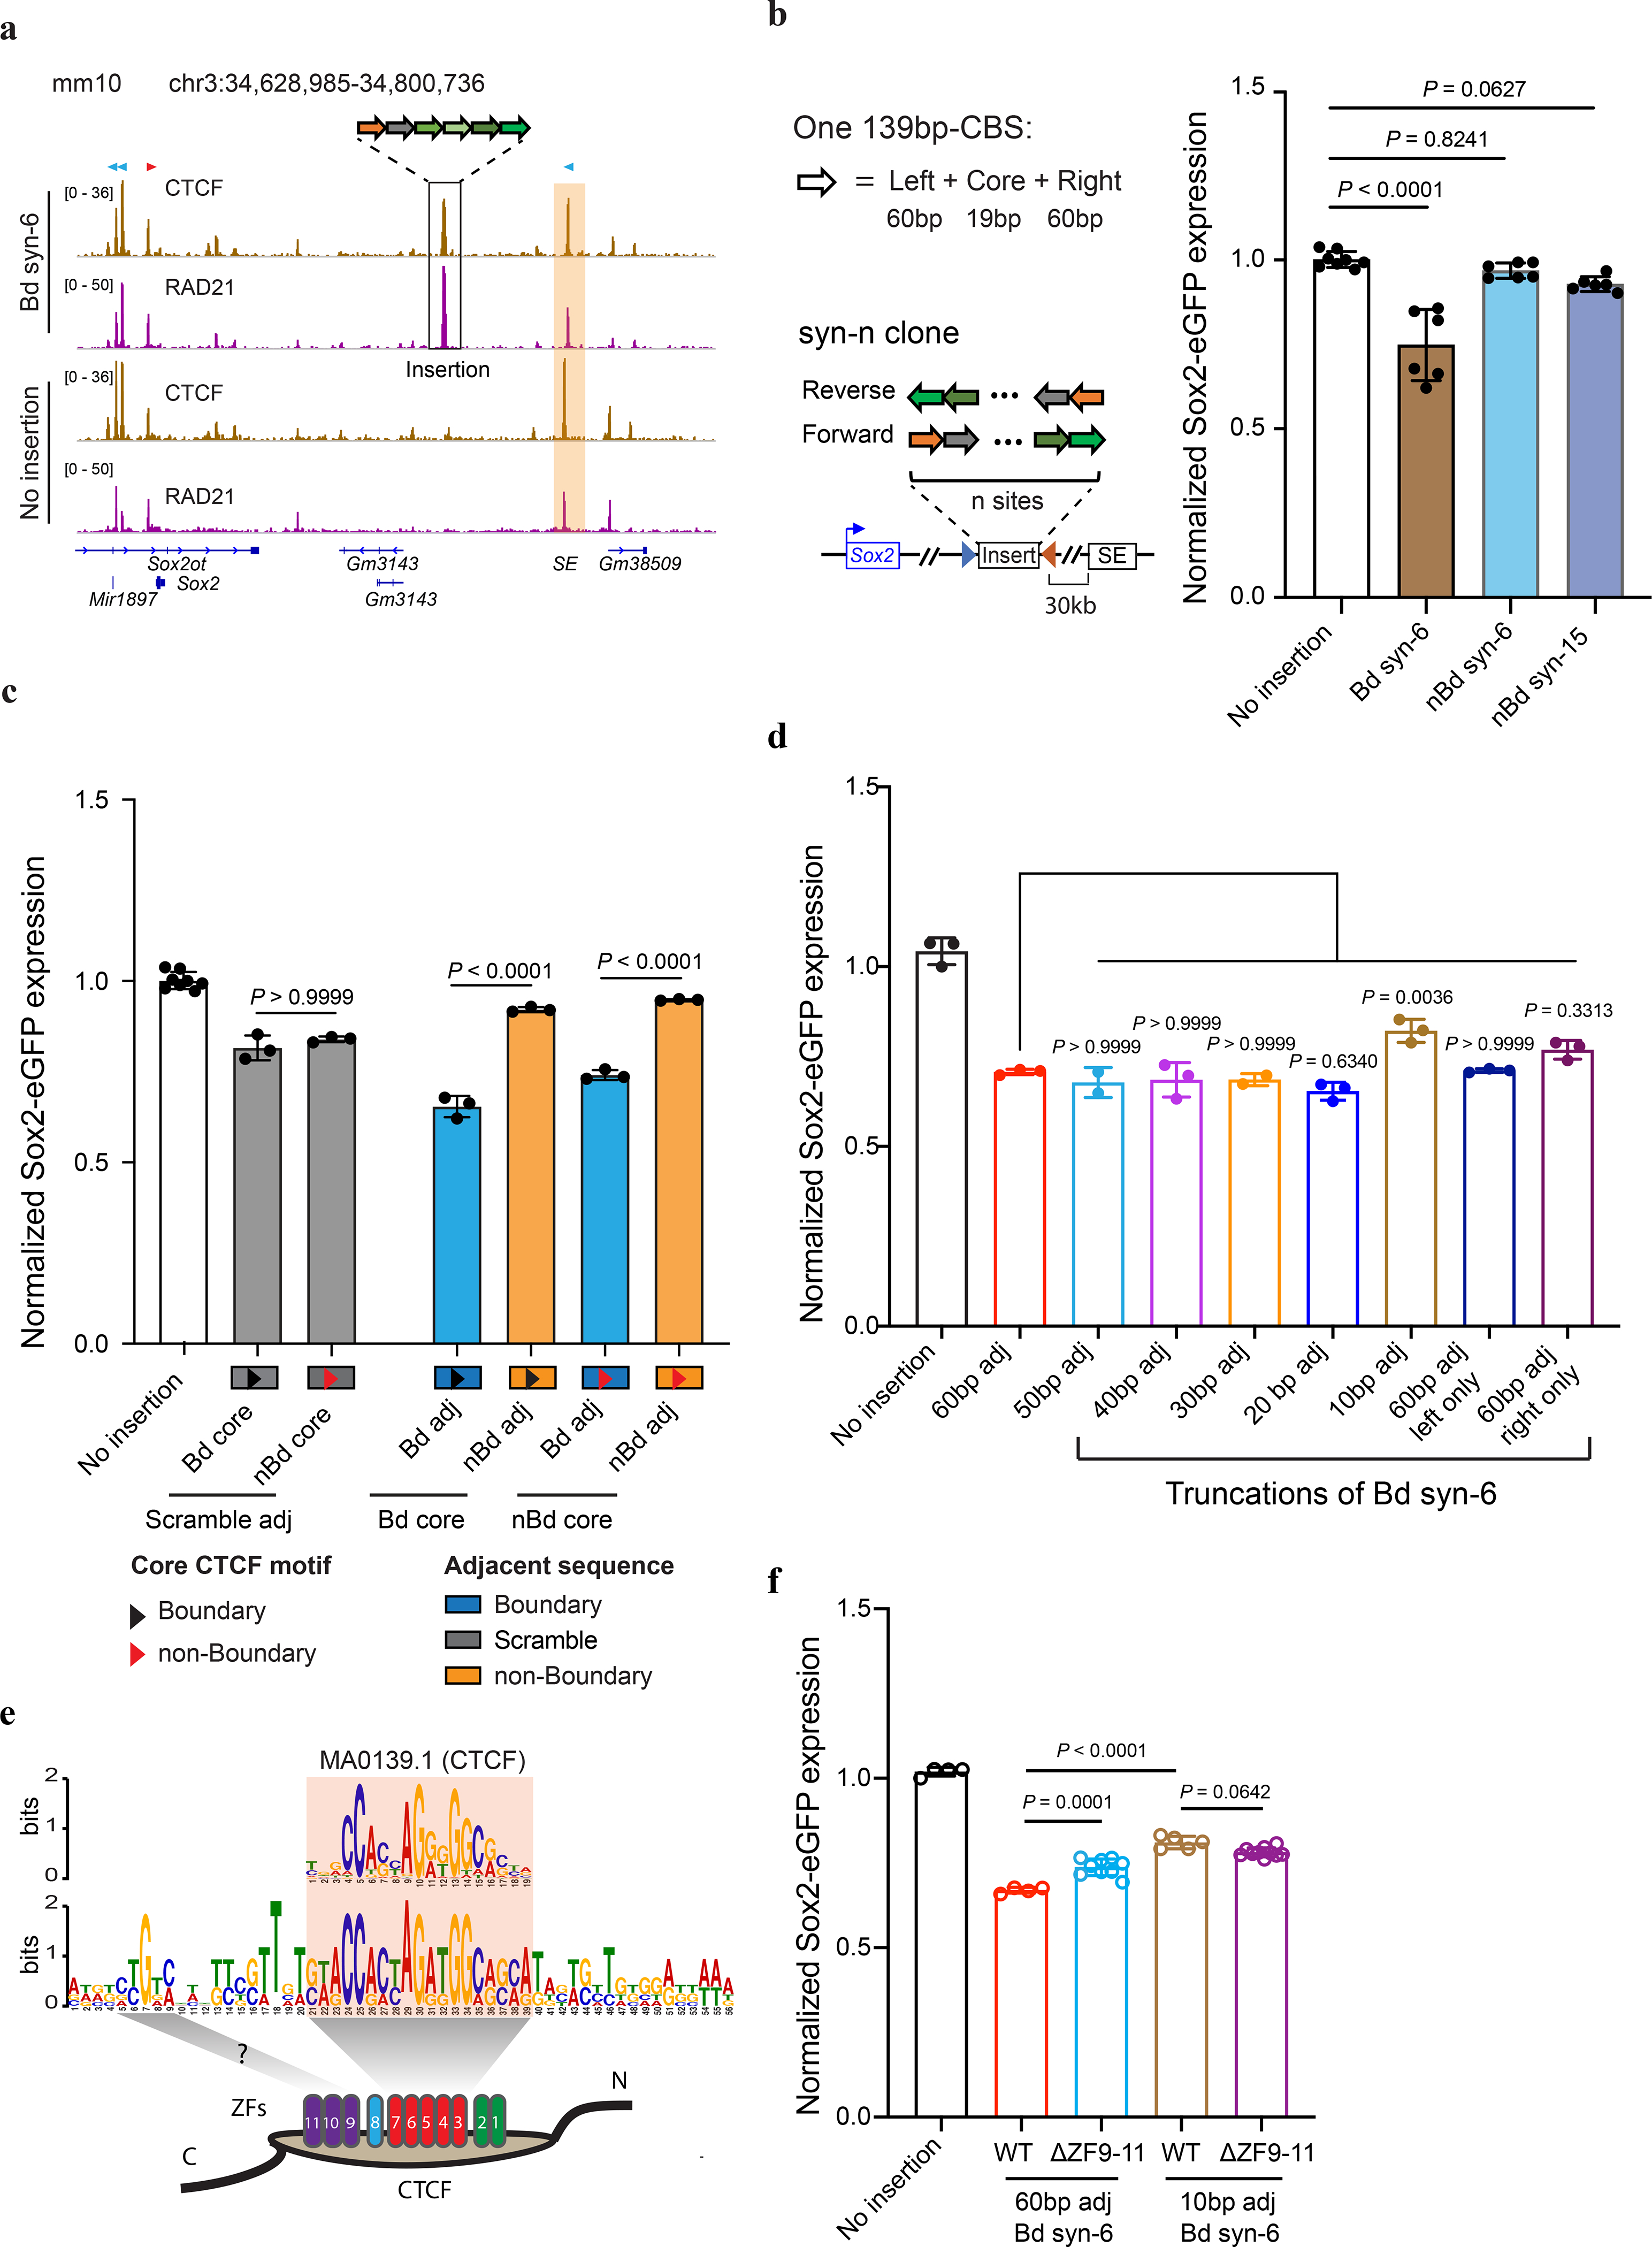
a, ChIP-seq of CTCF and Rad21. The “Bd syn-6” mES clone contains the insertion of six 139-bp boundary CBSs (Sox9_CBS1–4, Pax3_CBS3 and HS5_CBS, Supplementary Tables 3–4.) between Sox2 and its super-enhancer. Sequencing reads from the insertion clone were aligned to a customized mm10 genome that included the inserted sequence at the target location. Motif orientations of nearby CBS and inserted CBS were indicated on the top of signal tracks. The Sox2 super-enhancer is highlighted in the orange box. b, A bar plot shows insulation effects of synthetic sequences containing tandemly arrayed 139-bp CBSs from boundary and non-boundary regions. For each synthetic sequence, six insertion clones were picked with three of them in forward orientation and the other three in reverse orientation. c, A bar plot shows insulation effects of recombined tandemly arrayed 139-bp CBSs. CBS core motifs of boundary and non-boundary sites were combined with either their native adjacent sequences, scrambled adjacent sequences, or exchanged adjacent sequences with each other (n = 3). Each test sequence contains six tandemly arrayed 139-bp CBSs. The order of the six CBS core motifs was kept the same. d, A bar plot shows the insulation effect of the “Bd syn-6” sequence with truncated adjacent sequences. All insertions were between the Sox2 promoter and super-enhancer (n = 3; for 50 bp adj, n = 2.). e, A composite motif discovered in the six boundary CBSs tested. Each CBS consists of a 19-bp core motif and 20-bp adjacent sequences on both sides. The motif was searched by the GLAM2 program of the MEME suite. f, A bar plot shows the impact of CTCF zinc fingers 9–11 deletion on insulation effects of boundary CBSs containing sixty-base-pair adjacent sequences and ten-base-pair adjacent sequences (No insertion, n = 4; for WT with 60 bp adj, n = 4; for ΔZF9–11 with 60 bp adj, n = 9; for WT with 10 bp adj, n = 5; for ΔZF9–11 with 10 bp adj, n = 10.). P values were determined by one-way analysis of variance with Bonferroni’s multiple comparisons test. Data are mean ± sd.
Using the same approach, we also tested whether CBSs from outside of TAD boundaries could function as insulators. We selected multiple CBSs from non-TAD boundary regions in the genome, concatenated multiple 139-bp genomic sequences containing CTCF binding motifs together, and tested their insulation ability in our insulator reporter assay (Supplementary Table 4). Surprisingly, although these non-TAD boundary CBSs displayed stronger CTCF binding than those from TAD boundaries at their original loci (Extended Data Fig. 3c), the synthetic DNA sequences made up of six or fifteen tandemly arrayed 139-bp CBSs from non-boundary regions were unable to function as insulators, despite the presence of strong CTCF ChIP-seq signals at the insertion site (Fig 3b, Extended Data Fig. 3d), indicating that CTCF binding alone is insufficient to bring transcriptional insulation.
To further dissect the sequence dependence of CTCF-mediated insulation, we exchanged the core motifs of 139-bp boundary CBSs with those of the synthetic CBSs from non-boundary regions (Supplementary Table 4). Combining boundary CBS core motifs with non-boundary adjacent sequences resulted in a much weaker insulation effect than with their original neighboring sequences of equal lengths (Fig. 3c). In contrast, replacing adjacent sequences of non-boundary CBSs with those from boundary sites significantly strengthened their insulation effect (Fig. 3c). However, when the adjacent sequences were scrambled or kept the same for boundary and non-boundary core motifs, their effects in insulating Sox2 expression were comparable (Fig. 3c). Together, these results suggest that transcriptional insulation by CTCF is sequence-context-dependent, requiring DNA elements flanking the CTCF binding motif. It should be noted that ChIP-seq analysis showed that differential insulation activity of the synthetic insulators is not strictly correlated with CTCF occupancy (Extended Data Fig. 4a–d).
To further delineate the key element in CTCF flanking sequences that promote transcriptional insulation, we tested the insulator activity of a series of synthetic CBSs with gradually decreasing flanking sequences from each side. Interestingly, strong insulation was retained at a synthetic insulator with just 20-bp flanking sequences on both sides of the core CTCF binding motifs, however, significantly reduced when the flanking sequences were shortened to 10 bp (Fig. 3d), suggesting a critical role for the 10–20-bp flanking sequences of the core CTCF binding motif in insulation. We used the GLAM2 tool52, a multiple sequence aligner that allows gaps and deletions among motifs, to identify a composite element in the six boundary CBSs (Extended Data Fig. 4e). We found a central motif that matches the CTCF core motif and an upstream motif at the same location as a previously reported element recognized by CTCF zinc fingers 9–1153–55 (Fig. 3e). To test whether CTCF zinc fingers 9–11 indeed contribute to transcriptional insulation, we deleted the DNA segment coding for zinc fingers 9–11 from both copies of the endogenous CTCF gene using CRISPR editing tools as previously described37(Extended Data Fig. 5a–c). Deletion of CTCF zinc fingers 9–11 significantly weakened insulation of the boundary CBSs but did not further reduce the insulation strength of the synthetic insulator with just 10-bp flanking sequences (Fig. 3f, Extended Data Fig. 5d–e). Together, these results suggest that flanking sequences of the boundary CBSs promote CTCF-mediated transcriptional insulation likely through contacts with CTCF zinc fingers 9–11. Further, ChIP-seq analysis showed that CTCF binding to CBSs with just ten-base-pair flanking sequences did not decrease significantly (Extended Data Fig. 4a–b).
Insulators form TADs and weaken enhancer-promoter contacts
Previous studies suggest that the Sox2 super-enhancer forms long-range chromatin contacts with the Sox2 promoter50, 56. We hypothesized that insulators may change chromosome topology to limit enhancer-promoter communication. To test this hypothesis, we performed PLAC-seq57 (also known as HiChIP58) experiments using mESC clones with various insulators inserted at the Sox2 locus to detect promoter-centered chromatin contacts. Contact frequencies between the Sox2 promoter and downstream super-enhancer were similar between the CAST and 129 alleles in mESCs with no insertion (Fig. 4a). Inserting two CBSs from the Sox9-Kcnj2 TAD boundary between the Sox2 promoter and super-enhancer reduced the enhancer-promoter contacts significantly (Fig.4a). Consistent with the observed dosage-dependent insulation effects, the Sox2 enhancer-promoter contacts on the CAST allele were further reduced in cells with the insertion of four CBSs (Fig. 4a). By contrast, placing two or four CBSs downstream of the Sox2 super-enhancer did not reduce the Sox2 enhancer-promoter contacts (Fig. 4a). These results support the model that insulators act by reducing the enhancer-promoter contacts.
Fig. 4 |. Enhancer-blocking insulator forms local chromatin domains and reduces Sox2 enhancer-promoter chromatin contacts.
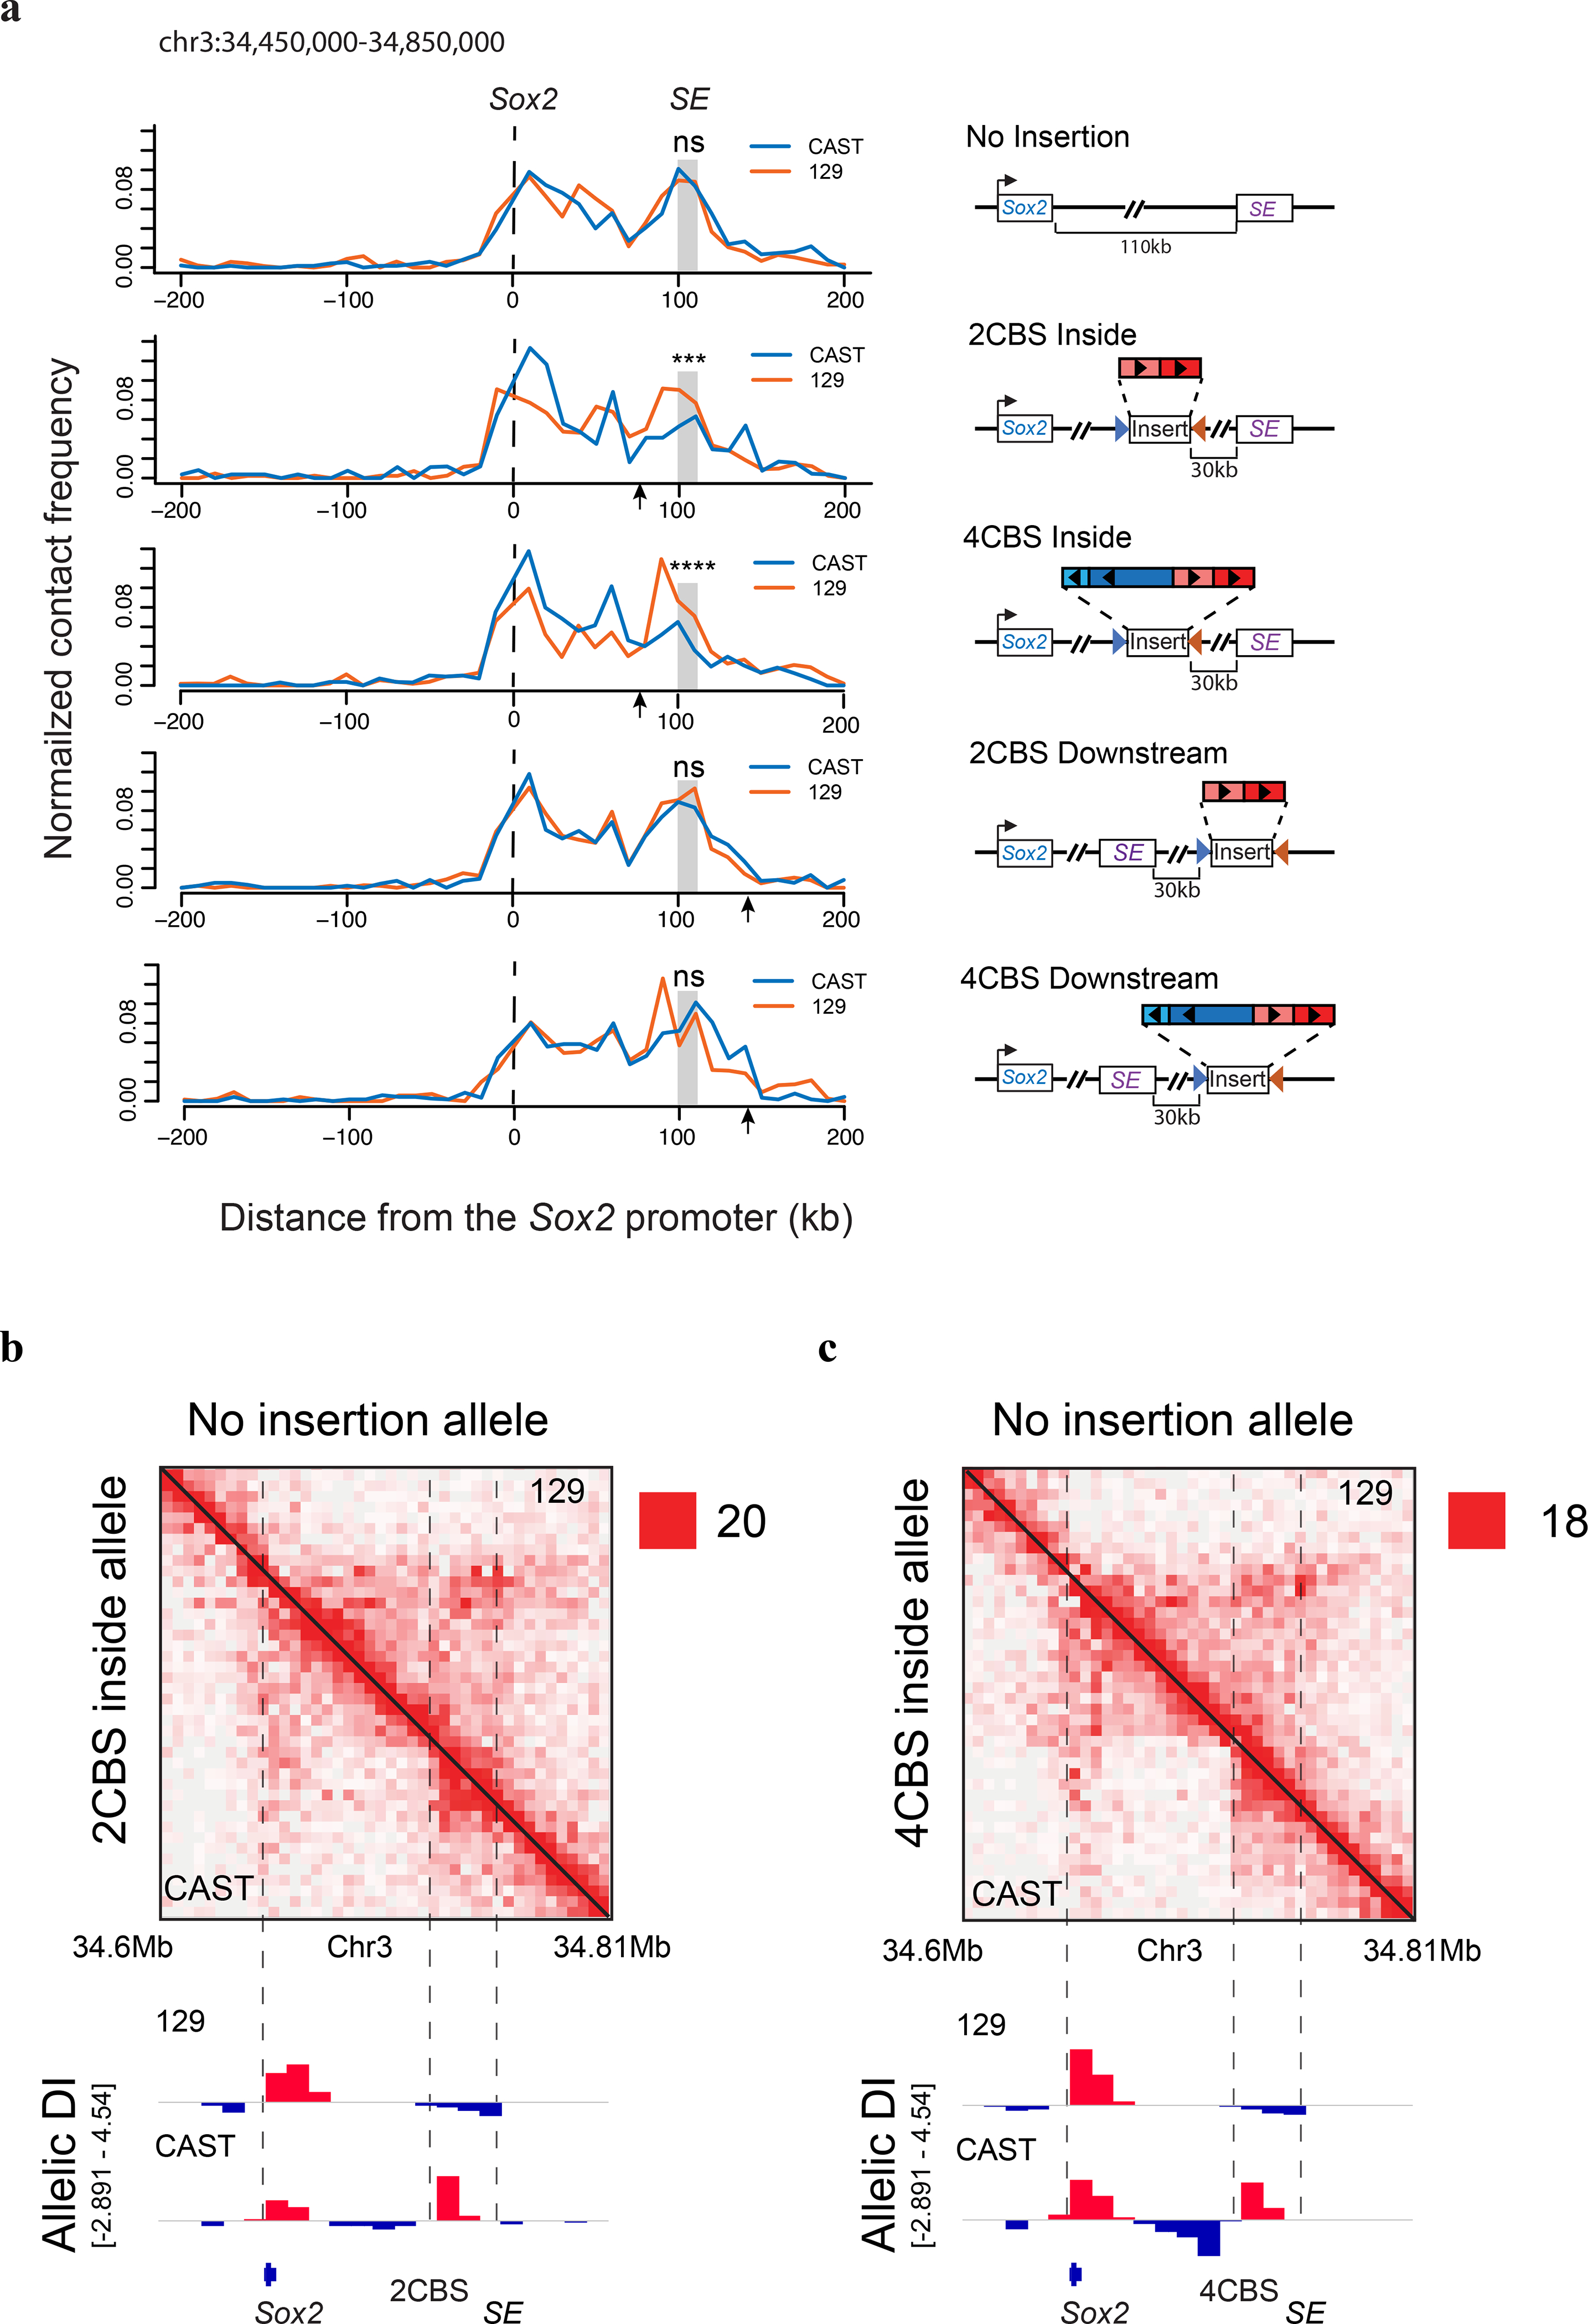
a, Allelic chromatin contacts from PLAC-seq data are shown at the viewpoint of the Sox2 promoter (n = 2, replicates were merged). PLAC-seq experiments were carried out using a monoclonal antibody (Millipore, 04–745) against H3K4me3. Sequencing reads were mapped to the mm10 reference genome and split to CAST and 129 allele based on the haplotypes of parental strains. DNA fragments connecting the promoter and each of the surrounding 10-kb bins were counted. Contact frequency was normalized by the total cis contacts of the Sox2 promoter for each allele, interactions within the 10-kb Sox2 promoter bin were not shown. Arrows indicate the insertion location of CBSs. Fisher exact tests of Sox2 enhancer-promoter contacts of the two alleles were performed (Two sided tests, ns P > 0.05, ***P = 4.91 × 10⁻⁴, ****P = 5.34 × 10⁻⁵). Right, insertion construct matching each clone on the left. The CBS clusters were obtained from the Sox9-Kcnj2 TAD boundary by PCR. b-c, Allelic Hi-C contact map at Sox2 locus. Mouse ESCs with the insertion of two CBSs or four CBSs from the Sox9-Kcnj2 TAD boundary in the CAST allele were used for the experiments. Hi-C reads were mapped to the mm10 reference genome and split to CAST and 129 allele based on the haplotypes of parental strains. Allele-specific contact matrix was normalized by K-R matrix balancing. Top right, no insertion allele (129); Bottom left, insertion allele from the same cells (CAST). Bottom, allelic directionality index (DI) score of Hi-C interaction frequency (n = 2, replicates were merged).
To further understand the effect of the insulators on local chromatin structure, we performed in situ Hi-C experiments59 with mESC clones containing either two or four CBSs inserted between the Sox2 gene and its super-enhancer on the CAST allele (Fig. 4b–c). On the 129 allele, Sox2 promoter and downstream super-enhancer were found to be in a single TAD (Fig. 4b). By contrast, insertion of two CBSs between the Sox2 gene and super-enhancer on the CAST allele created a new TAD boundary that separated the Sox2 locus into two local chromatin domains (Fig. 4b). Introducing four CBSs in the same location created an even stronger TAD boundary, and contacts across the new local domains were further reduced (Fig. 4c). Additionally, we found that the inserted CBSs showed elevated levels of chromatin contacts with the CBSs located on Sox2 promoter and super-enhancer, following the convergent rule59 (Extended Data Fig. 6a–d). Collectively, these results suggest that CTCF-dependent insulators create local TAD domains by forming chromatin loops between convergent CTCF binding sites.
Visualizing Sox2 locus by multiplexed FISH for DNA and RNA
To directly visualize the impacts of insulators on chromatin architecture, we used the recently developed multiplexed DNA FISH imaging method to trace the chromatin conformation60–62. We traced the three-dimensional structure of the 210-kb genomic region (chr3: 34601078–34811078) containing the Sox2 and super-enhancer loci across thousands of individual chromosomes at 5-kb intervals. We partitioned the 210-kb region into forty-two 5-kb segments and sequentially labeled and imaged each segment using 14 rounds of hybridization of readout probes with a three-color imaging scheme (Fig. 5a, Extended Data Fig. 7a–c, Supplementary Tables 5–6). The identity of the CAST allele was determined within each nucleus based on the presence of FISH signal corresponding to the 7.5-kb 4CBS insulator sequence inserted into the CAST allele that was absent in the 129 allele (Fig.5a, Extended Data Fig. 7d).
Fig.5 |. Effects of an enhancer-blocking insulator on chromatin topology and transcription revealed by multiplexed FISH.
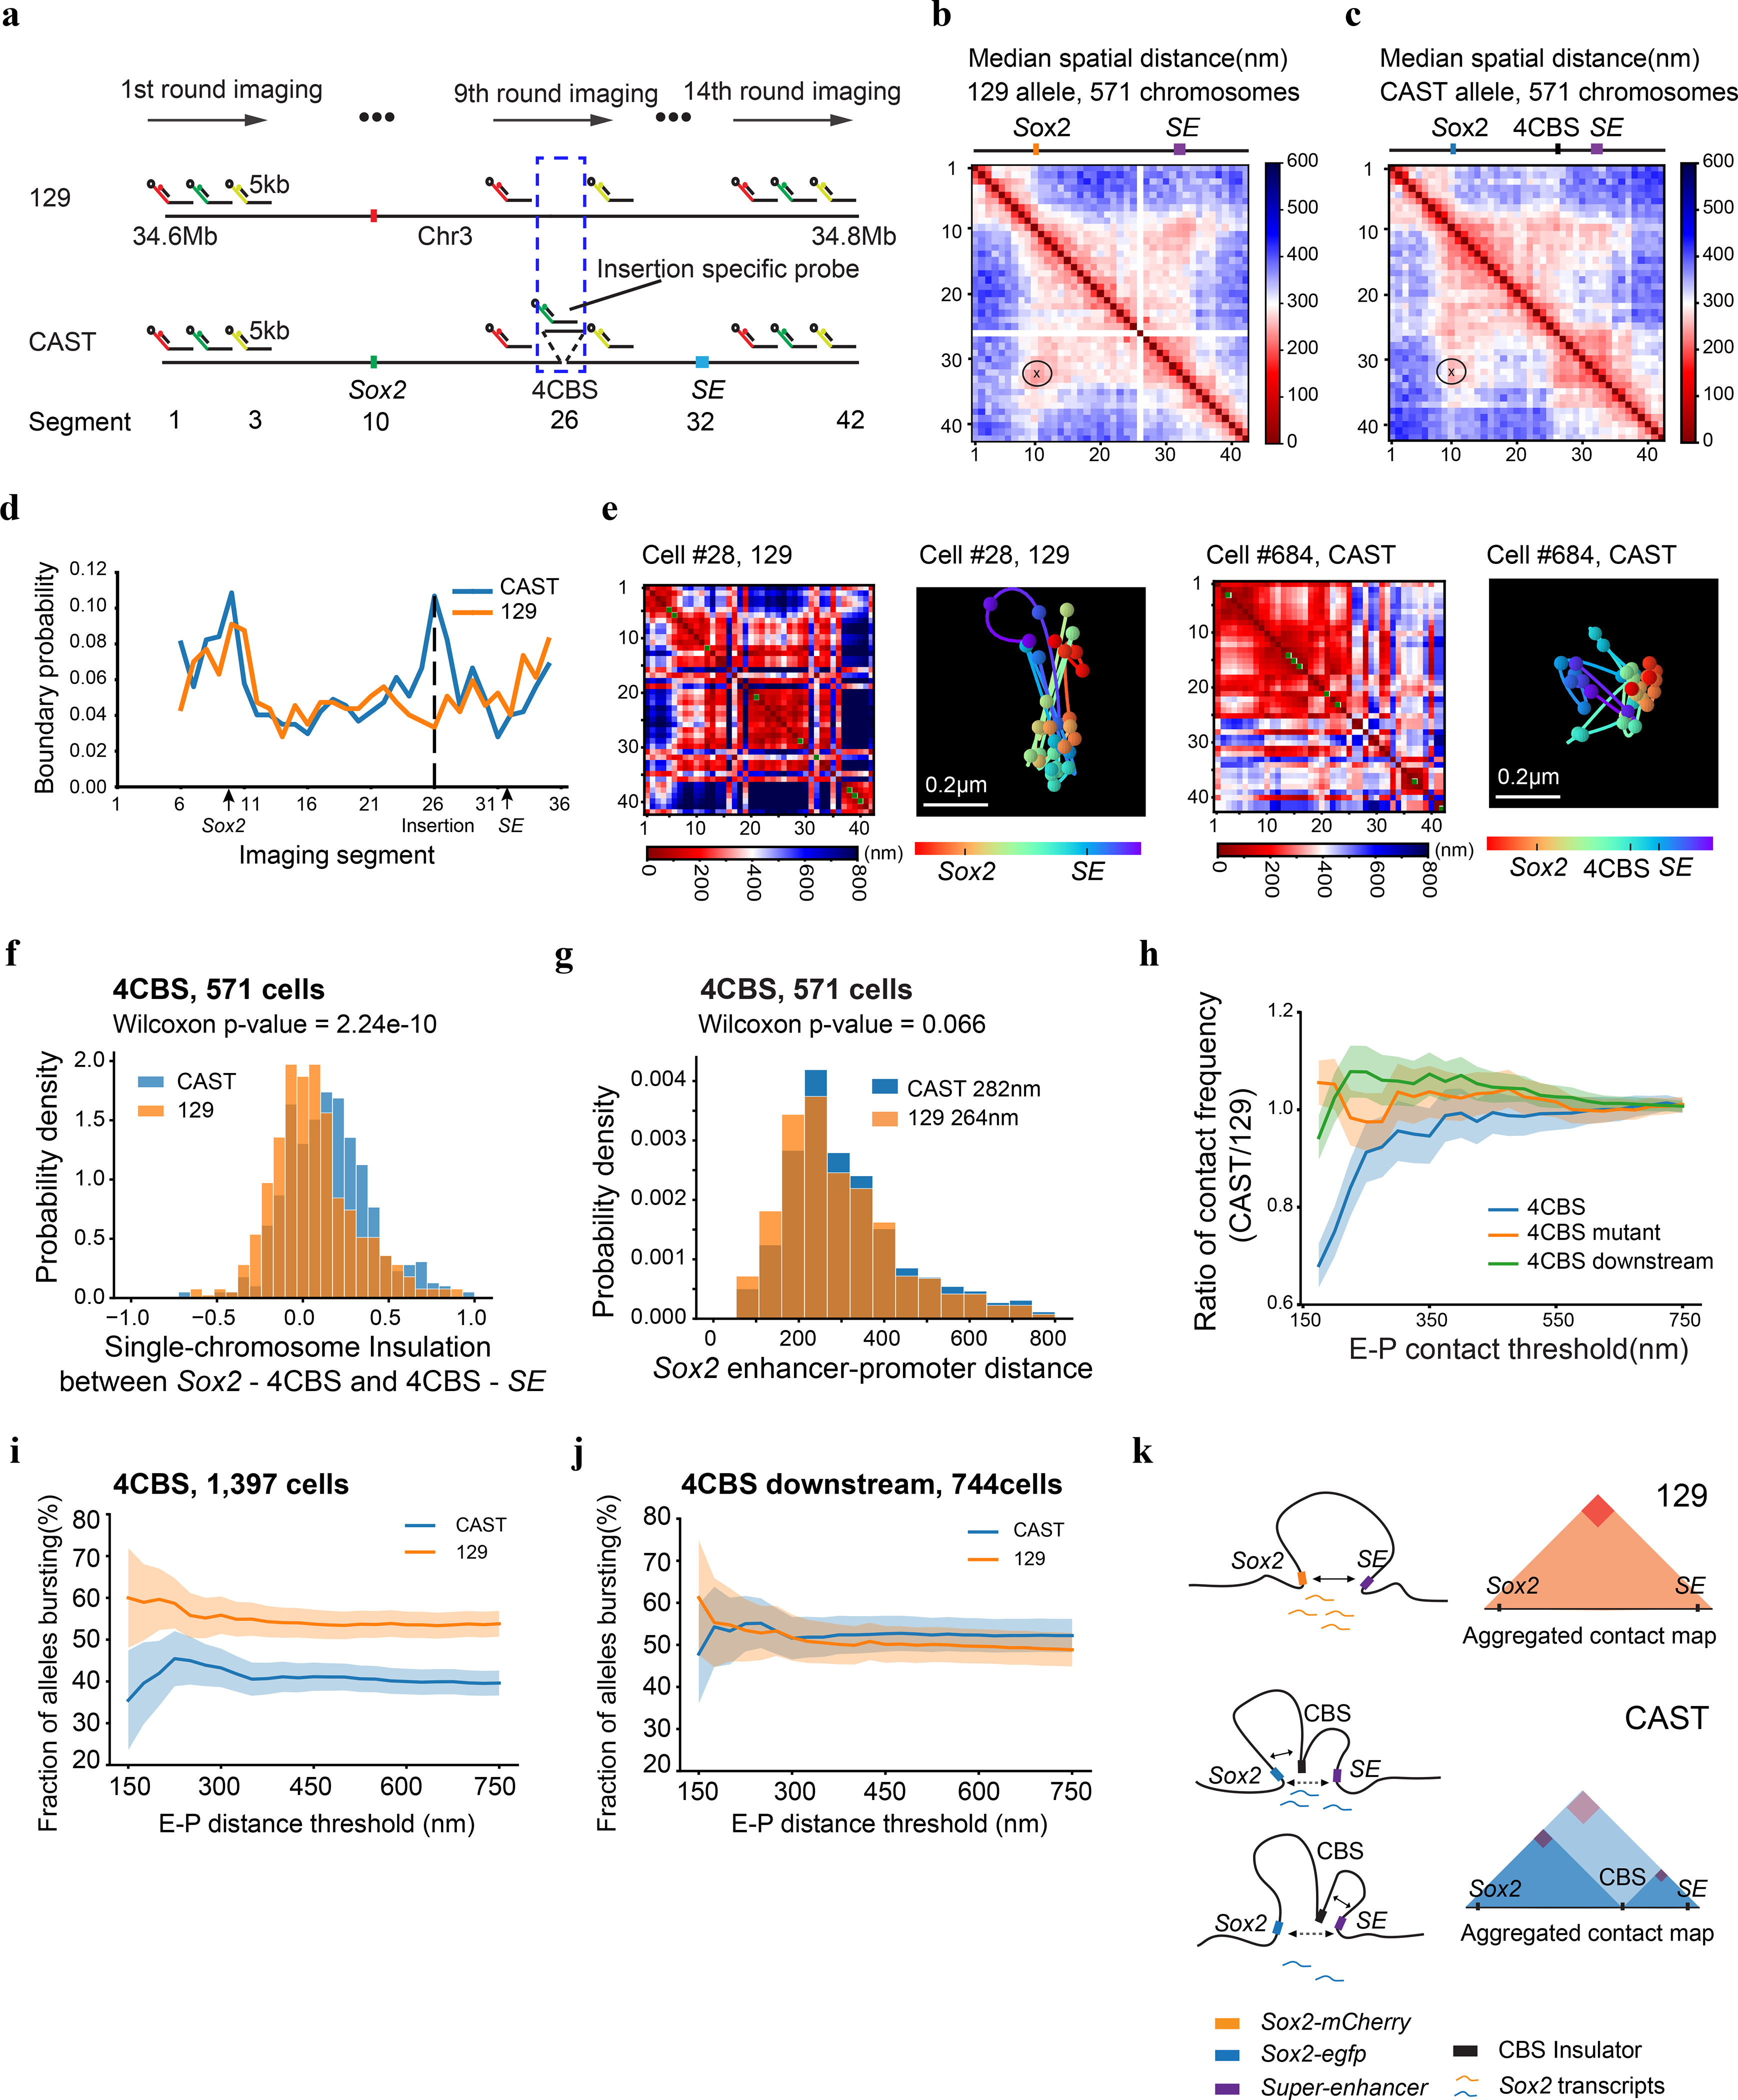
a, Scheme of the chromatin tracing experiments targeting the 210-kb Sox2 region (chr3: 34601078–34811078). b-c, Median spatial-distance matrix for 129 (b) and CAST (c) chromosomes. d, The probability of each segment to be a single-chromosome domain boundary for the two alleles in b-c. The 26th segment on the CAST allele is the 4CBS insertion. e, Exemplary single-chromosome structures of the imaged Sox2 locus of CAST and 129 alleles. Green pixels on the interpolated matrices indicate missing values in the displayed examples of chromatin traces. f, The distribution of single-chromosome insulation scores for each of the alleles between Sox2 promoter – 4CBS insertion (segments 10–25) and 4CBS insertion – Sox2 enhancer (segments 26–33). Two-sided Wilcoxon rank-sum test was performed. g, The distribution of Sox2 enhancer-promoter distance for the CAST and 129 chromosomes in b-c. Two-sided Wilcoxon rank-sum test was performed. h, The ratio of Sox2 enhancer-promoter contact frequency of CAST chromosomes to that of 129 chromosomes. The distribution of contact frequency ratio (CAST/129) of the “4CBS” (n = 571 cells) clone is significantly different from that of the “4CBS mutant” (n = 659 cells) and “4CBS downstream” (n = 784 cells) clone, with P values of two-sided Kolmogorov–Smirnov tests equal to 6.38 × 10⁻⁵ and 1.09 × 10⁻⁹, respectively. Shadow indicates the 95% confidence interval based upon binomial distribution. i-j, The bursting frequency of the Sox2 gene on CAST and 129 chromosomes. (i) the 4CBS clone (n = 1,397 cells), (j) the control clone with 4CBS inserted downstream of the Sox2 super-enhancer (n = 744 cells). Shadow indicates the 95% confidence interval based upon binomial distribution. k, A model of the Sox2 locus on the two alleles. On the 129 allele, the super-enhancer interacts with the Sox2 promoter and activates transcription of the Sox2 gene. On the CAST allele, the CBS insulators can interact with both the Sox2 promoter and the super-enhancer, resulting in fewer productive enhancer-promoter contacts.
We first carried out chromatin tracing experiments with the mESC clone containing an insertion of the 4CBS insulator between the Sox2 gene and the downstream super-enhancer on the CAST allele. We obtained chromatin tracing data from 571 cells where both CAST and 129 alleles were robustly discerned (Methods). Consistent with results from Hi-C (Fig. 4c), the median spatial distance matrix for the 129 allele showed a single TAD harboring both the Sox2 and super-enhancer loci, whereas the spatial distance matrix for the CAST allele showed two TADs with a new boundary formed at the insertion site separating the Sox2 and super-enhancer loci (Fig. 5b–c; Extended Data Fig. 8a–c). Accordingly, individual CAST chromosomes were more likely to form a boundary at the 4CBS insertion (Fig. 5d–e). Moreover, the level of insulation between the two sub-regions to either side of the inserted 4CBS, containing the Sox2 promoter and the super-enhancer was statistically significantly enhanced on the CAST alleles (Fig. 5f).
As controls, we also performed chromatin tracing experiments with one mESC line where all CTCF binding motifs of the insertion were removed, and another cell line where the insertion was at an equal distance further downstream of the Sox2 super-enhancer. We obtained chromatin tracing data on both CAST and 129 alleles from 659 and 784 cells of the two cell lines, respectively. Based on FACS analyses, neither control insert reduced Sox2 expression on the CAST allele (Extended Data Fig. 8d). Consistently, no local chromatin domain boundary was visible between the Sox2 and super-enhancer loci, and spatial insulation between the Sox2 gene and the super-enhancer was indistinguishable between the CAST and 129 alleles (Extended Data Fig. 8e–j). Interestingly, the distances between regions across the insulator were increased on the CAST allele compared to the 129 allele, whereas mutant CBS inserted at the same location did not increase the distance between regions across the insertion (Extended Data Fig. 9a–b). In contrast, the 4CBS insulator inserted downstream of the Sox2 super-enhancer appeared to promote segregation of the Sox2 domain from downstream chromatin, which may explain the slightly increased Sox2 expression in this clone (Extended Data Fig. 9c).
Surprisingly, although the 4CBS insulator substantially reduced Sox2 expression and the contact frequency between Sox2 and its super-enhancer, the median spatial distance between Sox2 super-enhancer and promoter only mildly increased on the CAST alleles (282 nm) compared to the 129 alleles (264 nm) (Wilcoxon rank sum test, P = 0.066) (Fig. 5g). We hypothesized that only on a small fraction of chromosomes the Sox2 super-enhancer was in physical proximity with the Sox2 promoter to engage in productive transcription, and insertion of an insulator on the CAST allele could reduce this fraction of engaged Sox2 enhancer-promoter configuration selectively on the CAST allele. To test this hypothesis, we quantified the fraction of CAST alleles that showed a spatial distance between the Sox2 promoter and the super-enhancer shorter than a particular threshold and compared it to that of the 129 alleles in the same cells. Indeed, in the mESCs where the 4CBS insulator was inserted between the Sox2 gene and super-enhancer on the CAST allele, the ratio between the fraction of CAST alleles with spatially proximal enhancer-promoter pairs and the fraction of 129 alleles with spatially proximal enhancer-promoter pairs was much smaller than 1, at a spatial distance threshold of 150 nm, and the ratio increased gradually to 1 at a spatial distance threshold of ~300 nm (Fig. 5h). By contrast, no reduction of this ratio was observed at a shorter spatial threshold in mESC clones where CTCF motifs were deleted from the insulator, or when the insulator sequence was inserted downstream of the Sox2 super-enhancer(Fig. 5h).
To further study how insulators affect enhancer-promoter spatial proximity and enhancer-dependent transcriptional activation at single-cell resolution, we simultaneously probed the chromatin structure with multiplexed DNA FISH and the transcripts at the Sox2 locus with single-molecule RNA FISH61, 63. We first hybridized three sets of RNA-FISH probes targeting Sox2, egfp, and mcherry each with a unique readout sequence to distinguish the transcripts made from the two Sox2 chromosome copies in each cell (Supplementary Table 7). We then performed multiplexed DNA FISH with the same cells to trace the local chromatin configuration. The Sox2 chromatin loci that spatially overlapped with nascent Sox2 transcripts were designated as transcriptionally bursting loci, and the remaining Sox2 loci without a coincident transcript were regarded to be in resting state (Extended Data Fig. 10a). Consistent with the RNA-seq analysis described above (Extended Data Fig. 2d–e), the frequency of detecting the nascent Sox2 transcripts on the CAST allele was substantially lower than that of the 129 allele in the 4CBS clone (Extended Data Fig. 10b). By contrast, the frequency of detecting nascent Sox2 transcripts on the CAST allele was slightly higher than the 129 allele in the control cells in which the CBS insulator was inserted downstream of the Sox2 enhancer (Extended Data Fig. 10b). Consistent with previous studies61, 64, we found that nascent Sox2 transcripts were detected across a wide range of spatial distances between the Sox2 enhancer and promoter, although the median enhancer-promoter distances at the Sox2 gene with coincident nascent transcripts were slightly but significantly shorter than those on the resting loci (Extended Data Fig. 10c–d). However, the fraction of the Sox2 gene with coincident nascent transcripts on the CAST allele in the 4CBS clone was consistently lower than that on 129 allele even though the spatial distances between the enhancer and promoter are similar (Fig. 5i). By contrast, the fraction of the Sox2 genes with coincident nascent transcripts was comparable between the two alleles when the 4CBS was inserted downstream of the Sox2 enhancer (Fig. 5j). These results, taken together, suggest that enhancer proximity is positively correlated to transcriptional activity at target gene in general; however, itself alone is not sensitive enough to differentiate transcriptional states. In summary, our results suggest that CTCF-insulators decrease the frequency of transcription bursting at Sox2 when inserted between the enhancer and promoter, likely by establishing local chromatin domain boundaries that weaken productive communications between spatially close enhancer and promoter (Fig. 5k).
Discussion
The sequence-specific DNA binding protein CTCF plays a role in both chromatin organization and transcriptional insulation, but exactly how chromatin topology is related to transcriptional insulation remains to be understood. In this study, we developed an experimental system using mESCs to quantify the enhancer-blocking activity of insulators in the native chromatin context at the Sox2 locus. The well-defined distal enhancer of Sox2 gene activation afforded an excellent opportunity to quantify the effects of insulator insertions on local chromatin structure and transcription in cis. We determined the insulator activity of a number of CTCF binding sites either alone or in various combinations, and demonstrated that potent insulation was rendered by two or more clustered CTCF binding sites. Importantly, we found that CTCF binding alone was insufficient to confer insulation activity; rather, sequences immediately adjacent to CTCF binding motifs were required for potent insulator function. Consistent with this observation, CTCF binding sites within TAD boundaries are more likely to function as insulators than those not located at TAD boundaries, regardless of the strength of their binding by CTCF. Finally, using two complementary approaches to profile chromatin architecture, we showed that CTCF likely mediates transcriptional insulation by creating local chromatin domain boundaries and reducing the frequency of productive enhancer-promoter contacts. Our results, therefore, provide mechanistic insights into the link between TAD boundaries that are enriched for CTCF binding sites and CTCF-mediated transcriptional insulation.
We demonstrated that several factors may be involved in CTCF-mediated transcriptional insulation in mammalian cells. First, a single CBS has weak insulation effects, varies depending on the orientation of the CTCF motif. The orientation bias is likely due to a pair of convergent CBSs located on the Sox2 promoter and enhancer. The CBS insertion is predicted to loop with the enhancer CBS in a forward orientation59. A loop formed with the enhancer may block enhancer activity more efficiently than one formed with the promoter. Given that the inserted insulator is closer to the Sox2 enhancer, where CTCF binding is stronger, it is also possible that looping with CBS on the Sox2 super-enhancer is more efficient, thereby, favoring insulation by forward-orientated CBSs.
Second, we found that multiple CBSs taken from TAD boundaries exert potent transcriptional insulation activities. Our finding is consistent with a recent study of the mouse Pcdh clusters reporting that insertion of tandem CTCF sites could block enhancers from activating proximal genes65. These observations with CTCF insulators are different from the Drosophila gypsy insulator, which was ineffective in blocking enhancer activity when two tandem copies were tested66, 67.
Third and more importantly, through sequence swapping experiments, we showed that sequences immediately adjacent to CTCF binding motifs were necessary for enhancer-blocking function. We further found an upstream element in the flanking sequences of CTCF binding motifs to be crucial for transcriptional insulation. Previous studies reported an upstream motif that stabilizes CTCF binding via interactions with the 9–11 zinc fingers of CTCF53–55, 68. We speculate that CTCF zinc fingers 9–11 may promote transcriptional insulation by inducing a tertiary structure on insulators that stabilizes CTCF-cohesin interactions, thereby blocking the loop extrusion process that facilitates long-range enhancer-promoter contacts. It is noteworthy that deleting zinc fingers 9–11 did not fully abolish insulation of the boundary CBSs, suggesting the involvement of additional factors in transcriptional insulation.
Our study also relates the chromatin structure involving enhancer-promoter contacts, as revealed by various 3C-based and microscopy-based experiments, to enhancer-dependent transcription. From both the 3C and imaging experiments, we found that the insertion of multiple CBS sites in tandem, with the appropriate flanking sequences, induced the formation of a TAD boundary at the insertion site and reduced interactions between the enhancer and the promoter. Spatial proximity between an enhancer and a promoter has been thought to be positively correlated with enhancer-dependent activation in general. However, recent studies have also shown that spatial proximity is not strictly correlated with transcriptional activation69, and is a poor predictor of transcriptional activity in live cells64. We showed that transcriptional activities of Sox2 promoter, measured by the frequency of nascent transcripts detected at the gene locus in a population, could be reduced by insulators with only modest changes to the enhancer-promoter proximity. These studies, together, highlight that enhancer-promoter proximity is just one of the many elements regulating transcriptional activity in mammalian cells. The point-to-point spatial distances between the enhancer and promoter does not fully reflect the chromatin structure of the entire locus. Simultaneous imaging of chromatin and transcripts indicated that Sox2 transcription could take place in chromosomes showing a broad range of spatial distances between the enhancer and Sox2 promoter61. One possibility is that the Sox2 super-enhancer forms a phase-separated environment70, where the Sox2 gene needs not be very close to its enhancer to be activated. Another possibility is that the temporal duration of Sox2 enhancer-promoter interaction is relatively short compared to a transcriptional bursting cycle, which would make it difficult to capture the two events simultaneously in fixed cells using FISH. Finally, transcription is not likely to happen immediately after enhancer-promoter contacts71. The lagging between these two events could also explain the lack of strict correlation between enhancer-promoter proximity and transcriptional bursting in live cells64.
In summary, our results suggest that CTCF sites in the genome are not all equivalent to each other, and CTCF-mediated insulation depends on both dosage and upstream flanking sequences. Our findings explain why CBSs at TAD boundaries are more likely to act as transcriptional insulators than those outside TAD boundaries. One potential limitation of the current study is that the insulation effects of CBSs were tested only in the Sox2 locus. Future experiments will be needed to demonstrate whether observations made from the Sox2 locus can be generalized to other gene loci in the mammalian genome.
Methods
Cell culture
The hybrid F123 mESC line (F1 Mus musculus castaneus × S129/SvJae, maternal 129/Sv, paternal CAST) was from Dr. Rudolf Jaenisch’s laboratory at the Whitehead Institute at MIT. The wild type F123 mESC line and engineered clones were maintained in feeder-free, serum-free 2i conditions (1 μM PD03259010, 3 μM CHIR99021, 2 mM glutamine, 0.15 μM Monothioglycerol, 1,000 U/ml LIF). The growth medium was changed every day. Cells were dissociated by Accutase (AT104) and passaged onto 0.2% gelatin-coated plates every 2–3 days.
Genetic engineering of the Sox2 locus
Tagging of the Sox2 gene with fluorescence reporter was performed by CRISPR-Cas9-mediated homologous recombination. Specifically, a guide RNA expression plasmid (pX330, addgene #42230) targeting the 3’ of the Sox2 gene, together with egfp and mcherry donor plasmids were co-electroporated into wild-type F123 cells by Neon transfection system (MPK1096). Cells were recovered for 2 days, then eGFP+ mCherry+ cells were sorted by FACS and seeded onto a new 0.2% gelatin-coated 60-mm dish. 5 days later, a second round of FACS was performed to enrich eGFP+ mCherry+ cells. 500–1,000 double-positive single cells were seeded onto a new 60-mm dish and single colonies were picked manually another 5 days later. Allele-specific genotyping of Sox2 was performed with primers spanning CAST/129 SNPs. A clone with the CAST allele Sox2 gene fused with egfp and 129 allele Sox2 gene fused with mcherry was selected as the parental clone. Subsequently, the HyTK fusion gene was integrated into the CAST allele of the parental clone by CRISPR-Cas9 editing. Specifically, electroporated cells were recovered for 2 days and then cultured in growth media containing 200 μg/ml hygromycin for 7 days. Survived cells were dissociated into single cells and seeded at the density of 500–1,000 cells per 60-mm dish. 5 days later, colonies were manually picked and genotyped with primers spanning CAST/129 SNPs. Genotyping primers were synthesized by IDT (Supplementary Table 8).
Donor plasmids cloning for RMCE
The donor vector was adapted from the pUC19 plasmid. Two heterotypic Flippase recognition sites FRT/F3, as well as NotI and SbfI restriction enzyme recognition sites, were added into pUC19 plasmid by PCR. The donor vector was then digested with the enzyme cocktail of NotI-HF (neb, R3642S), SbfI-HF(neb, R3189S), and rSAP(neb, M0371S) for 4 h at 37 °C. Individual CTCF binding sites were PCR amplified from mouse or human genomic DNA. PCR primers contain overhang sequences of NotI and SbfI sites to specify CTCF motif orientation. PCR products were purified by gel-electrophoresis, digested, and ligated into the donor vector. Ligation products were transformed into Stbl3 chemically competent cells. Positive clones were screened by PCR and plasmids were extracted using QIAGEN plasmid plus midi kit (cat 12943) and validated by Sanger sequencing.
Marker-free insertion in mESCs by RMCE
A Flippase expression plasmid(pFlpe) (addgene #13787) and a donor plasmid(pDonor) were co-electroporated into 0.1 million insulator reporter or control cells at the ratio of 1:4 (pFlpe: pDonor = 1 μg :4 μg). Cells were recovered for two days and cultured in growth media containing 2 μM ganciclovir for another 5 days. Surviving cells were dissociated into single-cell suspension and seeded at the density of 500–1,000 cells per 60-mm dish. Five days later, six colonies were picked for PCR genotyping. Genomic DNA was then extracted by QIAGEN DNeasy Blood & Tissue Kits (#69506, #69581). For each insert, three independent clones were randomly picked for FACS analysis and subsequent studies. Individual CTCF binding sites were combined by PCR to create CBS clusters. Specifically, the 4CBS cluster from the Sox9-Kcnj2 TAD boundary was consisted of genomic sequences from chr11:111,523,291–111,524,273, chr11:111,531,104–111,533,964, and chr11:111,535,307–111,538,959. PCR primers were synthesized by IDT (Supplementary Table 8).
Deleting 9–11 zinc fingers of CTCF in mESCs
Deletion of CTCF zinc fingers 9–11 was achieved by CRISPR-Cas9-mediated homologous recombination as previously described37. Briefly, coding sequences of exon 10–12 of the Ctcf gene, together with an SV40 polyA signal were inserted into exon9 of the Ctcf gene in situ, resulting in only the 1–8 zinc fingers of the CTCF protein being functional. About 0.15 million cells were transfected with a mixture of guide RNA expressing plasmid (Px330, 1 μg), homologous recombination repair plasmid (4 μg), and a co-electroporation marker (0.1 μg, puromycin resistant). After two days’ recovery, cells were treated with 1 μg/ml puromycin for another three days. Surviving cells were suspended into single cells and seed at the density of 500–1,500 cells per 10-cm Petri dish. Five days later, single colonies were manually picked and genotyped by PCR.
FACS data acquisition and analysis
Cells were treated by Accutase (#AT104) at 37°C for 5–7 min and resuspended into single cells with 2 ml warm 2i/LIF medium. Cells were then spun down at 1,000 rpm for 4 min and washed twice with 5 ml PBS. Cell pellets were resuspended into single cells with 1 ml PBS and filtered through the 35-μm strainer cap of a FACS tube (SKU: FSC-9005). Then, cells were sorted by Sony sorter SH800 (Cell Sorter Software 2.1.5) in analysis mode using a 130-μm chip. For each insertion clone, both GFP and mCherry signals were recorded for 10,000 cells. Cells were first gated by SSCA-FSCA for live cells, then by FSA-FSH for singlets using FlowJo 10.0.7r2. Fluorescence signals of cells passed gating were exported in csv files and analyzed in R 3.6.0. Specifically, the GFP signal is normalized by mCherry signal from the same cell. For each insertion clone, the normalized Sox2-eGFP expression was calculated as:
To better estimate instrument variability in FACS sorting, we used replicates of the no insertion clone in all experiments as controls when testing the significance of insulation effects of the inserted DNA elements.
ChIP-seq
Cells were dissociated into single cells and cross-linked by 1% formaldehyde in PBS for 15 min at room temperature. Cross-linking was then quenched by 0.125 M glycine and cells were washed twice with 5 ml cold PBS. Permeabilized nuclei were prepared with Covaris truChIP Chromatin Shearing Kit (PN520154) following the manufacturer’s instructions. 1–3 million nuclei were sonicated in 130 μl microtube by Covaris M220 instrument (Power, 75W; Duty factor, 10%; Cycle per bust, 200; Time, 10 min; Temperature, 7°C.). Sonicated chromatin was diluted with 1× Shearing Buffer into a total volume of 1 ml and spun down at 15,000 rpm at 4°C to remove cell debris. 5 μg antibodies were added to the supernatant and incubated overnight at 4°C with gentle rotation (CTCF, ab70303, lot GR3281212–6,7,8; RAD21, ab992, lot GR3253930–8, GR3310168–11; H3K4me3, Millipore, 04–745, lot 3243412; H3K27ac, Active Motif, 39685, lot 33417016.). Chromatin was pulled down by protein G Sepharose beads (GE, 17061801) and washed three times with RIPA buffer(10 mM Tris pH 8.0, 1 mM EDTA, 1% Triton X-100, 0.1% SDS, 0.1% Sodium Deoxycholate), twice with high-salt RIPA buffer (10 mM Tris pH 8.0, 300 mM NaCl, 1 mM EDTA, 1% Triton X-100, 0.1% SDS, 0.1% Sodium Deoxycholate), once with LiCl buffer (10 mM Tris pH 8.0, 250 mM LiCl, 1 mM EDTA, 0.5% IGEPAL CA-630, 0.1% Sodium Deoxycholate), and twice with TE buffer (10 mM Tris, pH 8.0; 0.1 mM EDTA). Washed chromatin was reverse crosslinked overnight with 2 μl proteinase K (P8107S, NEB) at 65 °C (1%SDS, 10 mM Tris, pH 8.0, 0.1 mM EDTA), column purified and subjected to end repair, A-tailing, adapter ligation, and PCR amplification. Final libraries were purified by SPRI beads (0.8:1) and quantified with Qubit HS dsDNA kit (Q32854).
RNA-seq
Total RNA from cells was extracted using the TRIzol Plus RNA purification kit (Thermo Fisher Scientific, Catalog: 12183555). RNA-seq libraries were prepared from 4 μg total RNA using the Illumina TruSeq Stranded mRNA Library Prep Kit Set A (RS-122–2101; Illumina) or Set B (RS-122–2102; Illumina). RNA-seq libraries were sequenced on illumine Next-seq 550 and Hi-seq4000 platforms (75-bp paired ends).
PLAC-seq/HiChIP
Proximity Ligation ChIP-sequencing (PLAC-seq) (also known as HiChIP) libraries were prepared as previously described57, 58 with minor modifications. In brief, 2–3 million cells were crosslinked for 15 minutes at room temperature with 1% methanol-free formaldehyde and quenched for 5 minutes at room temperature with 0.2 M glycine. The crosslinked cells were lysed in 300 μl Hi-C lysis buffer (10 mM Tris-HCl, pH 8.0, 10 mM NaCl, 0.2% IPEGAL CA-630) for 15 minutes on ice and then washed once with 500 μl lysis buffer (2,500×g for 5 minutes). Subsequently, cells were resuspended in 50 μl 0.5% SDS and incubated for 10 min at 62°C then quenched by 160 μl 1.56% Triton X-100 for 15 min at 37°C. Then, 25 μl of 10× NEBuffer 2 and 100 U MboI were added to digest chromatin for 2 hours at 37°C with shaking (1,000 rpm). Digested fragments were biotin-labeled and subsequently ligated by T4 DNA ligase buffer (NEB) for 2 hours at 23°C with 300 rpm gentle rotation. Chromatin was sheared and washed as described in ChIP-seq. Dynabeads (M-280 Sheep anti-Rabbit IgG, catalog: 11203D) coated with 5 μg H3K4me3 antibodies (Millipore, 04–745, lot 3243412) were used for immunoprecipitation. Pulled down chromatin was treated with 10 μg RNase A for 1 hour at 37°C, reverse-crosslinked by 20 μg proteinase K at 65°C for 2 hours, then purified with Zymo DNA Clean & Concentrator-5 kit. Ligation junctions were enriched by 25 μl myOne T1 Streptavidin Dynabeads. Libraries were prepared using QIAseq Ultralow Input Library Kit (Qiagen, #180492). Final libraries were size selected with SPRI beads (0.5:1 and 1:1), quantified, and submitted for paired-end sequencing.
Hi-C
Cells were processed in the same way as in PLAC-seq before chromatin shearing steps. Briefly, nuclei after the ligation step were digested by 50 μl of proteinase K (20 mg/ml) for 30 min at 55 °C. DNA was then purified by ethanol precipitation and resuspended in 130 μl 10 mM Tris-HCl (pH 8.0). Purified DNA was sonicated by Covaris M220 instrument with the following parameters: Duty cycle, 10%; Power, 50; Cycles/burst, 200; Time, 70 seconds. DNA fragments smaller than 300 bp were removed by Ampure XP bead-based dual size selection (0.55:1 and 0.75:1). Biotin-labeled free DNA ends were cleaned up by end-repair reaction and ligation junctions were enriched by Streptavidin Dynabeads as described in PLAC-seq. Ligation junctions were then purified and subjected to A-tailing, adapter ligation, and PCR amplification. Final libraries were purified by 0.75× Ampure XP beads, quantified, and submitted for pair-end sequencing.
Multiplexed FISH imaging for chromatin tracing
Glass coverslips were treated by poly-L-lycine for 30 min at 37°C. Then, glass coverslips were washed twice with 5ml PBS and treated with 0.2% gelatin for another 20 min at 37°C. 2.5 million mESCs were seeded in a 6-cm plastic dish containing the treated glass coverslip. After 20 hours, cells were cross-linked by 4% paraformaldehyde and followed by chromatin tracing experiments as described in a previous publication60. Briefly, the entire 210-kb Sox2 region was labeled by a library of primary Oligopaint probes60, 61. Each primary probe consists of a unique 42-nucleotide readout sequence that is specific for each 5 kb DNA segment. Next, secondary readout probes complementary to the readout sequences on the primary probes were added to the cells. Lastly, fluorophore-labeled common imaging probes complementary to the secondary probes were added to the cells to allow three-dimensional diffraction-limited imaging of individual DNA segments. After each round of imaging, the fluorescence signal was extinguished by using both TCEP [tris(2-carboxyethyl) phosphine] cleavage at a concentration of 50 μM in 2× SSC and high power photobleaching. The process was repeated until all DNA segments were labeled and imaged. We performed three-color imaging by using three secondary readout imaging probes that were conjugated with Cy3, Cy5, and Alexa 750, respectively. In this case, three consecutive 5-kb chromatin segments were labeled by each round of imaging. A pool of 42 oligonucleotide probe sets was designed to scan the 210-kb Sox2 locus with each set covering a 5-kb DNA region.
Multiplexed RNA and DNA FISH imaging at the Sox2 locus
The dual-modality FISH imaging was performed as recently described63. Briefly, the sample was prepared as in the “Multiplexed FISH imaging for chromatin tracing” except that after cells were cross-linked by 4% paraformaldehyde, the sample was hybridized with oligonucleotide probes (Supplementary Table 7) targeting the Sox2, egfp, and mcherry transcripts followed by imaging (final concentration 100 nM). Immediately after the RNA FISH imaging was completed, the sample was washed with 50% formamide to remove residual fluorescence readout probes and crosslinked again with 4% paraformaldehyde before multiplexed FISH imaging for chromatin tracing.
Data analysis
ChIP-seq
Sequenced reads were aligned to reference mouse genome mm10 using bowtie2 (version 2.2.9). Unmapped reads and PCR duplicates were removed. For clones with the insertion of synthetic CTCF binding sites, reads were aligned to a customized mm10 reference genome that includes the inserted sequence. Mapping pipeline is available at http://renlab.sdsc.edu/huh025/chipseq-PE/. Signal tracks were generated with the command “bamCoverage (version 3.3.1) –normlizingRPKM -bs 50 --smoothLength 150“. Peaks were called by macs2 ( version 2.1.1.20160309) with default parameters.
RNA-seq
The RNA-seq alignment and quantification pipeline is available at https://github.com/ren-lab/rnaseq-pipeline. Briefly, reads were aligned to mm10 (GRCm38) and GENCODE GTF version M25 with rnaSTAR72 (version 020201). Particularly, we created two extra chromosomes for the two tagged Sox2 alleles. PCR duplicates were removed using Picard. Reads uniquely mapped to egfp and mcherry sequences were counted using samtools. Sox2 expression from the CAST and 129 allele was quantified by RPKM values of the egfp and mcherry gene, respectively.
PLAC-seq
To resolve allele-specific interactions, we created the VCF files containing SNPs with respect to the mm10 reference genome for parental strain CAST/EiJ and 129SV/Jae. Specifically, whole-genome sequencing reads from the two strains were mapped to mm10, deduplicated, and called SNPs using bcftools. We removed heterozygous SNP calls and those with sequencing depth less than 5 and quality less than 30 and further removed SNPs that were present in both strains. We used a modified mapping procedure from WASP73 pipeline (version 0.3.4) to detect allele-specific contacts. Since WASP pipeline ignores indels, we further removed all reads which map to within 50 base pairs from the nearest indel. We modified the original WAPS mapping procedure by replacing the bowtie2 alignment tool with bwa-mem and integrated MAPS74 feather post-filtering pipeline to resolve the chimeric reads. Analysis pipeline is available at https://github.com/ijuric/Sox2AllelicAnalysis.
Hi-C
To process Hi-C data we used our in-house pipeline available at https://github.com/ren-lab/hic-pipeline. Briefly, Hi-C reads were aligned to mm10 using BWA-MEM (version 0.7.12-r1039) for each read separately and then paired. For chimeric reads, only 5’ end-mapped locations were kept. Duplicated read pairs mapped to the same location were removed to leave only one unique read pair. The output bam files were transformed into juicer file format for visualization in Juicebox 1.11.08. Contact matrices were normalized using the Knight–Ruiz matrix balancing method75. Directionality Index (DI) score for each sample was generated at 50-kb resolution and 2-Mb window (40 bins) as described in a previous work24. Haplotype phasing was performed using the obtained CAST/129 VCF file. This created two contact matrices corresponding to ‘Cast allele’ and ‘129 allele’ for each Hi-C library. For each phased haplotype of chromosome 3, the DI score was generated at 10-kb resolution and 50-kb window (5 bins).
Chromatin tracing data processing
Custom software was used to obtain images of chromatin architecture as described previously60 with minor modifications. The software identifies centroid positions of each 5-kb chromatin segment using diffraction-limited z-stack images acquired by epifluorescence microscopy. Chromosome locations were first identified via the segmentation of the nuclei in each field of view using a convolutional neural network (CNN). The segmentation masks were then applied to limit the chromosome candidates to the two most likely clusters of fluorescence spots presented in each nucleus. We then selected the two spots that showed the strongest averaged fluorescence signal over all imaging rounds as the two alleles for each nucleus. To avoid selecting the same chromosome, we also required the two spots to be separated by at least 10 pixels (1.08 μm). The algorithm then utilized the identified chromosome locations to select candidate spots of the imaged 5-kb chromatin segments in every round of imaging. A Gaussian fitting algorithm was then used to fit both the signal of each of the candidate segments and the fiducial beads. The chromatic aberration, flat-field, and drift correction algorithms were adopted from the published work60.
The candidate spot of each segment was then further evaluated for their likelihood to be accepted or rejected as estimated by an expectation-maximization (EM) algorithm. The EM algorithm computes a score based upon a product of three terms, brightness of the spot, the proximity of the spot to the estimated chromosome centroid position, and the proximity of the spot to a moving average localization of the candidates selected in the previous five rounds of imaging, of each candidate spot of a segment. The EM algorithm selected the highest scoring candidate spot for each chromosome segment in each round of imaging, while all remaining candidate spots were not considered in subsequent analyses.
The misidentification rate was computed as the percentage of fluorescence spots among the top discarded candidate spots which had scores above the EM score threshold that we chose. Finally, only chromosomes that contained accepted segments with a score above the selected threshold across at least ~50% of imaging rounds (22/42 rounds) were kept for further analysis. The detection efficiency of each segment for each experiment was computed as the fraction of segments with accepted candidate spots based upon the above procedure. We only kept cells in which one and only one chromosome was detected positive for the insertion. In addition, we required the signal of the insertion to be greater than 1/2 of the median value of all segments and at least two times stronger than the signal from the other allele. In this way, the misclassification of the two alleles is estimated to be less than 5%. Insulation score was calculated for each chromosome as the natural log of the ratio of median distance between loci across domains and median distance between loci within domains. Sox2 enhancer-promoter distance was calculated by median pairwise Euclidean distances between the genomic locations of the Sox2 gene (9th - 11th region) and its enhancer (30th - 32nd region) for every chromosome.
Extended Data
Extended Data Fig. 1. Genotyping mESC reporter cell lines.

a, Genotyping egfp and mcherry labeled Sox2 gene. Left, Sanger sequencing results for allele-specific PCR products. Allele-specific SNP is highlighted. Right, the construct of the clone and the SNP information used to distinguish the two alleles. The reverse primer was common, while the forward primer was allele-specific, matching with egfp and mcherry sequence, respectively. b-c, Genotyping the Insulator reporter and control cell lines. Left, Sanger sequencing and SNP information. Right, Construct of the clone and positions of PCR primers. The forward primer is specific to the inserted HyTK gene. b, insulator reporter cell line. c, Insulator control cell line.
Extended Data Fig. 2. Insulation features of CBSs from the Sox9-Kcnj2 TAD boundary.

a, Hi-C contact map of the Sox9-Kcnj2 locus in mouse ES cells. Zoom in view shows the four CTCF binding sites cloned for insulator activity test. b, ChIP-seq of CTCF in the no insertion clone and the clone with an extra copy of the four Sox9-Kcnj2 TAD boundary CBS inserted inside the Sox2 domain. c, Reduction in Sox2-eGFP expression by one additional CBS. The comparison was between the clones presented in Figure 2b. (0 CBS, n = 8; 1 CBS inside, n = 23; 2 CBS inside, n = 18; 3 CBS inside, n = 13; 4 CBS inside, n = 5; Data are mean ± sd). d, Allele-specific Sox2 expression in the no insertion clone (n = 2), the 4CBS clone (n = 3) , and the 4CBS downstream clone (n = 2) as measured by RNA-seq. Sox2 expression from the CAST and 129 allele was represented by normalized read counts (rpkm) of the tagged egfp and mcherry gene, respectively. e, Relative Sox2 expression in the 4CBS and the 4CBS downstream clone in d measured by RNA-seq and FACS. The Sox2 expression from the egfp allele was first normalized to the mcherry allele, then compared to the no insertion clone. f, FACS profiling of the no insertion clone and the 4CBS clone. g, FACS profiling of GFPlow, GFPhigh sub-populations, and the unsort total population of the 4CBS insertion clone in f after extended culturing for 8 days. Left, GFP signal, right, mCherry signal from the same cells. h, ChIP-seq of H3K4me3 and H3K27ac in the no insertion clone and the 4CBS clone (n = 2). i, Allelic quantification of H3K27ac signal on the Sox2 super-enhancer of clones in h. H3K27ac ChIP-seq reads on the Sox2 super-enhancer were normalized by the total reads mapped to chromosome 3 for each allele.
Extended Data Fig. 3. Insulation effects of synthetic CTCF binding sites.

a, Additive insulation by synthetic CBS from boundary regions. Left top, compositions of one 139bp-CBS that was synthesized; Left bottom, tandemly arrayed 139bp-CBSs tested for insulator activity. Right, normalized Sox2-eGFP expression of clones with the tandemly arrayed 139bp-CBSs inserted between the Sox2 gene and its super-enhancer. Blue, CBS core motifs were in forward orientation; Red, CBS core motifs were in reverse orientation. Insertions were on the CAST allele only. n = 3, unpaired t-test, two-tailed. Data are mean ± sd. b, Insulation effects of PCR cloned large size CBSs (1–4 kb) and the synthesized 139bp-CBSs that contain the same CTCF motifs. (n = 12, paired t-test, two-tailed, ***P = 0.0007.). c, CTCF binding strength at selected boundary sites and non-boundary sites in mouse ES cells. ChIP-seq signals of CTCF are shown in 2-kb window. d, ChIP-seq of CTCF and Rad21 in clones with the insertion of six (nBd-syn6) or fifteen (nBd-syn15) 139-bp CBSs obtained from non-boundary regions. ChIP-seq reads were mapped to a customized mm10 genome that included the inserted sequence at the target site. Insertion position is highlighted in the red box.
Extended Data Fig. 4. ChIP-seq analysis of CTCF and cohesin binding at the synthetic insulators in various insulator reporter clones.

a, ChIP-seq signal tracks of CTCF in clones with the insertion of different synthetic CBS variants (n = 2). Each insertion consists of six CBSs that were tandemly arrayed in forward orientation (Supplementary Table 4). The insertion location is highlighted in the yellow box. b, CTCF binding strength (counts per million uniquely mapped reads) at the insertion location in the clones in (a). For each clone, ChIP-seq reads were mapped to a specific customized genome that contains the corresponding insertion in the Sox2 locus (n = 2; for bd core with bd adj, n = 4; for nbd core with bd adj n = 3.). c, ChIP-seq signal tracks of Rad21 in the same clones in (a) (n = 2). The insertion location is highlighted in the yellow box. d, Rad21 binding strength (counts per million uniquely mapped reads) at the insertion location in the clones in (c). For each clone, ChIP-seq reads were mapped to a specific customized genome that contains the corresponding insertion in the Sox2 locus (n = 2). e, Sequence alignment of the six boundary CBSs. Each CBS consists of 19-bp core motif plus 20-bp adjacent sequences on both sides. The color indicates the base frequency at each position. The CTCF motifs are highlighted in the red box.
Extended Data Fig. 5. Impact of CTCF ZF-9–11 deletion on transcriptional insulation by a synthetic insulator.

a, A schematic shows the experimental design to delete ZF9–11 of CTCF in mESCs. The exon 10, 11, partial of exon12, and an SV40 polyA signal were inserted into exon 9, resulting in the skip of exon9 in mRNA of the CTCF gene. b, PCR genotyping CTCF ΔZF9–11 mutant colonies. Genotyping primers spanned the insertion in exon 9. Highlighted in red boxes were homozygous mutant colonies evidenced by a single large-sized PCR fragment. PCR products from the homozygous mutant clones were further confirmed by Sanger sequencing. Genotyping of the homozygous mutants was repeated once with similar results. c, Western blot of CTCF in wild type and an exemplary CTCF ΔZF9–11 mutant clone. The primary antibody was the same one used for ChIP-seq (catalog: ab70303, lot GR3281212–7). Bottom, TBP loading control (primary antibody: sc-421, lot #B0304). Western blot was repeated once with similar results. d, Impact of CTCF zinc fingers 9–11 deletion on insulation effects of boundary CBSs with sixty-base-pair adjacent sequences. Left, eGFP profile of exemplary clones expressing wild-type and mutant CTCF protein; middle, mCherry profile of the same cells; right, normalized eGFP signal (eGFP/mCherry) of the wild-type and mutant clones. e, Impact of CTCF zinc fingers 9–11 deletion on insulation effects of boundary CBSs with ten-base-pair adjacent sequences. Left, eGFP profile of exemplary clones expressing wild-type and mutant CTCF protein; middle, mCherry profile of the same cells; right, normalized eGFP signal (eGFP/mCherry) of the wild-type and mutant clones.
Extended Data Fig. 6. Chromatin contacts at inserted CBSs.

a, K-R normalized Hi-C matrix (Observed/Expected) in the clone with the two forward Sox9-Kcnj2 TAD boundary CBSs inserted between the Sox2 promoter and super-enhancer (n = 2, replicates were merged). Hi-C reads were mapped to a customized chromosome 3 containing the insertion of the two forward CBSs. ChIP-seq signal of CTCF and orientations of the inserted CBSs and CBSs around the Sox2 promoter and super-enhancer were shown. The black arrow indicates the interactions between the inserted CBSs and the CBS on the Sox2 super-enhancer. b, Virtual 4C derived from Hi-C contacts in (a) at the viewpoint of the two inserted CBSs. Contacts were counted in each 5kb-bin. Contacts between the inserted CBSs and the Sox2 promoter or super-enhancer were compared to expected values, two-sided Poisson test. c, K-R normalized Hi-C matrix (Observed/Expected) in the clone with the four Sox9-Kcnj2 TAD boundary CBSs inserted between the Sox2 promoter and super-enhancer (n = 2, replicates were merged). Hi-C reads were mapped to a customized chromosome 3 containing the insertion of the four CBSs. ChIP-seq signal of CTCF and orientations of the inserted CBSs and CBSs around the Sox2 promoter and super-enhancer were shown. The black arrows indicate the interactions between the inserted CBSs and the CBS on the Sox2 promoter and super-enhancer. d, Virtual 4C derived from Hi-C contacts in (c) at the viewpoint of the two reverse-orientated CBSs inserted between the Sox2 promoter and super-enhancer. Contacts were counted in each 5kb-bin. Contacts between the two reverse CBSs and the Sox2 promoter or super-enhancer were compared to expected values, two-sided Poisson test.
Extended Data Fig. 7. Allele classification by multiplexed DNA FISH.

a-c, Bar plots showing detect efficiency of the 42 segments of chromatin tracing experiments in the “4CBS” clone (a), the “4CBS mutant” clone (b), and the “4CBS downstream” clone (c). Detect efficiency of each segment was calculated as the fraction of chromosomes that showed a positive fluorescence signal at the specific imaging round. d, Exemplary images of allele classification. Left, nuclei segmentation and the positions of CAST and 129 allele in the nucleus. Right, images of the forty-two 5-kb segments (chr3:34,601,078–34,811,078) of the CAST and 129 allele. The hybridization probes of the 26th segment (highlighted in the red box) specifically targeted the 4CBS sequence. The chromosome positive for the 26th segment (inserted 4CBS) was classified as CAST allele, the negative chromosome in the same cell was classified as 129 allele. Cells with both chromosomes positive or both chromosomes negative for the 26th segment were discarded.
Extended Data Fig. 8. Spatial organization of the Sox2 locus in engineered mESCs.

a, Bulk Hi-C contact matrix (K-R normalized) of the Sox2 locus in the 4CBS clone. b, Median pairwise distance of the same Sox2 region measured by chromatin tracing experiment in the same clone in a, CAST and 129 chromosomes were combined. c, Correlation between the Hi-C contact frequency matrix (a) and median distance matrix(b). d, Normalized Sox2-eGFP expression in the no insertion clone(n = 8), the “4CBS” clone (same cells in a-b, n = 2), and two insertion controls, “4CBS mutant” (n = 3) and “4CBS downstream” (n = 3). One-way analysis of variance with Bonferroni’s multiple comparisons test. Data are mean ± sd. e-f, Median spatial-distance matrix for the 210kb Sox2 region (chr3: 34601078–34811078) of 129 (left) and CAST (right) chromosomes of the “4CBS mutant” clone(e) and the “4CBS downstream clone”(f). The 26th segment was imaged by 4CBS specific probes in e. Similarly, the 38th segment was imaged by 4CBS specific probes in f. g-h, The probability of forming single-chromosome domain boundaries at each segment for the two alleles of the “4CBS mutant” clone (g), and the “4CBS downstream” clone (h). i, The distribution of single-chromosome insulation scores for each of the alleles between Sox2 promoter – 4CBSΔ insertion (segments 10–25) and 4CBSΔ insertion – Sox2 super-enhancer (segments 26–33), respectively. Two-sided Wilcoxon rank-sum test was performed. j, The distribution of single-chromosome insulation scores for each of the alleles between the same two domains (segment 10–25 and segment 26–33) in (i) for the “4CBS downstream” clone. Insulation score was calculated in the same way as in (i). Two-sided Wilcoxon rank-sum test was performed.
Extended Data Fig. 9. Allele differences in median spatial distance.

a-c, Difference of the median distance matrices between the CAST and 129 allele of the “4CBS” clone (a), the “4CBS mutant” clone (b) and the “4CBS downstream” clone(c).
Extended Data Fig. 10. Imaging of both nascent transcripts and chromatin structure at the Sox2 locus.

a, Example images of RNA FISH(left) and chromatin tracing(right) in the same cells. Circles indicate individual nuclei. RNA probes targeting Sox2, efgp, and mcherry are color-coded. Transcripts from the CAST allele are indicated by dots in purple pseudo color. Transcripts from the 129 allele are indicated by dots in cyan pseudo color. Arrows highlight examples of bursting alleles. b, Bursting frequencies of the CAST and 129 allele in the 4CBS clone and the control clone with 4CBS inserted downstream of the Sox2 SE. The numbers of bursting chromosomes and total chromosomes are indicated on the top of each bar. c, Median spatial distance matrices of the CAST and 129 allele in the 4CBS and the control clone (4CBS inserted downstream of the Sox2 super-enhancer). Multiplexed DNA FISH experiments were performed in the same cells following the RNA FISH experiments. d, Enhancer-promoter distances of the bursting and resting chromosomes in the 4CBS and the 4CBS downstream clone. A two-sided KS test between the distributions and a two-sided Wilcoxon test were performed.
Supplementary Material
Acknowledgements
We are grateful for comments from members of the Ren laboratory. This study was supported by funding from the Ludwig Institute for Cancer Research and NIH (U54 DK107977 and UM1HG011585, to B.R., M.H. and M.N., and 3U54DK107977-05S1 to B.R.). X.Z. is a Howard Hughes Medical Institute Investigator.
Footnotes
Competing interests
Bing Ren is a co-founder and consultant for Arima Genomics, Inc. and co-founder of Epigenome Technologies. Xiaowei Zhuang is a co-founder and consultant for Vizgen, Inc. The remaining authors declare no competing interests.
Code Availability
Multiplexed FISH data and code for analyses can be found on Github at https://github.com/epigen-UCSD/huang-natgen2021.
Data Availability
All next-generation sequencing data are available under GEO accession GSE153403. Raw images of multiplexed FISH experiments and raw FACS data of specific mESC colonies are available upon request.
References
- 1.Hnisz D, Day DS & Young RA Insulated Neighborhoods: Structural and Functional Units of Mammalian Gene Control. Cell 167, 1188–1200 (2016). [DOI] [PMC free article] [PubMed] [Google Scholar]
- 2.Kellis M et al. Defining functional DNA elements in the human genome. Proc Natl Acad Sci U S A 111, 6131–6138 (2014). [DOI] [PMC free article] [PubMed] [Google Scholar]
- 3.Levine M, Cattoglio C & Tjian R Looping back to leap forward: transcription enters a new era. Cell 157, 13–25 (2014). [DOI] [PMC free article] [PubMed] [Google Scholar]
- 4.West AG, Gaszner M & Felsenfeld G Insulators: many functions, many mechanisms. Genes Dev 16, 271–288 (2002). [DOI] [PubMed] [Google Scholar]
- 5.Geyer PK & Corces VG DNA position-specific repression of transcription by a Drosophila zinc finger protein. Genes Dev 6, 1865–1873 (1992). [DOI] [PubMed] [Google Scholar]
- 6.Recillas-Targa F, Bell AC & Felsenfeld G Positional enhancer-blocking activity of the chicken beta-globin insulator in transiently transfected cells. Proc Natl Acad Sci U S A 96, 14354–14359 (1999). [DOI] [PMC free article] [PubMed] [Google Scholar]
- 7.Stief A, Winter DM, Stratling WH & Sippel AE A nuclear DNA attachment element mediates elevated and position-independent gene activity. Nature 341, 343–345 (1989). [DOI] [PubMed] [Google Scholar]
- 8.Gurudatta BV & Corces VG Chromatin insulators: lessons from the fly. Brief Funct Genomic Proteomic 8, 276–282 (2009). [DOI] [PMC free article] [PubMed] [Google Scholar]
- 9.Chung JH, Bell AC & Felsenfeld G Characterization of the chicken beta-globin insulator. Proc Natl Acad Sci U S A 94, 575–580 (1997). [DOI] [PMC free article] [PubMed] [Google Scholar]
- 10.Lobanenkov VV et al. A novel sequence-specific DNA binding protein which interacts with three regularly spaced direct repeats of the CCCTC-motif in the 5’-flanking sequence of the chicken c-myc gene. Oncogene 5, 1743–1753 (1990). [PubMed] [Google Scholar]
- 11.Bell AC & Felsenfeld G Methylation of a CTCF-dependent boundary controls imprinted expression of the Igf2 gene. Nature 405, 482–485 (2000). [DOI] [PubMed] [Google Scholar]
- 12.Flavahan WA et al. Insulator dysfunction and oncogene activation in IDH mutant gliomas. Nature 529, 110–114 (2016). [DOI] [PMC free article] [PubMed] [Google Scholar]
- 13.Katainen R et al. CTCF/cohesin-binding sites are frequently mutated in cancer. Nat Genet 47, 818–821 (2015). [DOI] [PubMed] [Google Scholar]
- 14.Ohlsson R, Renkawitz R & Lobanenkov V CTCF is a uniquely versatile transcription regulator linked to epigenetics and disease. Trends Genet 17, 520–527 (2001). [DOI] [PubMed] [Google Scholar]
- 15.Filippova GN et al. An exceptionally conserved transcriptional repressor, CTCF, employs different combinations of zinc fingers to bind diverged promoter sequences of avian and mammalian c-myc oncogenes. Mol Cell Biol 16, 2802–2813 (1996). [DOI] [PMC free article] [PubMed] [Google Scholar]
- 16.Lupianez DG et al. Disruptions of topological chromatin domains cause pathogenic rewiring of gene-enhancer interactions. Cell 161, 1012–1025 (2015). [DOI] [PMC free article] [PubMed] [Google Scholar]
- 17.Shukla S et al. CTCF-promoted RNA polymerase II pausing links DNA methylation to splicing. Nature 479, 74–79 (2011). [DOI] [PMC free article] [PubMed] [Google Scholar]
- 18.Vostrov AA & Quitschke WW The zinc finger protein CTCF binds to the APBbeta domain of the amyloid beta-protein precursor promoter. Evidence for a role in transcriptional activation. J Biol Chem 272, 33353–33359 (1997). [DOI] [PubMed] [Google Scholar]
- 19.Zhang X et al. Fundamental roles of chromatin loop extrusion in antibody class switching. Nature 575, 385–389 (2019). [DOI] [PMC free article] [PubMed] [Google Scholar]
- 20.Guo Y et al. CTCF/cohesin-mediated DNA looping is required for protocadherin alpha promoter choice. Proc Natl Acad Sci U S A 109, 21081–21086 (2012). [DOI] [PMC free article] [PubMed] [Google Scholar]
- 21.Guo Y et al. CRISPR Inversion of CTCF Sites Alters Genome Topology and Enhancer/Promoter Function. Cell 162, 900–910 (2015). [DOI] [PMC free article] [PubMed] [Google Scholar]
- 22.Ghirlando R & Felsenfeld G CTCF: making the right connections. Genes Dev 30, 881–891 (2016). [DOI] [PMC free article] [PubMed] [Google Scholar]
- 23.Phillips-Cremins JE & Corces VG Chromatin insulators: linking genome organization to cellular function. Mol Cell 50, 461–474 (2013). [DOI] [PMC free article] [PubMed] [Google Scholar]
- 24.Dixon JR et al. Topological domains in mammalian genomes identified by analysis of chromatin interactions. Nature 485, 376–380 (2012). [DOI] [PMC free article] [PubMed] [Google Scholar]
- 25.Nora EP et al. Spatial partitioning of the regulatory landscape of the X-inactivation centre. Nature 485, 381–385 (2012). [DOI] [PMC free article] [PubMed] [Google Scholar]
- 26.Franke M et al. Formation of new chromatin domains determines pathogenicity of genomic duplications. Nature 538, 265–269 (2016). [DOI] [PubMed] [Google Scholar]
- 27.Nora EP et al. Targeted Degradation of CTCF Decouples Local Insulation of Chromosome Domains from Genomic Compartmentalization. Cell 169, 930–944 e922 (2017). [DOI] [PMC free article] [PubMed] [Google Scholar]
- 28.Luppino JM et al. Cohesin promotes stochastic domain intermingling to ensure proper regulation of boundary-proximal genes. Nat Genet (2020). [DOI] [PMC free article] [PubMed] [Google Scholar]
- 29.Wutz G et al. Topologically associating domains and chromatin loops depend on cohesin and are regulated by CTCF, WAPL, and PDS5 proteins. EMBO J 36, 3573–3599 (2017). [DOI] [PMC free article] [PubMed] [Google Scholar]
- 30.Alipour E & Marko JF Self-organization of domain structures by DNA-loop-extruding enzymes. Nucleic Acids Res 40, 11202–11212 (2012). [DOI] [PMC free article] [PubMed] [Google Scholar]
- 31.Davidson IF et al. DNA loop extrusion by human cohesin. Science 366, 1338–1345 (2019). [DOI] [PubMed] [Google Scholar]
- 32.Fudenberg G et al. Formation of Chromosomal Domains by Loop Extrusion. Cell Rep 15, 2038–2049 (2016). [DOI] [PMC free article] [PubMed] [Google Scholar]
- 33.Haarhuis JHI et al. The Cohesin Release Factor WAPL Restricts Chromatin Loop Extension. Cell 169, 693–707 e614 (2017). [DOI] [PMC free article] [PubMed] [Google Scholar]
- 34.Kim Y, Shi Z, Zhang H, Finkelstein IJ & Yu H Human cohesin compacts DNA by loop extrusion. Science 366, 1345–1349 (2019). [DOI] [PMC free article] [PubMed] [Google Scholar]
- 35.Rao SSP et al. Cohesin Loss Eliminates All Loop Domains. Cell 171, 305–320 e324 (2017). [DOI] [PMC free article] [PubMed] [Google Scholar]
- 36.Sanborn AL et al. Chromatin extrusion explains key features of loop and domain formation in wild-type and engineered genomes. Proc Natl Acad Sci U S A 112, E6456–6465 (2015). [DOI] [PMC free article] [PubMed] [Google Scholar]
- 37.Vian L et al. The Energetics and Physiological Impact of Cohesin Extrusion. Cell 173, 1165–1178 e1120 (2018). [DOI] [PMC free article] [PubMed] [Google Scholar]
- 38.Wutz G et al. ESCO1 and CTCF enable formation of long chromatin loops by protecting cohesin(STAG1) from WAPL. Elife 9 (2020). [DOI] [PMC free article] [PubMed] [Google Scholar]
- 39.Brackley CA et al. Nonequilibrium Chromosome Looping via Molecular Slip Links. Phys Rev Lett 119, 138101 (2017). [DOI] [PubMed] [Google Scholar]
- 40.Barbieri M et al. Complexity of chromatin folding is captured by the strings and binders switch model. Proc Natl Acad Sci U S A 109, 16173–16178 (2012). [DOI] [PMC free article] [PubMed] [Google Scholar]
- 41.Bianco S et al. Polymer physics predicts the effects of structural variants on chromatin architecture. Nat Genet 50, 662–667 (2018). [DOI] [PubMed] [Google Scholar]
- 42.Brackley CA, Taylor S, Papantonis A, Cook PR & Marenduzzo D Nonspecific bridging-induced attraction drives clustering of DNA-binding proteins and genome organization. Proc Natl Acad Sci U S A 110, E3605–3611 (2013). [DOI] [PMC free article] [PubMed] [Google Scholar]
- 43.Buckle A, Brackley CA, Boyle S, Marenduzzo D & Gilbert N Polymer Simulations of Heteromorphic Chromatin Predict the 3D Folding of Complex Genomic Loci. Mol Cell 72, 786–797 e711 (2018). [DOI] [PMC free article] [PubMed] [Google Scholar]
- 44.Conte M et al. Polymer physics indicates chromatin folding variability across single-cells results from state degeneracy in phase separation. Nat Commun 11, 3289 (2020). [DOI] [PMC free article] [PubMed] [Google Scholar]
- 45.Di Pierro M, Zhang B, Aiden EL, Wolynes PG & Onuchic JN Transferable model for chromosome architecture. Proc Natl Acad Sci U S A 113, 12168–12173 (2016). [DOI] [PMC free article] [PubMed] [Google Scholar]
- 46.Schwarzer W et al. Two independent modes of chromatin organization revealed by cohesin removal. Nature 551, 51–56 (2017). [DOI] [PMC free article] [PubMed] [Google Scholar]
- 47.Despang A et al. Functional dissection of the Sox9-Kcnj2 locus identifies nonessential and instructive roles of TAD architecture. Nat Genet 51, 1263–1271 (2019). [DOI] [PubMed] [Google Scholar]
- 48.Gribnau J, Hochedlinger K, Hata K, Li E & Jaenisch R Asynchronous replication timing of imprinted loci is independent of DNA methylation, but consistent with differential subnuclear localization. Genes Dev 17, 759–773 (2003). [DOI] [PMC free article] [PubMed] [Google Scholar]
- 49.Li Y et al. CRISPR reveals a distal super-enhancer required for Sox2 expression in mouse embryonic stem cells. PLoS One 9, e114485 (2014). [DOI] [PMC free article] [PubMed] [Google Scholar]
- 50.Zhou HY et al. A Sox2 distal enhancer cluster regulates embryonic stem cell differentiation potential. Genes Dev 28, 2699–2711 (2014). [DOI] [PMC free article] [PubMed] [Google Scholar]
- 51.Kentepozidou E et al. Clustered CTCF binding is an evolutionary mechanism to maintain topologically associating domains. Genome Biol 21, 5 (2020). [DOI] [PMC free article] [PubMed] [Google Scholar]
- 52.Frith MC, Saunders NF, Kobe B & Bailey TL Discovering sequence motifs with arbitrary insertions and deletions. PLoS Comput Biol 4, e1000071 (2008). [DOI] [PMC free article] [PubMed] [Google Scholar]
- 53.Nakahashi H et al. A genome-wide map of CTCF multivalency redefines the CTCF code. Cell Rep 3, 1678–1689 (2013). [DOI] [PMC free article] [PubMed] [Google Scholar]
- 54.Xu D et al. Dynamic Nature of CTCF Tandem 11 Zinc Fingers in Multivalent Recognition of DNA As Revealed by NMR Spectroscopy. J Phys Chem Lett 9, 4020–4028 (2018). [DOI] [PubMed] [Google Scholar]
- 55.Yin M et al. Molecular mechanism of directional CTCF recognition of a diverse range of genomic sites. Cell Res 27, 1365–1377 (2017). [DOI] [PMC free article] [PubMed] [Google Scholar]
- 56.Yan J et al. Histone H3 lysine 4 monomethylation modulates long-range chromatin interactions at enhancers. Cell Res 28, 387 (2018). [DOI] [PMC free article] [PubMed] [Google Scholar]
- 57.Fang R et al. Mapping of long-range chromatin interactions by proximity ligation-assisted ChIP-seq. Cell Res 26, 1345–1348 (2016). [DOI] [PMC free article] [PubMed] [Google Scholar]
- 58.Mumbach MR et al. HiChIP: efficient and sensitive analysis of protein-directed genome architecture. Nat Methods 13, 919–922 (2016). [DOI] [PMC free article] [PubMed] [Google Scholar]
- 59.Rao SS et al. A 3D map of the human genome at kilobase resolution reveals principles of chromatin looping. Cell 159, 1665–1680 (2014). [DOI] [PMC free article] [PubMed] [Google Scholar]
- 60.Bintu B et al. Super-resolution chromatin tracing reveals domains and cooperative interactions in single cells. Science 362 (2018). [DOI] [PMC free article] [PubMed] [Google Scholar]
- 61.Mateo LJ et al. Visualizing DNA folding and RNA in embryos at single-cell resolution. Nature 568, 49–54 (2019). [DOI] [PMC free article] [PubMed] [Google Scholar]
- 62.Wang S et al. Spatial organization of chromatin domains and compartments in single chromosomes. Science 353, 598–602 (2016). [DOI] [PMC free article] [PubMed] [Google Scholar]
- 63.Su JH, Zheng P, Kinrot SS, Bintu B & Zhuang X Genome-Scale Imaging of the 3D Organization and Transcriptional Activity of Chromatin. Cell 182, 1641–1659 e1626 (2020). [DOI] [PMC free article] [PubMed] [Google Scholar]
- 64.Alexander JM et al. Live-cell imaging reveals enhancer-dependent Sox2 transcription in the absence of enhancer proximity. Elife 8 (2019). [DOI] [PMC free article] [PubMed] [Google Scholar]
- 65.Jia Z et al. Tandem CTCF sites function as insulators to balance spatial chromatin contacts and topological enhancer-promoter selection. Genome Biol 21, 75 (2020). [DOI] [PMC free article] [PubMed] [Google Scholar]
- 66.Cai HN & Shen P Effects of cis arrangement of chromatin insulators on enhancer-blocking activity. Science 291, 493–495 (2001). [DOI] [PubMed] [Google Scholar]
- 67.Muravyova E et al. Loss of insulator activity by paired Su(Hw) chromatin insulators. Science 291, 495–498 (2001). [DOI] [PubMed] [Google Scholar]
- 68.Rhee HS & Pugh BF Comprehensive genome-wide protein-DNA interactions detected at single-nucleotide resolution. Cell 147, 1408–1419 (2011). [DOI] [PMC free article] [PubMed] [Google Scholar]
- 69.Benabdallah NS et al. Decreased Enhancer-Promoter Proximity Accompanying Enhancer Activation. Mol Cell 76, 473–484 e477 (2019). [DOI] [PMC free article] [PubMed] [Google Scholar]
- 70.Hnisz D, Shrinivas K, Young RA, Chakraborty AK & Sharp PA A Phase Separation Model for Transcriptional Control. Cell 169, 13–23 (2017). [DOI] [PMC free article] [PubMed] [Google Scholar]
- 71.Chen H et al. Dynamic interplay between enhancer-promoter topology and gene activity. Nat Genet 50, 1296–1303 (2018). [DOI] [PMC free article] [PubMed] [Google Scholar]
Methods References
- 72.Dobin A et al. STAR: ultrafast universal RNA-seq aligner. Bioinformatics 29, 15–21 (2013). [DOI] [PMC free article] [PubMed] [Google Scholar]
- 73.van de Geijn B, McVicker G, Gilad Y & Pritchard JK WASP: allele-specific software for robust molecular quantitative trait locus discovery. Nat Methods 12, 1061–1063 (2015). [DOI] [PMC free article] [PubMed] [Google Scholar]
- 74.Juric I et al. MAPS: Model-based analysis of long-range chromatin interactions from PLAC-seq and HiChIP experiments. PLoS Comput Biol 15, e1006982 (2019). [DOI] [PMC free article] [PubMed] [Google Scholar]
- 75.Durand NC et al. Juicebox Provides a Visualization System for Hi-C Contact Maps with Unlimited Zoom. Cell Syst 3, 99–101 (2016). [DOI] [PMC free article] [PubMed] [Google Scholar]
Associated Data
This section collects any data citations, data availability statements, or supplementary materials included in this article.
Supplementary Materials
Data Availability Statement
All next-generation sequencing data are available under GEO accession GSE153403. Raw images of multiplexed FISH experiments and raw FACS data of specific mESC colonies are available upon request.