Abstract
Diabetic retinopathy is a chronic condition that causes vision loss if not detected early. In the early stage, it can be diagnosed with the aid of exudates which are called lesions. However, it is arduous to detect the exudate lesion due to the availability of blood vessels and other distractions. To tackle these issues, we proposed a novel exudates classification from the fundus image known as hybrid convolutional neural network (CNN)-based binary local search optimizer–based particle swarm optimization algorithm. The proposed method from this paper exploits image augmentation to enlarge the fundus image to the required size without losing any features. The features from the resized fundus images are extracted as a feature vector and fed into the feed-forward CNN as the input. Henceforth, it classifies the exudates from the fundus image. Further, the hyperparameters are optimized to reduce the computational complexities by utilization of binary local search optimizer (BLSO) and particle swarm optimization (PSO). The experimental analysis is conducted on the public ROC and real-time ARA400 datasets and compared with the state-of-art works such as support vector machine classifiers, multi-modal/multi-scale, random forest, and CNN for the performance metrics. The classification accuracy is high for the proposed work, and thus, our proposed outperforms all the other approaches.
Keywords: CNN, Exudates, PSO, Diabetic retinopathy, Binary local search optimization algorithm, GLCM
Introduction
Diabetic retinopathy [1] is an intimidating problem that usually causes vision loss and blindness among people with diabetes. This occurs due to infection of blood vessels in the region of light sensation layered tissue known as the retina. During the early stage, this diabetic retinopathy does not show any symptoms; nonetheless, some have little crucial issues like trouble in reading near and far away objects every then and now. At the critical stage, the blood vessels of the retina begin to bleed into the middle of the eye as gel-like fluid, a condition known as exudates [2]. As a result, you might have seen dark, floating spots or streaks that mimic cobwebs. In rare cases, the spot will heal on its own. However, it is ineluctable to treat this disease as early as possible to safeguard eyes from severe devastation.
The early recognition of this disease and further treatment using different modalities can lower the risk of vision loss. The adverse development of image processing [3] has been used for the detection and analysis of retinopathy more accurately as possible. Furthermore, the advent of digital retinal imaging has facilitated the rapid acquisition and interpretation of fundus images, quantitative investigation for filing, and evolution of retinopathy records. Diabetic retinopathy detection cannot be performed by a specific image processing till now. In the meanwhile, several studies have been conducted and validated regarding this field [4–17].
Images of retinal images may be taken by dilating (mydriatic) or non-dilating (non-mydriatic) the pupil [18]. Moreover, these images can be analyzed by professionally trained readers or centers. Subsequently, there are two types of exudates: (i) hard exudates and (ii) soft exudates [19]. The first one is the yellow spot that occurs in the retina [20], whereas the latter one is the white region which exhibits pale yellow edges. Hence, it is necessary to investigate the problems by automated computerized method [21, 22, 23].
The normal features of the retina can be given as optic disk, blood vessels, fovea, and macula [24], and neovascularization, exudates, hemorrhages, microaneurysms, and cotton wool spots are the abnormal features [25]. As a part of the investigation, the abnormal images are classified with the aid of feature derivation. Most often the derived features are incomplete, and sometimes it provides irrelevant data for classification purposes [26]. Of these one of the important features is the optic nerve head and can be derived, and it is usually distributed in the right or left side of the fundus images [27]. However, the other features such as macula and fovea are positioned along with the optic nerve head [28]. The shape of the ONH can be affected by the outgoing vessels [29]. Thus, the feature extraction becomes the crucial task in the classification of exudates.
Several research works have been conducted to extract the exact features to preserve the classification accuracy and also to predict the exudates. However, the optimized classification accuracy is yet to be obtained. Hence, we propose a novel method known as hybrid CNN-BLSO-based PSO algorithm which accurately classifies the exudates according to their types. The contributions of our works are enclosed below:
The feature vectors are extracted from the augmented images with gray-level co-occurrence matrix (GLCM) technique.
Then, the features of exudates are classified by the proposed hybrid CNN-BLSO-based PSO approach.
The rest of this article is organized as in “Review of Related Works”; the background of this article is analyzed with their merits and demerits. The proposed methodology is elucidated in “Proposed Approach.” The experimental part of this work is illustrated in “Experimental Analysis.” Finally, the article is concluded in “Conclusion and Future Work”.
Review of Related Works
The contour detection which is incorporated with the Mamdani-based fuzzy rules to detect the blood vessels in fundus retinal image has been developed by Orujov et al. [30]. They used contrast-limited adaptive histogram equalization (CLAHE) to enhance the green channel data input, and the noise was minimized by the median filter used. Consequently, edge detection has been performed by the Mamdani fuzzy rules which enhance the edge detection accuracy. Nonetheless, optimized detection is yet to be attained.
Meanwhile, Pathan et al. [31] proposed a novel method to segment the optic disc which excludes the blood vessel by accurate detection which has been achieved with the aid of a directional filter. On the other hand, a decision tree classifier is exploited to acquire the adaptive threshold value which can be used to recognize the contour of the optic disc. Thus, it provides efficient segmentation of fundus images. However, it is arduous to apply in real-time clinical applications.
AbdelMaksoud et al. [32] stated a novel technique known as the computer-aided diagnostic (CAD) method which utilizes the multi-label classification (MLC) to classify the fundus photography. The pre-processing of images was performed by histogram equalization which sustains the brightness and minimizes the noises. Following this, the segmentation of images was conducted to extract the features such as blood vessels, exudates, microaneurysms, and hemorrhages with the support of a gray-level co-occurrence matrix. Henceforth, the support vector machine (SVM) classifier is exploited to classify the normal and abnormal liver cells and hence improves the classification accuracy.
Meanwhile, this method has been tested for small datasets and has no details for large datasets. A convolutional neural network–based exudate detection method from the fundus image has been delineated by Khojasteh et al. [33]. High accuracy in the detection of exudate detection has been accomplished; nonetheless, it is inappropriate to detect other features like microaneurysms and hemorrhages. Moreover, Syed et al. [34] proposed a new automatic system to detect macular edema with the observation of exudates and maculae. The exudates were segmented by the utilization of SVM and various hybrid features.
The ensemble-based classifier along with bootstrapped decision tree for multiscale localization and segmentation of exudates has been proposed by Fraz et al. [35]. The exudates were derived with morphological reconstruction and Gabor filter, and the false-positive rates have been minimized with the application of contextual cues during the classification stage. However, this approach is limited to a small number of datasets. A deep convolutional neural network (DCNN) has been presented by Wang et al. [36] for hard exudate (HE) detection. A mathematical morphological approach was used to segment the HE precisely. Ridge regression–based feature fusion was used to analyze the features, and the perfect HE can be detected by the use of a random forest approach. However, it is difficult to detect other lesions such as hemorrhage and neovascularization.
Proposed Approach
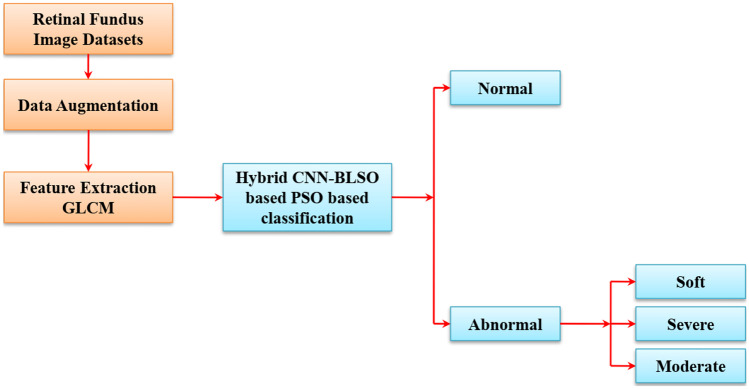
In proposed exudate classification on the fundus image method, we adopted GLCM for feature extraction and hybrid CNN-BLSO-based PSO for classification. The schematic structure of the proposed method is shown in Fig. 1.
Fig. 1.
Proposed methodology
Data Augmentation
The fundus images are smaller in size, and hence, it is ineluctable to widen the images. This can be carried out by utilizing label-preserving transformations, and this process is known as data augmentation. In our proposed method, we have taken translation, stretching, rotation, and flipping to the fundus images. The details are explained in Table 1. An example of data augmentation is depicted in Fig. 2. Following this is a feature extraction process which is elucidated in the following section.
Table 1.
Variables used for data augmentation
| Type of transformation | Explanation |
|---|---|
| Rotation | 0−360° |
| Flipping | 0 represents the image without flipping, and 1 denotes the image with flipping |
| Shearing | Shifting angle from −15 to 15° |
| Rescaling | Transforming the scale factor from to 1.6 |
| Translation | Shifting the pixels from −10 to 10 |
Fig. 2.
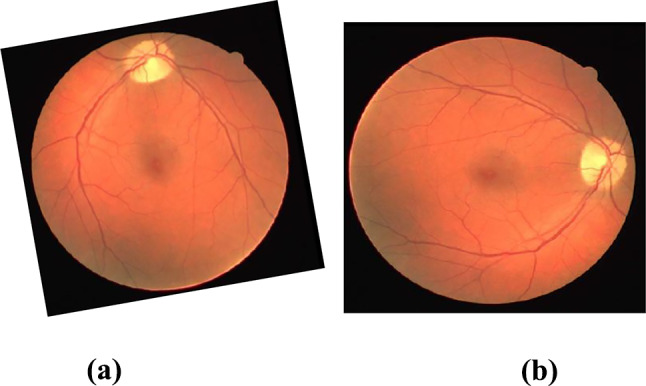
Illustration of data augmentation: a original image; b transformed image
Feature Extraction
The classification task performs precisely based on the recognition of feature vectors that are extracted from the images. Feature vectors are nothing but the numeric vectors that are used to denote the compact translation of the images. Moreover, the texture of normal and abnormal regions of the retina depicts transparently clear differences. In our proposed work, gray-level co-occurrence matrix [37] is adopted to perform the feature extraction of exudates from the fundus image. It is a perfect method to analyze the textures statistically since it provides complete data about the direction, neighborhood, and alteration in the amplitude of gray-level images. The respective GLCM for the image IF can be given as
| 1 |
The relative frequencies between the two pixels with the distance r can be represented as . The angle that falls under the gray level i and another gray level j is . The exudate textures are determined by deeming the four GLCM feature vectors such as angular second moment (ASM), entropy (E), contrast (C), and correlation (CR). The following equations describe the definition of the four GLCM feature vectors.
| 2 |
Here, is the normalized vector of and the total number of gray levels in the fundus images are denoted as G.
| 3 |
| 4 |
| 5 |
Here, , and
, and
Equation (3) is used to determine the texture uniformity of the fundus image and the thickness of the exudates. However, the squared sum of all the elements of the GLCM is determined as ASM and it is also known as energy. The ASM value depends on the thickness of the exudates; i.e., the value of ASM is high if the thickness of the exudates is higher and vice versa. The entropy E is used to determine the disarray of the fundus image matrix, and its value is maximum when the components of images are distributed similarly and low if it has low and high values of components.
The C (contrast) is the amount of local gray-level alteration in an image. This is also known as the moment of inertia and falls around the diagonal of the image matrix. Significantly, the gray-level linear dependencies in a fundus image can be estimated and are known as correlation (CR). However, it depicts the row degrees and columns of the GLCM which are related to each other.
Convolutional Neural Network-Based Exudate classification
The convolutional neural network (CNN) [38] is a feed-forward artificial neural network (ANN) in which the neurons are positioned in a way that they can be used to analyze the overlapping areas in the image field. They are usually used to learn the applications which have been inspired by the biological neural networks. It consists of convolution and pooling layers, and the convolutional layers are scattered along with pooling layers. Moreover, some of the last layers are connected fully with the 1D layer. However, the features of fundus images are mapped as a function f of mapping data a:
| 6 |
From the equation, each function f takes x as input and w represents the learning variable. D represents the depth of the CNN architecture. Significantly, each x can be represented as an M × N × K array. Meanwhile, the exudate features were converted as a binary form to subjugate the classification issues, and hence, the loss function of CNN can be defined as
| 7 |
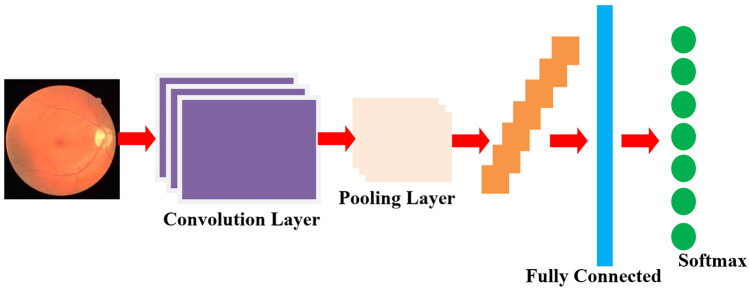
The total number of exudates samples is represented as n. is the true index of sample i. The loss function can be reduced by transforming the training issues into training a neural network. The schematic structure of the proposed CNN is shown in Fig. 3.
Fig. 3.
Schematic diagram of proposed CNN approach
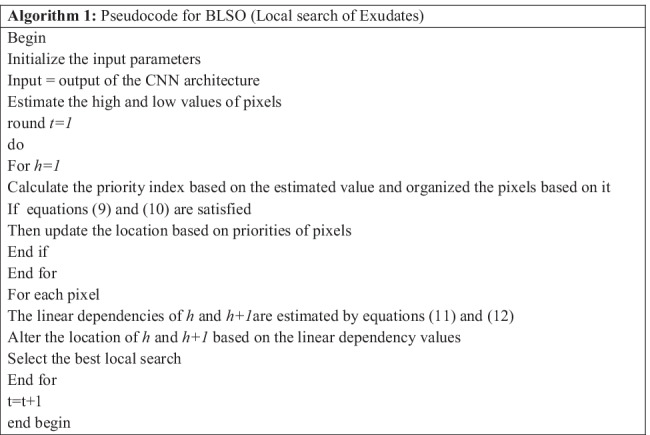
The input image vectors are given to the convolutional layers, and the filters in them produce the feature mapping by utilizing the local receptive field. Following this is a pooling layer, and it is used to simplify the output of the convolutional layer. Probably, there are two types of pooling: Max pooling and L2 pooling. The Max pooling follows the convolution with activation output of 2 × 2 input area, and L2 follows the square root of the sum of squares of the activation 2 × 2 region. Besides, these convolutional layers and pooling layers are connected by the fully connected layers. Due to the availability of more layers in CNN, the computational complexity increases with the classification task of exudates. Hence, it is necessary to optimize the hyperparameters that are present in the layers. Hence, we go for the BLSO algorithm for the local search of exudates and the PSO algorithm for the global search of feature vectors. The classification accuracy is improved by using this machine learning algorithm.
| 8 |
Binary Local Search Optimizer for Local Search of Exudates
The proposed binary local search optimizer (BLSO) [39] is a type of knowledge-based optimizer. This is applied in the binary matrix of the fundus images to search the local features of exudates. The framework of BLSO is simple, and hence, it can be easily adopted for classification purposes. While classifying the normal and abnormal features, this utilized algorithm shuffles the features based on the location priorities. Let h and h + 1 be the two adjacent binary features with consecutive priorities, and h has the highest priority.
denotes the binary form of feature vectors. denotes the mapping function with maximum features that are acquired from the ith sample. TD represents the total images in the datasets that are sampled at tth interval. If the above scenario is fulfilled, then the status of h and h + 1 are altered in the tth interval as following the below conditions:
| 9 |
| 10 |
Here, represents the time of ith pixel that shows a high value at tth interval. The minimum linear dependencies of the matrix of the ith sample can be denoted as . The minimum non-linear dependencies are denoted by . The features h and h + 1 update their location if the above-mentioned conditions are satisfied at tth interval. For an instance, if any one of the features does not follow the above condition, then both features are used to sustain their original location.
Henceforth, it is ineluctable to estimate the MU (linear dependencies) from t to for the h + 1 feature. Hence, the location of high priority has been changed with tth interval follows the following scenario,
| 11 |
If the above condition is satisfied, then the priority of the h + 1 is higher than the MU, and hence, its location is altered. Following this, the location of h at tth interval can be altered by following the below scenario.
| 12 |
The time of ith pixel that shows the low value at tth interval is denoted as . If the above scenarios are fulfilled, then the location of h is changed due to the high priority of pixel and updates the location and priorities at tth interval (). If the estimated fitness function is better than the existing one, then replace it with the newer one. The algorithm of BLSO algorithm is depicted in Algorithm 1. However, utilizing this approach, we cannot obtain the global best solution in the search space, since BLSO is applicable only for the local search of exudates features. Hence, we have taken PSO for the global searching of exudate features. The below section of this article elucidates the PSO algorithm.
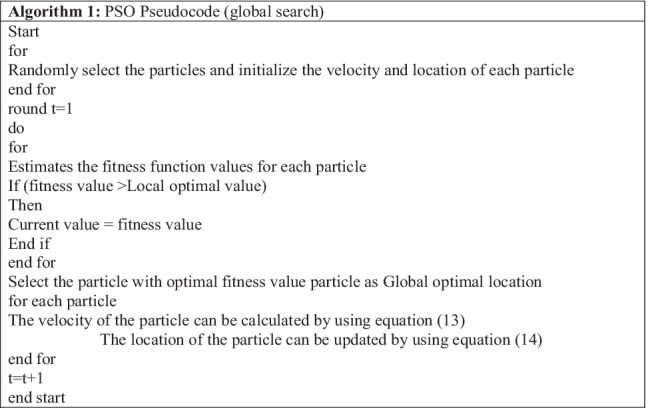
PSO Algorithm for Global Search of Exudates
For the global search of exudate feature vectors, we adopted the PSO algorithm [40, 41] which is based on the social characteristics of birds flocking, fish schooling, and swarm theory. Let the initial population of PSO as . The location of the particle which exhibits the candidate solution can be determined by the fitness function f. For the particular particle at the time interval t, the location and the velocity can be given as, and , respectively. Then, the estimation of global optimum solution (best solution) for the fitness function can be carried out as for the time interval t. Meanwhile, the information for the particle is received from the adjacent particles, i.e., . The PSO algorithm can be initialized by producing the arbitrary location for the population with the initial point of the region . The velocity values are usually initialized as ; nevertheless, they can also be initiated as zero or fewer values in order to avert the extinction of particles from the first iteration itself. The particles are used to upgrade its location until it reaches the convergence. The steps followed to upgrade the location, and velocities are listed below.
| 13 |
| 14 |
The inertial weight of the particle is indicated as w. represent the acceleration coefficients; and are the two non-diagonal matrices along with arbitrary numbers as the main diagonal entries. The arbitrary numbers used to fall under the time [0, 1] and both matrices are regenerated at the end of the iteration. Vector indicates the best solution found in the adjacent by any particle pj which can be expressed as follows:
| 15 |
Henceforth, suitable values are set to the variables w, and to circumvent the entering of infinite velocity. The values of acceleration constants are set as 0 to 4, and the velocity can be updated by following the below features. That can be utilized to produce the local characteristics of the swarm particles.
Inertia: It can be used to track the location of existing particle direction and avert the sudden change in direction (velocity) while in search space.
Social Component: It is utilized to denote the group norm that must be acquired, and the performance of particles is compared with the adjacent particle to acquire this.
Cognitive Component: It aids the particle to retain in the existing optimal solution
Proposed Hybrid CNN-BLSO-Based PSO
The proposed hybrid CNN-BLSO-based PSO algorithm follows 4 stages:
CNN training
BLSO and PSO training
Upgradation of CNN
Estimating the accuracy
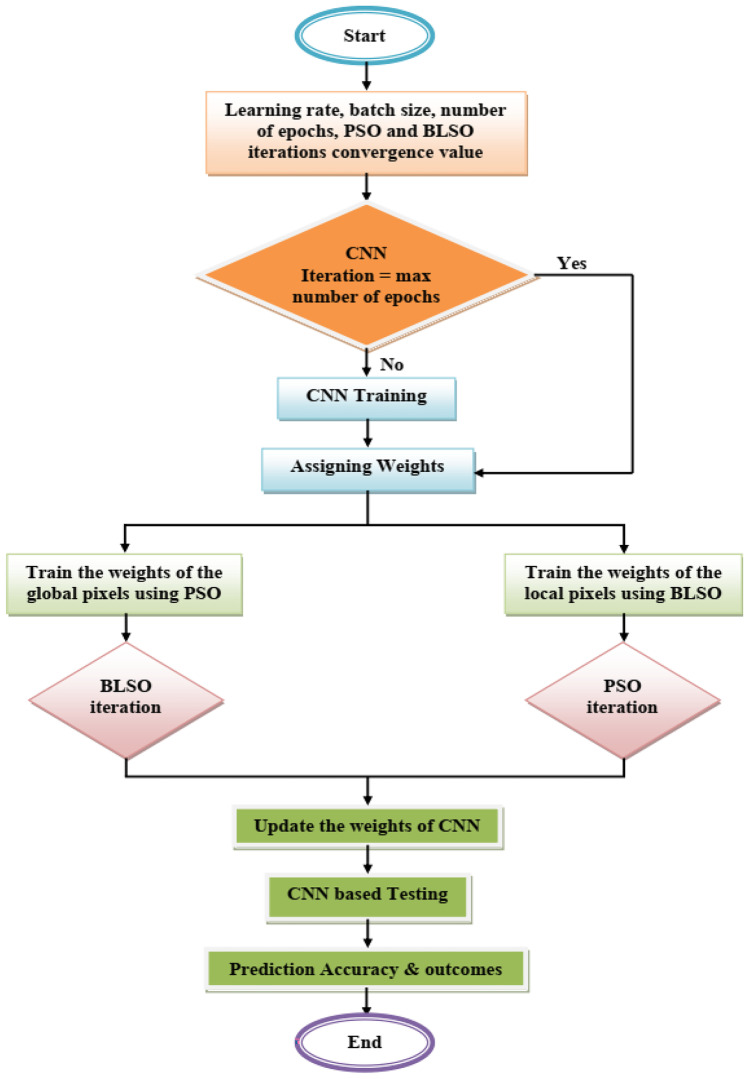
Stage 1: CNN Training: The training of CNN is performed based on the feed-forward technique which is used to connect the weights of the neural network.
Stage 2: BLSO and PSO training: These are conducted to optimize the weights of the neural network.
Stage 3: Upgradation of CNN: The CNN values are updated by utilizing the optimized weight that is acquired using BLSO and PSO.
Stage 4: Accuracy Estimation: The outcome that has been acquired from the above stage is the final accuracy, and hence, it is necessary to estimate the cost function for the same.
The main aim of this article is to enhance the exudate accuracy, the algorithm estimates the weight after CNN training, and then, the weights are optimized utilizing BLSO and PSO. Figure 4 illustrates the flow diagram of the proposed hybrid CNN-BSLO-based PSO algorithm.
Fig. 4.
Flow diagram of proposed hybrid CNN-BSLO-based PSO approach
Experimental Analysis
To analyze the proposed approach, we have taken the MATLAB simulator. The following section of this article reveals the datasets utilized and the performance metrics to analyze the performance metrics of the proposed method.
Experimental Dataset
The experimental analysis is conducted on the public dataset Retinopathy Online Challenge (ROC) [42] and real-time dataset gathered from the section of Diabetic Retinopathy, Aravind Eye Hospital- Chennai, Tamil Nadu, and named as ARA400. The public dataset consists of 200 color images, and the real-time dataset exhibits 400 fundus images that are acquired from 200 patients. The images are of 3072 × 2304 pixel sizes in JPEG format. These data are analyzed by two specialists from the Department of Ophthalmology and categorized as (i) healthy retina, (ii) microaneurysms, (iii) HE, (iv) exudates, (v) advanced DR disease, and (vi) PDR. The classifications of images are illustrated in Table 2.
Table 2.
Classifications of color and fundus images
| Types of DR | Number of images |
|---|---|
| Healthy | 207 |
| Microaneurysms | 78 |
| HE | 24 |
| Exudates | 56 |
| PDR | 18 |
| ADR disease | 17 |
| Total | 400 |
The specialist’s opinions about the patients are recorded in Table 3. The record holds two images of each patient (left and right). Based on the detected number of exudates, it is denoted as No DR, 1, 2, 3, etc.,
Table 3.
Specialist opinions about ARA400 datasheets
| Sl. no | Patient gender | Image ID | Specialist 1 | Specialist 2 | |||
|---|---|---|---|---|---|---|---|
| Right eye | Left eye | Right eye | Left eye | Right eye | Left eye | ||
| 1 | M | Image1_R | Image1_L | 2 | 1 | 3 | No DR |
| 2 | F | Image2_R | Image2_L | No DR | 2 | 2 | 2 |
| 3 | F | Image3_R | Image3_L | 3 | 1 | 3 | No DR |
| 4 | M | Image4_R | Image4_L | No DR | 3 | 3 | 3 |
| 5 | M | Image5_R | Image5_L | 1 | 2 | 1 | No DR |
Performance Analysis
The performance analysis of the proposed method is conducted based on the performance metrics such as false discovery rate, specificity, accuracy, positive predictive value, sensitivity, negative predictive value, false-positive rate, Matthews correlation coefficient, and false-negative rate. The resultant outcomes are compared with some of the existing works such as SVM classifiers [43], multi-modal/multi-scale (MMS) [44], random forest (RF) [45], and CNN [46]
-
Sensitivity
It is determined as the rate of exudates that are exactly classified from the fundus images. -
Specificity
It is defined as the rate at which the normal pixels from the fundus image are exactly classified. -
Accuracy
Accuracy can be defined as the rate of correctly predicted exudates from the total number of datasets examined. -
Positive Predictive Value
It is defined as the probability that subjects with a truly classified fundus image actually having the disease.
-
Negative Predictive Value
It is defined as the probability at which the negatively classified fundus image actually does not exhibit the disease.
-
False-Positive Rate
A false-positive rate is where the classification result shows positive instead of negative results. -
False-Negative Rate
A false-negative rate is where the classification result shows negative instead of positive results. False Discovery Rate
The false discovery rate (FDR) is the expected proportion of errors, i.e., ignoring the null hypothesis. In other words, it can be represented as a false positive.
-
Matthews correlation coefficient
This is the best performance metric for the classification of a binary matrix. It can be given as
The performance analysis of our proposed method based on sensitivity, specificity, and accuracy for two types of datasets (ROC and ARA400), and the comparative study is displayed in Tables 4 and 5, respectively. From Table 4, the sensitivity of the SVM classifier is 89.37%, MMS is 90.46%, RF exhibits 93.54%, and the CNN provides 91.23%. Dramatically our proposed method shows 98.56%. Meanwhile, the specificity of the prior works is SVM classifier shows 84.09%, MMS holds 84.25%, RF possesses 88.47%, and CNN has 89.30%. For specificity, also, our method shows better results. Subsequently, the accuracy of our proposed method also high when compared to other works.
Table 4.
Performance analysis for the ROC dataset
| Methods | Sensitivity (%) | Specificity (%) | Accuracy (%) |
|---|---|---|---|
| SVM classifiers | 89.37 | 84.09 | 83.27 |
| MMS | 90.46 | 84.25 | 85.74 |
| RF | 93.54 | 88.47 | 92.30 |
| CNN | 91.23 | 89.30 | 94.65 |
| HCNN-BLSO-PSO | 98.56 | 92.54 | 97.20 |
Table 5.
Performance analysis for the ARA400 dataset
| Methods | Sensitivity (%) | Specificity (%) | Accuracy (%) |
|---|---|---|---|
| SVM classifiers | 89.24 | 84.56 | 84.12 |
| MMS | 91.87 | 86.54 | 86.11 |
| RF | 92.09 | 88.87 | 91.25 |
| CNN | 93.43 | 91.43 | 95.00 |
| HCNN-BLSO-PSO | 98.99 | 91.87 | 97.67 |
The performance analysis for the ARA400 dataset is shown in Table 5. For all performance metrics such as sensitivity, specificity, and accuracy, our proposed method indisputably shows better results than the other approaches. The sensitivity, specificity, and accuracy of our proposed method are 98.99%, 91.87%, and 97.67%, respectively. Other approaches show lesser results than the proposed method that as the specificity of RF is 88.87%, and the accuracy of the CNN approach is 95.00%.
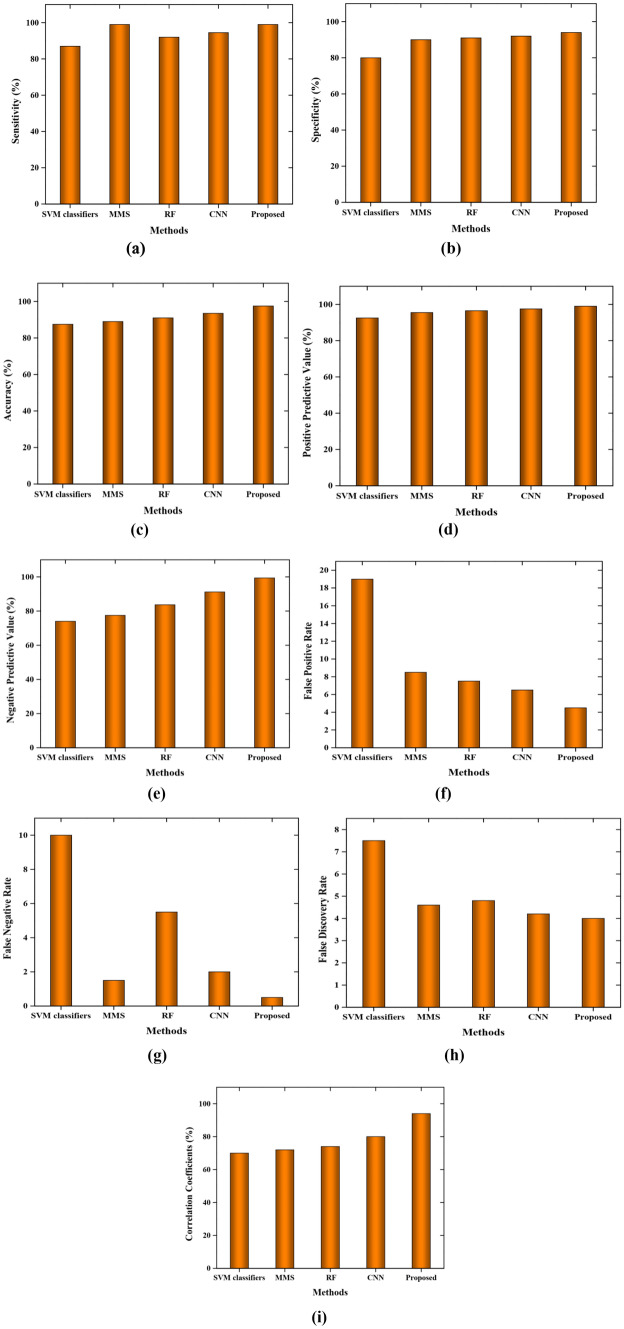
Figure 5 shows the performance analysis of our proposed method with the other existing approaches in terms of false discovery rate, specificity, accuracy, positive predictive value, sensitivity, negative predictive value, false-positive rate, Matthews correlation coefficient, and false-negative rate. From Fig. 5, it is transparently known that the proposed hybrid CNN-based BLSO based PSO depicts better classification accuracy than other approaches. Figure 5a illustrates the performance analysis in terms of sensitivity. The sensitivity of the proposed work is 99.07%, and MMS shows more or less the same value. Other approaches show lesser values of sensitivity.
Fig. 5.
Performance analysis based on a sensitivity, b specificity, c accuracy, d positive predictive value, e negative predictive value, f false positive rate, g false-negative rate, h false discovery rate, i Matthews correlation coefficient
Figure 5b shows performance analysis in terms of specificity. From the figure, it is indisputably noted that the SVM classifier depicts 79%, MMS shows 91%, RF method depicts 92%, CNN approach shows 93%, and our proposed approach depicts 96% of specificity. In terms of accuracy, our hybrid CNN-based BLSO-based PSO approach depicts 98%, and other prior methods SVM, MMS, RF, and CNN show 86%, 91%, 92%, and 93% correspondingly. As shown in Fig. 5c, our proposed method outperforms all other methods in terms of accuracy.
Figure 5d depicts the performance analysis in terms of positive predictive value for our proposed and other prior works. From Fig. 5d, it is observed that the existing works SVM, MMS, RF, and CNN depict 92%, 94%, 95%, and 96%, respectively, whereas our proposed work shows 98% which is higher in all aspects. In terms of Negative predictive value, our proposed work shows a better result that is 99% and other state-of-art works show 90%, 85%, 76%, and 74% that are lesser than the proposed work as shown in Fig. 5e.
Figure 5f illustrates the performance analysis based on a false positive rate. The FPR of our proposed work is 4.28 which is less than the other approaches such as SVM, MMS, RF, and CNN 19, 9.2, 7.54, and 6.33 correspondingly. Moreover, false-negative rate has been obtained as 0.82 for the proposed approach and 10 for the SVM classifier, 1.8 for the MMS method, 5.2 for the RF approach, and 2.34 for the CNN approach which has been displayed in Fig. 5g.
From Fig. 5h, it is evident that the proposed approach shows a 3.9 false discovery rate and other approaches show 4.4, 5.2, 4.8, and 7.6 for the CNN, RF, MMS, and SVM classifier, respectively. Thus, the probability of false detection is lesser and shows better results. The Matthews correlation coefficient (MCC) is illustrated in Fig. 5i. For our proposed work, it shows 96% and the CNN depicts 80%, the RF method shows 78%, MMS shows 77%, and the SVM classifier shows 75%. Hence, the detection of exudates from the fundus images is better for the proposed approach.
Conclusion and Future Work
This article proposed a novel exudates classification approach from the fundus images known as the hybrid CNN-BLSO-PSO algorithm. In this article, the fundus images were resized to attain the required format, and the feature vectors were extracted by utilizing the GLCM technique. Subsequently, the extracted features were given as input for the CNN architecture to classify the exudates. However, the availability of more CNN layers increases the computational complexities, and hence, the hyperparameters were optimized with the inclusion of machine learning approaches such as BSLO and PSO algorithm. The adopted BSLO algorithm has been used to search the local pixel, and the global pixels were searched by the taken PSO algorithm. The experimental analysis on the public ROC and real-time ARA400 datasets depicted that the proposed approach outperforms all the existing approaches such as SVM classifiers, MMS, RF, and CNN for the performance metrics such as sensitivity, specificity, accuracy, FDR, and MCC.
In future work, we focus to modify our approach for the detection of exudates from the large-scale dataset.
Declarations
Informed Consent
Informed consent was obtained from all individual participants included in the study.
Human and Animal Rights
This article does not contain any studies with human or animal subjects performed by any of the authors.
Conflict of Interest
The authors declare no competing interests.
Footnotes
Publisher's Note
Springer Nature remains neutral with regard to jurisdictional claims in published maps and institutional affiliations.
References
- 1.Garg Seema, Davis Richard M. Diabetic retinopathy screening update. Clinical diabetes. 2009;27(4):140–145. [Google Scholar]
- 2.Zhang, Xiwei, Guillaume Thibault, Etienne Decencière, Beatriz Marcotegui, Bruno Laÿ, Ronan Danno, Guy Cazuguel et al. "Exudate detection in color retinal images for mass screening of diabetic retinopathy." Medical image analysis 18, no. 7 (2014): 1026-1043. [DOI] [PubMed]
- 3.Khojasteh, Parham, Leandro AparecidoPassos Júnior, Tiago Carvalho, Edmar Rezende, Behzad Aliahmad, Joao Paulo Papa, and Dinesh Kant Kumar. "Exudate detection in fundus images using deeply-learnable features." Computers in biology and medicine 104 (2019): 62-69. [DOI] [PubMed]
- 4.Sundararaj V, Muthukumar S, Kumar RS. An optimal cluster formation based energy efficient dynamic scheduling hybrid MAC protocol for heavy traffic load in wireless sensor networks. Computers & Security. 2018;77:277–288. doi: 10.1016/j.cose.2018.04.009. [DOI] [Google Scholar]
- 5.Sundararaj V. An efficient threshold prediction scheme for wavelet based ECG signal noise reduction using variable step size firefly algorithm. International Journal of Intelligent Engineering and Systems. 2016;9(3):117–126. doi: 10.22266/ijies2016.0930.12. [DOI] [Google Scholar]
- 6.Sundararaj V. Optimised denoising scheme via opposition-based self-adaptive learning PSO algorithm for wavelet-based ECG signal noise reduction. International Journal of Biomedical Engineering and Technology. 2019;31(4):325. doi: 10.1504/IJBET.2019.103242. [DOI] [Google Scholar]
- 7.Sundararaj V, Anoop V, Dixit P, Arjaria A, Chourasia U, Bhambri P, MR, Rejeesh. and Regu Sundararaj, CCGPA-MPPT: Cauchy preferential crossover-based global pollination algorithm for MPPT in photovoltaic system. Progress in Photovoltaics: Research and Applications. 2020;28(11):1128–1145. doi: 10.1002/pip.3315. [DOI] [Google Scholar]
- 8.Rejeesh MR, Thejaswini P. MOTF: Multi-objective optimal trilateral filtering based partial moving frame algorithm for image denoising. Multimedia Tools and Applications. 2020;79(37):28411–28430. doi: 10.1007/s11042-020-09234-5. [DOI] [Google Scholar]
- 9.Kavitha, D. and Ravikumar, S., 2021. IOT and context-aware learning-based optimal neural network model for real‐time health monitoring. Transactions on Emerging Telecommunications Technologies, 32(1), p.e4132.
- 10.Sundararaj, V. and Selvi, M., 2021. Opposition grasshopper optimizer based multimedia data distribution using user evaluation strategy. Multimedia Tools and Applications, 80(19), pp.29875-29891.
- 11.Hassan BA (2020) CSCF: a chaotic sine cosine firefly algorithm for practical application problems. Neural Comput Appl 1–20
- 12.Jose, J., Gautam, N., Tiwari, M., Tiwari, T., Suresh, A., Sundararaj, V. and Rejeesh, M.R., 2021. An image quality enhancement scheme employing adolescent identity search algorithm in the NSST domain for multimodal medical image fusion. Biomedical Signal Processing and Control, 66, p.102480.
- 13.Haseena KS, Anees S, Madheswari N. Power optimization using EPAR protocol in MANET. International Journal of Innovative Science, Engineering & Technology. 2014;6:430–436. [Google Scholar]
- 14.Gowthul Alam MM, Baulkani S. Local and global characteristics-based kernel hybridization to increase optimal support vector machine performance for stock market prediction. Knowl Inf Syst. 2019;60(2):971–1000. doi: 10.1007/s10115-018-1263-1. [DOI] [Google Scholar]
- 15.Gowthul Alam MM, Baulkani S. Reformulated query-based document retrieval using optimised kernel fuzzy clustering algorithm. Int J Bus Intell Data Min. 2017;12(3):299. [Google Scholar]
- 16.Gowthul Alam MM, Baulkani S. Geometric structure information based multi-objective function to increase fuzzy clustering performance with artificial and real-life data. Soft Comput. 2019;23(4):1079–1098. doi: 10.1007/s00500-018-3124-y. [DOI] [Google Scholar]
- 17.Nisha S, Madheswari AN. Secured authentication for internet voting in corporate companies to prevent phishing attacks. International Journal of Emerging Technology in Computer Science & Electronics (IJETCSE) 2016;22(1):45–49. [Google Scholar]
- 18.Privitera Claudio M, Renninger Laura W, Carney Thom, Klein Stanley, Aguilar Mario. Pupil dilation during visual target detection. Journal of Vision. 2010;10(10):3–3. doi: 10.1167/10.10.3. [DOI] [PubMed] [Google Scholar]
- 19.Esmann V, Lundbaek K, Madsen PH. Types of exudates in diabetic retinopathy. Acta Medica Scandinavica. 1963;174(3):375–384. doi: 10.1111/j.0954-6820.1963.tb07936.x. [DOI] [PubMed] [Google Scholar]
- 20.Gregory-Evans K. A review of diseases of the retina for neurologists. Handbook of Clinical Neurology. 2021;178:1–11. doi: 10.1016/B978-0-12-821377-3.00001-5. [DOI] [PubMed] [Google Scholar]
- 21.Hammer, Jon David, Henry Nguyen, Jacqueline Palmer, Sarah Rowlinson, and Swati Agarwal-Sinha. "Computerized analysis of retinal vascular growth following intravitreal bevacizumab monotherapy in retinopathy of prematurity until the age of three years." Investigative Ophthalmology & Visual Science 62, no. 8 (2021): 3242-3242.
- 22.Manikandan N., Pravin A. Hybrid resource allocation and task scheduling scheme in cloud computing using optimal clustering techniques. International Journal of Services Operations and Informatics. 2019;10(2):104. doi: 10.1504/IJSOI.2019.103403. [DOI] [Google Scholar]
- 23.Nanjappan Manikandan, Natesan Gobalakrishnan, Krishnadoss Pradeep. An Adaptive Neuro-Fuzzy Inference System and Black Widow Optimization Approach for Optimal Resource Utilization and Task Scheduling in a Cloud Environment. Wireless Personal Communications. 2021;121(3):1891–1916. doi: 10.1007/s11277-021-08744-1. [DOI] [Google Scholar]
- 24.Wang, Jie, Chaoliang Zhong, Cheng Feng, Jun Sun, and Yasuto Yokota. "Feature Disentanglement For Cross-Domain Retina Vessel Segmentation." In 2021 IEEE International Conference on Image Processing (ICIP), pp. 26-30. IEEE, 2021.
- 25.Ashame, Laurine A., Sherin M. Youssef, and Salema F. Fayed. "Abnormality Detection in Eye Fundus Retina." In 2018 International Conference on Computer and Applications (ICCA), pp. 285-290. IEEE, 2018.
- 26.Tang Li, Niemeijer Meindert, Reinhardt Joseph M, Garvin Mona K, Abramoff Michael D. Splat feature classification with application to retinal hemorrhage detection in fundus images. IEEE Transactions on Medical Imaging. 2012;32(2):364–375. doi: 10.1109/TMI.2012.2227119. [DOI] [PubMed] [Google Scholar]
- 27.Deka, Dharitri, Jyoti Prakash Medhi, and S. R. Nirmala. "Detection of macula and fovea for disease analysis in color fundus images." In 2015 IEEE 2nd International Conference on Recent Trends in Information Systems (ReTIS), pp. 231-236. IEEE, 2015.
- 28.GeethaRamani R, Balasubramanian L. Macula segmentation and fovea localization employing image processing and heuristic based clustering for automated retinal screening. Computer methods and programs in biomedicine. 2018;160:153–163. doi: 10.1016/j.cmpb.2018.03.020. [DOI] [PubMed] [Google Scholar]
- 29.Lee, Kyoung Min, Sun-Won Park, Martha Kim, Sohee Oh, and Seok Hwan Kim. "Relationship between Three-Dimensional Magnetic Resonance Imaging Eyeball Shape and Optic Nerve Head Morphology." Ophthalmology 128, no. 4 (2021): 532-544. [DOI] [PubMed]
- 30.Orujov, F., RytisMaskeliūnas, RobertasDamaševičius, and W. Wei. "Fuzzy based image edge detection algorithm for blood vessel detection in retinal images." Applied Soft Computing 94 (2020): 106452.
- 31.Pathan Sumaiya, Kumar Preetham, Pai Radhika, Bhandary Sulatha V. Automated detection of optic disc contours in fundus images using decision tree classifier. Biocybernetics and Biomedical Engineering. 2020;40(1):52–64. doi: 10.1016/j.bbe.2019.11.003. [DOI] [Google Scholar]
- 32.AbdelMaksoud, Eman, Sherif Barakat, and Mohammed Elmogy. "A comprehensive diagnosis system for early signs and different diabetic retinopathy grades using fundus retinal images based on pathological changes detection." Computers in Biology and Medicine 126 (2020): 104039. [DOI] [PubMed]
- 33.Khojasteh, Parham, Behzad Aliahmad, and Dinesh Kant Kumar. "A novel color space of fundus images for automatic exudates detection." Biomedical Signal Processing and Control 49 (2019): 240-249.
- 34.Syed, Adeel M., M. Usman Akram, Tahir Akram, Muhammad Muzammal, Shehzad Khalid, and Muazzam Ahmed Khan. "Fundus images-based detection and grading of macular edema using robust macula localization." IEEE Access 6 (2018): 58784-58793.
- 35.Fraz, M. Moazam, Waqas Jahangir, Saqib Zahid, Mian M. Hamayun, and Sarah A. Barman. "Multiscale segmentation of exudates in retinal images using contextual cues and ensemble classification." Biomedical Signal Processing and Control 35 (2017): 50-62.
- 36.Wang, Hui, Guohui Yuan, Xuegong Zhao, Lingbing Peng, Zhuoran Wang, Yanmin He, Chao Qu, and Zhenming Peng. "Hard exudate detection based on deep model learned information and multi-feature joint representation for diabetic retinopathy screening." Computer methods and programs in biomedicine 191 (2020): 105398. [DOI] [PubMed]
- 37.Ou Xiang, Pan Wei, Xiao Perry. In vivo skin capacitive imaging analysis by using grey level co-occurrence matrix (GLCM) International journal of pharmaceutics. 2014;460(1–2):28–32. doi: 10.1016/j.ijpharm.2013.10.024. [DOI] [PubMed] [Google Scholar]
- 38.Xu Kele, Feng Dawei, Mi Haibo. Deep convolutional neural network-based early automated detection of diabetic retinopathy using fundus image. Molecules. 2017;22(12):2054. doi: 10.3390/molecules22122054. [DOI] [PMC free article] [PubMed] [Google Scholar]
- 39.Dhaliwal, Jatinder Singh, and J. S. Dhillon. "A synergy of binary differential evolution and binary local search optimizer to solve multi-objective profit based unit commitment problem." Applied Soft Computing 107 (2021): 107387.
- 40.Wang Dongshu, Tan Dapei, Liu Lei. Particle swarm optimization algorithm: an overview. Soft Computing. 2018;22(2):387–408. doi: 10.1007/s00500-016-2474-6. [DOI] [Google Scholar]
- 41.Agarwalla Prativa, Mukhopadhyay Sumitra. Efficient player selection strategy based diversified particle swarm optimization algorithm for global optimization. Information Sciences. 2017;397:69–90. doi: 10.1016/j.ins.2017.02.027. [DOI] [Google Scholar]
- 42.https://ieee-dataport.org/open-access/diabetic-retinopathy-fundus-imagedatasetagar300
- 43.Long, Shengchun, Xiaoxiao Huang, Zhiqing Chen, ShahinaPardhan, and Dingchang Zheng. "Automatic detection of hard exudates in color retinal images using dynamic threshold and SVM classification: algorithm development and evaluation." BioMed research international 2019 (2019). [DOI] [PMC free article] [PubMed]
- 44.Wisaeng Kittipol, Sa-Ngiamvibool Worawat. Exudates detection using morphology mean shift algorithm in retinal images. IEEE Access. 2019;7:11946–11958. doi: 10.1109/ACCESS.2018.2890426. [DOI] [Google Scholar]
- 45.Pratheeba, C., and N. Nirmal Singh. "A Novel Approach for Detection of Hard Exudates Using Random Forest Classifier." Journal of medical systems 43, no. 7 (2019): 1-16. [DOI] [PubMed]
- 46.Tan JH, Fujita H, Sivaprasad S, Bhandary SV, Rao AK, Chua KC, Acharya UR. Automated segmentation of exudates, haemorrhages, microaneurysms using single convolutional neural network. Information sciences. 2017;420:66–76. doi: 10.1016/j.ins.2017.08.050. [DOI] [Google Scholar]


