Abstract
Homologous recombination (HR) repairs DNA double-strand breaks (DSBs) in the S and G2 phases of the cell cycle1–3. Several HR proteins are preferentially recruited to DSBs at transcriptionally active loci4–10, but how transcription promotes HR is poorly understood. Here we develop an assay to assess the effect of local transcription on HR. Using this assay, we find that transcription stimulates HR to a substantial extent. Tethering RNA transcripts to the vicinity of DSBs recapitulates the effects of local transcription, which suggests that transcription enhances HR through RNA transcripts. Tethered RNA transcripts stimulate HR in a sequence- and orientation-dependent manner, indicating that they function by forming DNA–RNA hybrids. In contrast to most HR proteins, RAD51-associated protein 1 (RAD51AP1) only promotes HR when local transcription is active. RAD51AP1 drives the formation of R-loops in vitro and is required for tethered RNAs to stimulate HR in cells. Notably, RAD51AP1 is necessary for the DSB-induced formation of DNA–RNA hybrids in donor DNA, linking R-loops to D-loops. In vitro, RAD51AP1-generated R-loops enhance the RAD51-mediated formation of D-loops locally and give rise to intermediates that we term ‘DR-loops’, which contain both DNA–DNA and DNA–RNA hybrids and favour RAD51 function. Thus, at DSBs in transcribed regions, RAD51AP1 promotes the invasion of RNA transcripts into donor DNA, and stimulates HR through the formation of DR-loops.
The direct-repeat GFP (DR-GFP) reporter is widely used to measure HR efficiency at an I-SceI-generated DSB11. In the DR-GFP assay, the repaired GFP gene has to be transcriptionally active to turn cells green, precluding the use of this reporter to study the effect of local transcription on HR.
Transcription stimulates HR at DR-GFP
To investigate how local transcription regulates HR, we replaced the constitutive promoter of sceGFP with a tetracycline-inducible (Tet-On) promoter (Fig. 1a). We confirmed that GFP+ cells were only generated when GFP was transcriptionally active (by addition of doxycycline) (Extended Data Fig. 1a). To measure HR independently of GFP transcription, we used specific primers and quantitative PCR (qPCR) to directly quantify the levels of repair product (Fig. 1a, Extended Data Fig. 1b). When sceGFP was transcriptionally active, the repair product detected by qPCR correlated with GFP+ cells in cell populations with different levels of HR activity (Fig. 1b, Extended Data Fig. 1c). Notably, when sceGFP was transcriptionally inactive, qPCR still detected repair product despite the lack of GFP+ cells (Extended Data Fig. 1b). Transcription of sceGFP did not affect the I-SceI-mediated formation of DSBs (Fig. 1c, Extended Data Fig. 1d, e). However, the levels of repair product were increased by around 70% in the transcriptionally active state in multiple clones carrying the Tet-DR-GFP reporter (Fig. 1d, Extended Data Fig. 1f). Thus, although local transcription is not essential for HR, it markedly enhances HR.
Fig. 1 |. HR is stimulated by local transcription.
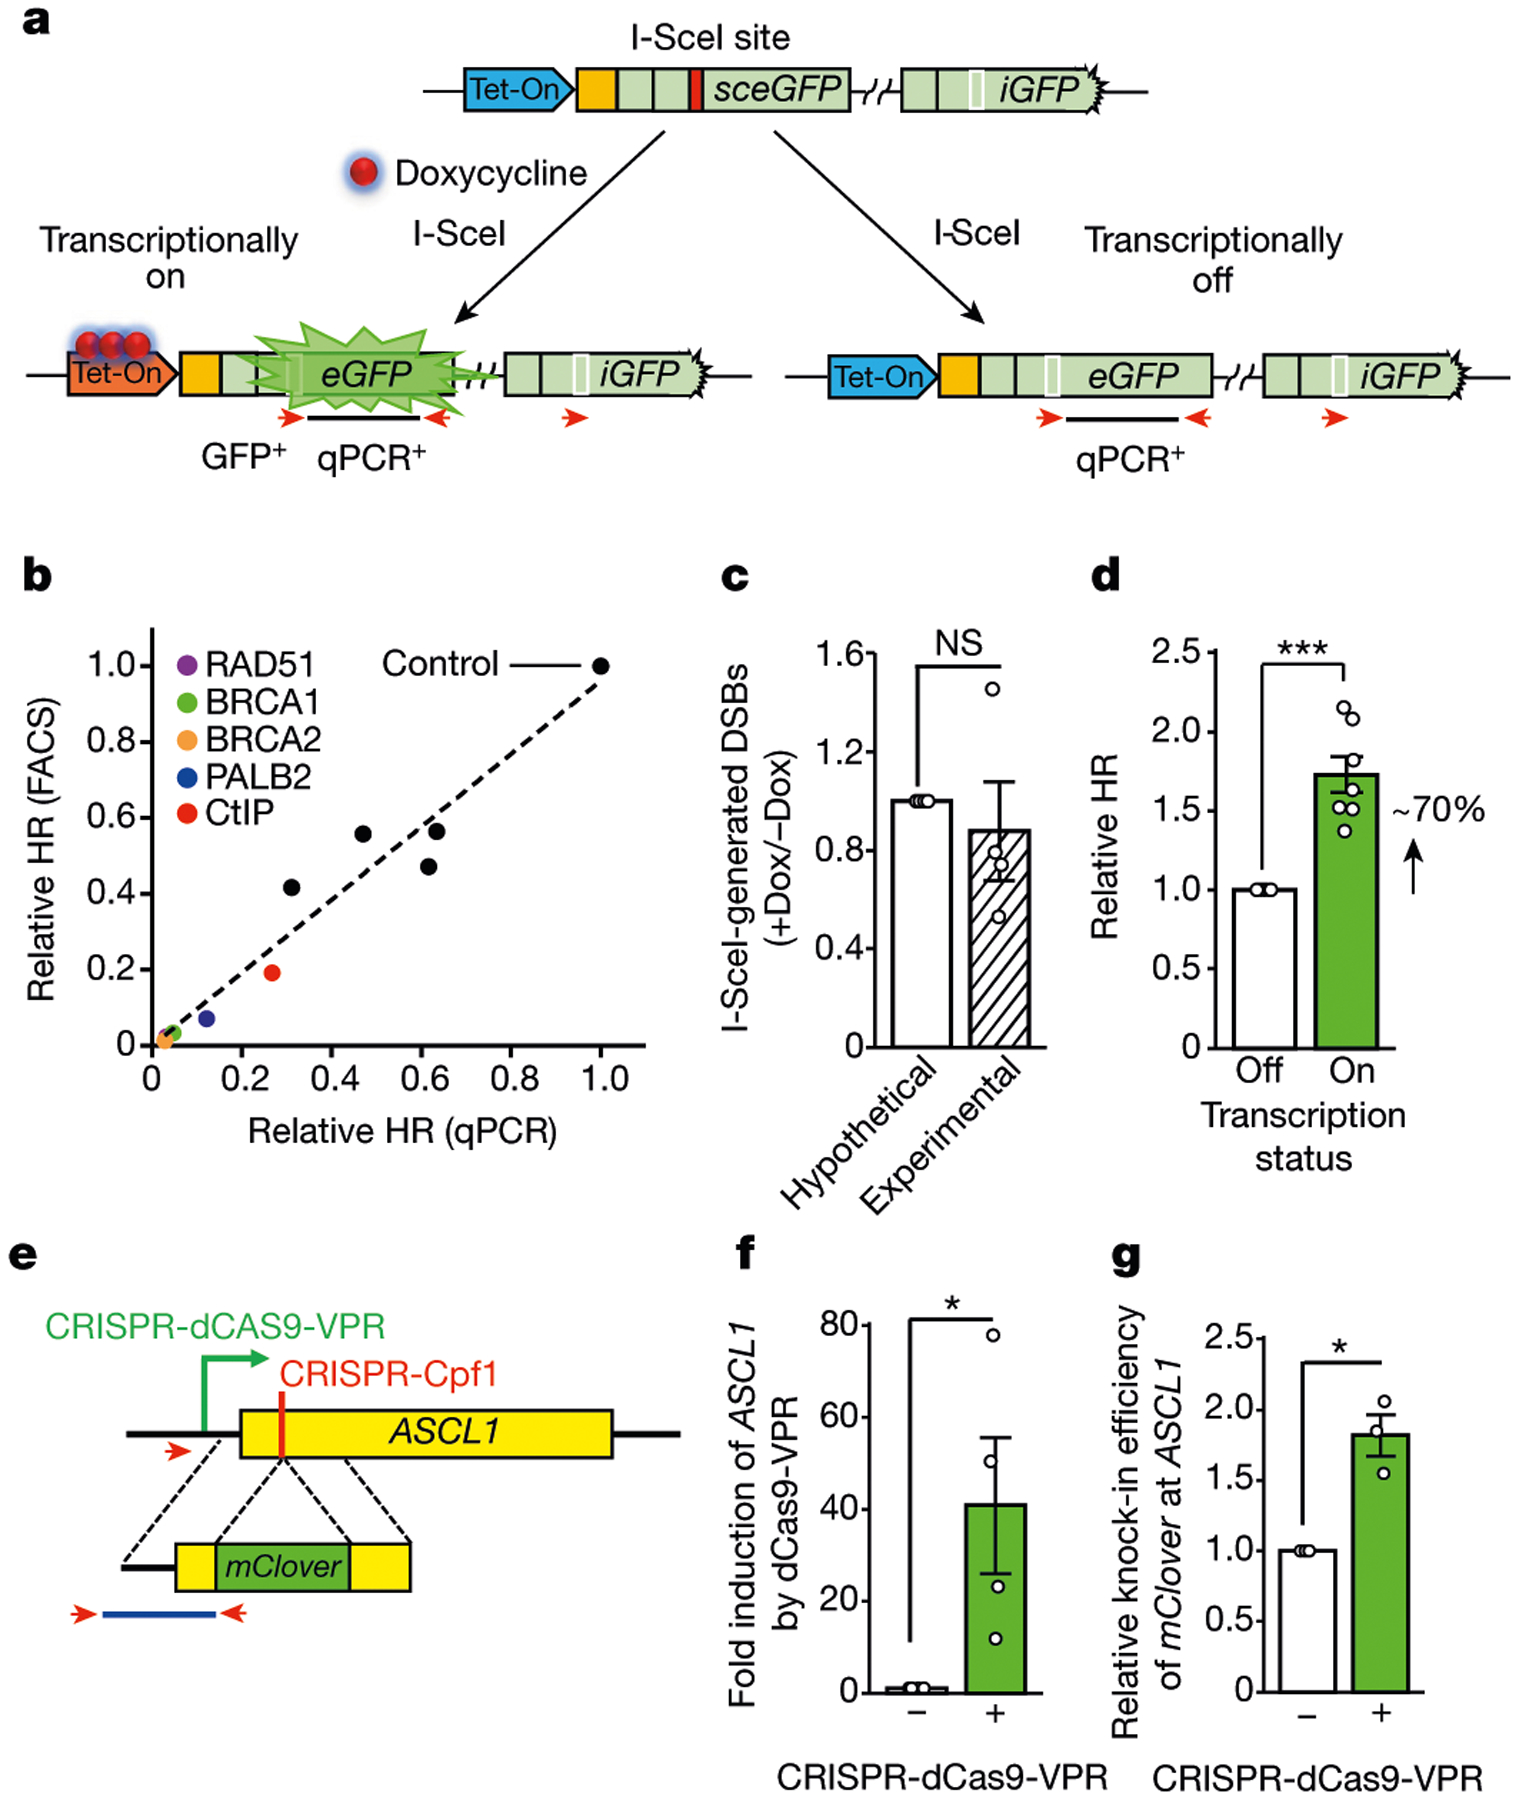
a, Schematic of the Tet-DR-GFP reporter. The coding and 5′ untranslated regions of GFP are in light green. A unique sequence upstream of sceGFP is in orange. A Tet-On promotor (blue) is upstream of sceGFP. After the I-SceI site (red box) is repaired, the wild-type eGFP sequence (white box) is restored. The repair product is detected by qPCR using specific primers (red arrows). b, Spearman correlation between qPCR- and fluorescence-activated cell sorting (FACS)-based HR assays (R = 0.99, P < 0.0001). Each dot represents a cell population depleted of an HR factor (Extended Data Fig. 1c). c, DNA fragments containing I-SceI-generated DNA ends were captured with biotinylated complementary oligos and quantified by qPCR. The ratio of DSB levels in samples without doxycycline (−Dox) and with doxycycline (+Dox) was determined. Data are mean ± s.e.m. (n = 4 independent experiments). NS, not significant (P ≥ 0.05) (two-sided Student’s t test; P = 0.59). d, HR efficiency was measured by qPCR in transcriptionally on and off states (+Dox and −Dox, respectively). The HR efficiency in −Dox is 1. Data are mean ± s.e.m. (n = 7 independent experiments). ***P <0.001 (two-sided Student’s t test; P = 0.0007). e, Schematic of the HR assay using the ASCL1 gene. CRISPR-dCas9-VPR activates ASCL1 transcription. CRISPR-Cpf1 generates a DSB near the 5′ end of the ASCL1 coding region (yellow). The homologous sequences flanking mClover are bracketed by dotted lines. The knock-in of mClover to ASCL1 was quantified by qPCR using specific primers (red arrowheads). f, Transcriptional activation of ASCL1 by CRISPR-dCas9-VPR. The level of ASCL1 mRNA in the absence of CRISPR-dCas9-VPR is 1. Data are mean ± s.e.m. (n = 4 independent experiments). *P < 0.05 (one-sided Student’s t test; P = 0.037). g, Relative knock-in efficiency of mClover at ASCL1 with or without CRISPR-dCas9-VPR. Data are mean ± s.e.m. (n = 3 independent experiments). *P < 0.05 (two-sided Student’s t test; P = 0.031).
Transcription stimulates HR at ASCL1
Next we analysed the effect of transcription on HR at an endogenous gene. ASCL1 is inactive in non-neuronal cells. Using CRISPR-Cpf112, we generated a DSB near the 5′ end of the ASCL1 coding region in HEK293T cells (Fig. 1e). A DNA fragment containing the mClover gene flanked by homologous sequences was introduced to cells13. Successful HR generates an mClover-ASCL1 fusion gene that can be quantified by qPCR. To activate ASCL1 transcription, we used nuclease-dead CRISPR-dCas9 to target the tripartite transcription activator VP64–p65–Rta (VPR) to the ASCL1 promoter14 (Fig. 1e, f). Activation of ASCL1 increased HR by around 80% (Fig. 1g), similar to the Tet-DR-GFP reporter. Notably, even when ASCL1 was activated, its expression was still lower than most endogenous genes (Extended Data Fig. 1g), suggesting that physiological transcription can stimulate HR. These results show that Tet-DR-GFP faithfully recapitulates the effect of local transcription on HR.
Stimulation of HR by RNA tethering
To understand how local transcription promotes HR, we asked whether transcription or its product—RNA transcript—is important. We kept the Tet-DR-GFP reporter transcriptionally inactive, but generated a GFP-derived fusion RNA from a plasmid (Fig. 2a). The fusion RNA (RNAg-t-GFP) contains guide RNA (gRNA), trans-activating CRISPR RNA (tracrRNA) and a 120-nt GFP sequence that flanks the I-SceI site. Notably, when RNAg-t-GFP was tethered to a unique sequence 5′ to the DSB by dCas9, HR efficiency was restored to the level in the transcriptionally on state (Fig. 2b). No restoration of HR was observed without the U6 promoter in the plasmid, showing that the RNA transcript is required. Deletion of gRNA or the GFP sequence from RNAg-t-GFP also abolished its ability to restore HR. The level of restored HR did not increase further when local transcription was turned on (Extended Data Fig. 2a), suggesting that the tethered RNA and local transcription promote HR through the same mechanism. Thus, the stimulatory effects of local transcription on HR are mediated by RNA transcripts.
Fig. 2 |. Tethering of RNA transcripts to DSB recapitulates the effects of local transcription on HR.
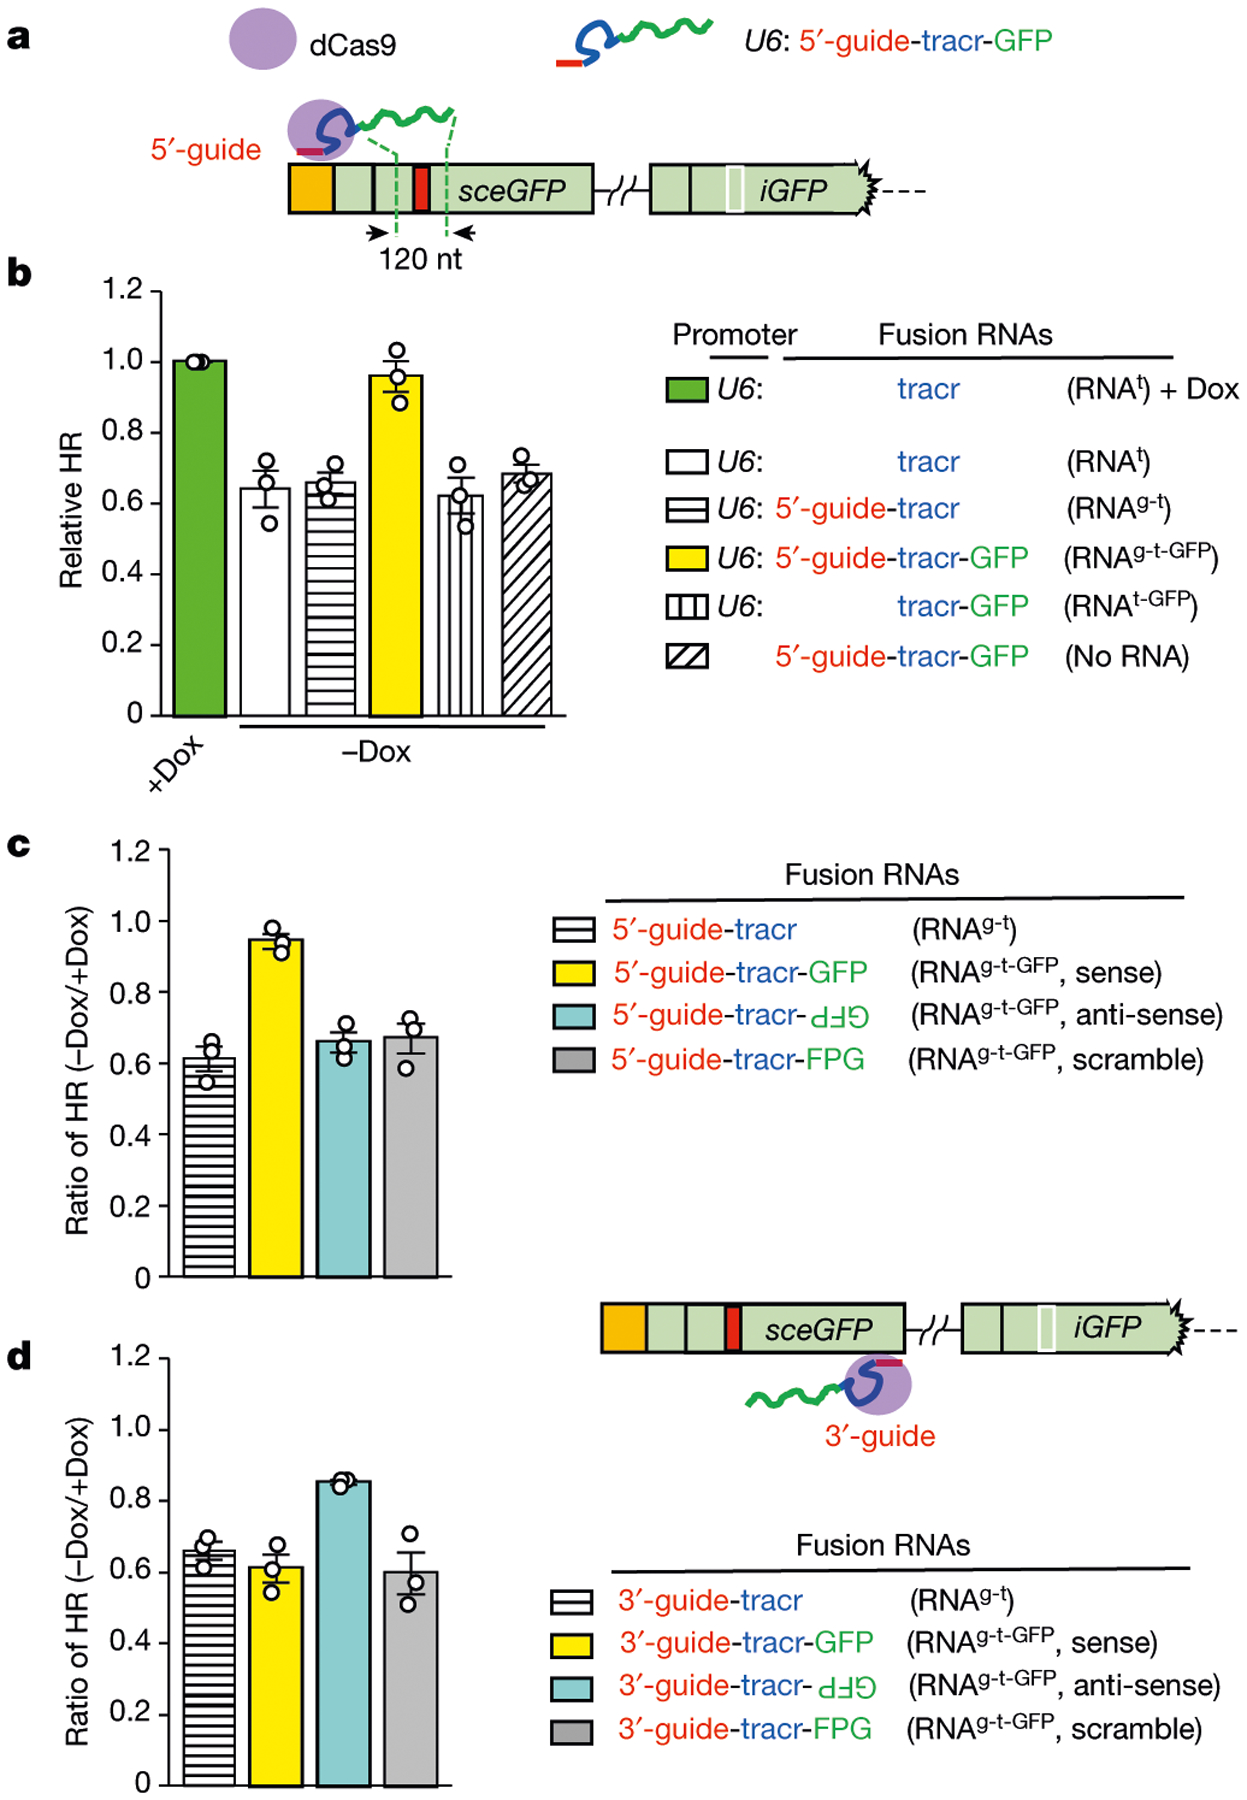
a, Schematic of dCas9-mediated tethering of fusion RNAs to the vicinity of DSB. The fusion RNAg-t-GFP containing guide RNA (red), tracr RNA (blue) and a 120-nt GFP sequence that flanks the I-SceI site (green) is transcribed from a U6 promoter on a plasmid. RNAg-t-GFP is targeted by dCas9 to a unique sequence 5′ to the I-SceI site. b, The indicated fusion RNAs were targeted as in a in the transcriptionally off state (−Dox). The HR efficiencies of cells expressing fusion RNAs were determined by qPCR and normalized to the HR efficiency of cells expressing an inert RNA (tracr RNA) in the transcriptionally on state (+Dox). Data are mean ± s.e.m. (n = 3 independent experiments). c, d, Fusion RNAs containing sense GFP, anti-sense GFP or scrambled sequences were targeted 5′ (c) or 3′ (d) to the I-SceI site. HR efficiency was measured by qPCR in transcriptionally on and off states (+Dox and −Dox, respectively). Ratios of HR efficiencies between the off and on states (−Dox/+Dox) were determined. Data are mean ± s.e.m. (n = 3 independent experiments).
RNA stimulates HR by annealing with DNA
To understand how tethered RNA stimulates HR, we tested variants of the GFP RNA. In contrast to the 120-nt GFP RNA, a derivative 81-nt GFP RNA was unable to restore HR (Extended Data Fig. 2b). A 120-nt scrambled RNA also did not restore HR (Fig. 2c). Surprisingly, even anti-sense GFP RNA did not restore HR. When tethered 5′ to the DSB, anti-sense GFP RNA was in the wrong orientation to hybridize with the sense strand of GFP DNA (Extended Data Fig. 2c). If the ability of tethered RNAs to restore HR relies on the formation of DNA–RNA hybrids, tethering anti-sense GFP RNA 3′ to the DSB should enable it to function. Indeed, anti-sense GFP RNA substantially restored HR when tethered 3′ to the DSB, whereas sense GFP RNA lost its activity (Fig. 2d). Thus, local RNA transcripts stimulate HR in a length-, sequence- and orientation-dependent manner, suggesting that they function by forming DNA–RNA hybrids around DSBs.
RAD51AP1 mediates RNA stimulation of HR
With the Tet-DR-GFP reporter, we tested whether any HR protein functions in a transcription-dependent manner. Depletion of core HR proteins, such as RAD51, BRCA1, and CtIP, reduced HR in both transcriptionally on and off states (Fig. 3a). Notably, the relative levels of HR between on and off states remained the same (Fig. 3b). By contrast, depletion of the RAD51-associated protein RAD51AP1 reduced HR only in the transcriptionally on state15,16 (Fig. 3c, Extended Data Fig. 3a, b). Knockdown of RAD51AP1 reduced HR by around 40% (Fig. 3c), resembling switching off sceGFP transcription. Knockdown of the RAD51AP1-binding protein UAF1 decreased HR to a similar extent without affecting the levels of RAD51AP117 (Fig. 3d, Extended Data Fig. 3c–e). Depletion of RAD52 also reduced HR specifically in the transcriptionally on state, but the reduction was modest (Extended Data Fig. 3f–h). We therefore focused on RAD51AP1 in this study.
Fig. 3 |. RAD51AP1 promotes HR in a transcription- and RNA-dependent manner.
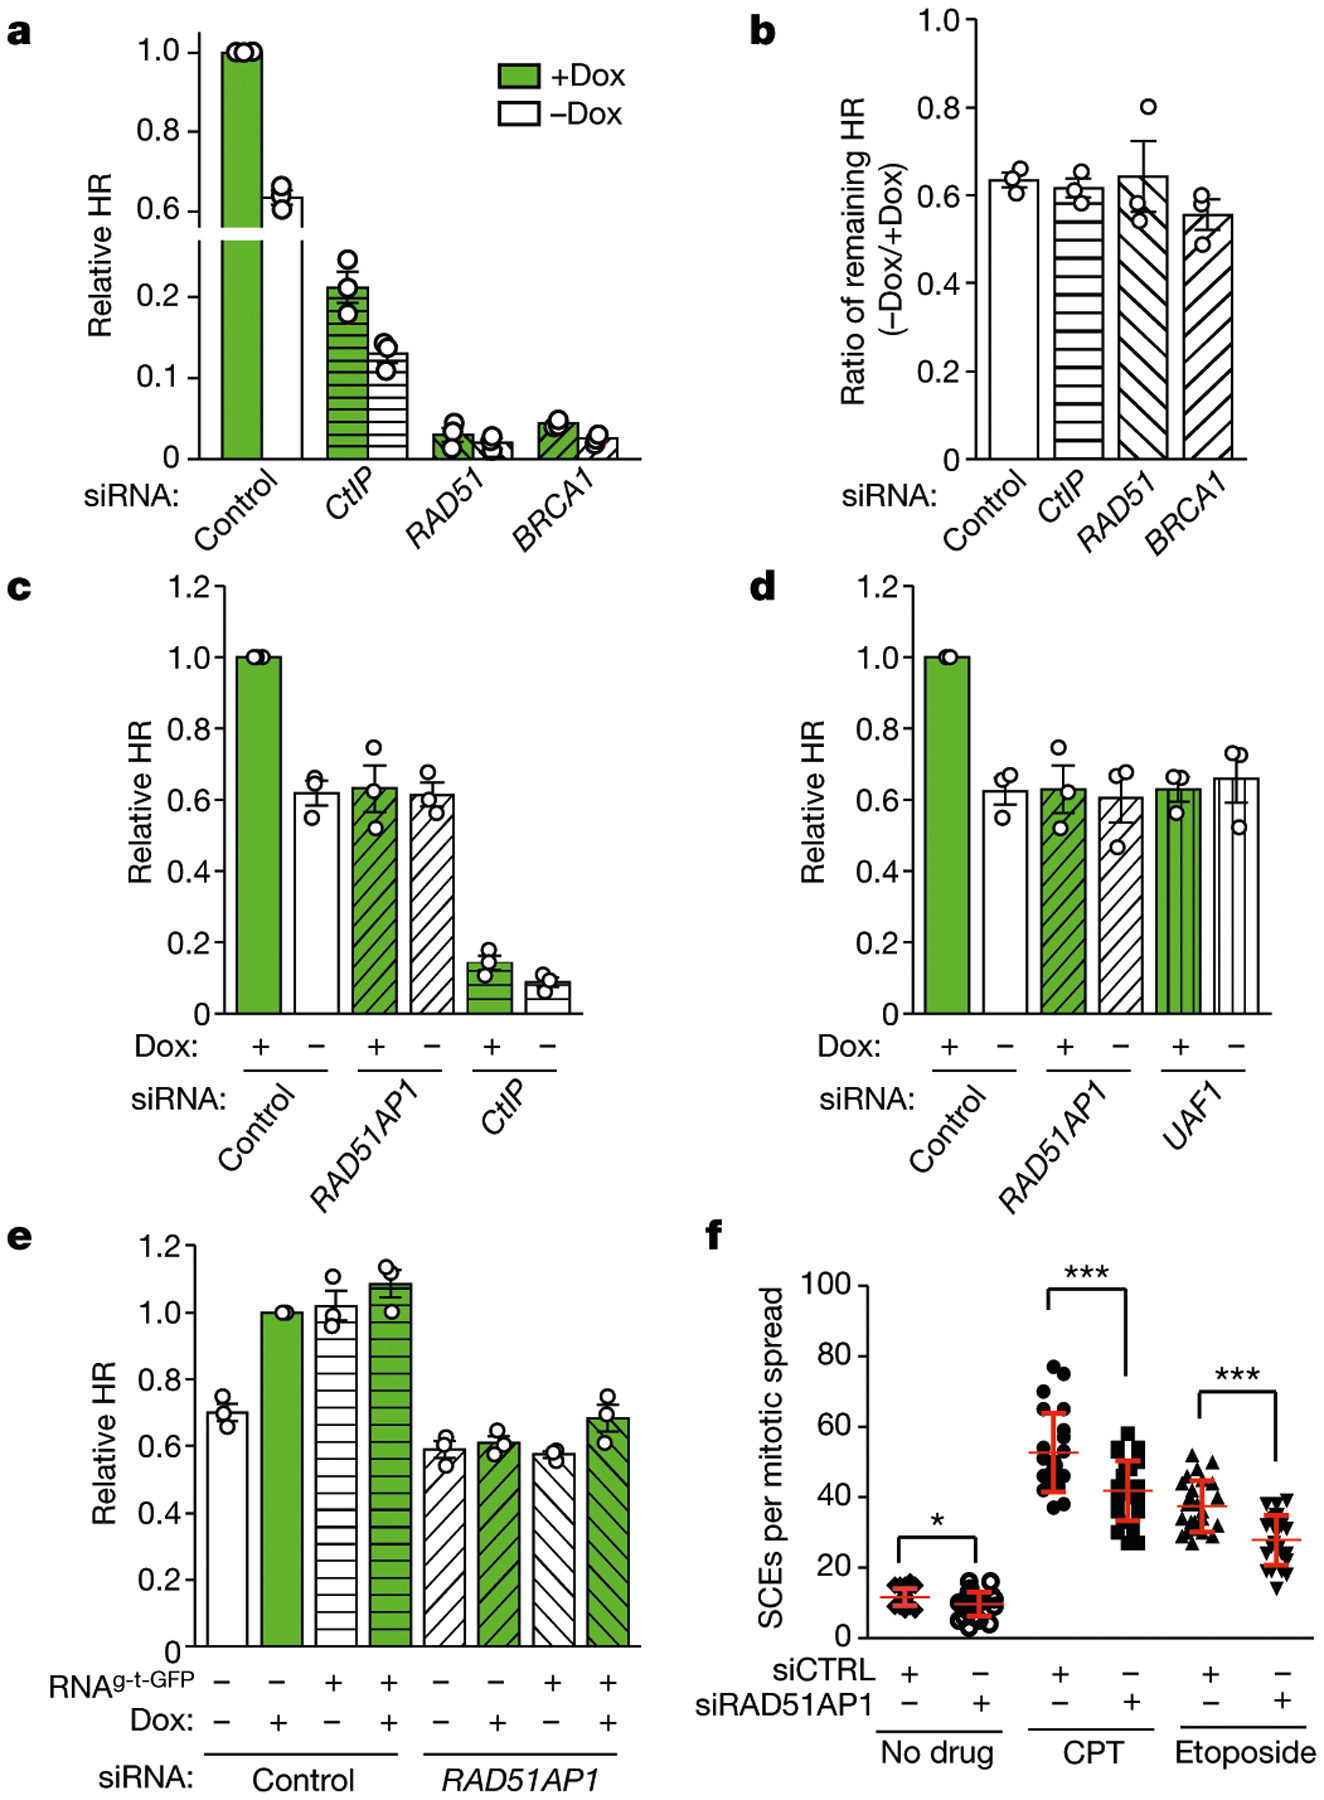
a, b, HR efficiency was measured by qPCR in transcriptionally on and off states (+Dox and −Dox, respectively) after knockdown of CtIP, BRCA1 or RAD51 using siRNA targeting CtIP (also known as RBB8), BRCA1 or RAD51, respectively (a). Ratios of HR efficiencies between the off and on states (−Dox/+Dox) were determined (b). Data are mean ± s.e.m. (n = 3 independent experiments). c, d, HR efficiency was measured by qPCR in transcriptionally on and off states (+Dox and −Dox, respectively) after knockdown of RAD51AP1 (c, d), CtIP (c) and UAF1 (d). Data are mean ± s.e.m. (n = 3 independent experiments). e, HR efficiency was measured by qPCR in control and RAD51AP1-knockdown cells with or without Dox and RNAg-t-GFP as indicated. Relative HR efficiencies were normalized to that of control cells in the transcriptionally on state (+Dox). Data are mean ± s.e.m. (n = 3 independent experiments). f, Sister chromatid exchange (SCE) was quantified in control and RAD51AP1-knockdown cells treated with 3 nM CPT, 200 nM etoposide or no drug. Data are mean ± s.d. (n = 25 cells analysed in 1 experiment for each condition). *P < 0.05, ***P < 0.001 (two-sided Student’s t test; P = 0. 014 for no drug; P = 0.0003 for CPT; P < 0.0001 for etoposide).
Tethering RNAg-t-GFP to sceGFP did not restore HR in RAD51AP1-knockdown cells (Fig. 3e), suggesting that the stimulatory effects of RNA are dependent on RAD51AP1. Knockdown of RAD51AP1 reduced sister chromatid exchange in low concentrations of etoposide and camptothecin (CPT), and increased the sensitivity of cells to etoposide and CPT (Fig. 3f, Extended Data Fig. 4a–c), showing that RAD51AP1 is important for HR in cells.
RAD51AP1 accumulates at DSBs in genes
Using cells expressing the tamoxifen-inducible restriction enzyme AsiSI-ER7, we analysed how RAD51AP1 is recruited to DSBs. RAD51AP1 was detected at multiple AsiSI sites by chromatin immunoprecipitation (ChIP), and the association of RAD51AP1 was increased by DSBs (Extended Data Fig. 4d). Similar to RAD517, RAD51AP1 was preferentially detected at the AsiSI sites in active genes (Extended Data Fig. 4e, f). In cells that contain KillerRed-generated DSBs at a transcriptionally active locus, both RAD51AP1 and RAD51 were recruited to the site (Extended Data Fig. 5a). Furthermore, RAD51AP1 foci were induced by ionizing radiation15 (IR) (Extended Data Fig. 5b). The number of RAD51AP1 foci correlated with RPA foci in IR-treated cells (Extended Data Fig. 5c), indicating that RAD51AP1 foci form in S and G2 phases. A brief treatment of cells with 5,6-dichloro-1-β-d-ribofuranosyl-1H-benzimidazole (DRB), an inhibitor of RNA polymerase II, reduced the number of RAD51AP1 foci but not γH2AX foci in S-phase cells (Extended Data Fig. 5d–g). Knockdown of UAF1 or CtIP reduced the number of IR-induced RAD51AP1 foci (Extended Data Fig. 5h, i), suggesting that UAF1 and DNA-end resection facilitate the localization of RAD51AP1 to DSBs.
RAD51AP1 generates R-loops in vitro
Given its role in RNA-mediated HR, we asked whether RAD51AP1 has any RNA-dependent activity. Purified RAD51AP1 bound to single-stranded DNA (ssDNA) and double-stranded DNA (dsDNA) in an electrophoretic mobility shift assay (EMSA)15,16 (Extended Data Fig. 6a–c). RAD51AP1 also showed a high affinity to single-stranded RNA (ssRNA)18 (Fig. 4a, Extended Data Fig. 6d, e). The RAD51AP1DBM (N-K6RA/C-K7WA) mutant19, which is defective for DNA binding, is also compromised for ssRNA binding. RAD51AP1 also exhibited a high affinity to DNA–RNA hybrids and a low affinity to double-stranded RNA (dsRNA), and RAD51AP1DBM was defective for both types of binding (Fig. 4b, Extended Data Fig. 7a–c).
Fig. 4 |. RAD51AP1 drives R-loop formation in vitro and in cells.
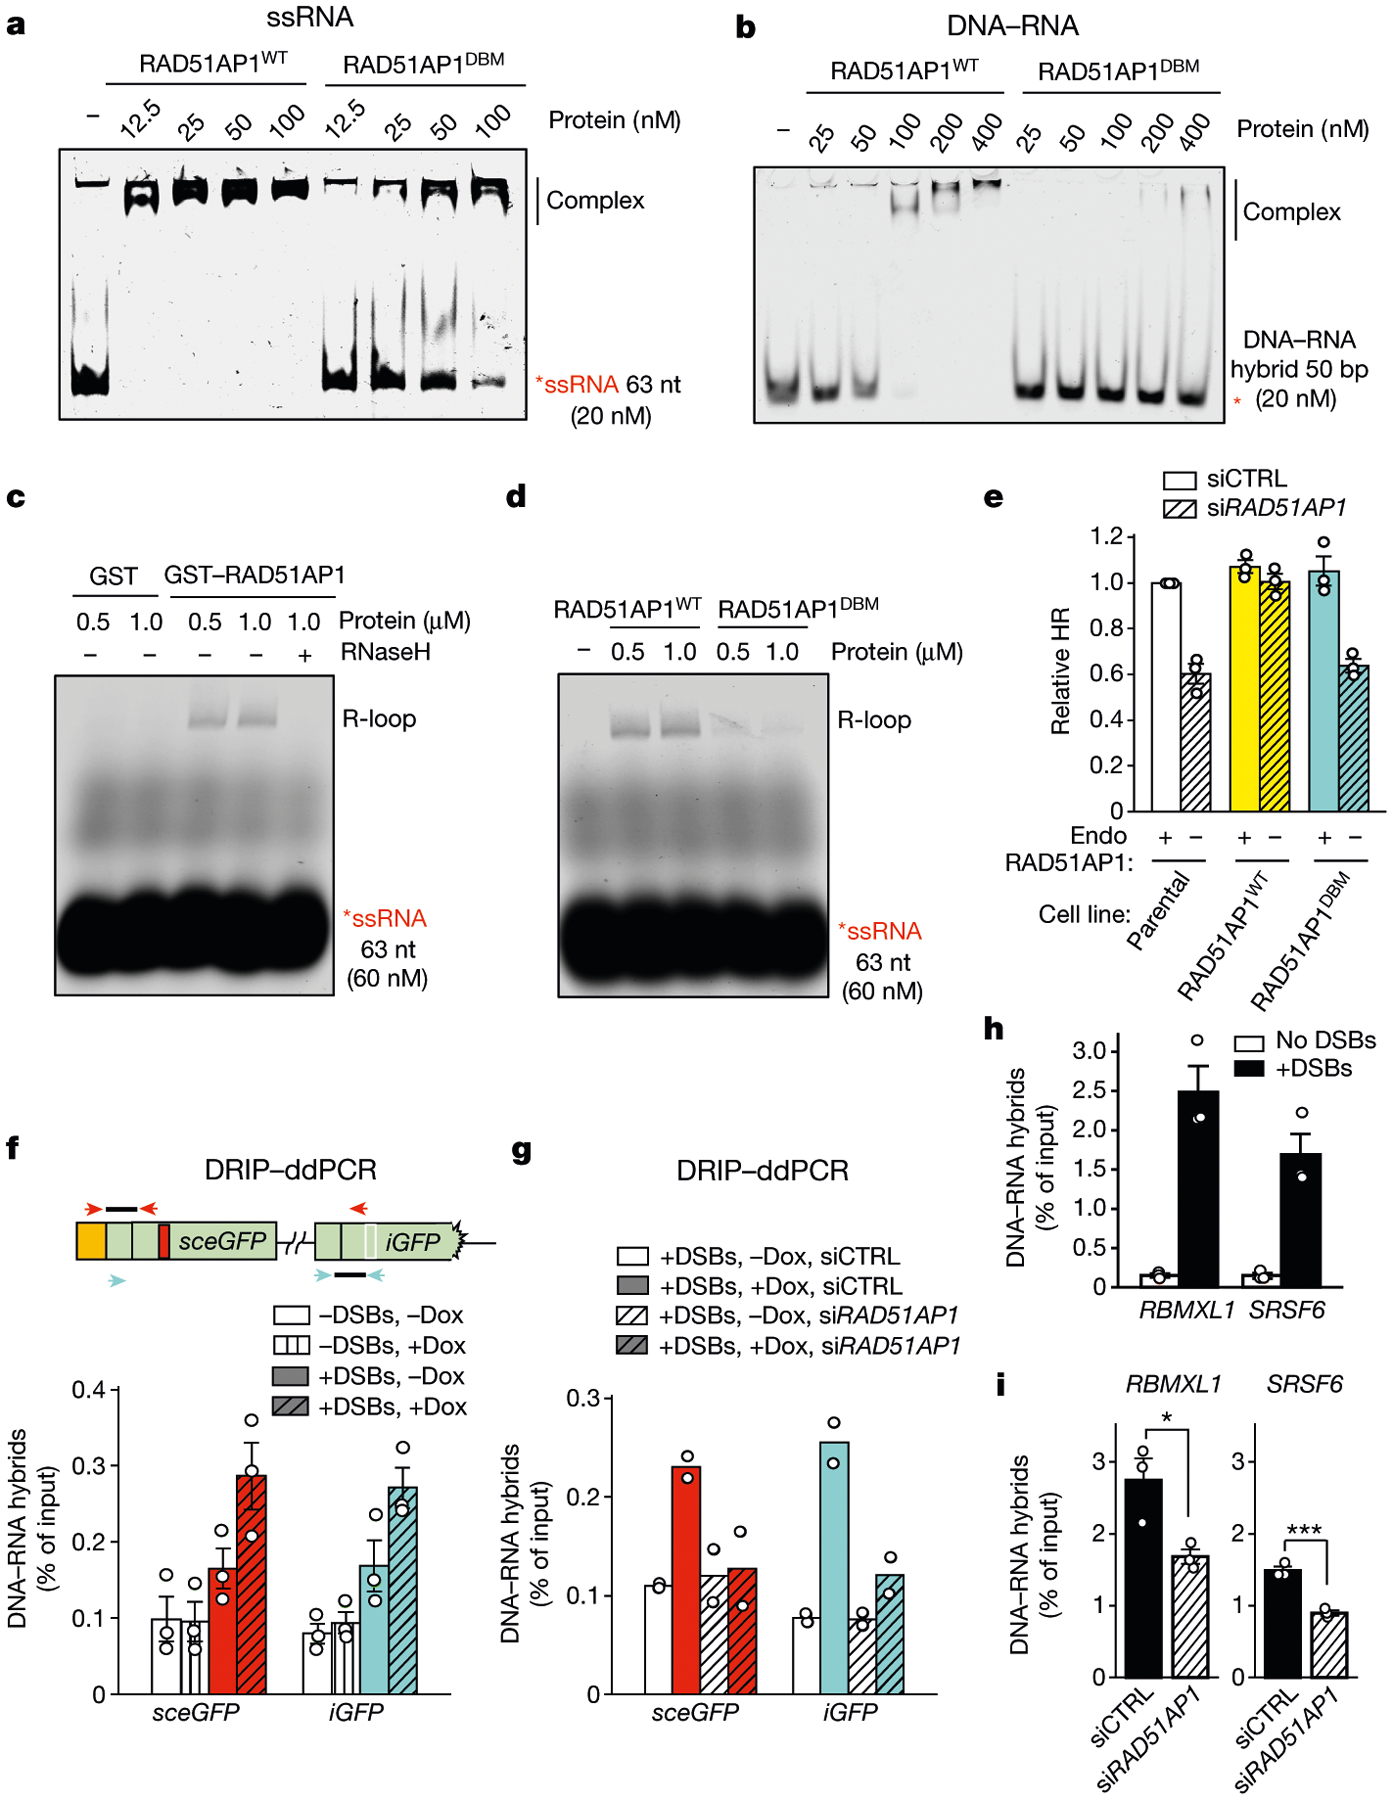
a, b, Increasing concentrations of RAD51AP1WT or RAD51AP1DBM were incubated with labelled ssRNA (a) or DNA–RNA hybrid (b). The formation of complexes was analysed by EMSA. c, d, Increasing concentrations of GST and GST–RAD51AP1 (c), or RAD51AP1WT and RAD51AP1DBM (d), were incubated with labelled ssRNA and a dsDNA plasmid. The formation of R-loops was analysed with agarose gel. Treatment with RNaseH (2.5 U, 5 min) eliminated R-loops (c). e, HR efficiency was measured by DR-GFP assay in cells stably expressing siRNA-resistant RAD51AP1WT or RAD51AP1DBM and transfected with control siRNA (siCTRL) or siRNA targeting RAD51AP1 (siRAD51AP1). Endo, endogenous. Data are mean ± s.e.m. (n = 3 independent experiments). f, The levels of DNA–RNA hybrids in sceGFP and iGFP were analysed by DRIP–ddPCR using primers specific for sceGFP (red arrowheads) or iGFP (cyan arrowheads). Hybrids were measured in transcriptionally on and off states (+Dox and −Dox, respectively) and with or without I-Sce1-induced DSBs. Data are mean ± s.e.m. (n = 3 independent experiments). g, Hybrids in sceGFP and iGFP were analysed as in f in control and RAD51AP1-knockdown cells. Data are mean (n = 2 independent experiments). h, i, Hybrids at two AsiSI sites in active genes were measured in the presence or absence of DSBs (h), or in control and RAD51AP1-knockdown cells (i). Data are mean ± s.e.m. (n = 3 independent experiments). *P < 0.05; ***P < 0.001 (two-sided Student’s t test; P = 0.029 for RBMXL1; P = 0.0008 for SRSF6).
To test whether RAD51AP1 can generate R-loops—structures containing DNA–RNA hybrid and displaced ssDNA—we incubated RAD51AP1 with a labelled ssRNA oligo and a dsDNA plasmid containing a homologous sequence. Using native gels, we detected R-loops, which were verified by RNaseH digestion (Fig. 4c). R-loops were generated by wild-type RAD51AP1 (RAD51AP1WT) but not by glutathione S-transferase (GST), and RAD51AP1DBM was compromised for this function (Fig. 4c, d, Extended Data Fig. 7d, e). ssRNA of scrambled sequence did not form R-loops (Extended Data Fig. 7f). RAD51AP1 generated R-loops without ATP and stimulated strand exchange between linear dsDNA and ssRNA (Extended Data Fig. 7g, h). RAD51 did not generate R-loops or stimulate the RAD51AP1-mediated formation of R-loops (Extended Data Fig. 8a–d). RAD52 generated R-loops but its activity was lower than that of RAD51AP1 (Extended Data Fig. 8e). UAF1 stimulated the RAD51AP1-mediated formation of R-loops (Extended Data Fig. 9a, b), suggesting that the RAD51AP1–UAF1 complex drives R-loop assembly17.
To test whether the RAD51AP1-mediated formation of R-loops is important for HR, we generated stable cell lines that express small interfering RNA (siRNA)-resistant RAD51AP1WT or RAD51AP1DBM. After depletion of endogenous RAD51AP1, RAD51AP1WT but not RAD51AP1DBM restored HR (Fig. 4e). Thus, the HR function of RAD51AP1 correlates with its ability to generate R-loops.
RAD51AP1 generates R-loops in donor DNA
To test how DNA–RNA hybrids are formed around DSBs, we analysed Tet-DR-GFP by DNA–RNA immunoprecipitation (DRIP) and used specific primers and droplet digital PCR (ddPCR) to monitor the formation of DNA–RNA hybrids in sceGFP and iGFP20 (Fig. 4f). Induction of DSBs in the absence of doxycycline resulted in a small increase in DNA–RNA hybrids in sceGFP, possibly owing to promoter-independent RNA21–24. Induction of DSBs in the presence of doxycycline led to a further increase in DNA–RNA hybrids in sceGFP, showing that DNA–RNA hybrids are formed by promoter-dependent transcripts. Notably, a similar increase in DNA–RNA hybrids was observed in iGFP, which was neither transcribed nor cleaved (Extended Data Fig. 10a). The specificity of DRIP–ddPCR was confirmed by treatment with RNaseH (Extended Data Fig. 10b). We did not detect DNA–RNA hybrids between sceGFP and iGFP using specific primers (Extended Data Fig. 10c), indicating the de novo formation of DNA–RNA hybrids in iGFP donor DNA. Knockdown of RAD51AP1 reduced DNA–RNA hybrids in both sceGFP and iGFP (Fig. 4g), showing that RAD51AP1 generates DNA–RNA hybrids at DSBs and in donor DNA. Knockdown of RAD51AP1 also reduced DNA–RNA hybrids at AsiSI-generated DSBs (Fig. 4h, i), confirming that RAD51AP1 functions at DSBs in endogenous genes.
DR-loop formation by RAD51AP1 and RAD51
RAD51 promotes the invasion of ssDNA into donor dsDNA, which generates D-loops25–27. The role of RAD51AP1 in forming DNA–RNA hybrids in donor DNA raises the possibility that ssRNA and ssDNA invade donor dsDNA together, generating a structure that contains both DNA–DNA and DNA–RNA hybrids, which we term ‘DR-loop’. To test whether RAD51AP1 and RAD51 can assemble DR-loops, we set up an in vitro assay using RAD51AP1, ssRNA, RAD51, ssDNA and a dsDNA plasmid (Extended Data Fig. 11a). The ssRNA and ssDNA oligos can hybridize with the opposite strands of dsDNA at adjacent sequences but do not anneal with each other. We first used RAD51AP1, biotin–ssRNA and a dsDNA plasmid to generate R-loops and captured them with streptavidin-coated beads. RAD51 and fluorescently labelled ssDNA were then added, and the ssDNA in the product was detected by dot blot. In this assay, biotin–ssRNA can only capture ssDNA through DR-loops (Extended Data Fig. 11b). Omitting ssRNA, RAD51AP1, RAD51, ssDNA or dsDNA plasmid individually led to a reduction in DR-loops. RAD51AP1DBM did not form DR-loops efficiently, and treatment with RNaseH reduced the amount of ssDNA captured (Extended Data Fig. 11c, d). DR-loop formation was confirmed using different ssRNA and ssDNA oligos and dsDNA plasmids (Extended Data Fig. 11e).
In a second DR-loop assay, ssRNA and ssDNA were labelled with green and red fluorophores, respectively (Fig. 5a). We first incubated RAD51AP1, ssRNA and a dsDNA plasmid, and used the S9.6 antibody to capture R-loops. The R-loops were detected by green fluorescence in native gels (Fig. 5b). After RAD51 and ssDNA were added to R-loops, the R-loop band turned yellow, showing the invasion of ssDNA into dsDNA. These in vitro assays demonstrate that RAD51AP1 and RAD51 act together to generate DR-loops.
Fig. 5 |. RAD51AP1 and RAD51 act together to form DR-loops.
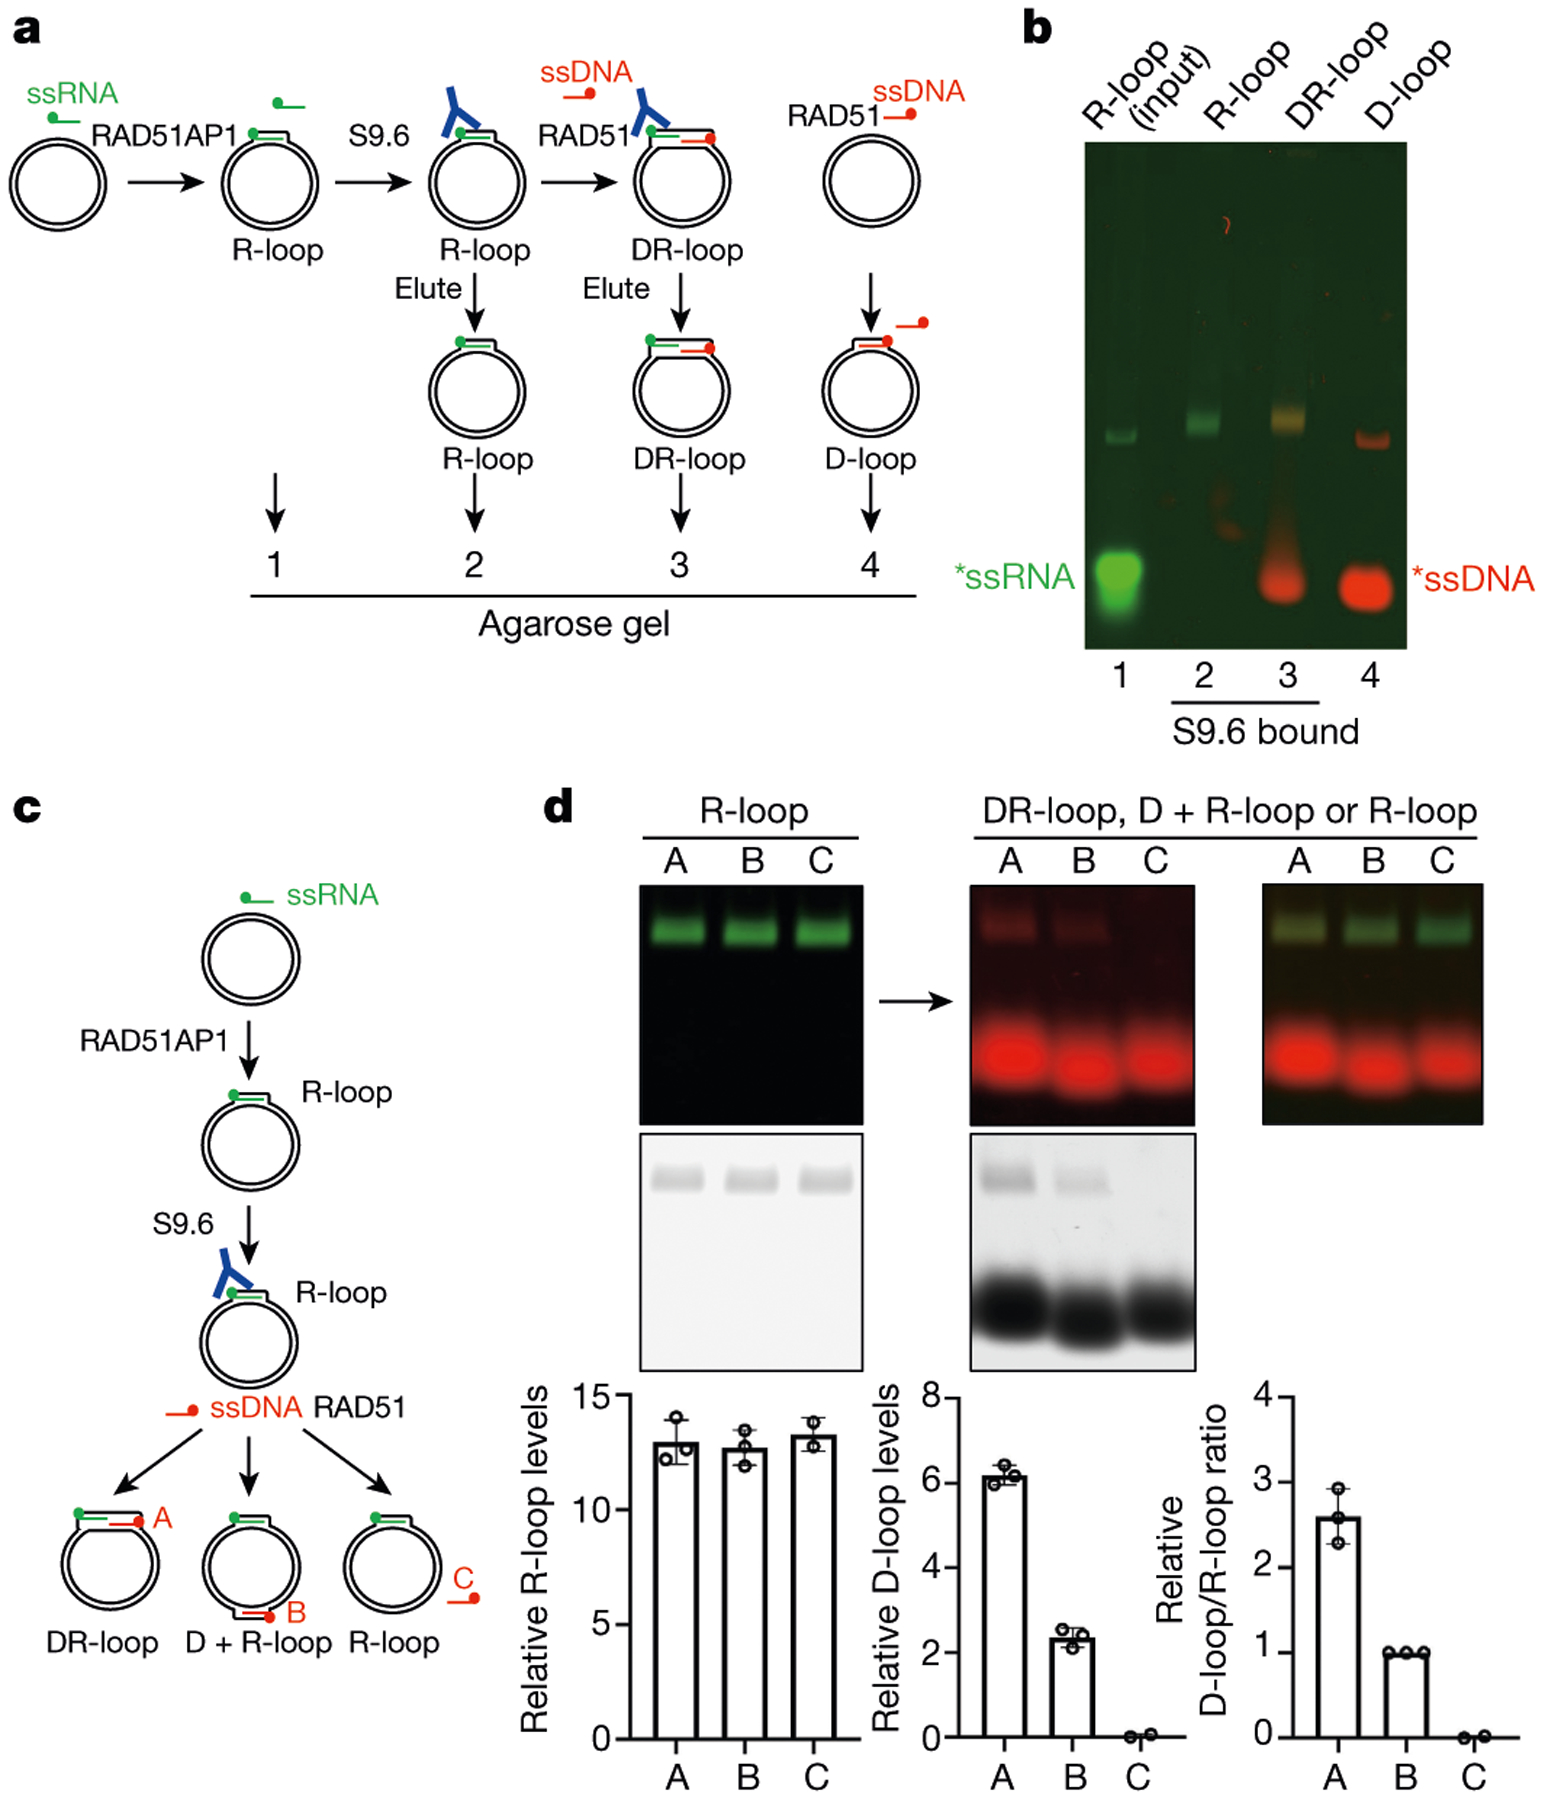
a, Experimental design for in vitro DR-loop formation using labelled ssRNA (green) and ssDNA (red). b, Lane 1, input R-loops (20%); lane 2, R-loops eluted from S9.6-coated beads; lane 3, DR-loops eluted from S9.6-coated beads; lane 4, D-loops formed by RAD51 and dsDNA (20%). c, Experimental design for in vitro DR-loop or D + R-loop (D-loop and R-loop at separate positions in the dsDNA plasmid) formation using labelled ssRNA (green) and three labelled ssDNA oligos (red). d, R-loops, DR-loops and D + R-loops were analysed with agarose gel, detected by green and/or red fluorescence and quantified over background signals. Data are mean ± s.d. (n = 3 independent experiments).
R-loops stimulate D-loop formation
To test whether the R-loops in donor DNA stimulate D-loop formation, we designed three ssDNA oligos. Oligo A can anneal with the dsDNA plasmid next to the ssRNA on the opposite strand (Fig. 5c, Extended Data Fig. 11f). Oligo B can anneal with the plasmid far from the ssRNA. Oligo C cannot anneal with the plasmid and serves as a negative control in D-loop reactions. In the dsDNA plasmid without R-loops, oligos A and B formed D-loops to a similar level (Extended Data Fig. 11g). However, in the R-loop-containing dsDNA plasmid captured by S9.6, oligo A formed D-loops more efficiently than did oligo B (Fig. 5c, d). Thus, RAD51AP1-generated R-loops stimulate the RAD51-mediated formation of D-loops locally.
Discussion
The DNA–RNA hybrids that are formed by RNA transcripts at sites of DNA damage regulate repair through several mechanisms8–10,28–33. DSB-induced small and long non-coding RNAs also modulate repair21–24,34. Moreover, DSBs repress gene expression locally35. The interplay among these processes awaits further investigation. The detection of DNA–RNA hybrids in donor DNA suggests the presence of DR-loops containing invaded ssDNA and ssRNA (Extended Data Fig. 12). D-loops and R-loops may enhance each other in a feed-forward loop. The R-loops in donor DNA may promote ssDNA invasion and D-loop extension, or facilitate the homology search by RAD5136,37. The D-loops in donor DNA may help ssRNA invasion, which stabilizes D-loops and promotes their extension. RAD51AP1 may promote D-loops through both RNA and RAD5117. The DNA–RNA hybrids in donor DNA must be removed for the second DNA end to be captured, suggesting that the assembly and disassembly of DNA–RNA hybrids is a dynamic process31,38,39. The discovery of DR-loops will help identify new HR regulators and alterations in cancer, providing opportunities for cancer therapy40.
Methods
Data reporting
No statistical methods were used to predetermine sample size. The experiments were not randomized and the investigators were not blinded to allocation during experiments and outcome assessment.
Plasmids from other laboratories
The plasmids pCBASceI and pDRGFP are from the laboratory of M. Jasin via Addgene (26477 and 26475, respectively). The vector pInducer20 is from the laboratory of S. Elledge via Addgene (44012). The plasmid pU6-(BbsI)_CBh-Cas9-T2A-mCherry is from the laboratory of R. Kuehn via Addgene (64324), and the plasmid pSLQ1658-dCas9-EGFP is from B. Huang and S. Qi via Addgene (51023). The vector pLenti6.2-ccdB-3×Flag-V5 is from S. Lindquist and M. Taipale via Addgene (87071). The plasmid dCas9-VPR is from G. Church via Addgene (63798). The DiVA cell line is a gift from G. Legube. The 3×HA-pDEST vector is from J. Jin, the pDEST-Lenti-CMV-Flag-HA vector is from G. Gill, and the MLM3636 vector for expressing CRISPR–Cas9 guide RNAs and the plasmid expressing Cpf1 and its crRNA are from J. K. Joung. The pMLM-mini plasmid (1,881 bp in size) is generated by deleting a XhoI-SalI fragment from MLM3636.
The Tet-DR-GFP cassette
The DR-GFP cassette was released from pDRGFP11 with XbaI and ApaLI, and cloned into a Gateway entry vector pENTR-D/TOPO-SLX4–841 to generate pENTR-DRGFP. The DR-GFP cassette was then transferred into pInducer2042 by LR cloning to generate pInducer20-DRGFP. In pInducer20-DRGFP, the expression of GFP is under the control of a tetracycline-inducible promoter (Tet-DR-GFP).
Cell culture and U2OS-derived Tet-DR-GFP reporter cell lines
U2OS and HEK293T cells were cultured in DMEM with 10% fetal bovine serum (FBS) and 100 U/ml penicillin–streptomycin (pen–strep). U2OS-derived DiVA cells were cultured in DMEM with 10% FBS, 100 U/ml pen–strep and 1 μg/ml puromycin. All cell lines were routinely monitored for mycoplasma contamination.
We used pInducer20-DR-GFP to generate lentivirus and infected U2OS cells at a low multiplicity of infection (MOI < 0.01). Cells carrying Tet-DR-GFP were obtained after selection in 800 μg/ml G418. Because cells were infected at a low MOI, they probably carry a single integration of Tet-DR-GFP. We also transfected AhdI-linearized pInducer20-DRGFP into U2OS cells, and isolated individual colonies after G481 selection. Using specific primers (TRE-Fwd: CCATCCACGCTG TTTTGACCTCC; TRE-Rev: TCCTGCTCCTGGGCTTCTCG) that recognize the TRE sequence in pInducer20, we performed qPCR to estimate the copy numbers of Tet-DR-GFP in the U2OS derivative clones. Only the clones that probably carry a single Tet-DR-GFP integration, similar to the cells infected by lentivirus at a low MOI, were used in our subsequent experiments.
I-SceI-T2A-mCherry plasmids
HA-tagged I-SceI with a nuclear localization signal was PCR-amplified from pCBASceI, and T2A-mCherry was PCR-amplified from pU6-(BbsI)_CBh-Cas9-T2A-mCherry. Both PCR fragments were cloned into the Gateway entry vector pENTR11 by three-way cloning. The resulting pENTR11-HA-I-SceI-T2A-mCherry plasmid was sequenced and verified. The HA-I-SceI-T2A-mCherry cassette was then transferred into Gateway destination vectors pDEST-3×HA and pDEST-Lenti-CMV-Flag-HA by LR cloning, generating two I-SceI-T2A-mCherry plasmids for transient expression and lentivirus-based expression.
Quantification of I-SceI induced DSBs
The lentivirus expressing I-SceI-T2A-mCherry was produced by transfecting HEK293T cells with pDEST-Lenti-CMV-Flag-HA-I-SceI-T2A-mCherry, pCMV-dR8.2 and VSV-G. U2OS-Tet-DR-GFP cells were infected with lentivirus at a high MOI. Twenty-two hours after infection, cells were trypsinized and plated in two 6-cm plates, one with 1 μg/ml doxycycline (Dox) and one with vehicle. Seventeen hours after Dox induction (or mock induction), cells were subjected to genomic DNA isolation using the PureLink Genomic DNA Mini Kit (Invitrogen).
One microgram of genomic DNA was ligated to a pair of biotinylated DNA oligos (Sce1A/Sce1B), which can anneal with the cohesive DNA ends generated by I-SceI43. After genomic DNA was fragmented by EcoRI digestion, DNA fragments were captured by Streptavidin magnetic beads (Dynabeads MyOne Streptavidin C1, Invitrogen). After extensive washing, the captured genomic DNA was released from the beads by HindIII digestion. The released DNA was isolated by the Qiagen PCR cleanup kit and subjected to qPCR analysis. Sce1A: biotin–5′-CCCTATAGTGAGTCGTATTAAAGCTTGCGTTAT-3′; Sce1B: phosphor–5′-CGCAAGCTTTAATACGACTCACTATAGGG-3′. qPCR primer pair for detecting captured DNA ends: sceGFP_Fwd: ATCAGGCAGAGCAGGAACC; sceGFP-bio_Rev: TGCGTTATCCCTAGCCGG.
qPCR- and FACS-based HR assays
U2OS-Tet-DR-GFP cells were maintained in DMEM complete medium (containing 10% FBS and pen–strep) with 800 μg/ml G418. One day before transfection, U2OS-Tet-DR-GFP cells were seeded in medium without antibiotics in 6-well plates. For each well, 5 μg of I-SceI-T2A-mCherry plasmid was used for transfection with Fugene 6 according to the manufacturer’s instructions. Eight hours after transfection, cells were trypsinized and plated in two 6-cm plates, one with 1 μg/ml Dox and one with vehicle. After 62 h, cells were trypsinized again. A small fraction of the cells was subjected to FACS analysis to determine both transfection efficiency (number of mCherry-positive cells in total population) and HR efficiency in +Dox samples (number of GFP-positive cells in mCherry-positive cells). The remaining cells were subjected to genomic DNA isolation using the PureLink Genomic DNA Mini Kit (Invitrogen).
The concentration of genomic DNA was measured by NanoDrop. Genomic DNA was diluted to 50 ng/μl in genomic DNA elution buffer, and 75 ng genomic DNA was used in each 15 ul qPCR reaction. qPCR was performed with the PowerUp SYBR Green Master Mix (Invitrogen) on an Applied Biosystems 7500 Real-Time PCR System (Thermo Fisher Scientific). The reactions were conducted using a two-step qPCR protocol with an annealing temperature of 67 °C and an extension time of 70 s.
PCR primers
For repaired sceGFP (wild-type eGFP): GFP_Fwd: GGGCGATGCCACCTACG; GFP_Rev: GGTGTTCTGCTGGTAGTGGTCG. For a reference genomic locus (36B4): 36B4_Fwd: CAGCAAGTGGGAAGGTGTAATCC; 36B4_Rev: CCCATTCTATCATCAACGGGTACAA.
Transcriptional activation of ASCL1
Four CRISPR–Cas9 guides reported previously14 were cloned into MLM3636 individually. Plasmids harbouring these four guides and a puromycin resistant gene expression cassette were assembled using Gold Gate Assembly to form ASCL1–4guide-Puro. Transcriptional activation of ASCL1 was induced by co-transfecting dCas9-VPR and ASCL1–4guide-Puro (or vector with Puro-resistant only) in HEK293T cells. One day after transfection, cells were trypsinized and grown in medium containing 2 μg/ml puromycin. Three days later, RNAs were extracted and ASCL1 expression level was determined by reverse-transcription qPCR (RT–qPCR) using an ASCL1 specific primer pair. ASCL1_q_F1: CTTTGGAAGCAGGGTGATCG; ASCL1_q_R1: GATACTGTTCTGAGCGCTTCC.
Knock-in of mClover at the ASCL1 locus
Cpf1 expression vector containing crRNA specifically for ASCL1 (Cpf1-ASCL1-crRNA) (sgRNA sequence: ATCTTGGCAGAGCTTTCCATGCG) was generated as described44 to induce breaks near ATG of ASCL1 coding sequence. The mClover knock-in templates for ASCL1 site consisting of ASCL1 left homologous arm (LHA), mClover and ASCL1 right homologous arm (RHA) are amplified by PCR, assembled via Gold Gate Assembly into pBlueScript (pBS-ASCL1-mClover) and sequenced. To assess the knock-in efficiency, the following four plasmids were co-transfected in HEK293T cells: Cpf1-ASCL1-crRNA, pBS-ASCL1-mClover, dCas9-VPR and ASCL1–4guide-Puro (or vector with Puro-resistant only). One day after transfection, cells were trypsinized and grown in medium containing 2 μg/ml puromycin. Three days later, genomic DNAs were extracted and the mClover knock-in efficiency was determined by qPCR using a specific primer pair. To evaluate the contribution of RAD51AP1, HEK293T cells were first transfected with RAD51AP1 siRNA or control siRNA, 24 h before the transfection of the four plasmids.
qPCR primer pair to detect mClover knock-in at the ASCL1 locus: ASCL1-mClover_Fwd: GGTGTCCCATTGAAAAGGCG; ASCL1-mClover_Rev: ACTTGTGGCCGTTTACGTCG.
The sequence of ASCL1-LHA∷mClover∷ASCL1-RHA is shown below (mClover in upper case and ASCL1 homology arms in lower case): cggcgcaagagagcgcagccttagtaggagaggaacgcgagacgcggcagagcgcgttcagcactgacttttgctgctgcttctgcttttttttttcttagaaacaagaaggcgccagcggcagcctcacacgcgagcgccacgcgaggctcccgaagccaacccgcgaagggaggagggg agggaggaggaggcggcgtgcagggaggagaaaaagcattttcactttttttgctcccactctaagaagtctcccggggattttgtatatattttttaacttccgtcagggctcccgcttcatatttcc ttttctttccctctctgttcctgcacccaagttctctctgtgtccccctcgcgggccccgcacctc gcgtcccggatcgctctgattccgcgactccttggccgccgctgcgcatgGTGAGCAAGGGCGAGGAGCTGTTCACCGGGGTGGTGCCCATCCTGGTCGAGCTGGACGGCGACGTAAACGGCCACAAGTTCAGCGTCCGCGGCGAGGGCGAGGGCGATGCCACCAACGGCAAGCTGACCCTGAAGTTCATCTGCACCACCGGCAAGCTGCCCGTGCCCTGGCCCACCCTCGTGACCACCTTCGGCTACGGCGTGGCCTGCTTCAGCCGCTACCCCGACCACATGAAGCAGCACGACTTCTTCAAGTCCGCCATGCCCGAAGGCTACGTCCAGGAGCGCACCATCTCTTTCAAGGACGACGGTACCTACAAGACCCGCGCCGAGGTGAAGTTCGAGGGCGACACCCTGGTGAACCGCATCGAGCTGAAGGGCATCGACTTCAAGGAGGACGGCAACATCCTGGGGCACAAGCTGGAGTACAACTTCAACAGCCACAACGTCTATATCACGGCCGACAAGCAGAAGAACGGCATCAAGGCTAACTTCAAGATCCGCCACAACGTTGAGGACGGCAGCGTGCAGCTCGCCGACCACTACCAGCAGAACACCCCCATCGGCGACGGCCCCGTGCTGCTGCCCGACAACCACTACCTGAGCCATCAGTCCGCCCTGAGCAAAGACCCCAACGAGAAGCGCGATCACATGGTCCTGCTGGAGTTCGTGACCGCCGCCGGGATTACACATGGCATGGACGAGCTGTACAAGTAGGGATAAgaaagctctgccaagatggagagcggcggcgccggccagcagccccagccgcagccccagcagcccttcctgccgcccgcagcctgtttctttgccacggccgcagccgcggcggccgcagccgccgcagcggcagcgcagagcgcgcagcagcagcagcagcagcagcagcagcagcagcaggcgccgcagctgagaccggcggccgacggccagccctcagggggcggtcacaagtcagcgcccaagcaagtcaagcgacagcgctcgtcttcgcccgaactgatgcgctgcaaacgccggctcaacttcagcggctttggctacagcctgccgcagcagcagccggccgccgtggcgcgccgcaacgagcgcgagcgcaaccgcgtcaagttggtcaacctgggctttgccacccttcgggagcacgtccccaacggcgcggccaacaagaagatgag.
Expression of fusion RNAs
The wild-type Cas9 gene in pU6-(BbsI)_CBh-Cas9-T2A-mCherry was replaced by the catalytic-dead Cas9 (dCas9) from pSLQ1658-dCas9-EGFP to generate pU6-(BbsI)_dCas9-T2A-mCherry. DNA fragments that encode gRNA, tracrRNA and various eGFP sequences were synthesized as GeneArt Strings DNA Fragments (Invitrogen), cloned into pBlueScript, sequence-verified and subcloned into pU6-(BasI)_dCas9-T2A-mCherry by restriction enzyme digestion (BbsI + XbaI) and ligation. The resulting pU6-gRNA-tracrRNA-eGFP_dCas9-T2A-mCherry plasmids express fusion RNAs and dCas9-T2A-mCherry at the same time.
Guide sequences for RNA tethering
(PAM sequence shown in upper case): 5′ site: tcttgatcccatagtggcggCGG; 3′ site: atccgccacaacatcgaggaCGG.
Sequences of various fusion RNAs
(Guide, underlined upper case; tracr, upright lower case; GFP, upper case (not underlined); U6-ter, italic lower case).
Sense RNA tethering construct (RNAg-t-GFP, sense): CTTGATCCCATAGTGGCGGgttttagagctagaaatagcaagttaaaataaggctagtccgttatcaacttgaaaaagtggcaccgagtcggtgcTGGTCGAGCTGGACGGCGACGTAAACGGCCACAAGTTCAGCGTGTCCGGCGAGGGCGAGGGCGATGCCACCTACGGCAAGCTGACCCTGAAGTTCATCTGCACCACCGGCAAGCTGCCCGtttttt.
Anti-sense RNA tethering construct (RNAg-t-GFP, anti-sense): TCTTGATCCCATAGTGGCGGgttttagagctagaaatagcaagttaaaataaggctagtccgttatcaacttgaaaaagtggcaccgagtcggtgcCGGGCAGCTTGCCGGTGGTGCAGATGAACTTCAGGGTCAGCTTGCCGTAGGTGGCATCGCCCTCGCCCTCGCCGGACACGCTGAACTTGTGGCCGTTTACGTCGCCGTCCAGCTCGACCAtttttt.
Scrambled RNA tethering construct (RNAg-t-GFP, scrambled): TCTTGATCCCATAGTGGCGGgttttagagctagaaatagcaagttaaaataaggctagtccgttatcaacttgaaaaagtggcaccgagtcggtgcCGCCGGTCATCCCGACCGGTTACAAGAGTACCAAATCTGTCGAACCCTTCGAGGGCGATGGGTCGGGGCTGATCCCAACCCTGCGGGAGAGCCAACTACGCCGCAGCAGGCGTCGGAGGGtttttt.
Sense RNA tethering construct (81-nt GFP sequence): TCTTGATCCCATAGTGGCGGgttttagagctagaaatagcaagttaaaataaggctagtccgttatcaacttgaaaaagtggcaccgagtcggtgcACGTAAACGGCCACAAGTTCAGCGTGTCCGGCGAGGGCGAGGGCGATGCCACCTACGGCAAGCTGACCCTGAAGTTCATCTtttttt.
siRNA transfection and RNA tethering
Various siRNAs (5 nM) were transfected into U2OS or U2OS-Tet-DR-GFP cells in 6-well plates using RNAiMAX (Invitrogen) according to the reverse transfection protocol from the manufacturer. One day after siRNA transfection, cells were washed twice with warm PBS and fresh medium (without antibiotics) was added. Then, forward transfection of the plasmids expressing HA-I-SceI-T2A-mCherry and various fusion RNAs was carried out using Fugene 6. Seven to eight hours after plasmid transfection, cells were trypsinized and plated in two 6-cm plates, one with 1 μg/ml Dox and one with vehicle. After 62 h, cells were trypsinized again. A small fraction of the cells was subjected to FACS analysis to determine both transfection efficiency (number of mCherry-positive cells in total population) and HR efficiency in +Dox samples (number of GFP-positive cells in mCherry-positive cells). The remaining cells were subjected to genomic DNA isolation using the PureLink Genomic DNA Mini Kit (Invitrogen). qPCR analysis of genomic DNA was carried out as described above.
Sequences of siRNAs used
Control siRNA (siCTRL): UUCUCCGAACGUGUCACGUtt; RAD51AP1-2: GAGUGAGGAUAAUGACGAAtt; RAD51AP1-4 (used in all experiments unless specified): GCAGUGUAGCCAGUGAUUAtt; UAF1: GGACCGAGAUUAUCUUUCAtt; RAD52–1: UGAAGUGGAUUUAACUAAAtt; RAD52–3: GGUCCAUGCCUUUAAUGUUtt; CtIP: UCCACAACAUAAUCCUAAUUU; RAD51: GAGCUUGACAAACUACUUCUU; BRCA1: CAGCUACCCUUCCAUCAUAtt; BRCA2: GGAUUAUACAUAUUUCGCAtt; PALB2: CUUAGAAGAGGACCUUAUUtt; AGO2: GCACGGAAGUCCAUCUGAAtt; SLUG (also known as SNAI2): Thermo Fisher Stealth siRNA HSS109995; RAD51C: Qiagen FlexiTube siRNA SI02757608.
Sister chromatid exchange assay
The sister chromatid exchange (SCE) assay was done according to a published protocol with some modifications45. In brief, U2OS cells were transfected with 10 nM RAD51AP1 siRNA or control siRNA. Twenty-four hours later, cells were split at 1:4 and BrdU was added to a final concentration of 10 μM. Twenty-four hours after BrdU addition, camptothecin (CPT, final concentration = 3 nM), etoposide (final concentration = 200 nM) or no drug was added. Twenty-one hours after drug or mock treatment, cells were treated with colcemid (final concentration = 0.1 μg/ml) for 3 h. Finally, all cells on plates and in medium were collected and analysed for SCEs. Images of chromosome spreads were captured using a Nikon microscope with a 100× oil-immersion objective lens.
Cell viability assay
U2OS cells were transfected with 10 nM RAD51AP1 siRNA or control siRNA. Twenty-four hours after transfection, cells were seeded at a density of 250 cells per well in 96-well plates. Twenty-four hours after cells were seeded, they were treated with CPT (final concentration = 0, 2, 4 or 8 nM), etoposide (final concentration = 6.4, 20, 64 or 200 nM) or vehicle for 24 h. Drugs were then washed out and fresh medium was added. Five days after drug wash-out, cell viability was measured using CellTiter-Glo (Promega).
Total nucleic acids isolation and DRIP–ddPCR
U2OS-Tet-DR-GFP cells were seeded in 6-cm plates in medium without antibiotics a day before transfection. Fresh medium with or without 1 μg/ml Dox was added to the cells before they were incubated with the transfection mixture, which contains the plasmid expressing 3×HA-I-SceI-T2A-mCherry, Fugene 6 and Opti-MEM. Twenty-four hours after transfection, cells were trypsinized and total nucleic acids were isolated using the PureLink Genomic DNA Mini Kit (Invitrogen) without RNase A. Five micrograms of total nucleic acids were digested with restriction enzyme cocktail (BsrGI, EcoRV-HF, HindIII-HF, NdeI, PstI-HF, SspI, XbaI in NEB buffer 2.1) overnight at 37 °C, extracted with phenol and chloroform, precipitated with ethanol and sodium acetate, and resuspended in DRIP buffer (50 mM Tris-HCl pH 7.4, 150 mM NaCl, 0.5 mM EDTA, 0.5% NP-40). After a fraction of the sample was set aside as input, the rest of the sample was incubated with 10 μg of the S9.6 antibody at 4 °C for 4–6 h. Then, samples were incubated with 40 μl of Protein G Dynabeads (pre-washed with DRIP buffer) at 4 °C overnight. After extensive washing with DRIP buffer, the bound immunocomplexes were eluted with 120 μl DRIP Elution Buffer (1% SDS, 0.1 M NaHCO3) at 55 °C for 20 min. The eluted samples were then subjected to nucleic acid purification using the ChIP DNA Clean & Concentrator kit (Zymo Research), and the DNA was eluted with 5 mM Tris-HCl pH 8.5.
To test the specificity of DRIP, precipitated nucleic acids after restriction enzymes digestion were resuspended in 50 μl RNase H buffer with 5 μl RNase H (New England Biolabs). After incubation at 37 °C overnight, DRIP buffer was added to the reaction and DRIP was performed as described above.
To test whether RAD51AP1 knockdown affects R-loop formation, cells were transfected with 10 nM RAD51AP1 siRNA or control siRNA. Forty-eight hours later, fresh medium with or without 1 μg/ml Dox was added to the cells before they were incubated with the transfection mixture, which contains the plasmid expressing HA-I-SceI-T2A-mCherry, Fugene 6 and Opti-MEM. Twenty-four hours after plasmid transfection, cells were trypsinized and total nucleic acids were isolated as described above.
DRIP assays with U2OS-DiVA cells were done in a similar manner to those with U2OS-Tet-DR-GFP cells. Forty-eight hours after U2OS-DiVA cells were seeded in 6-cm plates, they were treated with 4-hydroxytamoxifen (4-OHT; final concentration 300 nM) for 4 h to induce DSBs. Vehicle-treated cells were used as no-DSB controls. Total nucleic acids were extracted from cells. Five micrograms of total nucleic acids were digested with restriction enzyme cocktail (BsrGI-HF, EcoRI-HF, HindIII-HF, NdeI, SspI-HF, XbaI) in NEB buffer 2.1 at 37 °C overnight.
To test whether RAD51AP1 knockdown affects R-loop formation, cells were transfected with 10 nM RAD51AP1 siRNA or control siRNA. Twenty-four hours later, cells were seeded in 6-cm plates. Forty-eight hours after U2OS-DiVA cells were seeded, they were treated with 4-OHT (final concentration 300 nM) for 4 h to induce DSBs.
The ddPCR was performed using the Bio-Rad EvaGreen ddPCR master mix on a QX200 Droplet Digital PCR system (Bio-Rad) with the primer pairs listed below:
sceGFP: sceGFP_ddPCR_Fwd: AGAGCCTCTGCTAACCATGTTC; sceGFP_ddPCR_Rev: TCGTGGGTCTTCTACTTTTCGT. iGFP: iGFP_ddPCR_Fwd: ATCTGCTACGCCGTGATCAG; iGFP_ddPCR_Rev: CATCGCCCTCGCCCTCg. Internal region: Int_Fwd: CGTGCTACTTCCATTTGTCACG; Int_Rev: CTGAGGAGTGAATTCTACCGGG. RBMXL1: RBMXL1_Fwd: GATTGGCTATGGGTGTGGAC; RBMXL1_Rev: CATCCTTGCAAACCAGTCCT. SRSF6: SRSF6_Fwd: GGTTTGGGTGTTTGGTTTTG; SRSF6_Rev: GCCCCCGAACCTCTAACTAA.
Quantification of sceGFP and iGFP RNA transcripts
To determine the levels of sceGFP and iGFP RNA transcripts before and after Dox induction, mRNA was purified, and reverse transcription was carried out with random primers. After removal of contaminating DNA by dsDNA-specific DNase (dsDNase, Invitrogen) treatment, the cDNAs were analysed by qPCR using the following primers:
sceGFP-exp_Fwd: tcaaGATCCGCCACAACATC; sceGFP-exp_Rev: TCTCGTTGGGGTCTTTGCTC; iGFP-exp_Fwd: ACAACTACAACAGCCACAACG; iGFP-exp_Rev: GCACGACAGGTTTCCCGACT.
ChIP analysis
ChIP was carried out as previously described46 with some modifications. In brief, 8 × 10⁶ U2OS-DiVA cells were transfected with control or RAD51AP1 siRNA for 72 h (with or without treatment with 300 nM 4-OHT for 4 h). After cross-linking with 1% formaldehyde for 10 min at room temperature and quenching with 0.125 M glycine for 5 min at room temperature, cells were washed with cold PBS and collected by scraping in ChIP collection buffer (5 mM HEPES pH 8.0, 85 mM KCl, 0.5% NP-40, 1× EDTA-free protease inhibitor cocktail). Cells were re-suspended in ChIP lysis buffer (50 mM Tris pH 8.0, 10 mM EDTA, 1% SDS) supplemented with protease inhibitor cocktail and subjected to sonication to shear chromatin DNA to an average size of 200–600-bp using a Q800R2 sonicator (Qsonica). After centrifugation, the supernatant was diluted 10-fold with ChIP dilution buffer (16.7 mM Tris pH 8.0, 250 mM NaCl, 0.01% SDS, 1% Triton X-100), pre-cleared with BSA-pretreated Protein A Dynabeads (Invitrogen) and subjected to immunoprecipitation using 5 μg antibody. The immunocomplexes were captured by BSA-pretreated Protein A Dynabeads, and washed with ChIP dilution buffer, LiCl wash buffer (100 mM Tris pH 7.5, 500 mM LiCl, 1% NP-40, 1% SDC) and TE buffer (10 mM Tris, pH 8.0, 1 mM EDTA). The bound immunocomplexes were eluted twice with 150 μl elution buffer (1% SDS, 0.1M NaHCO3) at 65 °C. After adding NaCl to eluted immunocomplexes to a final concentration of 300 mM, the cross-linking was reversed at 65 °C overnight. The de-cross-linked samples were then subjected to DNA isolation using the QIAquick PCR purification kit (Qiagen), and the DNA was eluted with elution buffer (10 mM Tris pH 8.5). qPCR was performed using primers described in a previous report7.
Immunofluorescence analysis
Cells growing on glass coverslips were irradiated by 2 Gy IR and recovered for 2 h before immunofluorescence. Unless specified, cells were pre-extracted, fixed with PFA and methanol, post-extracted, fixed and incubated with different antibodies. To determine whether RAD51AP1 focus formation is dependent on transcription, cells were pre-treated with 40 μM 5,6-dichloro-1-β-d-ribofuranosyl-1H-benzimidazole (DRB) for 4 h before IR.
Generation of RAD51AP1 derivatives
The RAD51AP1DBM was generated by multiple rounds of PCR mutagenesis as described previously19. RAD51AP1WT or RAD51AP1DBM resistant to siRNA were generated by introducing silent mutations (upper case) in the siRNA-targeting sequence (see ‘Sequences of siRNAs used‘), which becomes 5′-aattgTTCAgtagccagtgattat-3′. The siRNA-resistant RAD51AP1 derivatives were then transferred into Gateway destination vectors pLenti6.2-ccdB-3×Flag-V5 to generate pLenti6.2-RAD51AP1–3×Flag-V5 for lentivirus-based expression.
Antibodies
Antibodies used were: RAD51AP1 (Proteintech), XRCC4 (Thermo Fisher Scientific), RAD51 (Santa Cruz), γH2AX (Millipore), γH2AX (Cell Signaling), RPA32 (Thermo Fisher Scientific), PCNA (Santa Cruz), Flag (Sigma), S9.6 (Millipore), mouse or rabbit control IgG (Diagenode), β-actin (Bethyl), GAPDH (Millipore).
qPCR analysis of gene expression
To assess the expression of various genes, reverse transcription was carried out with an oligo dT primer and qPCR was performed using the following primer pairs:
UAF1_Fwd: GGTGCTAGTATTATTCAGTGCCA, UAF1_Rev: CTTTACATGCCTTCAATACATCCC; MAPK3_Fwd: CTCCACCGAGATCTAAAGCC, MAPK3_Rev: GACTTGGTATAGCCCTTGGAG; ARPC2_Fwd: CTGGAGGTGAACAACCGCAT, ARPC2_Rev: GACCCCATCGAAATCTGCAAA; SYVN1_Fwd: GGACTTTATGGAACGCAGCC, SYVN1_Rev: TGAGCACCATCGTCATCAGG; SEL1L_Fwd: GAGGGGGAAAGTGTCACAGA, SEL1L_Rev: GGTCAAAGCTGGTTTCCGTA; GAPDH_F11: CATTTCCTGGTATGACAACGA, GAPDH_R11: CCTCTTGTGCTCTTGCTG.
RAD51AP1 expression and purification
RAD51AP1 was cloned into the pGEX4T-3 vector with an N-terminal GST tag and transformed into Rosetta cells. Protein was overexpressed at an optical density at 600 nm of 0.5 with 0.3 mM IPTG at 16 °C for 16 h. Cell pellet was lysed in buffer A (50 mM Tris-HCl pH 7.5, 500 mM KCl, 10% sucrose, 2 mM DTT, 0.1% NP-40 and protease inhibitor cocktails), sonicated and centrifuged. Supernatant was loaded on glutathione sepharose 4B beads and incubated for 2 h. Beads were washed with buffer K (20 mM KH2PO4 pH 7.5, 0.5 mM EDTA, 1 mM DTT, 10% glycerol) with 500 mM KCl and 0.5 mM glutathione. Protein was eluted by buffer K with 100 mM KCl and 25 mM glutathione. Eluted protein was dialysed with buffer T (50 mM Tris-HCl pH7.5, 0.5mM EDTA, 1mM DTT, 10% glycerol) containing 100 mM KCl and allowed to bind to SP-sepharose beads in buffer T with 100mM KCl. Protein was eluted from SP-sepharose with a KCl gradient from 0.1 to 1 M, using fast protein liquid chromatography. Fractions containing RAD51AP1 protein was pooled together, dialysed and stored at −80 °C. Recombinant RAD51 protein was purchased from Abcam (ab63808). Recombinant UAF1 protein was purchased from Bio-Techne Corporation (E-566).
Preparation of dsDNA, dsRNA and DNA–RNA hybrids
For dsDNA, dsRNA and DNA–RNA hybrid preparation, 5′-end-labelled ssDNA or ssRNA was annealed with complementary oligo and separated using 10% native acrylamide gel at 4 °C. Then, corresponding bands were cut from the gel and eluted using TE buffer. The formation of dsDNA, dsRNA and DNA–RNA hybrids was confirmed by heat denaturation, electrophoresis and enzymatic assays47.
EMSA
Single-stranded DNA and RNA oligos labelled with IRDye-800 at the 5′ end were either tested directly or used to generate dsDNA, dsRNA and DNA–RNA structures with unlabelled complementary ssDNA or ssRNA oligos. Various DNA, RNA and hybrid structures were incubated with proteins in buffer B (25 mM Tris-HCl, pH 7.5), 1 mM EDTA, 1 mM DTT, 50 μg/ml BSA and 50 mM KCl) at 37 °C for 15 min. Reaction products were loaded onto 6% PAGE-TBE gels and resolved at 4 °C. Gels were imaged using an Odyssey scanner (LI-COR Biosciences).
D-loop formation assay
A ssDNA oligo labelled at the 5′ end was mixed with RAD51 or RAD51AP1 in buffer D (35 mM Tris-HCl pH 7.5, 1 mM DTT, 2 mM MgCl2, 2 mM CaCl2, 2 mM ATP or AMP-PNP, 50 μg/ml BSA and 50 mM KCl). The pBSK+ plasmid (30 nM) was then added to the reaction, and samples were incubated for 20 min. After incubation, 1 mg/ml proteinase K, 0.5% SDS and 0.5 mM EDTA was added to the reaction, and samples were further incubated for 5 min. Reaction products were resolved on 1% agarose gels with TAE buffer. Gels were imaged using Odyssey scanner (LI-COR Biosciences).
R-loop formation assay
The R-loop formation assay was done in a similar manner to the D-loop formation assay except that a ssRNA oligo labelled at the 5′ end was used.
Strand exchange between ssDNA and linear dsDNA
A 5′ fluorescently labelled 55-nt ssDNA oligo and its unlabelled complementary 63-nt ssDNA oligo were used to generate linear dsDNA. A 63-nt ssRNA oligo (200 nM) complementary to the unlabelled DNA strand was incubated with RAD51AP1 in buffer E (35 mM Tris-HCl pH 7.5, 1 mM DTT, 2 mM MgCl2, 50 μg/ml BSA and 50 mM KCl), and then mixed with dsDNA (30 nM) and incubated for another 30 min. After incubation, 1 mg/ml proteinase K, 0.5% SDS and 0.5 mM EDTA were added to the reactions, and samples were further incubated for 5 min. Reaction products were resolved on 10% native acrylamide gels with 1× TBE buffer. Gels were imaged using an Odyssey scanner (LI-COR Biosciences).
DR-loop formation assay coupled with DR-loop detection by dot blot
A biotin-labelled ssRNA oligo (30 nM) was mixed with RAD51AP1 in buffer D (35 mM Tris-HCl pH 7.5, 1 mM DTT, 2 mM MgCl2, 2 mM CaCl2, 2 mM ATP or AMP-PNP, 50 μg/ml BSA and 50 mM KCl). The pBSK+ plasmid (30 nM) was then added to the reaction, and samples were incubated for 1 h. Both R-loops formed in the reactions and the remaining free biotinylated ssRNA were pulled down using streptavidin-coated magnetic beads (Dynabeads MyOne Streptavidin C1, Invitrogen). The beads were washed four times with buffer E (20 mM Tris-HCl pH 7.5, 500 mM NaCl, 1 mM EDTA, 0.125% SDS, 1.25% Triton X-100) and once with low-salt buffer (20 mM Tris-HCl pH 7.5, 150 mM NaCl, 1 mM EDTA) to remove RAD51AP1 and free plasmid DNA. A ssDNA oligo labelled with IRDye-800 at the 5′ end was pre-incubated with RAD51 and then mixed with the R-loops captured on streptavidin beads, and samples were incubated for 30 min. The DR-loops formed in the reactions remained bound to streptavidin-coated beads. The beads were washed four times with buffer E and once with low-salt buffer to remove RAD51 and free ssDNA. The DR-loops were eluted three times with elution buffer (10 mM Tris-HCl pH 7.5, 1 mM EDTA, 0.1% Triton X-100 and RNaseA) at 95 °C for 2 min followed by rapid cooling at 4 °C for 2 min. The fluorescently labelled ssDNA in DR-loops was quantified by dot blot using an Odyssey scanner (LI-COR Biosciences).
DR-loop formation assay coupled with DR-loop detection by dual fluorescence
A 5′ IRDye800-labelled ssRNA oligo (60 nM) was mixed with RAD51AP1 in buffer D (35 mM Tris-HCl pH7.5, 1 mM DTT, 2 mM MgCl2, 2 mM CaCl2, 2 mM ATP or AMP-PNP, 50 mg/ml BSA and 50 mM KCl). The pMLM-mini plasmid (450 ng per reaction) was then added to the reaction, and samples were incubated at 37 °C for 20 min. The resulting R-loops were captured by the S9.6 antibody (4 μg per reaction) and IgG Dynabeads. The beads were washed three times with buffer E (20 mM Tris-HCl pH 7.5, 200 mM NaCl, 1 mM EDTA, 0.1% SDS, 1% Triton X-100) and suspended in buffer F (20 mM Tris-HCl pH 7.5, 1 mM EDTA, 0.1% Triton X-100). A 5′ IRDye700-labelled ssDNA oligo was first incubated with RAD51 and then mixed with the R-loops on beads, and samples were incubated for 30 min. The DR-loops formed in the reactions remained bound to the beads. The beads were washed three times with buffer E, and DR-loops were eluted with elution buffer (10 mM Tris-HCl pH 7.5, 1 mM EDTA, 0.1% Triton X-100, Proteinase K) at 37 °C for 20 min. Eluted DR-loop was resolved on 1% agarose and imaged using an Odyssey scanner (LI-COR Biosciences).
DNA and RNA oligos used in biochemical analyses
80-nt ssDNA (EMSA): GACCTATCCTTGCGCAGCTCGAGAAGCTCTTACTTTGCGACCTTTCGCCATCAACTAACGATTCTGTCAAAAACTGACGC; 90-nt ssDNA (D-loop): AAATCAATCTAAAGTATATATGAGTAAACTTGGTCTGACAGTTACCAATGCTTAATCAGTGAGGCACCTATCTCAGCGATCTGTCTATTT; 63-nt ssRNA (EMSA/R-loop): AACUUGGUCUGACAGUUACCAAUGCUUAAUCAGUGAGGCACCUAUCUCAGCGAUCUGUCUAUU; 60-nt biotin-RNA (Oligo 112) (DR-loop): biotinTEG/UUGGUCUGACAGUUACCAAUGCUUAAUCAGUGAGGCACCUAUCUCAGCGAUCUGUCUAUU; 60-nt ssDNA (Oligo A/oligo 96) (DR-loop): AAGCCCTCCCGTATCGTAGTTATCTACACGACGGGGAGTCAGGCAACTATGGATGAACGA; 60-nts ssDNA for DR-loop (Oligo B): GTTGGGTGCACGAGTGGGTTACATCGAACTGGATCTCAACAGCGGTAAGATCCTTGAGAG; 60-nts ssDNA for DR-loop (Oligo C): CGTTTTACAACGTCGTGACTGGGAAAACCCTGGCGTTACCCAACTTAATCGCCTTGCAGC; 50-nt ssRNA (Oligo 135) (DR-loop): BiotinTEG/GCAAAAAAGCGGUUAGCUCCUUCGGUCCUCCGAUCGUUGUCAGAAGUAAG; 50-nt ssDNA (Oligo 136) (DR-loop): AGAGAATTATGCAGTGCTGCCATAACCATGAGTGATAACACTGCGGCCAA; 50-nt ssDNA (Oligo 137) (DR-loop): TTGGCCGCAGTGTTATCACTCATGGTTATGGCAGCACTGCATAATTCTCT; 30-nt ssRNA (Oligo 138) (DR-loop): BiotinTEG/ACCCACUCGUGCACCCAACUGAUCUUCAGC; 30-nt ssRNA (Oligo 139) (DR-loop): CACCCAGAAACGCTGGTGAAAGTAAAAGAT; 55-nt ssDNA (dsDNA strand exchange): AACTTGGTCTGACAGTTACCAATGCTTAATCAGTGAGG CACCTATCTCAGCGATC; 63-nt ssDNA (dsDNA strand exchange): AATAGACAGATCGCTGAGATAGGTGCCTCACTGATTAAGCATTGGTAACTGTCAGACCAAGTT; 25-nt ssRNA (for dsRNA and EMSA): GAUUCAUACCUGUCGUGCCAGCUGC; 50-nt ssRNA (DNA–RNA hybrid): UUAAUUGGUGUGACUAAUCGAAGUUGAUACAUCGACGUUAUGGUGAUGAU; 50-nt ssDNA (DNA–RNA hybrid): ATCATCACCATAACGTCGATGTATCAACTTCGATTAGTCACACCAATTAA.
Reporting summary
Further information on research design is available in the Nature Research Reporting Summary linked to this paper.
Extended Data
Extended Data Fig. 1 |. Characterizations of Tet-DR-GFP and ASCL1-mClover HR reporters.
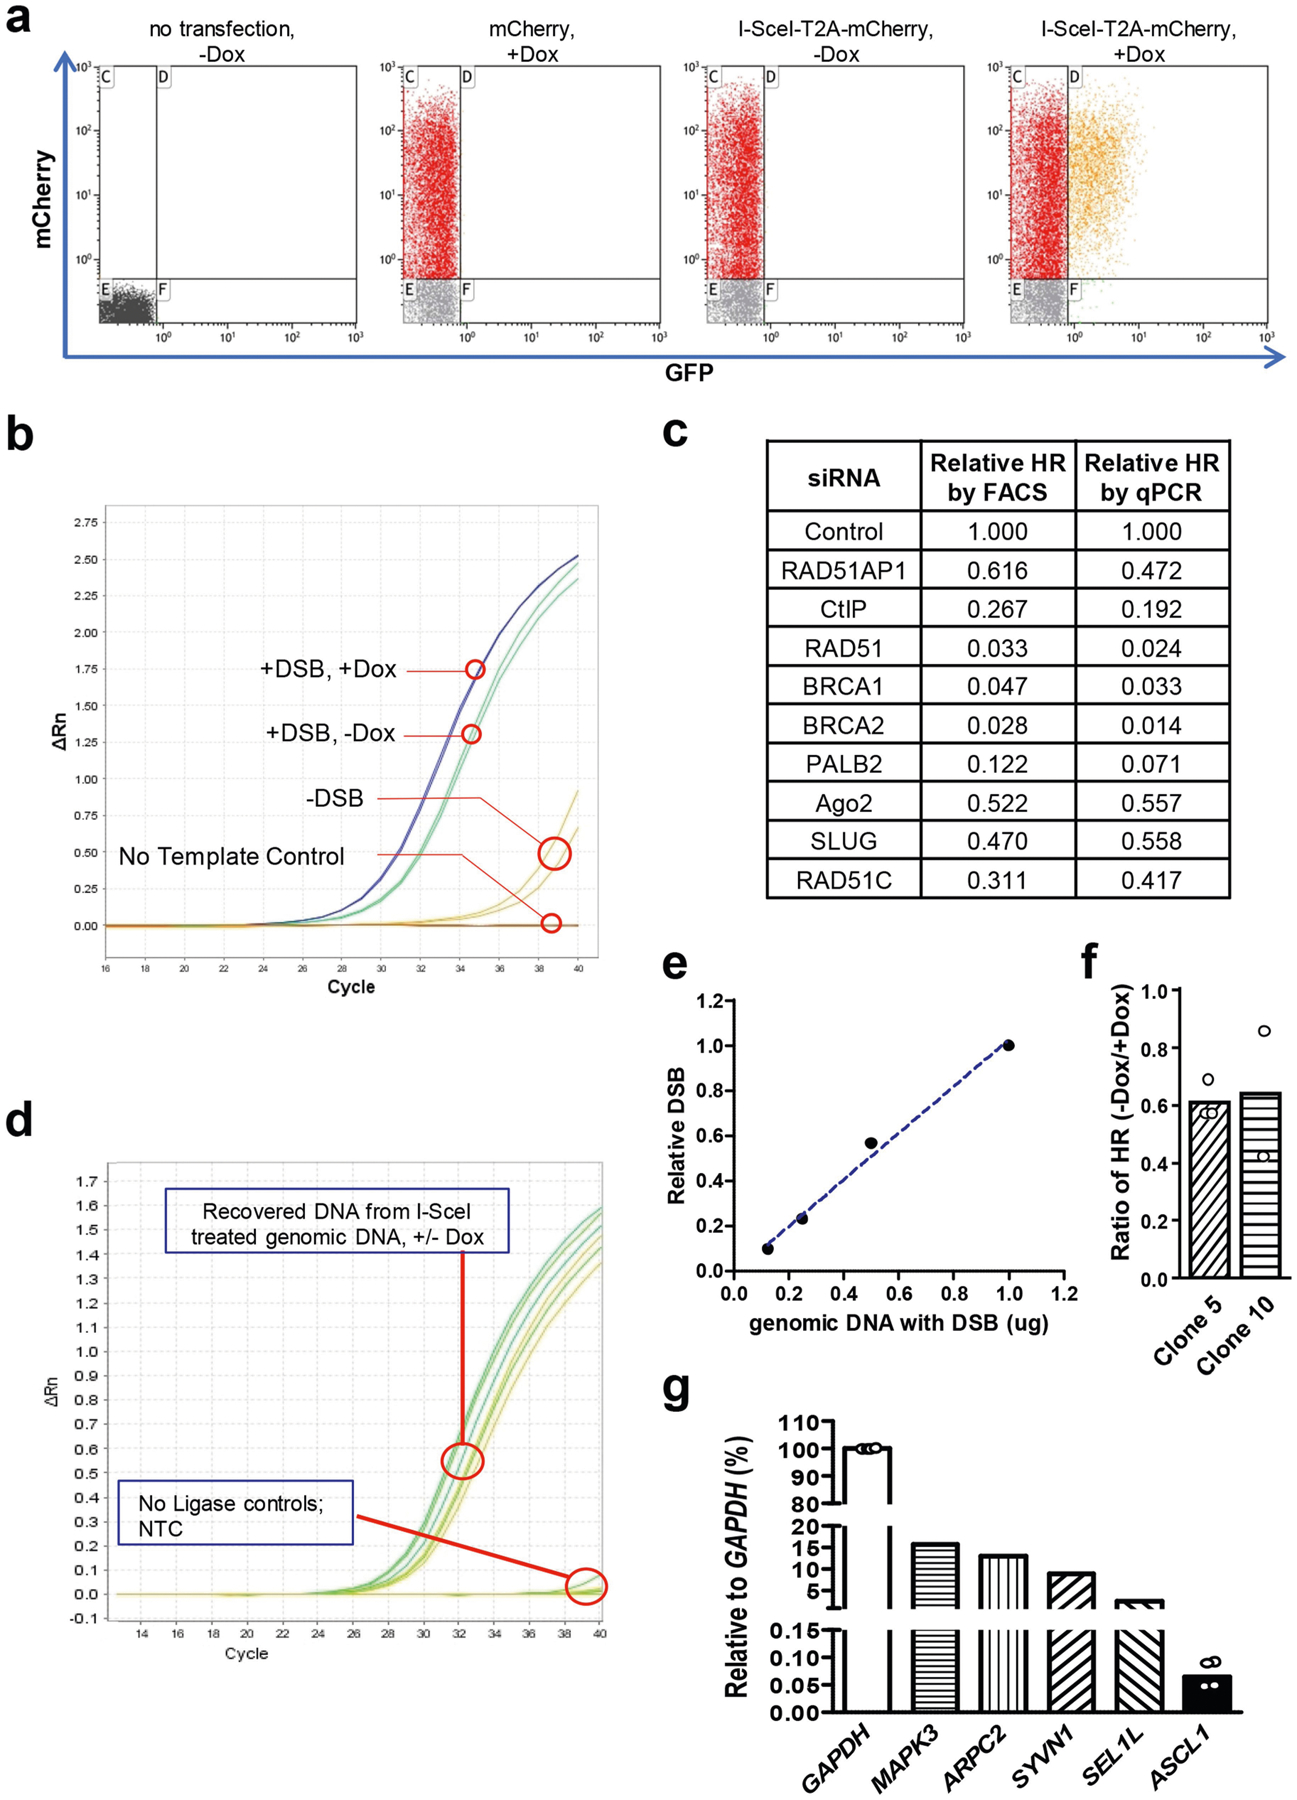
a, Flow cytometry analysis of a U2OS-derivative cell line in which the Tet-DR-GFP reporter is stably integrated. Cells were mock transfected, transfected with a control plasmid expressing mCherry or transfected with a plasmid expressing I-SceI-T2A-mCherry. GFP+ cells were only detected when I-SceI-T2A-mCherry was expressed and transcription of sceGFP was induced by Dox. b, Detection of repaired eGFP by qPCR. Cells carrying the Tet-DR-GFP reporter were mock transfected or transfected with a plasmid expressing I-Sce-T2A-mCherry (−/+ DSBs) in the absence and presence of Dox (−/+Dox). Genomic DNA was analysed for the repaired eGFP sequence by qPCR. c, FACS- and qPCR-based HR assays detect changes of HR efficiency similarly. Cells were transfected with siRNAs to knock down the indicated HR proteins and analysed by FACS- and qPCR-based HR assays. d, e, The transcription status of sceGFP does not affect I-SceI induced DSB formation. The I-SceI-induced DNA ends in sceGFP were ligated to a sequence-specific adaptor and quantified by qPCR. d, Amplification plot of qPCR. e, Linear quantification of DSBs by qPCR. The indicated amounts of genomic DNA containing I-SceI-generated DSBs were mixed with uncut genomic DNA, so that a total of 1 μg genomic DNA was analysed in each qPCR sample. f, Two additional stable U2OS clones carrying the Tet-DR-GFP reporter were used to analyse the ratio of HR levels in transcriptionally off and on states (−Dox/+Dox). Data are mean (n = 2 independent experiments). g, Total RNA isolated from HEK293T cells was reversely transcribed using random primers. cDNA was subjected to qPCR analysis to determine the relative expression levels of CRISPR-dCas9-VPR-activated ASCL1 and a panel of endogenous genes using the GAPDH transcript as a reference. Data of ASCL1 are mean (n = 4 independent experiments).
Extended Data Fig. 2 |. Effects of tethered RNA on HR.
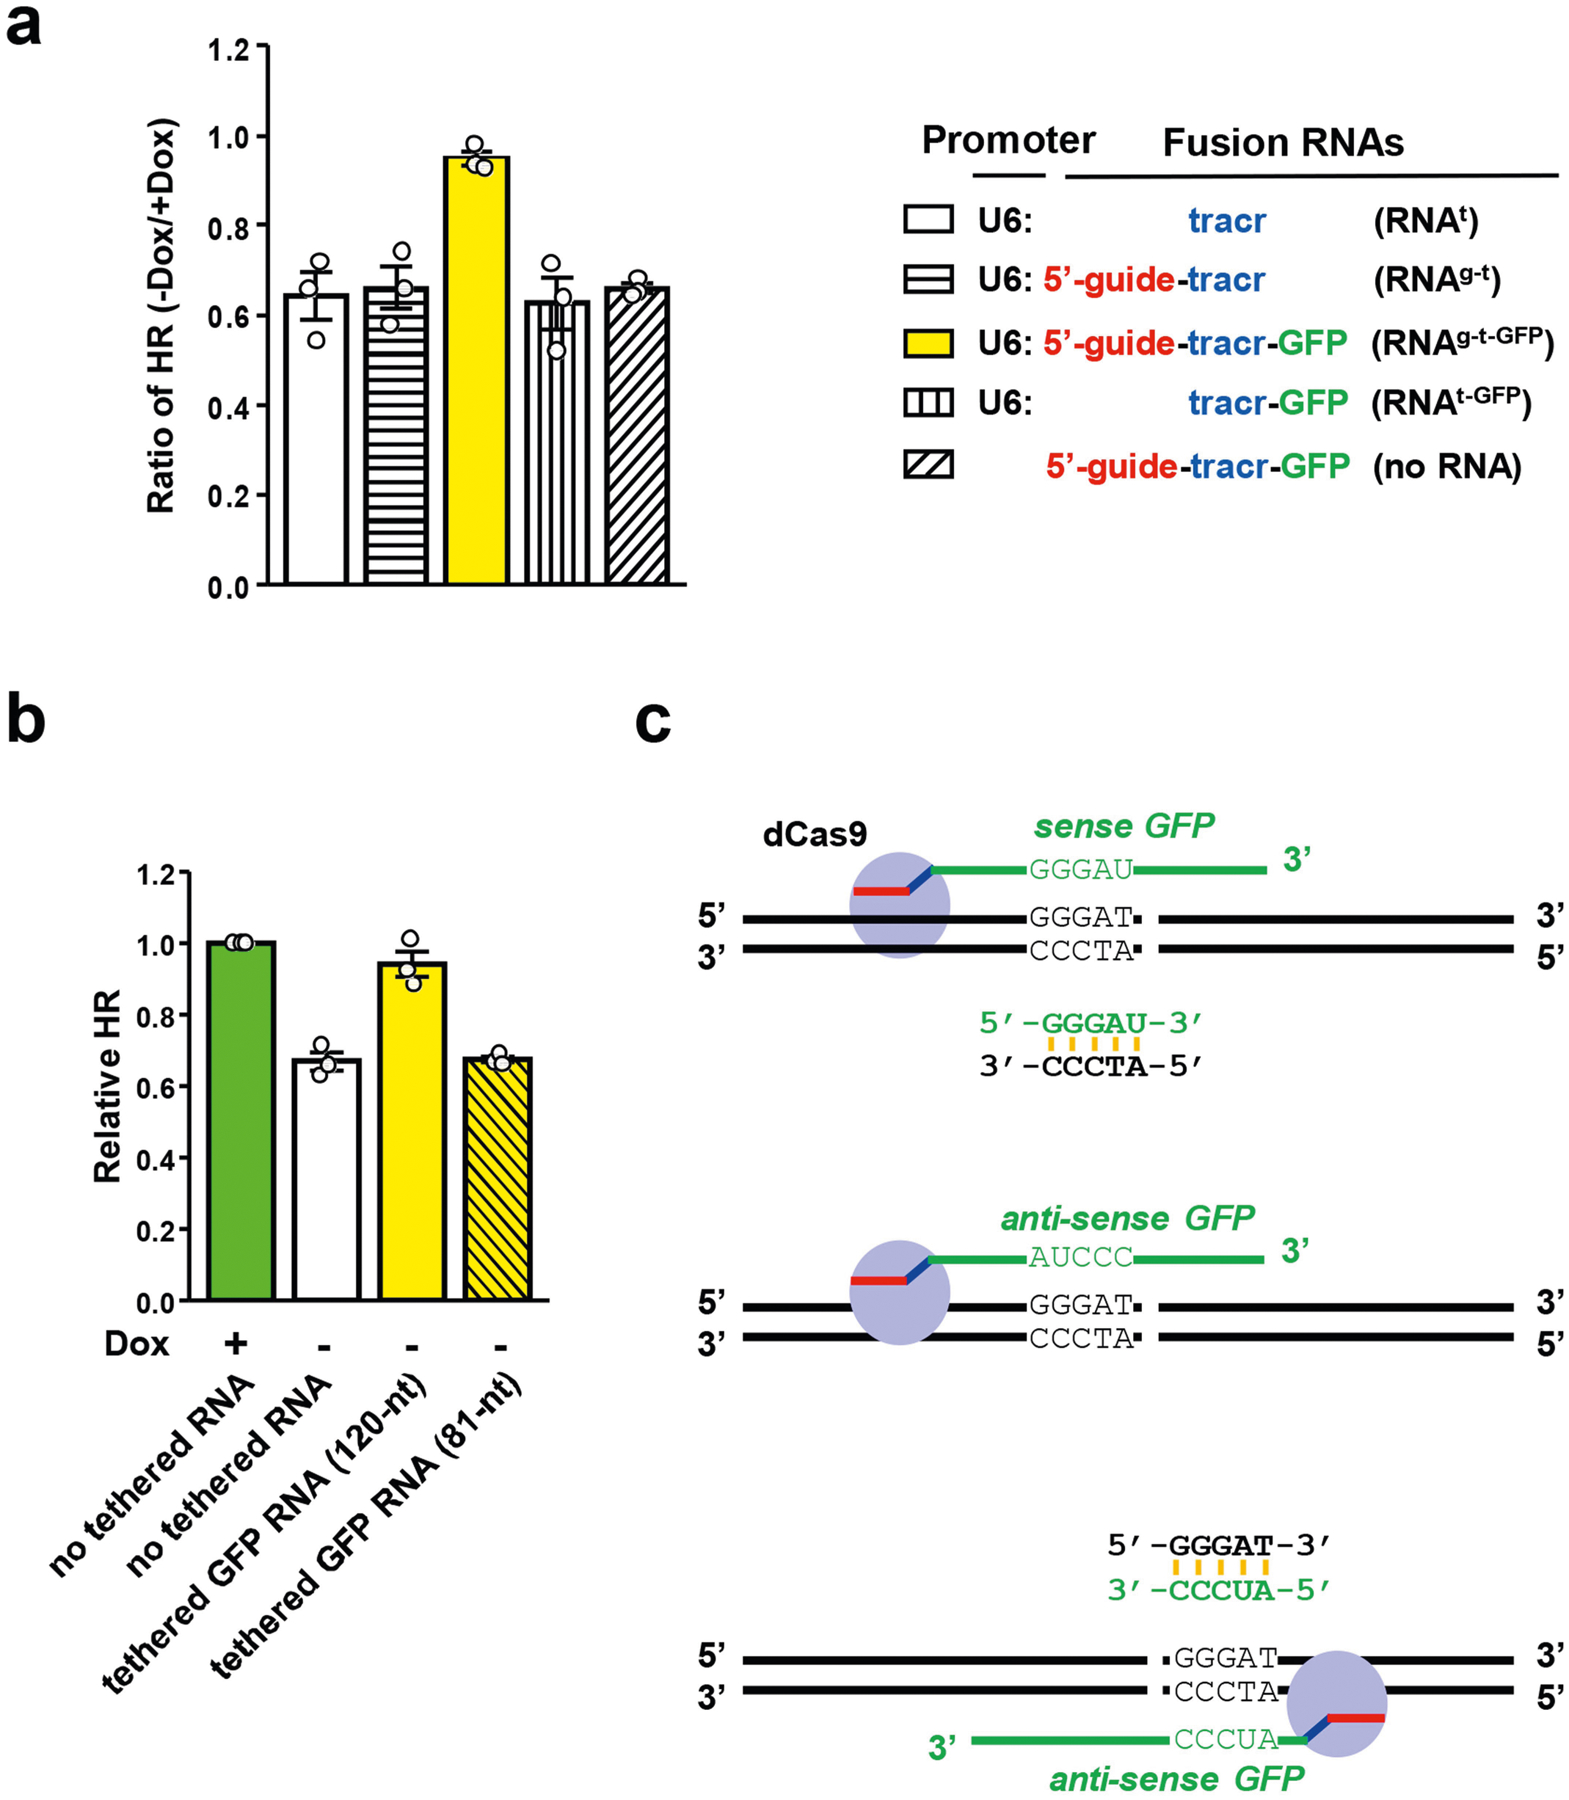
a, The indicated fusion RNAs were tethered to a unique sequence 5′ to the I-SceI site in sceGFP. HR efficiency in cells expressing various fusion RNAs was analysed by qPCR in the transcriptionally on and off states. For each RNA, the HR level in the transcriptionally on state is defined as 1. The ratios of HR levels between the transcriptionally off and on states (−Dox/+Dox) were determined. Data are mean ± s.e.m. (n = 3 independent experiments). b, Two fusion RNAs containing 120-nt or 81-nt GFP sequence were tethered to a unique sequence 5′ to the I-SceI site in sceGFP. Relative HR efficiencies in cells expressing either of the two fusion RNAs or no fusion RNA were measured by qPCR in the transcriptionally off state (−Dox). The HR efficiency of cells expressing no fusion RNA in the transcriptionally on state (+Dox) serves as a reference. Data are mean ± s.e.m. (n = 3 independent experiments). c, Schematic to explain why only sense GFP RNA and not anti-sense GFP RNA can hybridize DNA when tethered 5′ to the I-SceI site. It also explains why anti-sense GFP RNA can hybridize DNA when tethered 3′ to the I-SceI site.
Extended Data Fig. 3 |. Effects of depletion of RAD51AP1, UAF1 and RAD52 on HR.
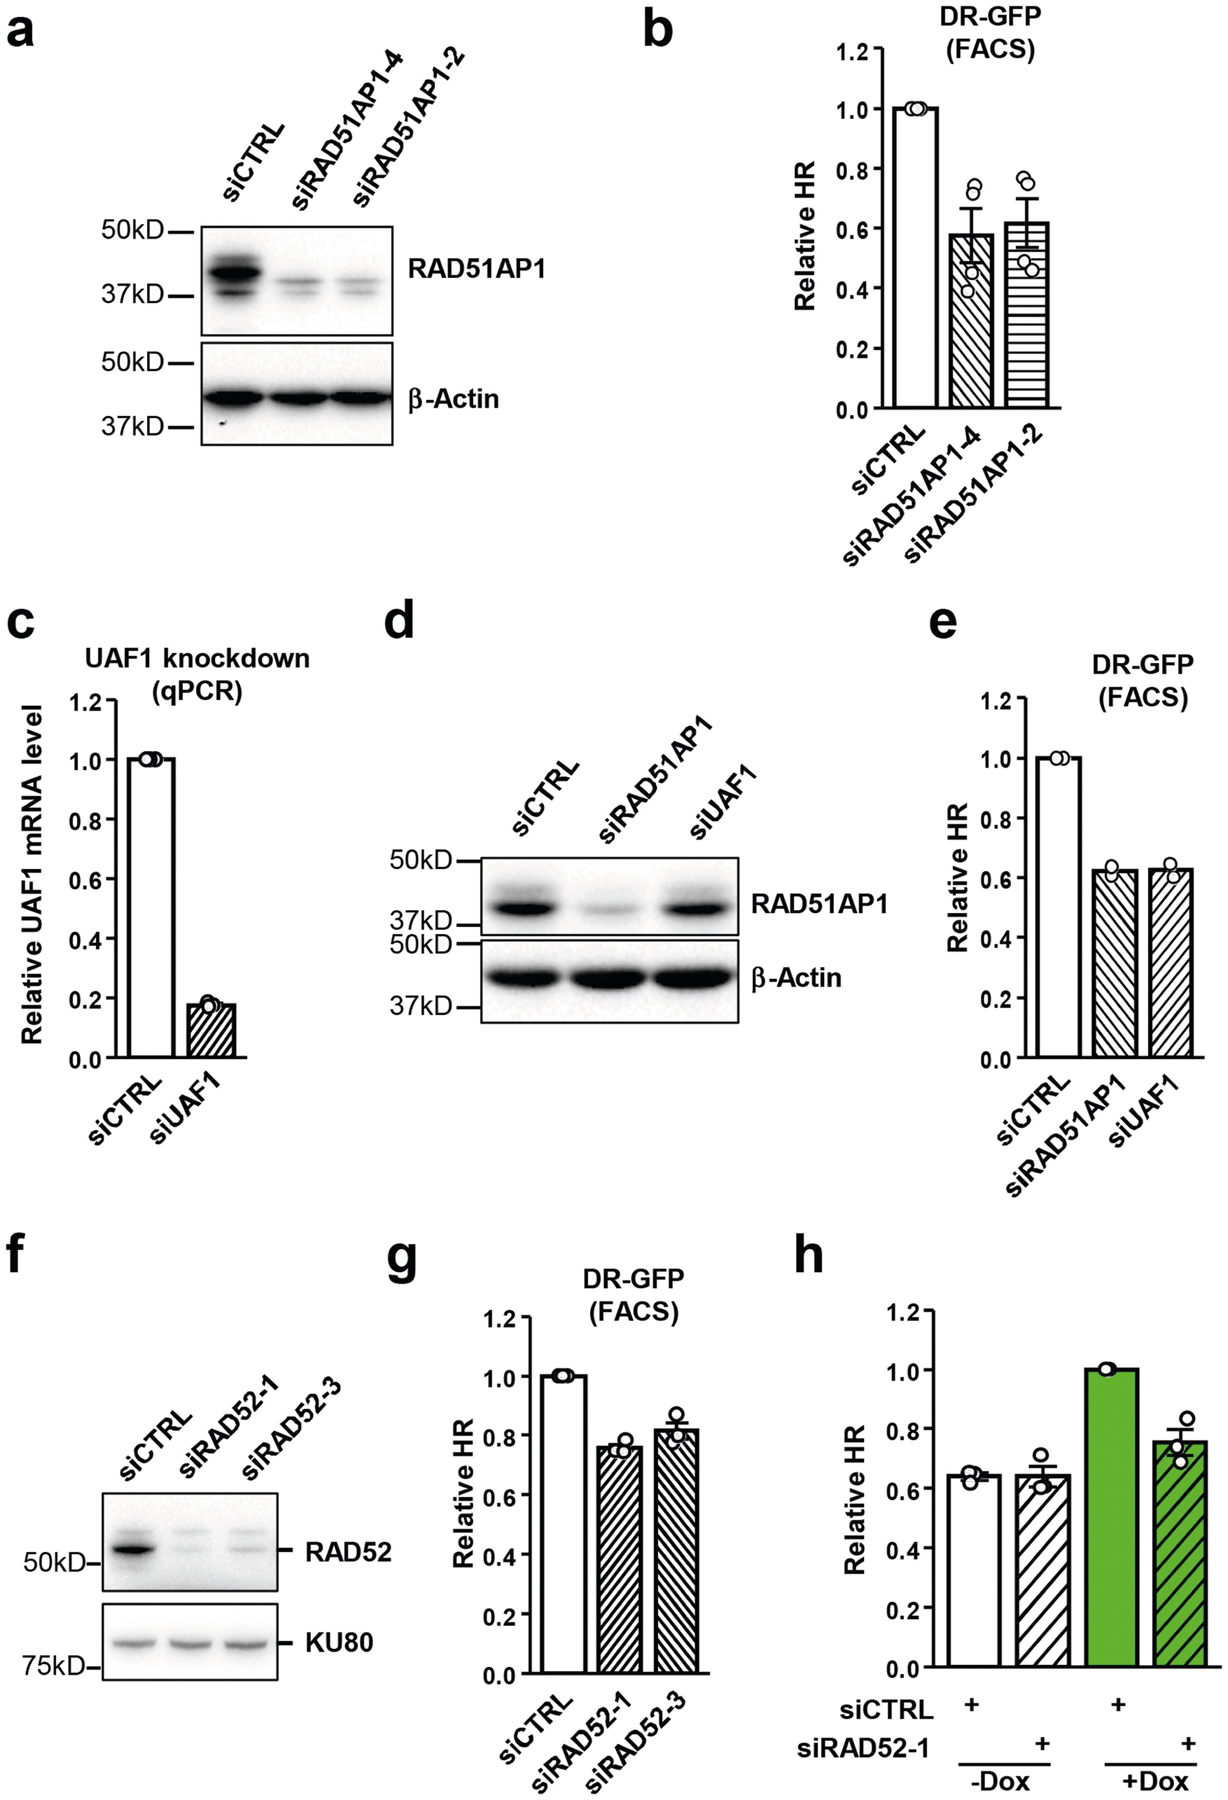
a, Cells were transfected with control or two independent RAD51AP1 siRNAs. Levels of endogenous RAD51AP1 and β-actin (loading control) were analysed by western blot. A representative western blot of three similar experiments is shown. b, HR efficiency was measured by FACS using U2OS-Tet-DR-GFP reporter cells after knockdown of RAD51AP1. Data are mean ± s.e.m (n = 3 independent experiments). c, Cells were transfected with control or UAF1 siRNA. Levels of UAF1 mRNA were analysed by RT–qPCR. Data are mean (n = 2 independent experiments). d, Cells were transfected with control, RAD51AP1 or UAF1 siRNA. Levels of endogenous RAD51AP1 and β-actin (loading control) were analysed by western blot. A representative western blot of three similar experiments is shown. e, HR efficiency was measured by FACS using U2OS-Tet-DR-GFP reporter cells after knockdown of RAD51AP1 or UAF1. Data are mean (n = 2 independent experiments). f, Cells were transfected with control or two independent RAD52 siRNAs. Levels of endogenous RAD52 and KU80 (loading control) were analysed by western blot. A representative western blot of three similar experiments is shown. g, HR efficiency was measured by FACS using U2OS-Tet-DR-GFP reporter cells after knockdown of RAD52. Data are mean ± s.e.m (n = 3 independent experiments). h, HR efficiency was measured by qPCR in transcriptionally on and off states (+/−Dox) after knockdown of RAD52. The HR efficiency of control siRNA transfected cells in the transcriptionally on state (+Dox) serves as a reference. Data are mean ± s.e.m (n = 3 independent experiments).
Extended Data Fig. 4 |. Functions and localization of RAD51AP1 in the DSB response.
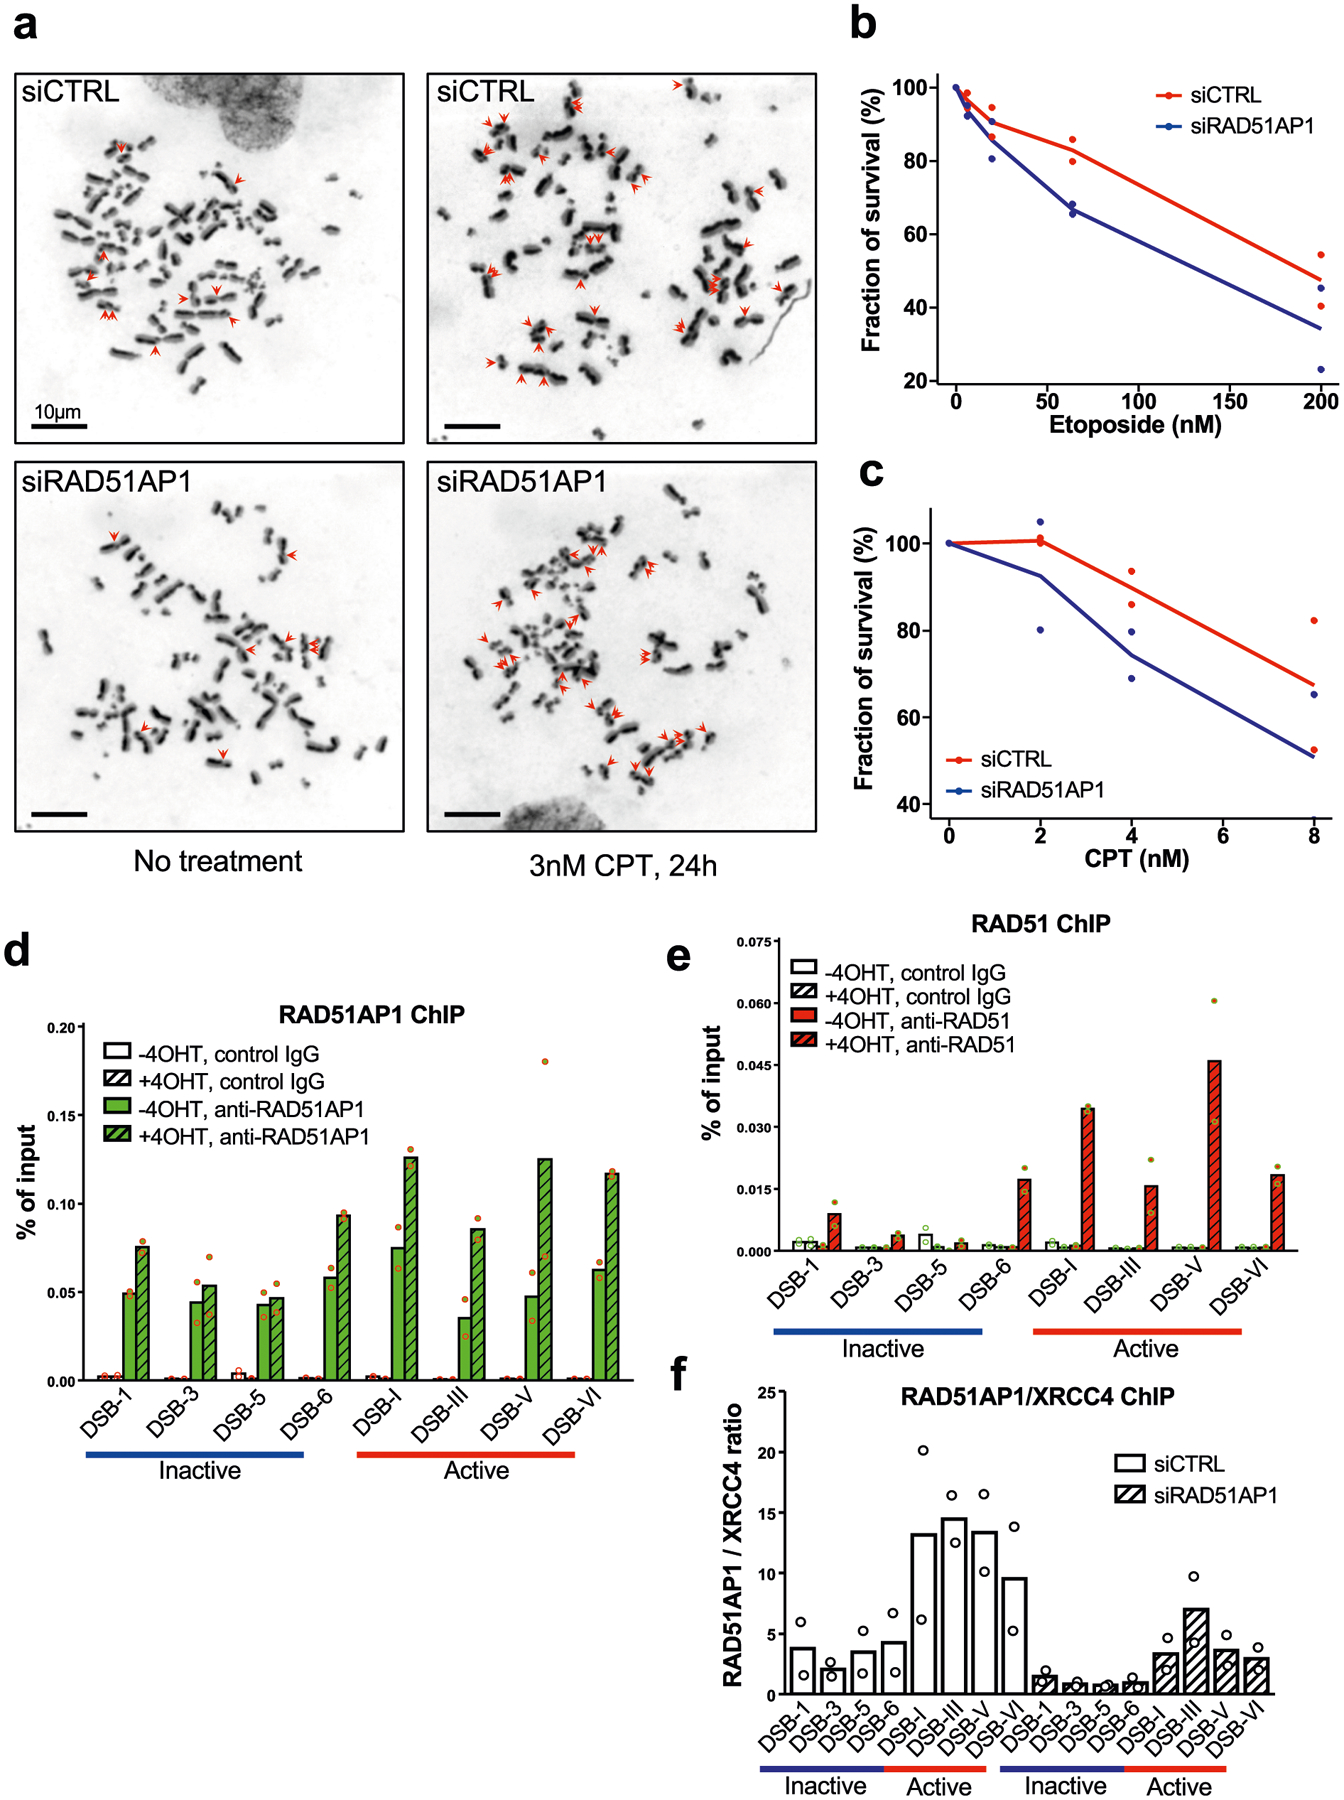
a, Representative mitotic spreads showing SCEs. Samples were prepared from U2OS cells transfected with control or RAD51AP1 siRNA, and treated with 3 nM CPT or vehicle for 24 h. Scale bars, 10 μm. b, c, Survival analyses of cells treated with etoposide (b) or CPT (c). Data are mean (n = 2 independent experiments). d, e, ChIP–qPCR analysis of RAD51AP1 (d) or RAD51 (e) at sites of AsiSI-induced DSBs in transcriptionally active and inactive regions. AsiSI-ER was activated by 4-OHT. f, RAD51AP1 ChIP signals at several transcriptionally active and inactive AsiSI sites were normalized to XRCC4 ChIP signals. XRCC4, which binds to DSBs independently of transcription, serves as a reference for RAD51AP1. RAD51AP1 knockdown substantially reduced RAD51AP1 ChIP signals, confirming the specificity of RAD51AP1 ChIP. Data in a–c are mean (n = 2 independent experiments).
Extended Data Fig. 5 |. Regulation of RAD51AP1 localization to DSBs.
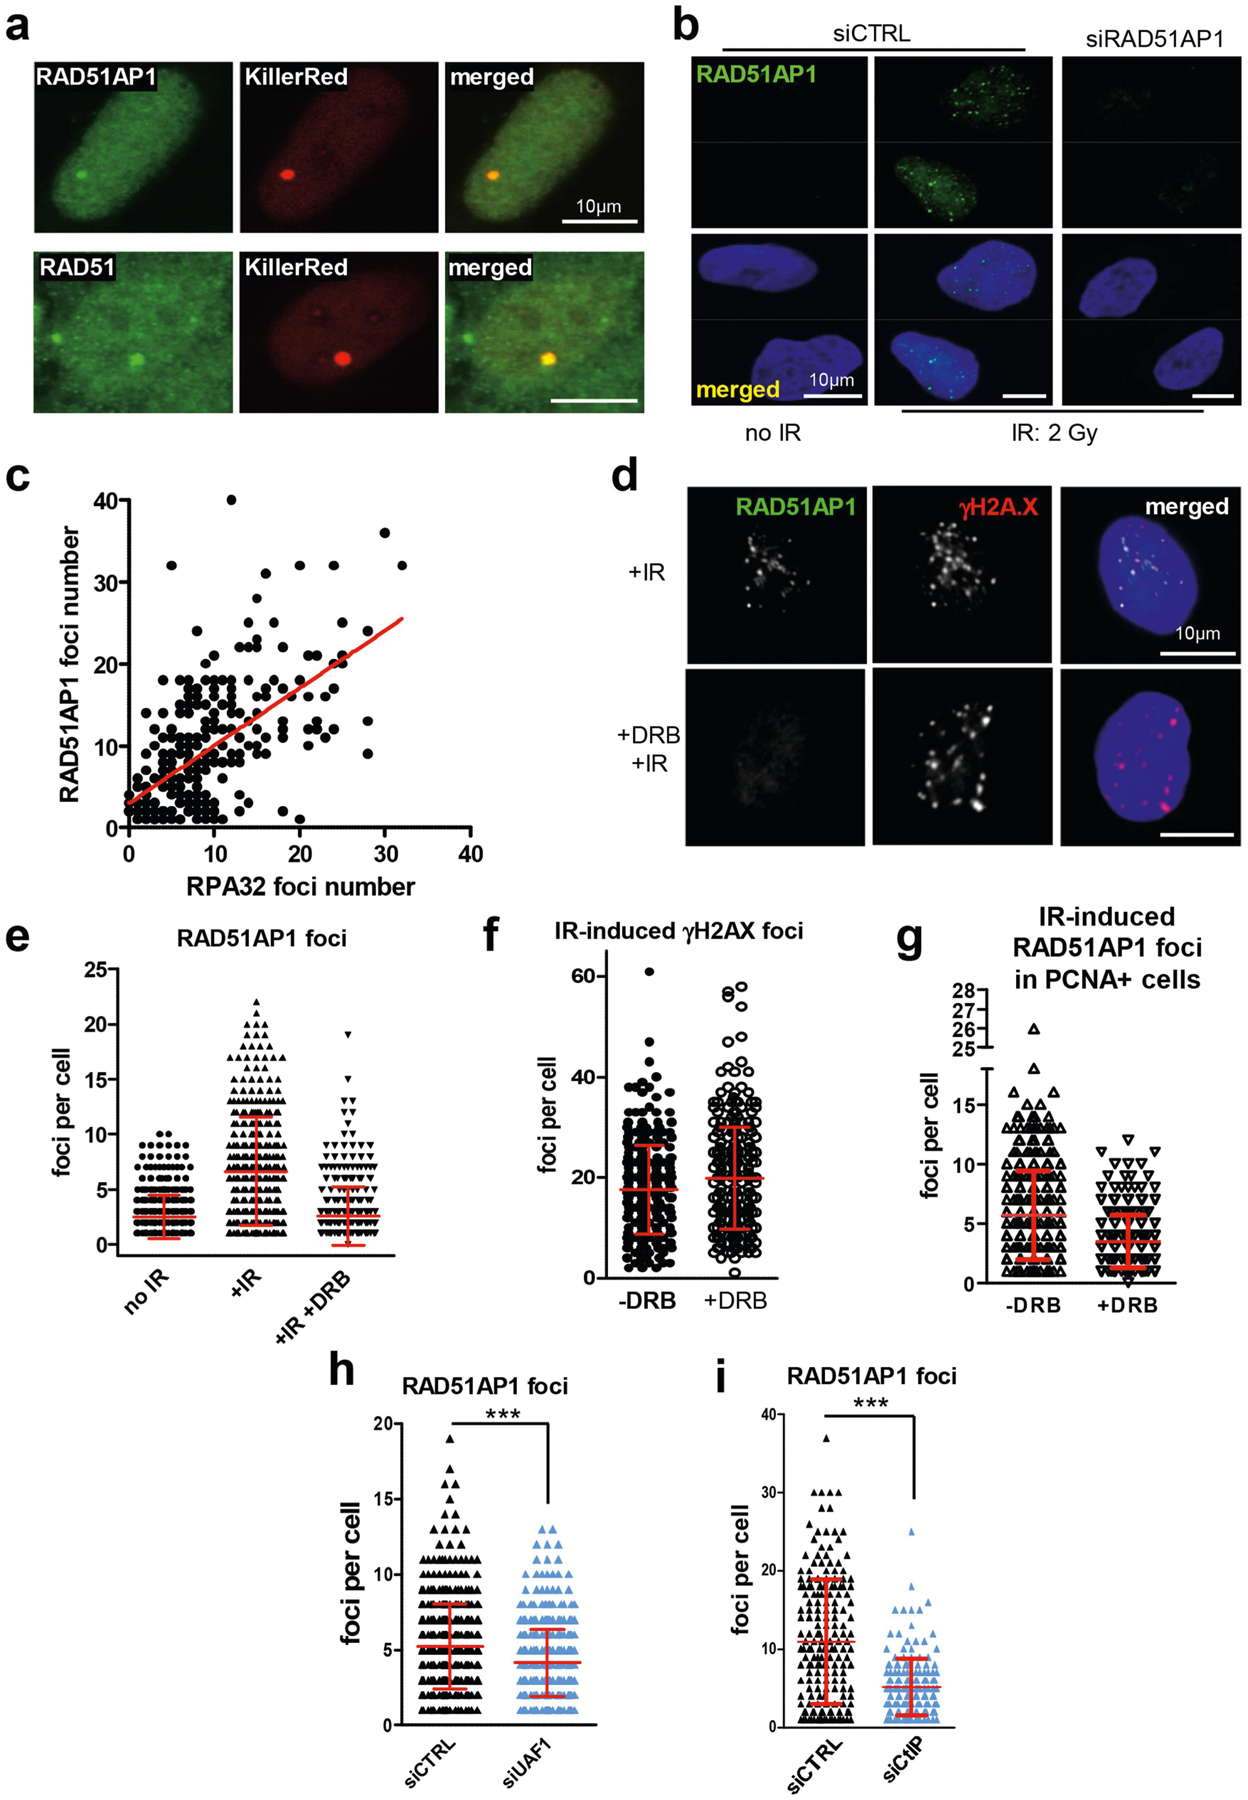
a, U2OS cells carrying an array of tetracycline responsive elements (TREs) were transfected with a plasmid expressing the TetR-VP16-KillerRed (TA-KR) fusion protein. The TA-KR fusion protein binds the TRE array and induces DSBs upon light activation. The formation of RAD51AP1 or RAD51 foci at the TA-KR-marked locus was analysed by immunostaining. Scale bars, 10 μm. b, Immunostaining of RAD51AP1 in cells that were not irradiated or were irradiated with 2 Gy IR. Cells were analysed 2 h after IR. Scale bars, 10 μm. c, Correlation between the numbers of RAD51AP1 and RPA32 foci in IR-treated cells as determined by linear regression. The numbers of RAD51AP1 and RPA32 foci were quantified in individual cells (n = 260 cells analysed in one experiment). Individual cells were plotted according to the numbers of RAD51AP1 and RPA32 foci in them. d–g, Asynchronously growing U2OS cells were treated with or without DRB for 4 h, exposed to 2 Gy IR or mock-treated, and analysed in 2 h. d, Immunostaining of RAD51AP1 and γH2AX. Scale bars, 10 μm. e, Numbers of RAD51AP1 foci in individual cells were plotted as mean ± s.d. (n = 401 cells for no IR, n = 408 cells for +IR, and n = 408 cells for +IR +DRB, analysed in one experiment). f, Numbers of γH2AX foci in individual cells were plotted as mean ± s.d. (n = 313 cells for − DRB and n = 294 cells for +DRB, analysed in one experiment). g, Numbers of RAD51AP1 foci in PCNA+ cells were plotted as mean ± s.d. (n = 360 cells for −DRB and n = 303 cells for +DRB, analysed in one experiment). h, i, U2OS cells transfected with control, UAF1 (h) or CtIP (i) siRNA were irradiated with 2 Gy IR. Immunostaining of RAD51AP1 was done 2 h after IR. Numbers of RAD51AP1 foci in individual cells were plotted as mean ±s.d. ***P < 0.001 (two-sided Student’s t test; P < 0.0001 in h, i. h, n = 483 cells for siCTRL, n = 527 cells for siUAF1 analysed in one experiment. i, n = 200 cells for siCTRL, n = 182 cells for siCtIP analysed in one experiment.
Extended Data Fig. 6 |. Characterizations of the ssDNA-, ssRNA- and dsDNA-binding activities of RAD51AP1.
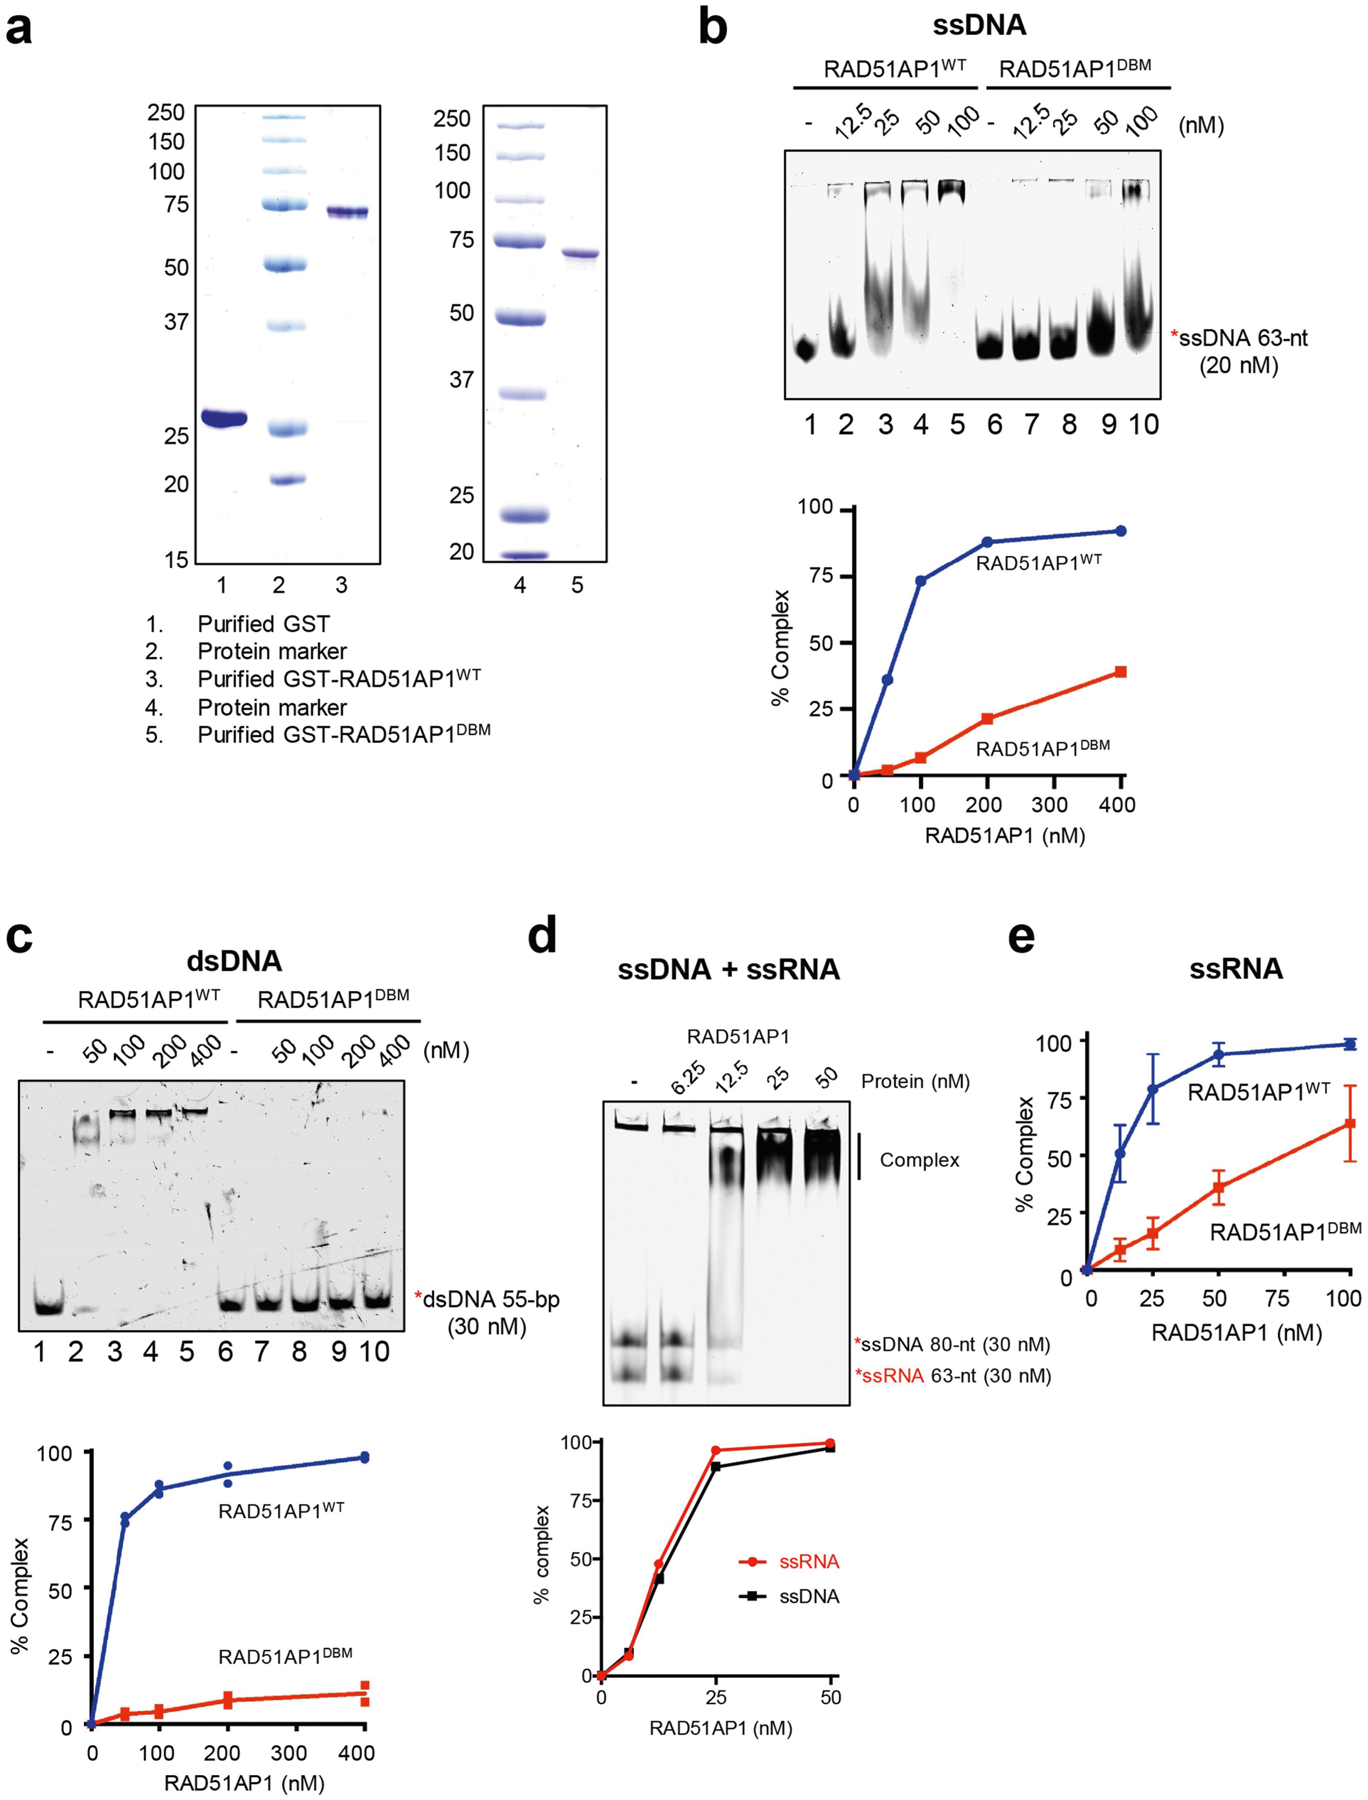
a, Purified GST, GST-RAD51AP1WT and GST-RAD51AP1DBM were analysed by SDS–PAGE stained with Coomassie blue. Representative gel images from 3 similar experiments are shown. b, Increasing concentrations of RAD51AP1WT or RAD51AP1DBM (0, 12.5, 25, 50 and 100 nM) were incubated with labelled 63-nt ssDNA. Formation of the RAD51AP1–ssDNA complex was analysed by EMSA. The efficiency of complex formation was determined by quantifying the reduction in free ssDNA. Representative results from three similar experiments are shown. c, Increasing concentrations of RAD51AP1WT or RAD51AP1DBM (0, 50, 100, 200 and 400 nM) were incubated with labelled 55-bp dsDNA. Formation of the RAD51AP1–dsDNA complex was analysed by EMSA. The efficiency of complex formation was determined by quantifying the reduction in free dsDNA. Data are mean (n = 2 independent experiments). d, Increasing concentrations of RAD51AP1WT (0, 6.25, 12.5, 25 and 50 nM) were incubated with labelled 63-nt ssRNA and 80-nt ssDNA. Formation of the complex was analysed by EMSA. The efficiency of complex formation was determined by quantifying the reduction in free ssDNA or ssRNA. Representative results from three similar experiments are shown. e, In Fig. 4a, the efficiency of RAD51AP1–ssRNA complex formation was determined by quantifying the reduction in free ssRNA. Data are mean ± s.d. (n = 3 independent experiments).
Extended Data Fig. 7 |. Characterizations of the RNA-binding and R-loop-formation activities of RAD51AP1.
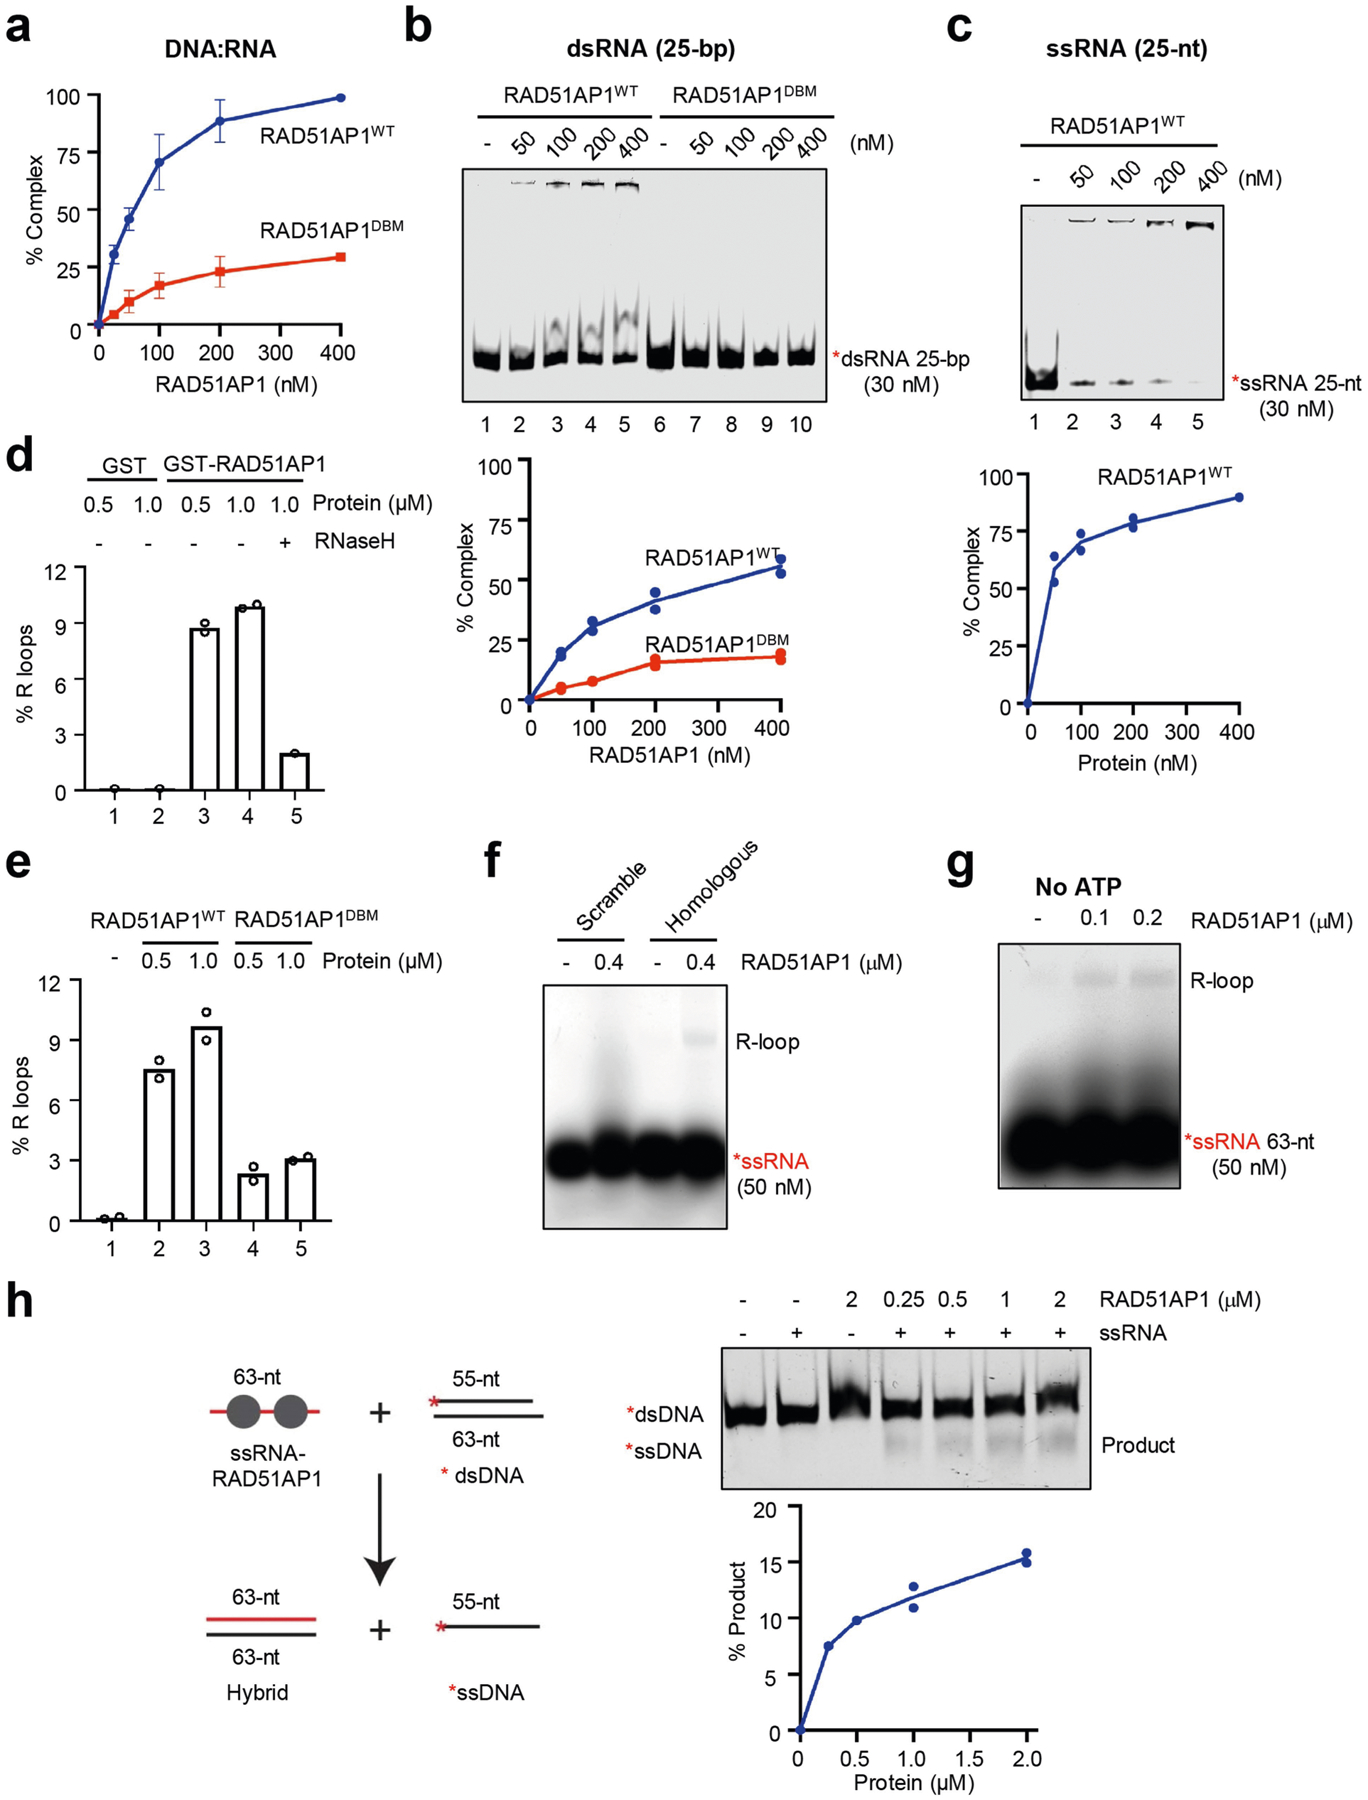
a, In Fig. 4b, the efficiency of RAD51AP1–hybrid complex formation was determined by quantifying the reduction in free DNA–RNA hybrid. Data are mean ± s.d. (n = 3 independent experiments). b, Increasing concentrations of RAD51AP1WT or RAD51AP1DBM (0, 50, 100, 200 and 400 nM) were incubated with labelled 25-bp dsRNA. Formation of the RAD51AP1–dsRNA complex was analysed by EMSA. The efficiency of complex formation was determined by quantifying the reduction in free dsRNA. Data are presented as mean (n = 2 independent experiments). c, Increasing concentrations of RAD51AP1WT (0, 50, 100, 200 and 400 nM) were incubated with labelled 25-nt ssRNA. Formation of the RAD51AP1–ssRNA complex was analysed by EMSA. The efficiency of complex formation was determined by quantifying the reduction in free ssRNA. Data are mean (n = 2 independent experiments). d, In Fig. 4c, the efficiency of R-loop formation was determined by quantifying the shifted and unshifted bands in light exposures of the gel. Data are mean (n = 2 independent experiments). e, In Fig. 4d, the efficiency of R-loop formation was determined as in d. Data are mean (n = 2 independent experiments). f, In vitro R-loop formation with RAD51AP1 (0.4 μM) and labelled scrambled ssRNA or ssRNA (50 nM) with homology to dsDNA. Formation of R-loops was analysed by native gel electrophoresis. Representative results from three similar experiments are shown. g, R-loop formation with increasing concentration of RAD51AP1 (0.1, 0.2 μM), labelled ssRNA (50 nM) and a dsDNA plasmid containing a sequence homologous to the ssRNA in buffer D without ATP. Formation of R-loops was analysed by native gel electrophoresis. Representative results from three similar experiments are shown. h, In vitro strand exchange between ssRNA and dsDNA. Increasing concentrations of RAD51AP1 (0.25, 0.5, 1, 2 μM) were first incubated with ssRNA (63 nt, 200 nM) and then with fluorescent labelled linear dsDNA (30 nM). Strand-exchanged products were separated by 10% native polyacrylamide-TBE gel and imaged. Data are mean (n = 2 independent experiments).
Extended Data Fig. 8 |. Comparing RAD51AP1, RAD51 and RAD52 in R-loop formation.
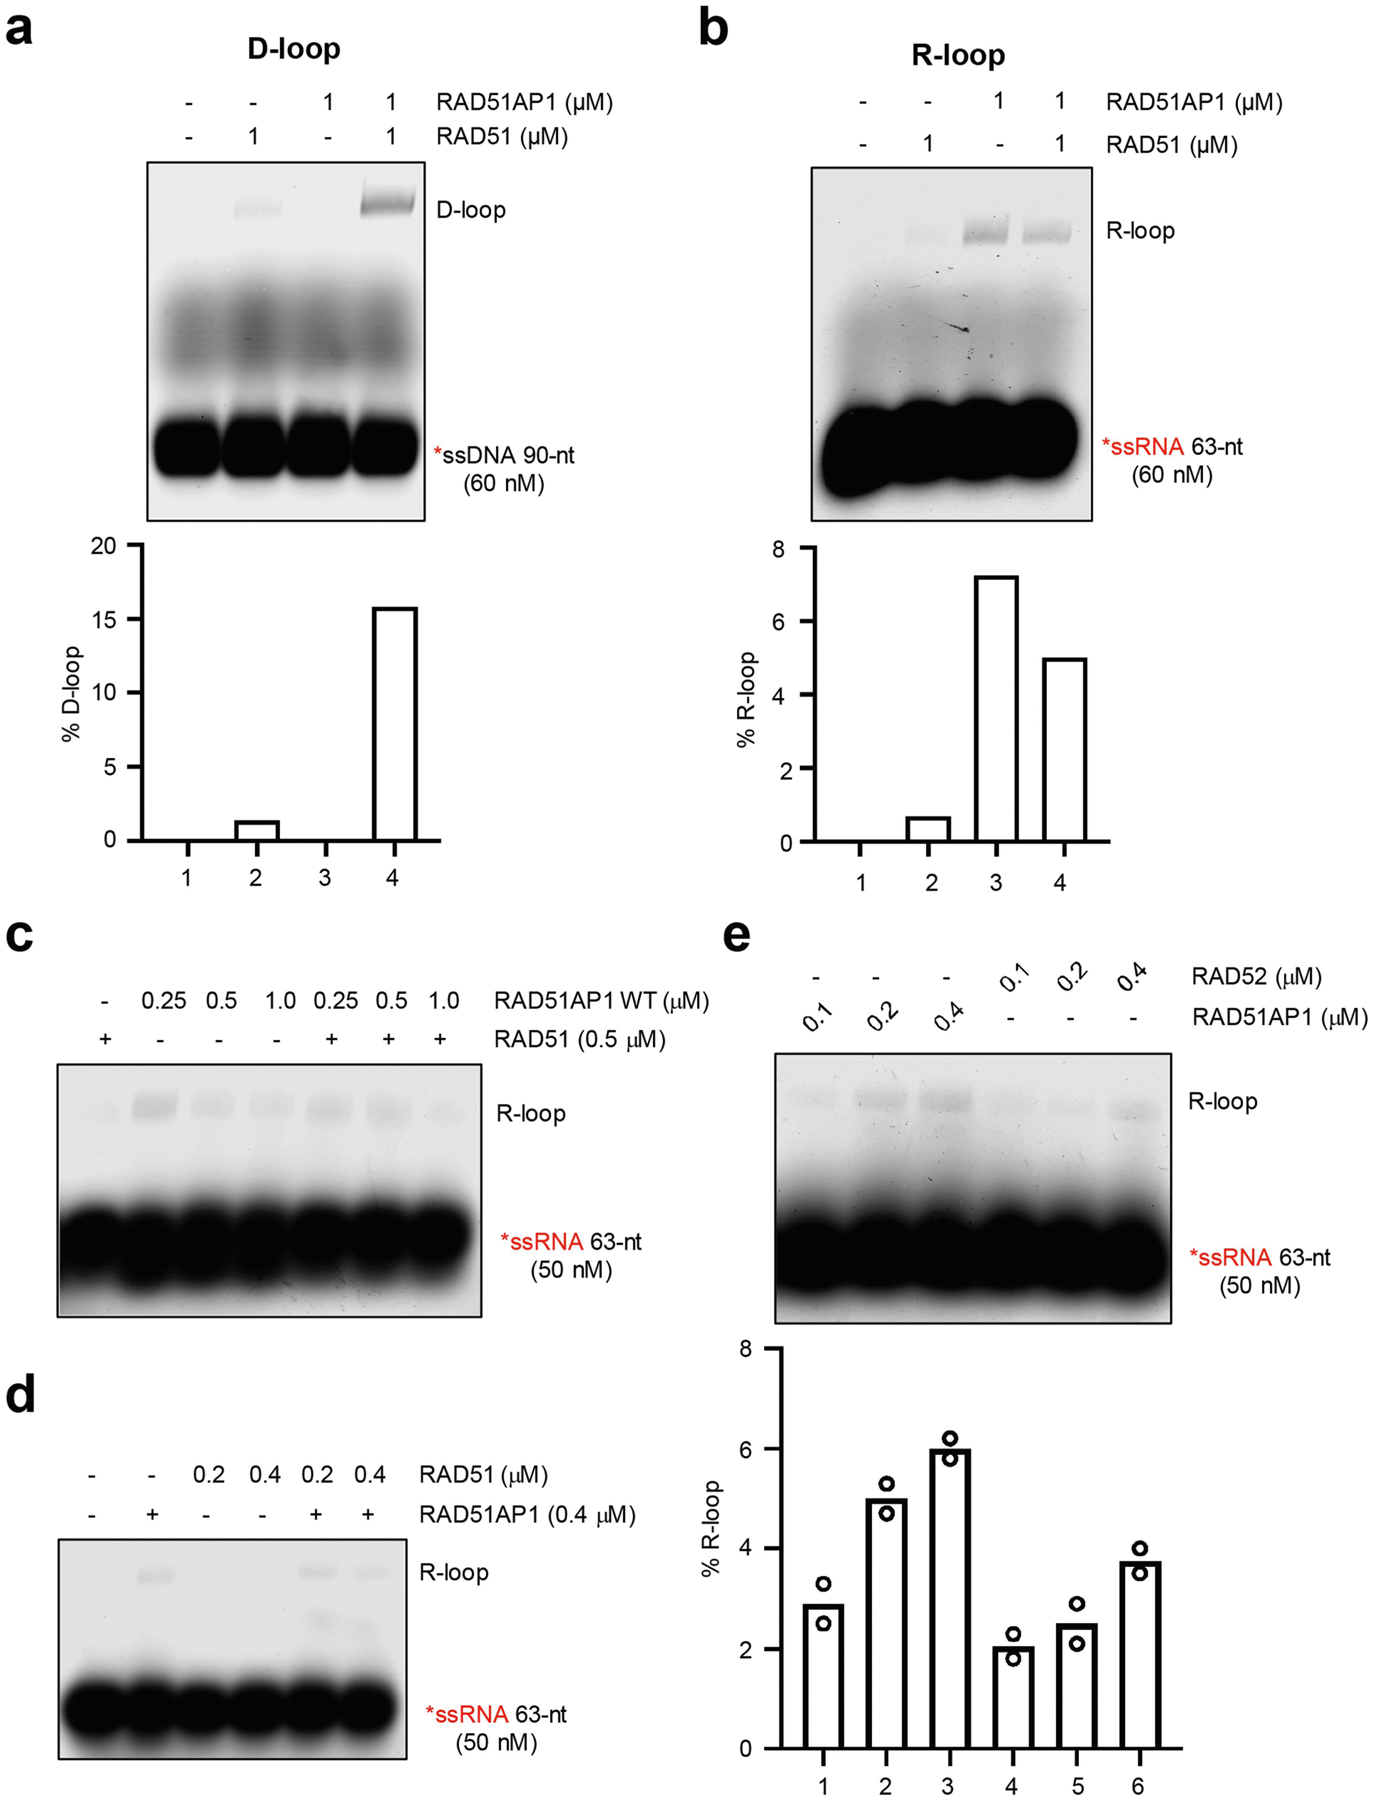
a, In vitro D-loop formation with RAD51AP1 and RAD51. RAD51 was incubated with labelled 90-nt ssDNA for 5 min and then with RAD51AP1 for another 5 min. A dsDNA plasmid containing a sequence homologous to the ssDNA was then added to the reactions. Formation of D-loops was analysed by native gel electrophoresis. The efficiency of D-loop formation was determined by quantifying the shifted and unshifted bands in a light exposure of the gel. Representative results from three similar experiments are shown. b, In vitro R-loop formation with RAD51AP1 and RAD51. RAD51 was incubated with labelled 63-nt ssRNA and then with RAD51AP1 for another 5 min. A dsDNA plasmid containing a sequence homologous to the ssRNA was then added to the reactions. The concentrations of RAD51 and RAD51AP1 are indicated. Formation of R-loops was analysed by native gel electrophoresis. Representative results from three similar experiments are shown. c, In vitro R-loop formation with RAD51AP1 and RAD51 was analysed as in b. The concentrations of RAD51 and RAD51AP1 are indicated. Representative results from three similar experiments are shown. d, RAD51AP1 was incubated with labelled 63-nt ssRNA for 5 min and then with increasing concentrations of RAD51 for another 5 min. A dsDNA plasmid containing a sequence homologous to the ssRNA was then added to the reactions. Formation of R-loops were analysed by native gel electrophoresis. Representative results from two similar experiments are shown. e, In vitro R-loop formation activities of RAD51AP1 and RAD52. Increasing concentrations of RAD51AP1 (0.1, 0.2 and 0.4 μM) or RAD52 (0.1, 0.2 and 0.4 μM) were incubated with labelled 63-nt ssRNA and then with a dsDNA plasmid containing a sequence homologous to the ssRNA. Formation of R-loops were analysed by native gel electrophoresis. The efficiency of R-loop formation was determined by quantifying the shifted and unshifted bands in a light exposure of the gel. Data are mean (n = 2 independent experiments).
Extended Data Fig. 9 |. UAF1 stimulates RAD51AP1-mediated R-loop formation in vitro.
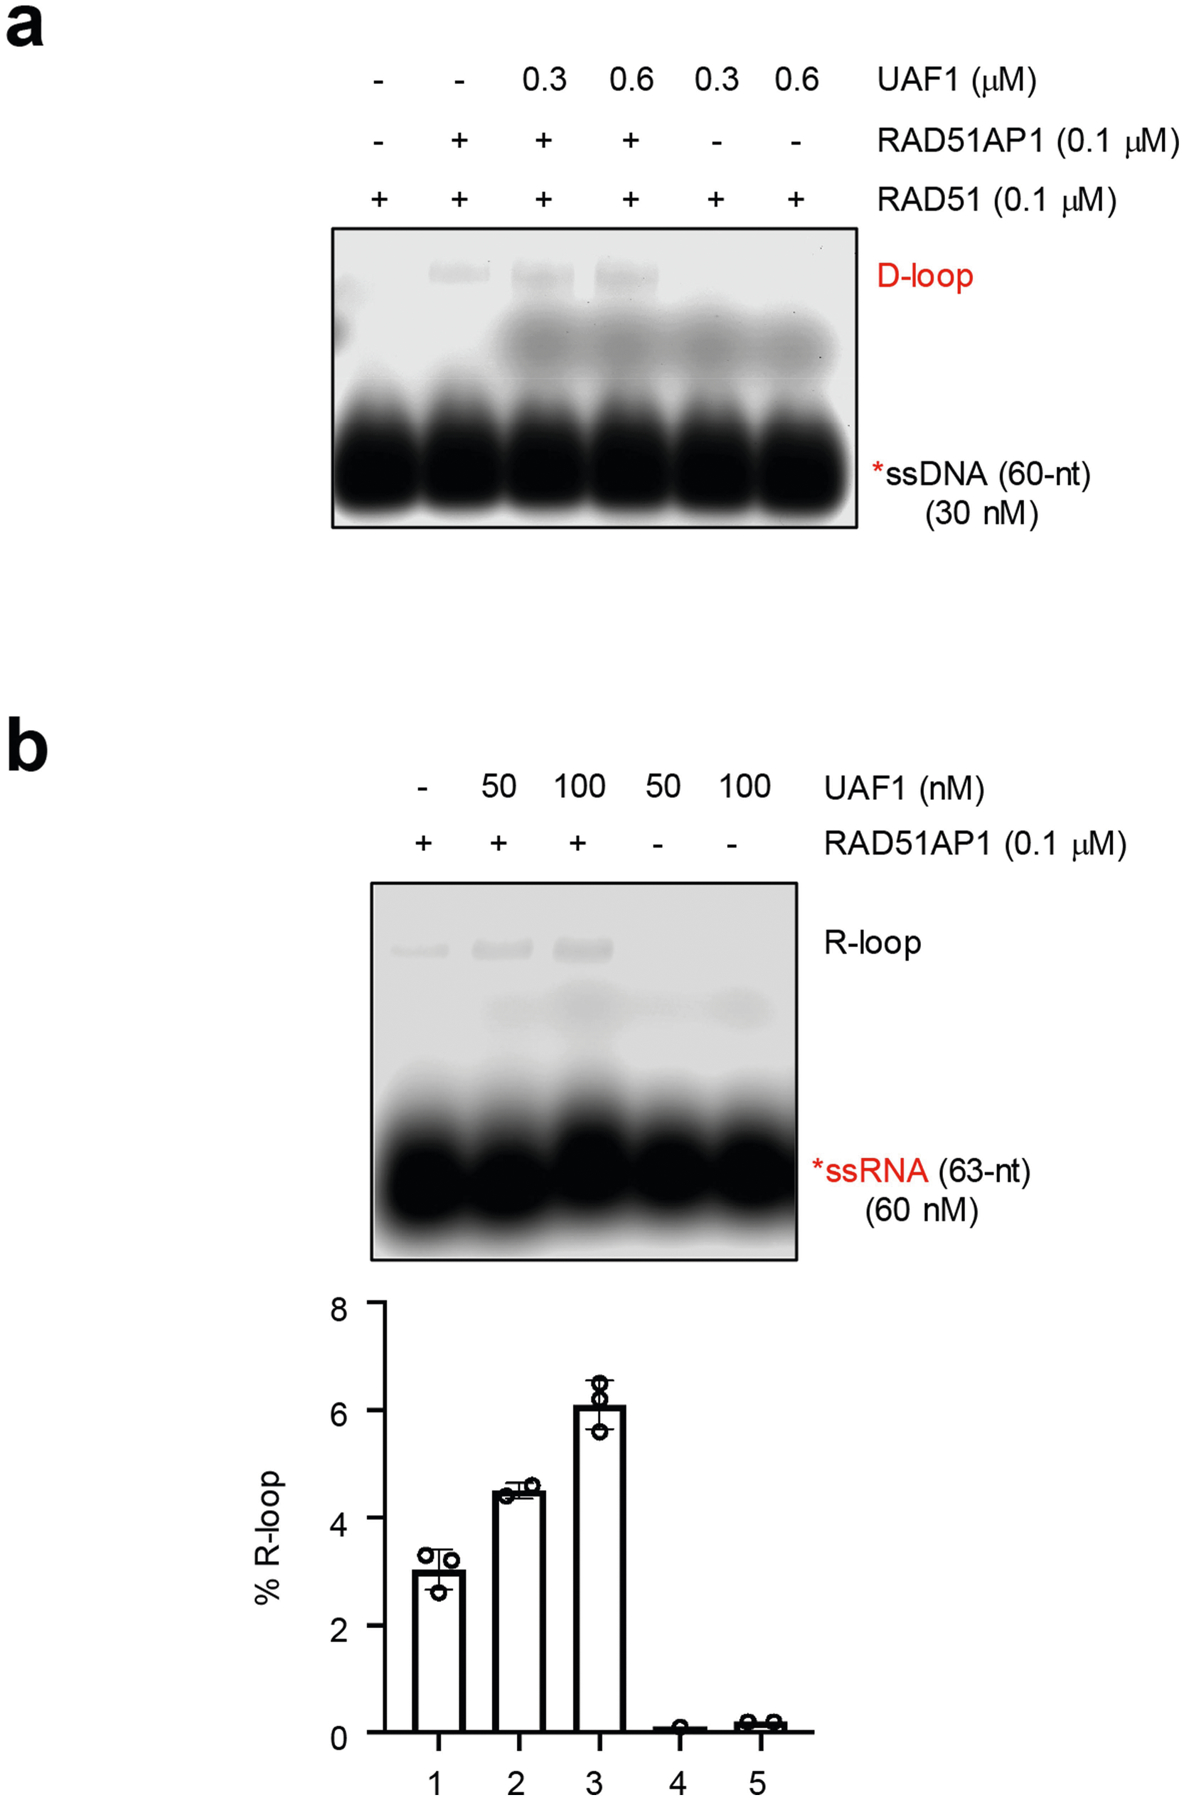
a, In vitro D-loop formation with RAD51 or the RAD51AP1–UAF1 complex. RAD51 was incubated with labelled 60-nt ssDNA and then with RAD51AP1 or the RAD51AP1–UAF1 complex. A dsDNA plasmid containing a sequence homologous to the ssDNA was then added to the reactions. Formation of D-loops was analysed by native gel electrophoresis. Representative results from 2 similar experiments are shown. b, In vitro R-loop formation with the RAD51AP1–UAF1 complex. Preformed RAD51AP1–UAF1 complexes were incubated with labelled 63-nt ssRNA and then with a dsDNA plasmid containing a sequence homologous to the ssRNA. Formation of R-loops was analysed by native gel electrophoresis. The efficiency of R-loop formation was determined by quantifying the shifted and unshifted bands in a light exposure of the gel. Data are mean ± s.d. (n = 3 independent experiments).
Extended Data Fig. 10 |. Characterizations of RNA transcripts and DNA–RNA hybrids at sceGFP and iGFP loci.
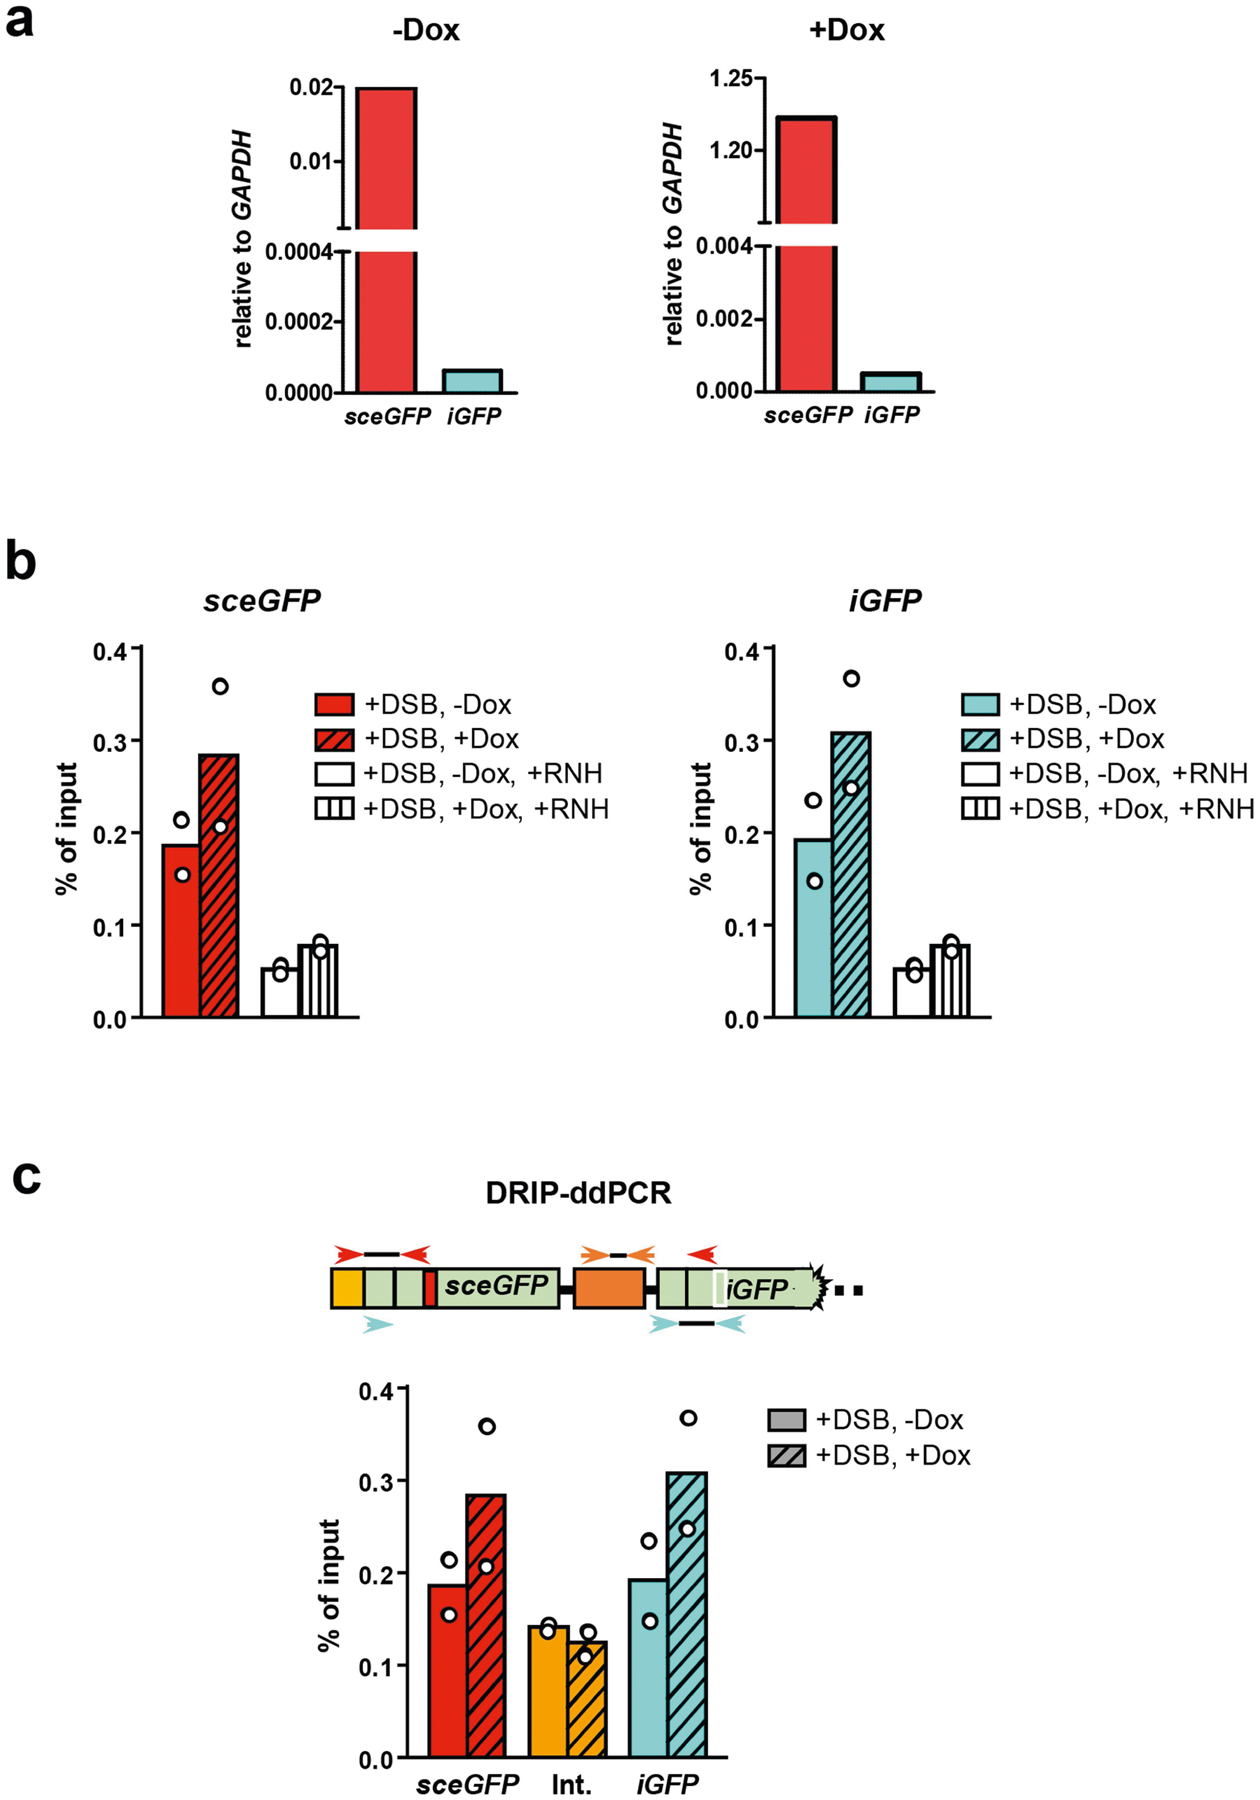
a, Total RNA isolated from U2OS-Tet-DR-GFP cells treated or untreated with Dox were digested with dsDNase and reverse-transcribed using random primers. cDNA was subjected to qPCR analysis to determine the relative levels of sceGFP and iGFP transcripts using the GAPDH transcript as a reference. The sceGFP transcript was increased by more than 60-fold by Dox. In the absence of Dox, the sceGFP transcript was more than 300-fold more abundant than the iGFP transcript. In the presence of Dox, the sceGFP transcript was more than 2,500-fold more abundant than the iGFP transcript. These results suggest that only sceGFP, and not iGFP, is transcribed in the presence of Dox. b, The accumulation of DNA–RNA hybrids in sceGFP and iGFP was analysed by DRIP–ddPCR as in Fig. 4f. In the +RNH (RNaseH) samples, extracted total nucleic acids were treated with RNaseH before being subjected to DRIP analysis. Data are mean (n = 2 independent experiments). c, The levels of DNA–RNA hybrids were tested by DRIP–ddPCR using primers that specifically detect an internal region between sceGFP and iGFP (orange arrowheads). These specific primers do not detect any sceGFP or iGFP containing DNA fragments after the restriction digestion during DRIP–ddPCR. The levels of DNA–RNA hybrids were measured in transcriptionally on and off states (+/− Dox) after DSB induction (+I-SceI). Data are mean (n = 2 independent experiments).
Extended Data Fig. 11 |. RAD51AP1 promotes the formation of DR-loops in donor DNA.
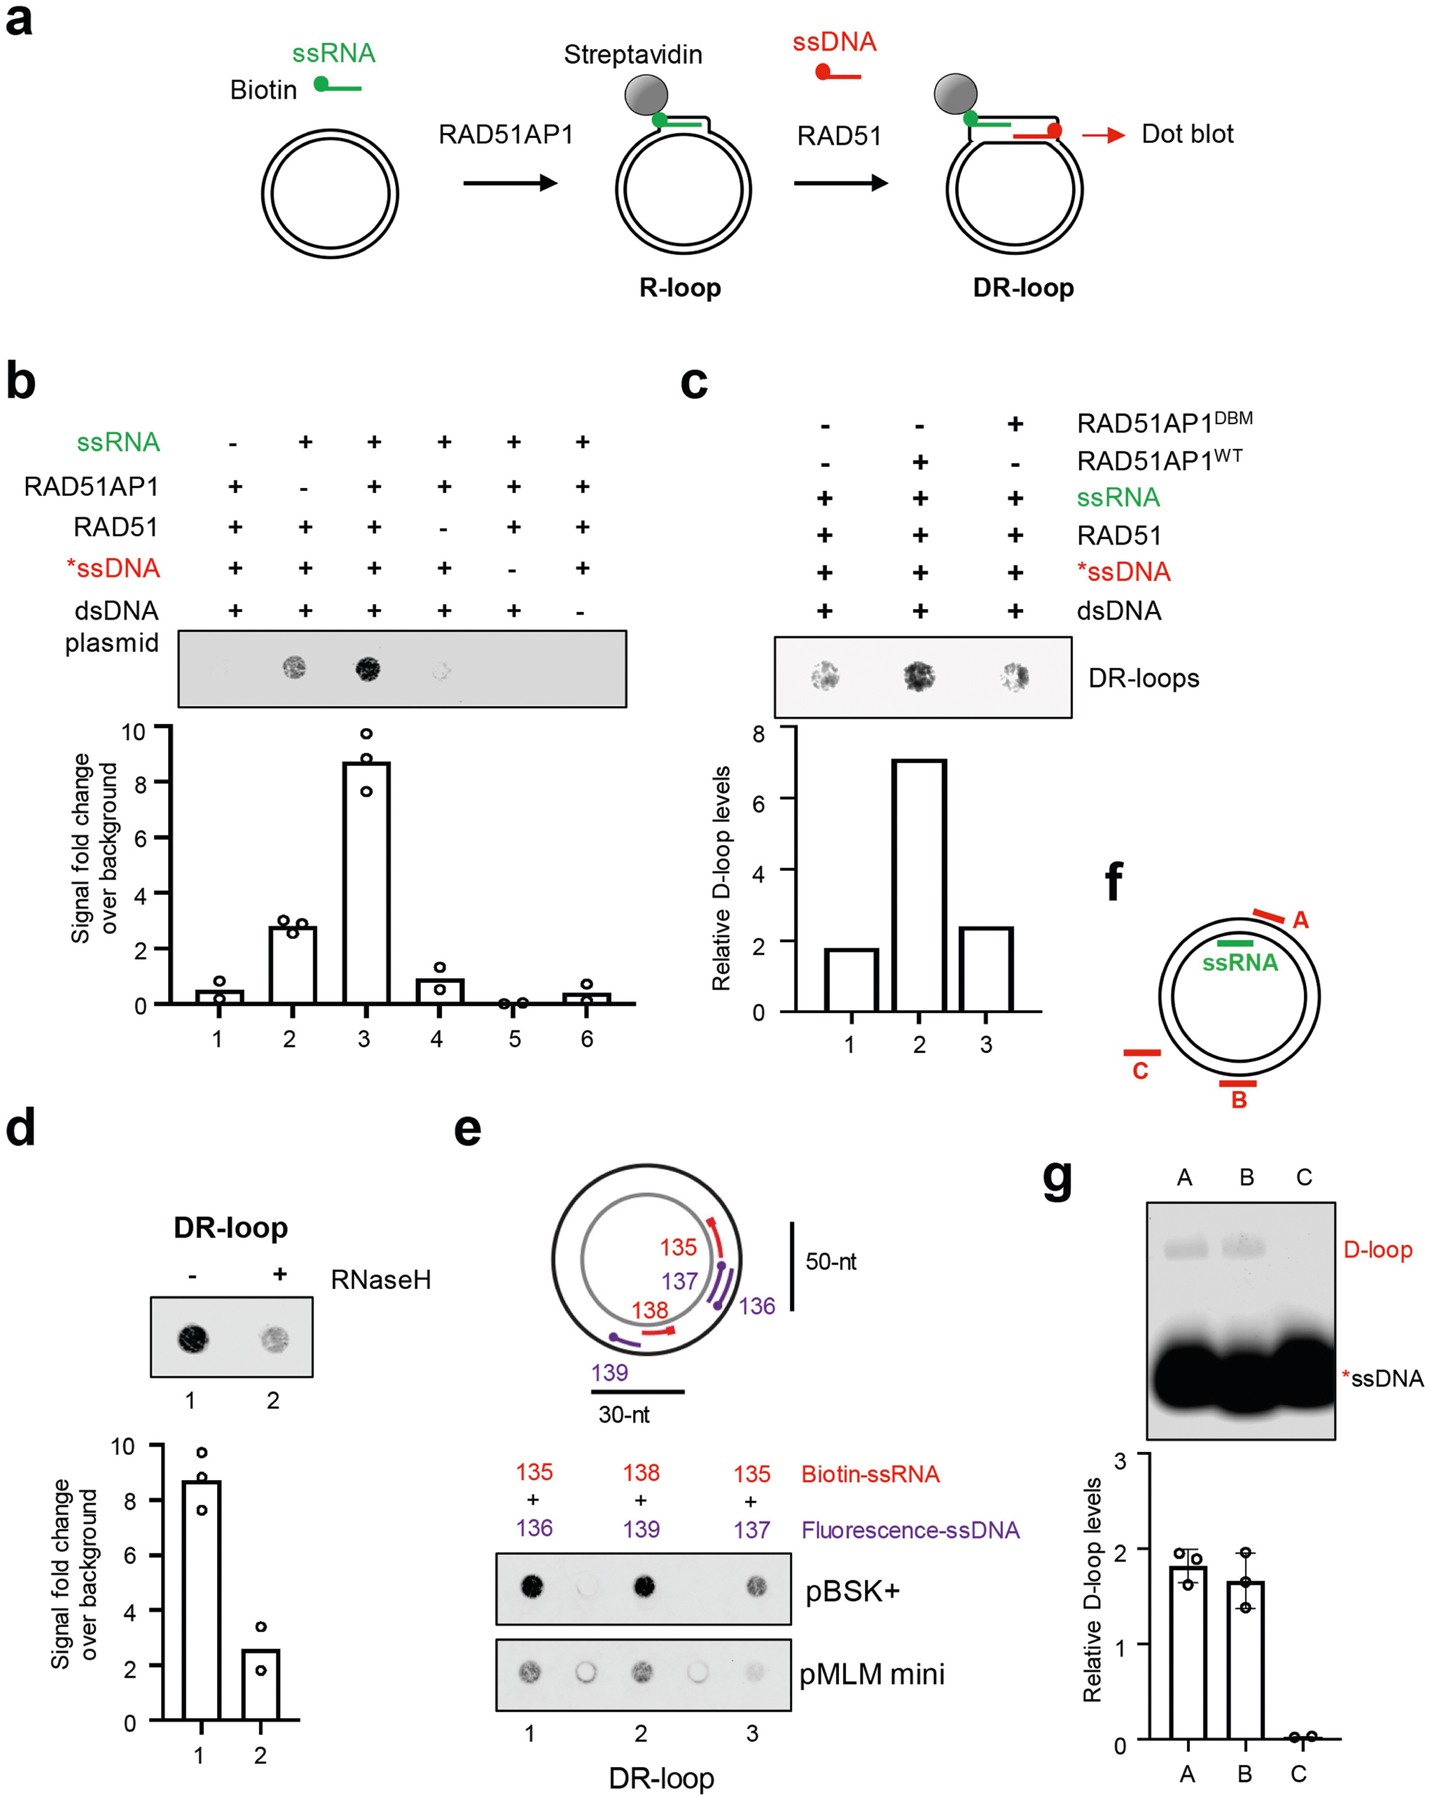
a, Experimental design for in vitro DR-loop formation using biotinylated ssRNA and fluorescently labelled ssDNA. b, In vitro DR-loop formation with biotinylated ssRNA (63 nt, 30 nM), RAD51AP1 (1 μM), RAD51 (0.25 μM), fluorescently labelled ssDNA (60 nt, 20 nM) and a dsDNA plasmid. The presence or absence of the indicated reaction components is shown above the dot blot. The levels of ssDNA captured by biotinylated ssRNA via DR-loops were measured by dot blot and quantified over blot background. Data are mean (n = 2–3 independent experiments). c, In vitro DR-loop formation with biotinylated ssRNA (50 nt, 30 nM), RAD51AP1WT (0.5 μM) or RAD51AP1DBM (0.5 μM), RAD51 (0.25 μM), fluorescently labelled ssDNA (50 nt, 20 nM) and a dsDNA plasmid. The presence or absence of the indicated reaction components is shown above the dot blot. The levels of ssDNA captured by biotinylated ssRNA via DR-loops were measured by dot blot and quantified over blot background. Representative results from two similar experiments are shown. d, In vitro DR-loop confirmation with RNaseH treatment. Data are mean (n = 2–3 independent experiments). e, In vitro DR-loop formation with different ssRNA and ssDNA oligos and dsDNA plasmids. Top, schematic of the ssRNA and ssDNA oligos tested. Red, biotinylated ssRNA; purple, fluorescently labelled ssDNA. The lengths and relative annealing positions of the oligos are indicated. pBSK+ and pMLM-mini are two different dsDNA plasmids that were used in the reactions. Both of them contain sequences homologous to the ssRNA and ssDNA oligos. f, Schematic of the three ssDNA oligos (red) and the ssRNA oligo (green) used in Fig. 5c, d. g, In vitro D-loop formation with RAD51 and ssDNA oligos A–C. RAD51 (0.25 μM) was incubated with labelled 60-nt ssDNA oligos A, B or C (30 nM) and then with a dsDNA plasmid containing sequences homologous to oligos A and B but not C. Formation of D-loops was analysed by native gel electrophoresis. The efficiency of D-loop formation was determined by quantifying the shifted and unshifted bands in a light exposure of the gel. Data are mean ± s.d. (n = 3 independent experiments).
Extended Data Fig. 12 |. Model of the role of DR-loops in HR.
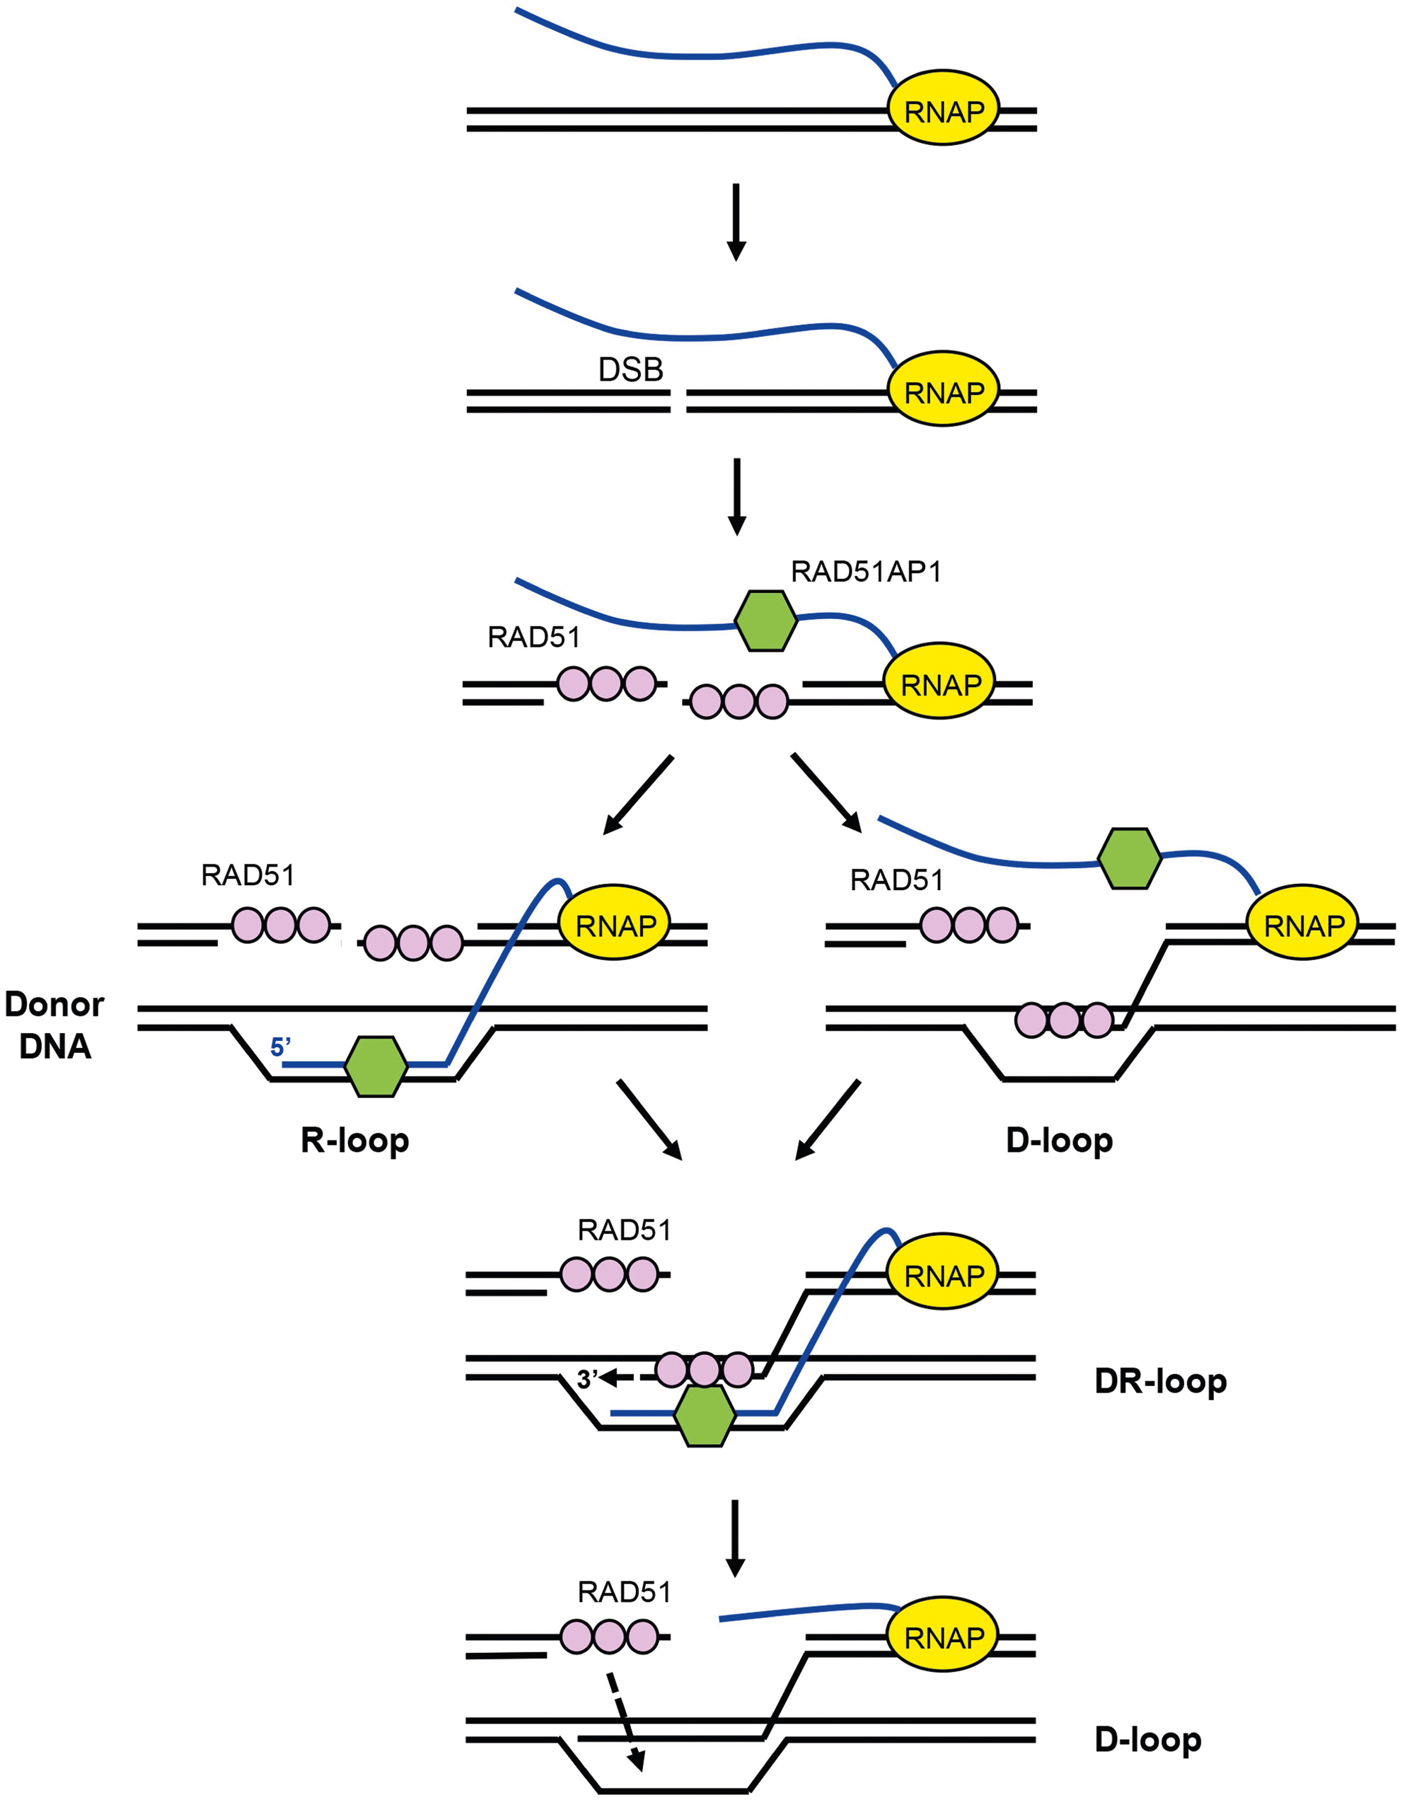
The formation of DSBs in transcribed regions triggers the recruitment of both RAD51 and RAD51AP1. RAD51AP1 may associate with RNA transcripts through direct RNA binding. In S and G2 cells, RAD51AP1 promotes the invasion of RNA transcripts into donor DNA on sister chromatids. The presence of R-loops and RAD51AP1 in donor DNA may facilitate the invasion of RAD51 filaments, stabilize invaded ssDNA, help RAD51 find homologous sequences and promote the extension of ssDNA ends in DR-loops. It is also possible that RNA transcripts anneal with the displaced ssDNA in D-loops, helping to stabilize invaded ssDNA and extend ssDNA ends in DR-loops. The DNA–RNA hybrids in DR-loops are probably removed in a later step to allow the completion of HR.
Supplementary Material
Acknowledgements
We thank P. Sung, G. Legube, J. K. Joung, J. Jin and G. Gill for reagents, and N. Dyson, A. Elia and members of the L.Z. and N. Dyson laboratories for discussions. L.Z. is the James & Patricia Poitras Endowed Chair in Cancer Research. This work is supported by grants from the NIH (CA197779 and CA218856) to L.Z.
Footnotes
Online content
Any methods, additional references, Nature Research reporting summaries, source data, extended data, supplementary information, acknowledgements, peer review information; details of author contributions and competing interests; and statements of data and code availability are available at https://doi.org/10.1038/s41586-021-03538-7.
Competing interests The authors declare no competing interests.
Supplementary information The online version contains supplementary material available at https://doi.org/10.1038/s41586-021-03538-8.
Data availability
All relevant data are included in the Article and/or Supplementary Figs. 1, 2.
References
- 1.Prakash R, Zhang Y, Feng W & Jasin M Homologous recombination and human health: the roles of BRCA1, BRCA2, and associated proteins. Cold Spring Harb. Perspect. Biol 7, a016600 (2015). [DOI] [PMC free article] [PubMed] [Google Scholar]
- 2.Heyer WD, Ehmsen KT & Liu J Regulation of homologous recombination in eukaryotes. Annu. Rev. Genet 44, 113–139 (2010). [DOI] [PMC free article] [PubMed] [Google Scholar]
- 3.Daley JM, Gaines WA, Kwon Y & Sung P Regulation of DNA pairing in homologous recombination. Cold Spring Harb. Perspect. Biol 6, a017954 (2014). [DOI] [PMC free article] [PubMed] [Google Scholar]
- 4.Marnef A, Cohen S & Legube G Transcription-coupled DNA double-strand break repair: active genes need special care. J. Mol. Biol 429, 1277–1288 (2017). [DOI] [PubMed] [Google Scholar]
- 5.Ouyang J, Lan L & Zou L Regulation of DNA break repair by transcription and RNA. Sci. China Life Sci 60, 1081–1086 (2017). [DOI] [PMC free article] [PubMed] [Google Scholar]
- 6.Tang J et al. Acetylation limits 53BP1 association with damaged chromatin to promote homologous recombination. Nat. Struct. Mol. Biol 20, 317–325 (2013). [DOI] [PMC free article] [PubMed] [Google Scholar]
- 7.Aymard F et al. Transcriptionally active chromatin recruits homologous recombination at DNA double-strand breaks. Nat. Struct. Mol. Biol 21, 366–374 (2014). [DOI] [PMC free article] [PubMed] [Google Scholar]
- 8.Wei L et al. DNA damage during the G0/G1 phase triggers RNA-templated, Cockayne syndrome B-dependent homologous recombination. Proc. Natl Acad. Sci. USA 112, E3495–E3504 (2015). [DOI] [PMC free article] [PubMed] [Google Scholar]
- 9.Teng Y et al. ROS-induced R loops trigger a transcription-coupled but BRCA1/2-independent homologous recombination pathway through CSB. Nat. Commun 9, 4115 (2018). [DOI] [PMC free article] [PubMed] [Google Scholar]
- 10.Chen H et al. m5C modification of mRNA serves a DNA damage code to promote homologous recombination. Nat. Commun 11, 2834 (2020). [DOI] [PMC free article] [PubMed] [Google Scholar]
- 11.Pierce AJ, Johnson RD, Thompson LH & Jasin M XRCC3 promotes homology-directed repair of DNA damage in mammalian cells. Genes Dev. 13, 2633–2638 (1999). [DOI] [PMC free article] [PubMed] [Google Scholar]
- 12.Zetsche B et al. Cpf1 is a single RNA-guided endonuclease of a class 2 CRISPR–Cas system. Cell 163, 759–771 (2015). [DOI] [PMC free article] [PubMed] [Google Scholar]
- 13.Pinder J, Salsman J & Dellaire G Nuclear domain ‘knock-in’ screen for the evaluation and identification of small molecule enhancers of CRISPR-based genome editing. Nucleic Acids Res. 43, 9379–9392 (2015). [DOI] [PMC free article] [PubMed] [Google Scholar]
- 14.Chavez A et al. Highly efficient Cas9-mediated transcriptional programming. Nat. Methods 12, 326–328 (2015). [DOI] [PMC free article] [PubMed] [Google Scholar]
- 15.Modesti M et al. RAD51AP1 is a structure-specific DNA binding protein that stimulates joint molecule formation during RAD51-mediated homologous recombination. Mol. Cell 28, 468–481 (2007). [DOI] [PubMed] [Google Scholar]
- 16.Wiese C et al. Promotion of homologous recombination and genomic stability by RAD51AP1 via RAD51 recombinase enhancement. Mol. Cell 28, 482–490 (2007). [DOI] [PMC free article] [PubMed] [Google Scholar]
- 17.Liang F et al. Promotion of RAD51-mediated homologous DNA pairing by the RAD51AP1–UAF1 complex. Cell Rep. 15, 2118–2126 (2016). [DOI] [PMC free article] [PubMed] [Google Scholar]
- 18.Kovalenko OV, Golub EI, Bray-Ward P, Ward DC & Radding CM A novel nucleic acid-binding protein that interacts with human rad51 recombinase. Nucleic Acids Res. 25, 4946–4953 (1997). [DOI] [PMC free article] [PubMed] [Google Scholar]
- 19.Dunlop MH et al. Mechanistic insights into RAD51-associated protein 1 (RAD51AP1) action in homologous DNA repair. J. Biol. Chem 287, 12343–12347 (2012). [DOI] [PMC free article] [PubMed] [Google Scholar]
- 20.Taylor SC, Laperriere G & Germain H Droplet digital PCR versus qPCR for gene expression analysis with low abundant targets: from variable nonsense to publication quality data. Sci. Rep 7, 2409 (2017). [DOI] [PMC free article] [PubMed] [Google Scholar]
- 21.Francia S et al. Site-specific DICER and DROSHA RNA products control the DNA-damage response. Nature 488, 231–235 (2012). [DOI] [PMC free article] [PubMed] [Google Scholar]
- 22.Wei W et al. A role for small RNAs in DNA double-strand break repair. Cell 149, 101–112 (2012). [DOI] [PubMed] [Google Scholar]
- 23.Michelini F et al. Damage-induced lncRNAs control the DNA damage response through interaction with DDRNAs at individual double-strand breaks. Nat. Cell Biol 19, 1400–1411 (2017). [DOI] [PMC free article] [PubMed] [Google Scholar]
- 24.Sharma S et al. MRE11-RAD50-NBS1 complex is sufficient to promote transcription by RNA polymerase II at double-strand breaks by melting DNA ends. Cell Rep. 34, 108565 (2021). [DOI] [PMC free article] [PubMed] [Google Scholar]
- 25.Petukhova G, Sung P & Klein H Promotion of Rad51-dependent D-loop formation by yeast recombination factor Rdh54/Tid1. Genes Dev. 14, 2206–2215 (2000). [DOI] [PMC free article] [PubMed] [Google Scholar]
- 26.Van Komen S, Petukhova G, Sigurdsson S, Stratton S & Sung P Superhelicity-driven homologous DNA pairing by yeast recombination factors Rad51 and Rad54. Mol. Cell 6, 563–572 (2000). [DOI] [PubMed] [Google Scholar]
- 27.Benson FE, Stasiak A & West SC Purification and characterization of the human Rad51 protein, an analogue of E. coli RecA. EMBO J. 13, 5764–5771 (1994). [DOI] [PMC free article] [PubMed] [Google Scholar]
- 28.Keskin H et al. Transcript-RNA-templated DNA recombination and repair. Nature 515, 436–439 (2014). [DOI] [PMC free article] [PubMed] [Google Scholar]
- 29.Mazina OM, Keskin H, Hanamshet K, Storici F & Mazin AV Rad52 inverse strand exchange drives RNA-templated DNA double-strand break repair. Mol. Cell 67, 19–29.e3 (2017). [DOI] [PMC free article] [PubMed] [Google Scholar]
- 30.Meers C et al. Genetic characterization of three distinct mechanisms supporting RNA-driven DNA repair and modification reveals major role of DNA polymerase ζ. Mol. Cell 79, 1037–1050 (2020). [DOI] [PMC free article] [PubMed] [Google Scholar]
- 31.Yasuhara T et al. Human Rad52 promotes XPG-mediated R-loop processing to initiate transcription-associated homologous recombination repair. Cell 175, 558–570 (2018). [DOI] [PubMed] [Google Scholar]
- 32.McDevitt S, Rusanov T, Kent T, Chandramouly G & Pomerantz RT How RNA transcripts coordinate DNA recombination and repair. Nat. Commun 9, 1091 (2018). [DOI] [PMC free article] [PubMed] [Google Scholar]
- 33.Hatchi E et al. BRCA1 and RNAi factors promote repair mediated by small RNAs and PALB2–RAD52. Nature 591, 665–670 (2021). [DOI] [PMC free article] [PubMed] [Google Scholar]
- 34.D’Alessandro G et al. BRCA2 controls DNA:RNA hybrid level at DSBs by mediating RNase H2 recruitment. Nat. Commun 9, 5376 (2018). [DOI] [PMC free article] [PubMed] [Google Scholar]
- 35.Shanbhag NM, Rafalska-Metcalf IU, Balane-Bolivar C, Janicki SM & Greenberg RA ATM-dependent chromatin changes silence transcription in cis to DNA double-strand breaks. Cell 141, 970–981 (2010). [DOI] [PMC free article] [PubMed] [Google Scholar]
- 36.Greene EC DNA sequence alignment during homologous recombination. J. Biol. Chem 291, 11572–11580 (2016). [DOI] [PMC free article] [PubMed] [Google Scholar]
- 37.Baumann P, Benson FE & West SC Human Rad51 protein promotes ATP-dependent homologous pairing and strand transfer reactions in vitro. Cell 87, 757–766 (1996). [DOI] [PubMed] [Google Scholar]
- 38.Cohen S et al. Senataxin resolves RNA:DNA hybrids forming at DNA double-strand breaks to prevent translocations. Nat. Commun 9, 533 (2018). [DOI] [PMC free article] [PubMed] [Google Scholar]
- 39.Ohle C et al. Transient RNA–DNA hybrids are required for efficient double-strand break repair. Cell 167, 1001–1013 (2016). [DOI] [PubMed] [Google Scholar]
- 40.O’Connor MJ Targeting the DNA damage response in cancer. Mol. Cell 60, 547–560 (2015). [DOI] [PubMed] [Google Scholar]
- 41.Ouyang J et al. Noncovalent interactions with SUMO and ubiquitin orchestrate distinct functions of the SLX4 complex in genome maintenance. Mol. Cell 57, 108–122 (2015). [DOI] [PMC free article] [PubMed] [Google Scholar]
- 42.Meerbrey KL et al. The pINDUCER lentiviral toolkit for inducible RNA interference in vitro and in vivo. Proc. Natl Acad. Sci. USA 108, 3665–3670 (2011). [DOI] [PMC free article] [PubMed] [Google Scholar]
- 43.Chailleux C et al. Quantifying DNA double-strand breaks induced by site-specific endonucleases in living cells by ligation-mediated purification. Nat. Protocols 9, 517–528 (2014). [DOI] [PubMed] [Google Scholar]
- 44.Kleinstiver BP et al. Engineered CRISPR–Cas12a variants with increased activities and improved targeting ranges for gene, epigenetic and base editing. Nat. Biotechnol 37, 276–282 (2019). [DOI] [PMC free article] [PubMed] [Google Scholar]
- 45.Tumini E & Aguilera A The sister-chromatid exchange assay in human cells. Methods Mol. Biol 2153, 383–393 (2021). [DOI] [PubMed] [Google Scholar]
- 46.Moquin DM et al. Localized protein biotinylation at DNA damage sites identifies ZPET, a repressor of homologous recombination. Genes Dev. 33, 75–89 (2019). [DOI] [PMC free article] [PubMed] [Google Scholar]
- 47.Nguyen HD et al. Functions of replication protein A as a sensor of R loops and a regulator of RNaseH1. Mol. Cell 65, 832–847.e4 (2017). [DOI] [PMC free article] [PubMed] [Google Scholar]
Associated Data
This section collects any data citations, data availability statements, or supplementary materials included in this article.
Supplementary Materials
Data Availability Statement
All relevant data are included in the Article and/or Supplementary Figs. 1, 2.


